Major global weather dynamics are on the move again, creating a special winter weather pattern for the rest of the month. As the polar vortex battles with a warming in the stratosphere, a strong wave disturbance emerges in the tropics, that will set up a unique blocked pattern over the Northern Hemisphere.
In reality, this is not as complicated as it may sound. These are very strong weather drivers at work, that command the weather patterns each winter season.
First, we will look at these weather drivers in a very simplified manner, which will unveil how they work each in their unique way to create our everyday weather. You will be able to quickly learn some of the “behind the scenes” of winter weather patterns in the Northern hemisphere.
We will then look at the weather forecast for the rest of December 2021 and the early Christmas trends. Also, we will take a peek at the long-term forecast for the start of 2022 and the rest of the Winter Season.
TRIPLE CROWN OF WINTER WEATHER
The meteorological winter season lasts for 3 months, starting on December 1st, covering the months of December, January, and February. When we look at the seasonal forecasts for winter, we always look at the large-scale climate drivers. That has obviously been the La Nina in the tropical Pacific Ocean.
But as we get into the actual winter season, we tend to look more at the short-term variability. Besides the La Nina which we will also cover shortly below, we have two other drivers of the global weather. They are the famous Polar Vortex and the less known Madden-Julian Oscillation, known simply as MJO.
Together, all three form the “triple crown” of winter weather, influencing our weather on different scales, all working in their own right. We will first look at the shorter-term Polar Vortex and the MJO, and lastly at the large-scale La Nina influence.
POLAR VORTEX
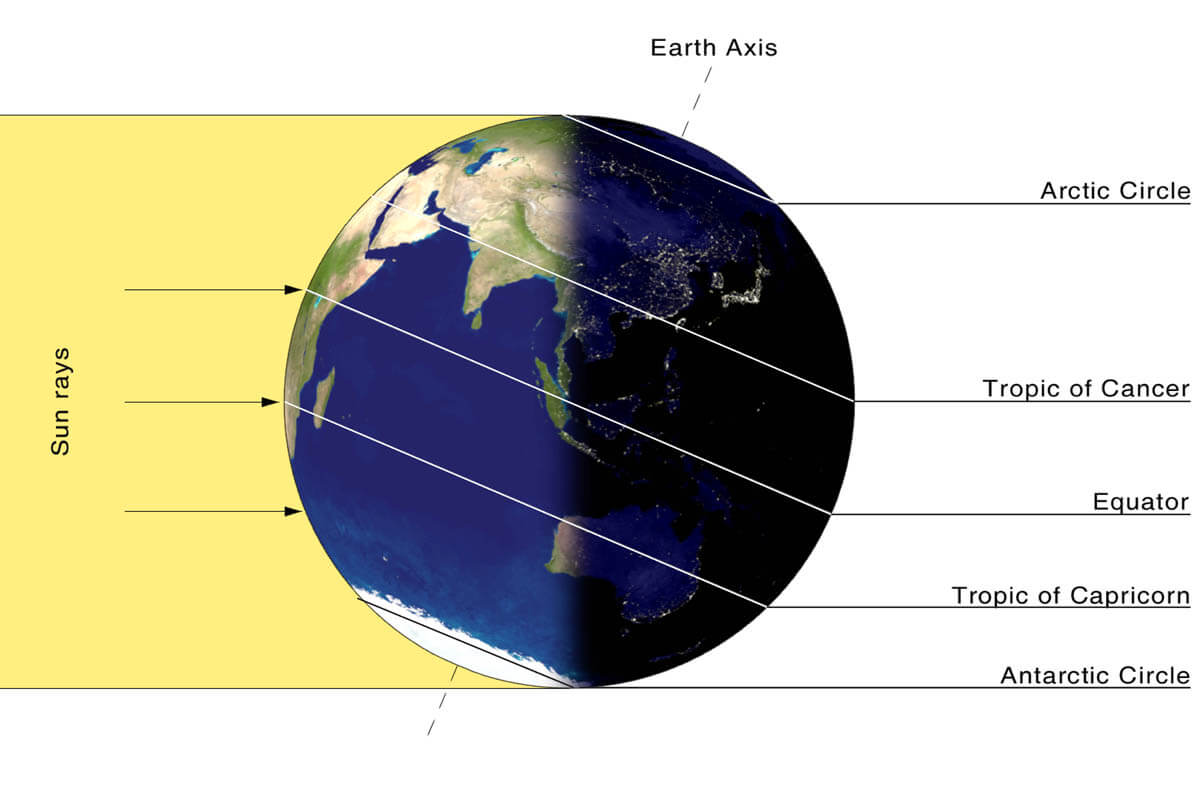
Every year as we head into autumn, the polar regions start to receive much less sunlight. This means that the north pole starts to cool down. But as the polar regions cool, the atmosphere further south is still relatively warm as it continues to receive energy from the Sun. You can see the winter solstice on the image below when the polar regions receive little to zero solar energy, compared to regions further south.
As the temperature drops over the polar regions, so does the pressure. As the temperature drops over the pole and the temperature difference towards the south increases, a large low-pressure (cyclonic) circulation start to develop across the Northern Hemisphere from the surface layers, far up into the stratosphere. This is known as the Polar Vortex.
While the stratospheric polar vortex is spinning high above our weather, it is still directly connected to the lower part and can shape our daily weather in one way or another, as one large hemispheric circulation.
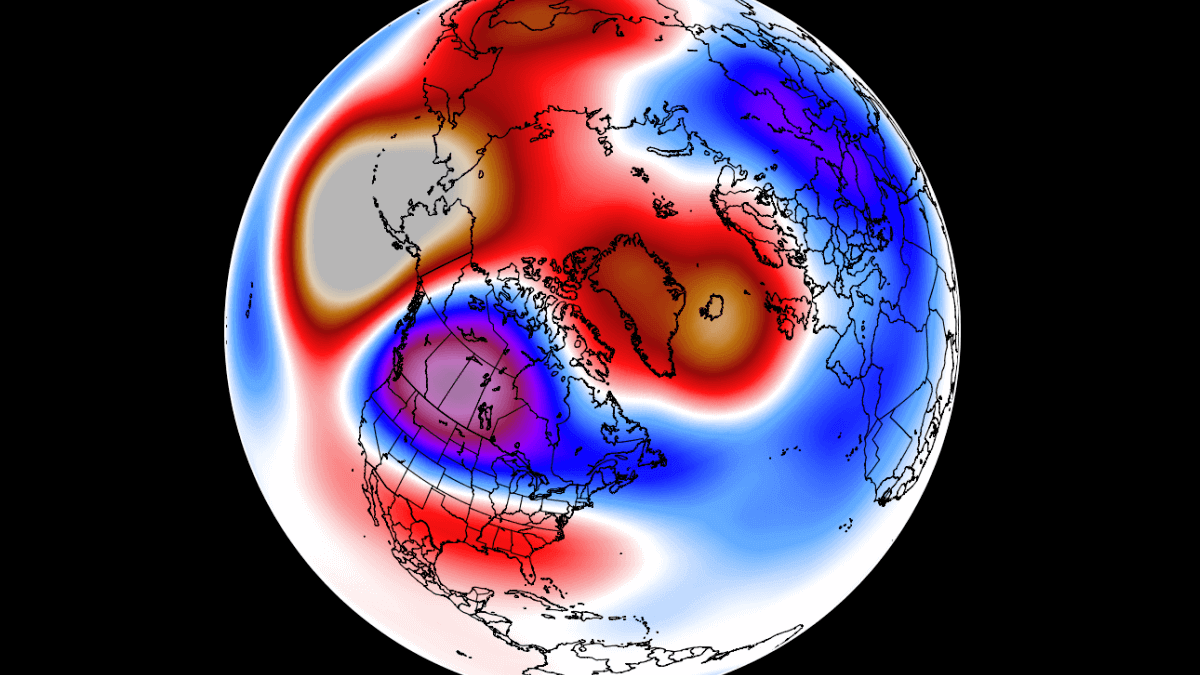
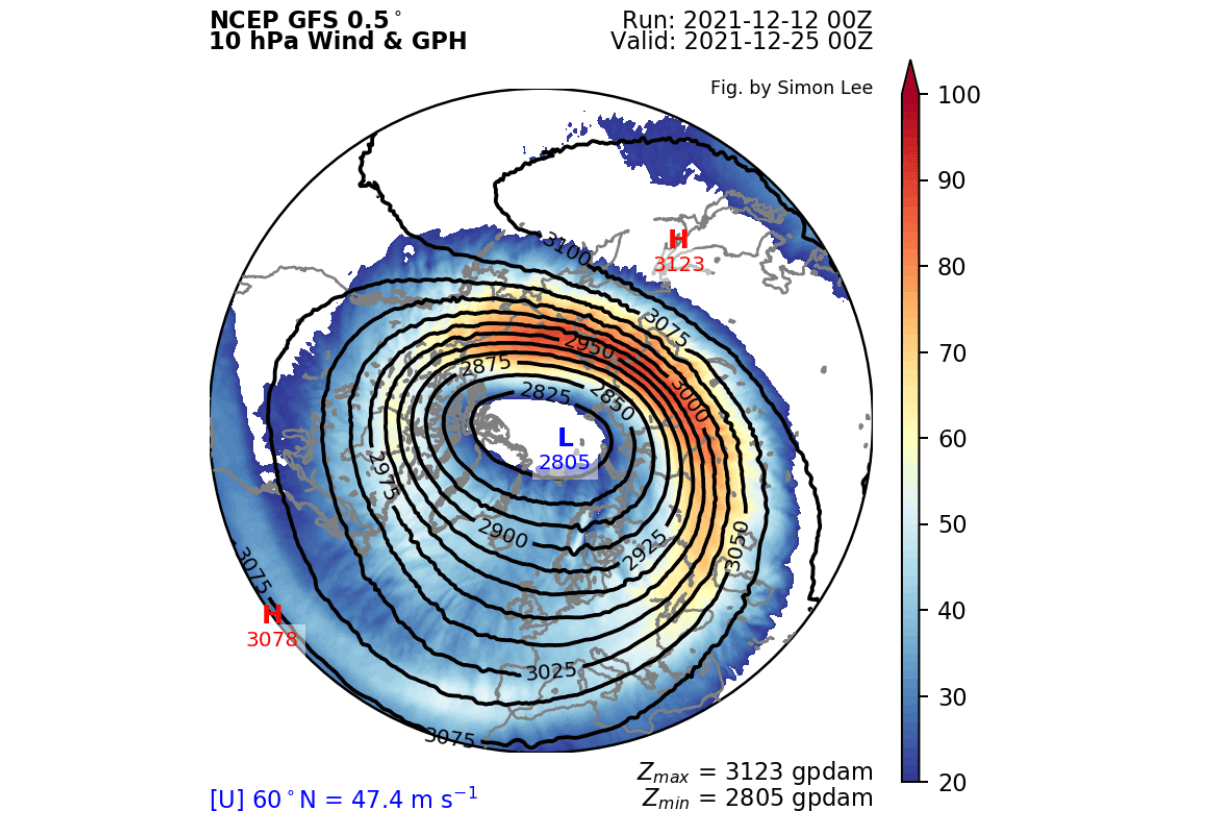
The image below shows a typical example of the Polar Vortex at around 30km/18.5miles altitude (10mb level) near the top of the stratosphere during the winter season.

It is basically like a very large cyclone, covering the whole north pole, down to the mid-latitudes. It is strongly present at all levels, from the ground up, but can have quite a different shape at different altitudes.
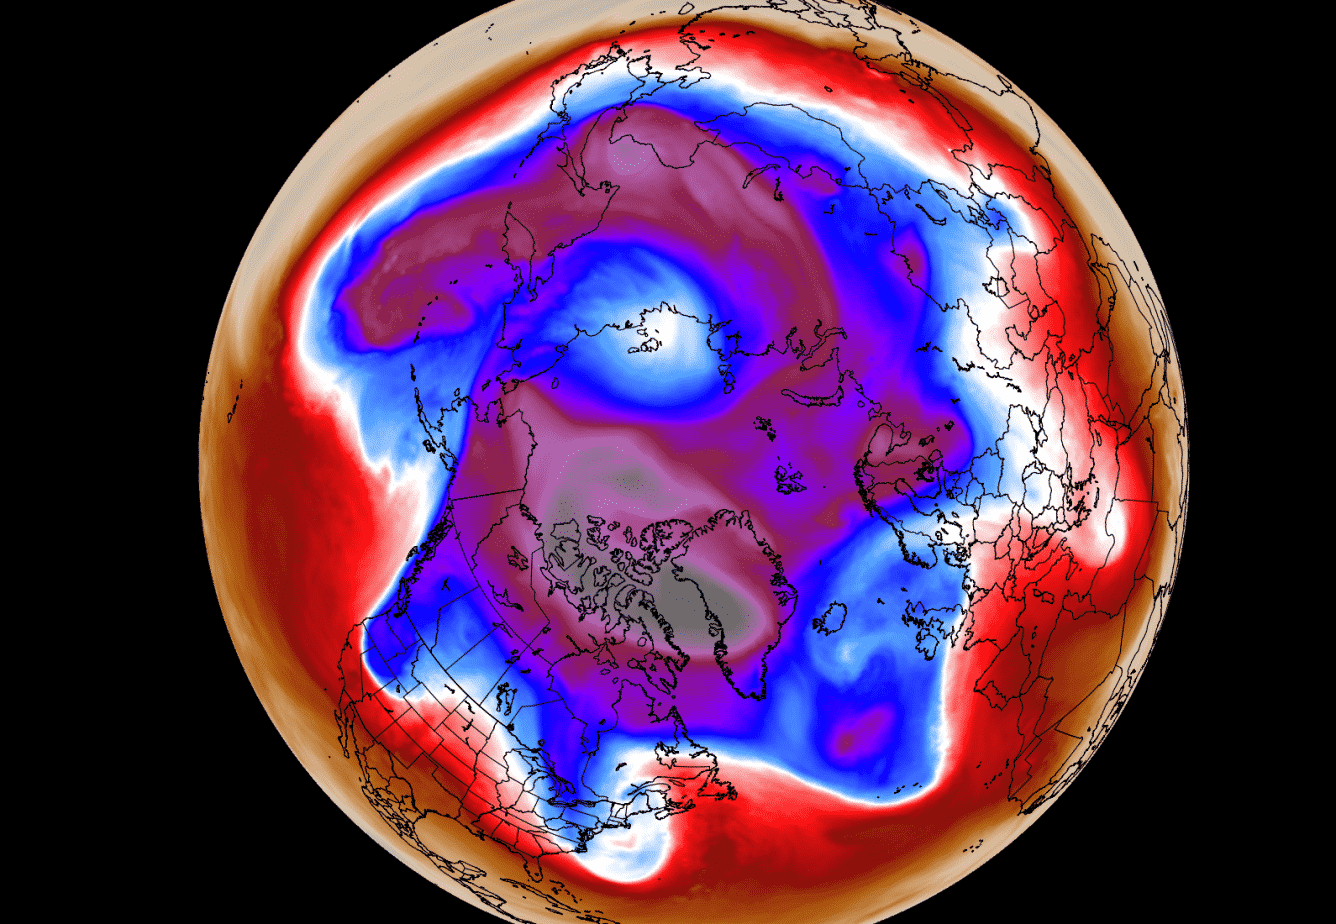
The next image below will show you the polar vortex at a much lower altitude, around 5km/3miles. It reveals the true shape and size of the polar vortex closer to the ground (cold colors). The closer to the ground we go, the more deformed the polar vortex gets, because of the increased terrain/ground influence and the dynamics from many weather fronts and systems.
Be aware of its “arms” extending into the lower latitudes, bringing along colder air and snowfall into the mid-latitudes. These arms also pack a lot of energy and can create strong winter storms, either Noreasters in the United States or powerful wind storms in the North Atlantic.
We are currently focusing mostly on the Stratospheric Polar Vortex, as it plays a very important role in the weather development throughout the season. It is known for its strong influence down from the stratosphere, in either direction, for a cold or warm winter.
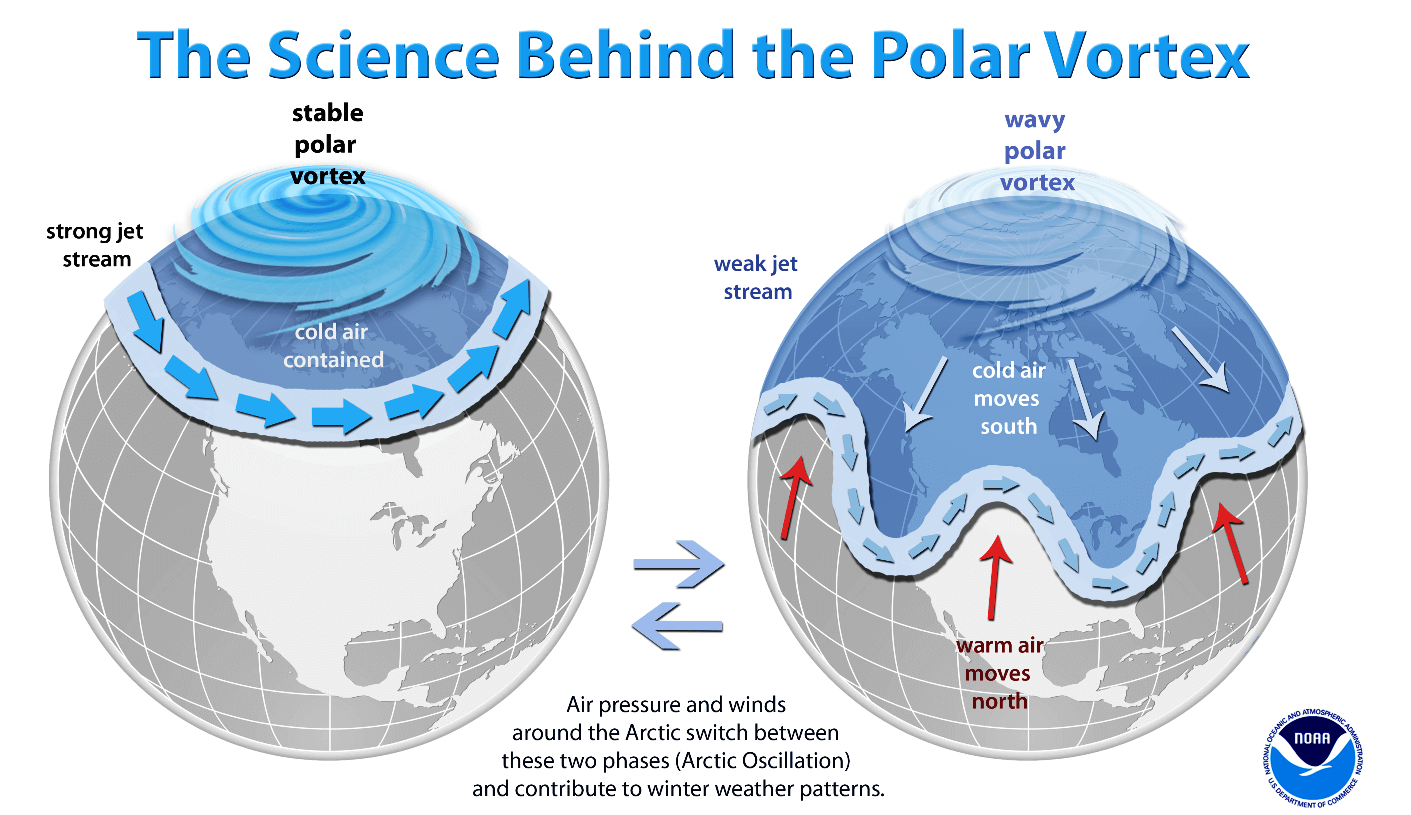
A strong polar vortex usually means strong polar circulation even in the lower levels. This can usually lock the cold air into the Polar regions, creating milder winters for most of the United States and Europe. On the other hand, a Polar Vortex collapse is just as dynamic as it sounds, as the higher pressure comes crashing from the stratosphere to the surface, releasing the colder air out of the polar regions, into the United States and/or Europe. Image by NOAA.
Typically, a polar vortex circulation collapses due to a rise in temperature in pressure in the stratosphere. That is called a Sudden Stratospheric Warming (SSW) event. And as the name suggests, it is a sudden rise in temperatures in the stratosphere.
But there can also be smaller warming waves in the stratosphere, that do not collapse the polar vortex. Instead, they can sometimes displace or disrupt the polar vortex enough to weaken its influence on the surface levels. That can allow other factors to take over and create a different weather pattern.
Below we have a video that shows the temperature forecast for the stratospheric polar vortex at the 10mb level (30km/18.5miles altitude). It shows a strong cold-core, but a warming wave is starting to appear in the forecast, initiating over the typical region of Siberia and East Asia.
The warming is set to start around the 19th, reaching a peak around Christmas time. Below we have a temperature forecast for the middle stratosphere. It shows the cold-core of the polar vortex and the warming wave over Siberia and east Asia.

This warming wave will be associated with a high-pressure area building in that region, slightly displacing the polar vortex, and compressing it. Notice on the next image below how the high-pressure area in the stratosphere develops over east Asia, pressing against the Polar Vortex.
Now, how is this important? Well, every disruption in either a warming or a pressure wave in the stratosphere can mean a change in dynamics. In this case, it can try to limit the influence from an otherwise strong polar vortex in the stratosphere.
As far as the stratosphere and weather connection goes, there is a special graphic that puts that into a perspective. We can look at the pressure development from the surface up into the stratosphere over time.
The next image shows that nicely, revealing the strong polar vortex in the forecast, pushing down from the stratosphere. But the influence is not really reaching down to the surface directly, as strong high-pressure systems in the lower levels fight back.
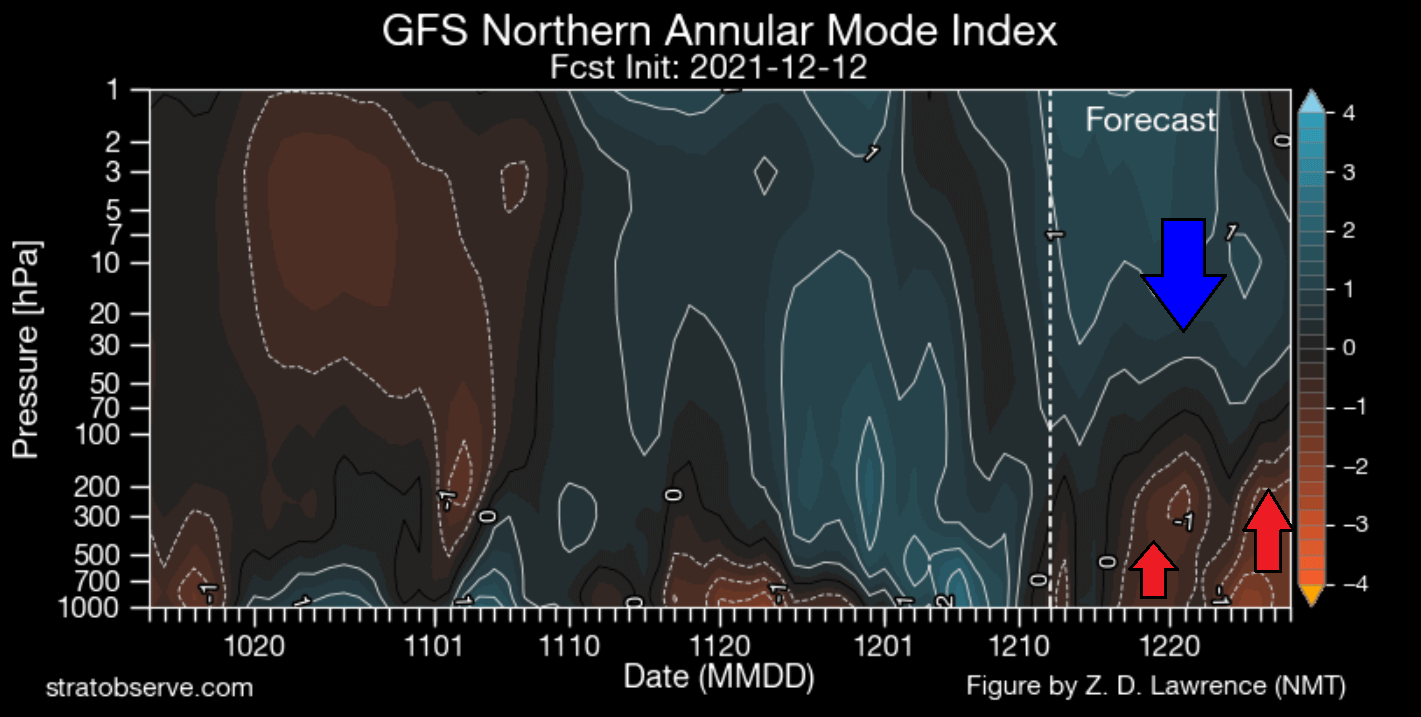
If there weren’t a warming wave with a potential displacement, the polar vortex dynamics might have played out differently. We could be seeing a stronger influence from the top down. So this is the first “crown” that falls into place for a more dynamic weather pattern over the Northern Hemisphere.
Basically, this allows the other factors to have more influence than they might otherwise have, “unlocking” their importance in the grand scheme of weather patterns across the Northern Hemisphere.
MADDEN-JULIAN OSCILLATION
We are now going from the stratosphere down into the tropics. A lot of the tropical variability is driven by invisible wave-like features in the atmosphere. The largest and most dominant source of short-term tropical variability is the Madden-Julian Oscillation wave, known simply as MJO.
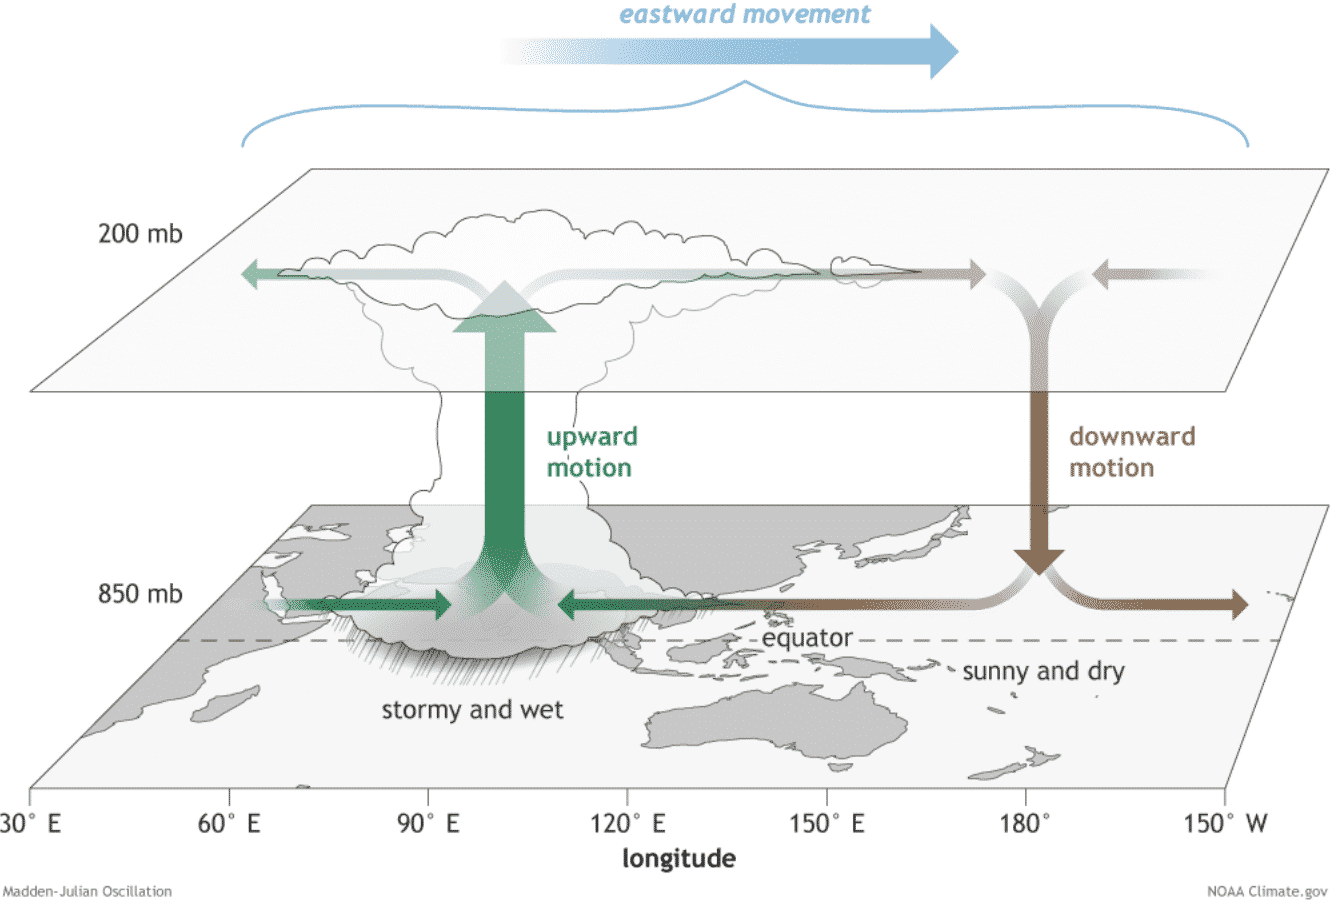
But what is this MJO wave? This is an eastward moving disturbance (wave) of thunderstorms, clouds, rain, winds, and pressure changes. It moves around the entire planet on the equator in about 30 to 60 days.
It also has the power to influence the weather patterns further north over the North Hemisphere, as there is a strong connection between the tropics and the global weather.
The MJO consists of two parts: one is the enhanced rainfall (wet) phase and the other is the suppressed rainfall (dry) phase. The graphic below from NOAA Climate shows the basic pattern of this wave. We have increased storms and rainfall (lower pressure) on one side and reduced storms and drier weather (higher pressure) on the other side. Image by NOAA Climate.
The image below shows exactly that. It shows the precipitation anomalies in the tropics. Green and blue colors show more precipitation and storms, and brown colors show less precipitation and higher pressure. We can observe how this MJO wave moves across the tropics.

It is important to note how this wave is consistent enough to be arranged into phases. Each has its own influence on the weather, which is why we need to keep track of how it is moving around the globe. The pressure changes it brings along can affect one region of the world more directly, thus also hawing down/upstream effects on the rest of the global weather.
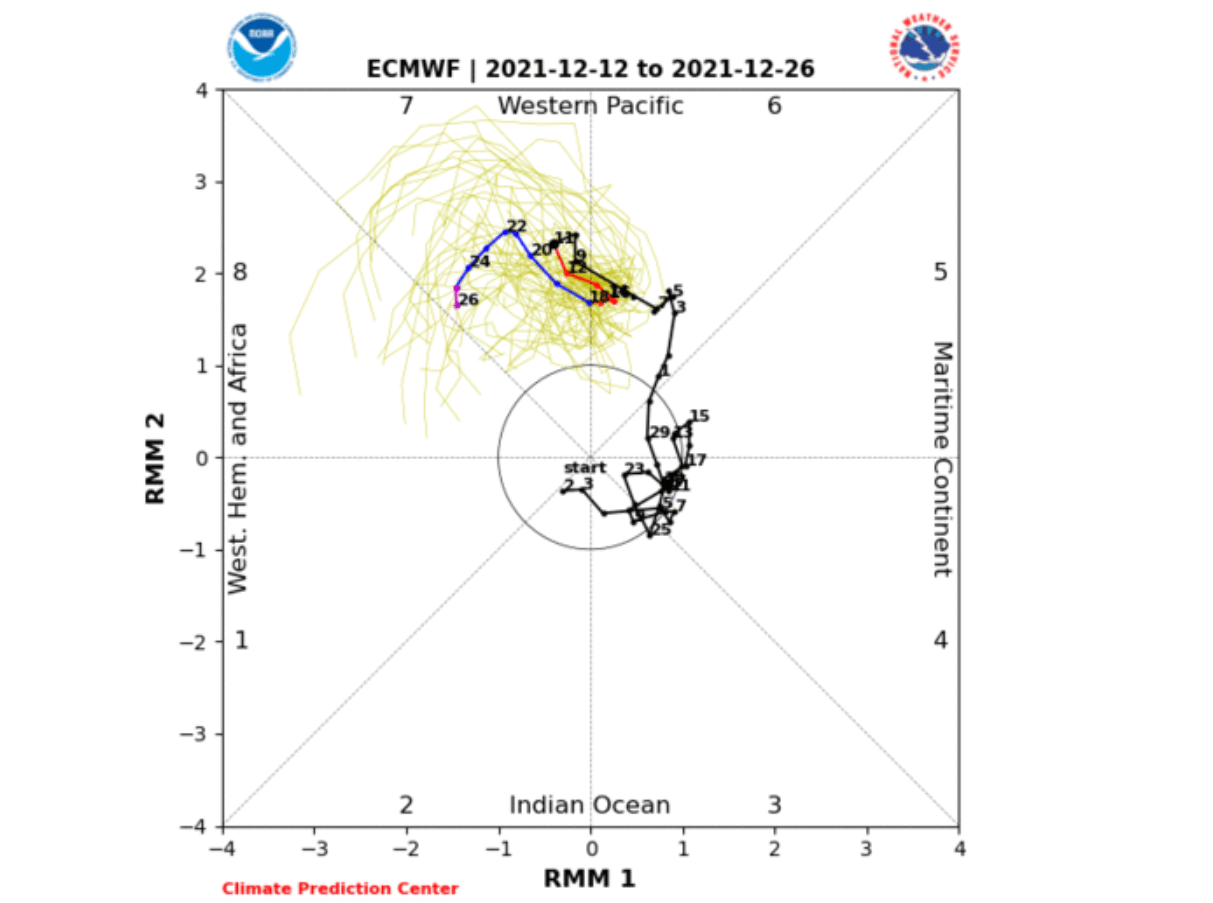
The current forecast below from ECMWF shows it to stay mostly in Phase 7 for most of the remainder of the month. We will look below how a typical phase 7 influence looks like on the temperature and pressure across the world.
Below we have a composite of phase 7 in December, showing the average pressure pattern for this phase. We can see right away, that there are two main high-pressure systems. One is in the North Pacific and the Aleutians and one over Scandinavia and northwestern Europe.
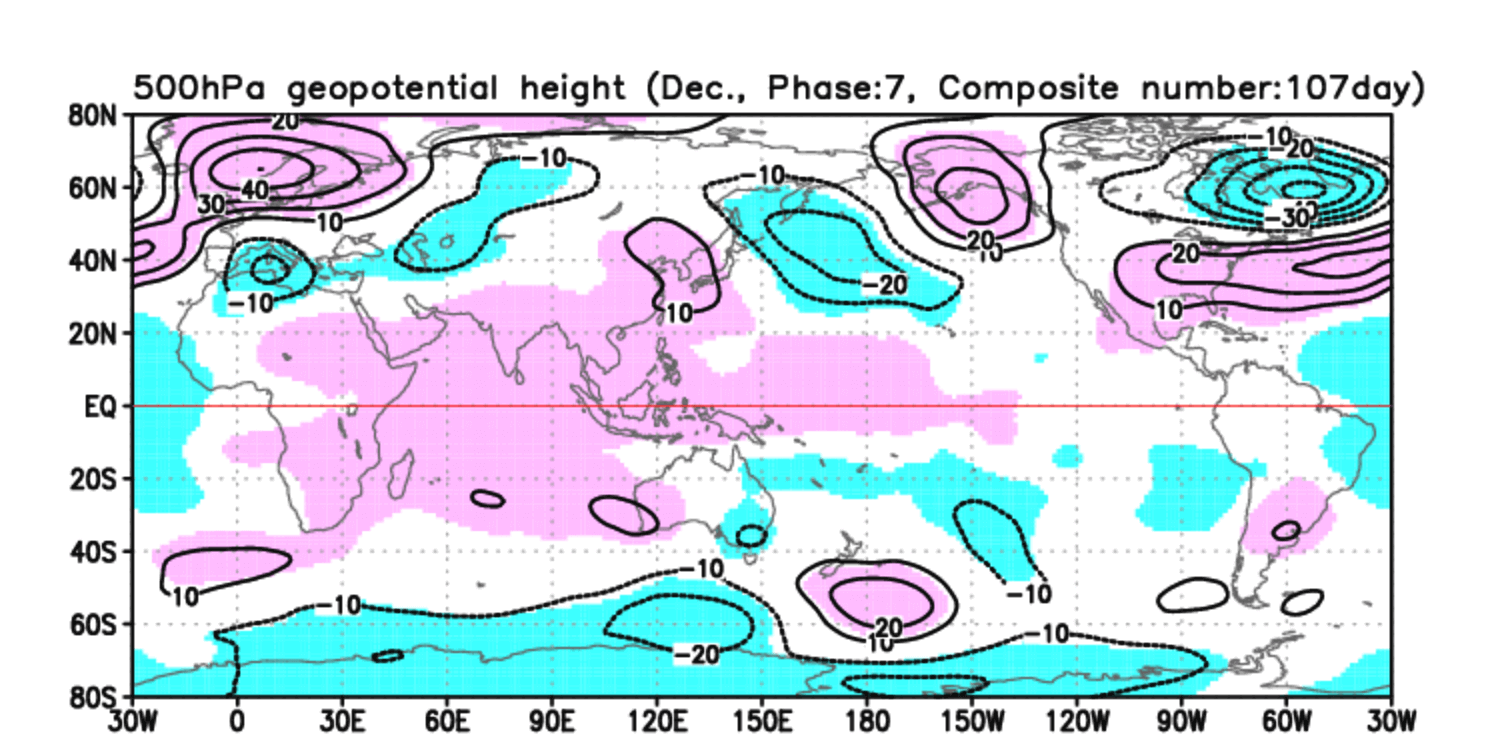
This means lowered pressure over Canada, bringing the jet stream down close to the northern United States. Over Europe, this enables lowered pressure over central and southern regions and opens the door to the cold from the east.
Speaking of temperatures, below we have the same composite image, but for temperatures. it is perhaps harder to see due to the contour lines, but we have colder temperatures over Canada and the northern part s of the United States. Over Europe, we can notice the transport of colder air from the east/northeast.
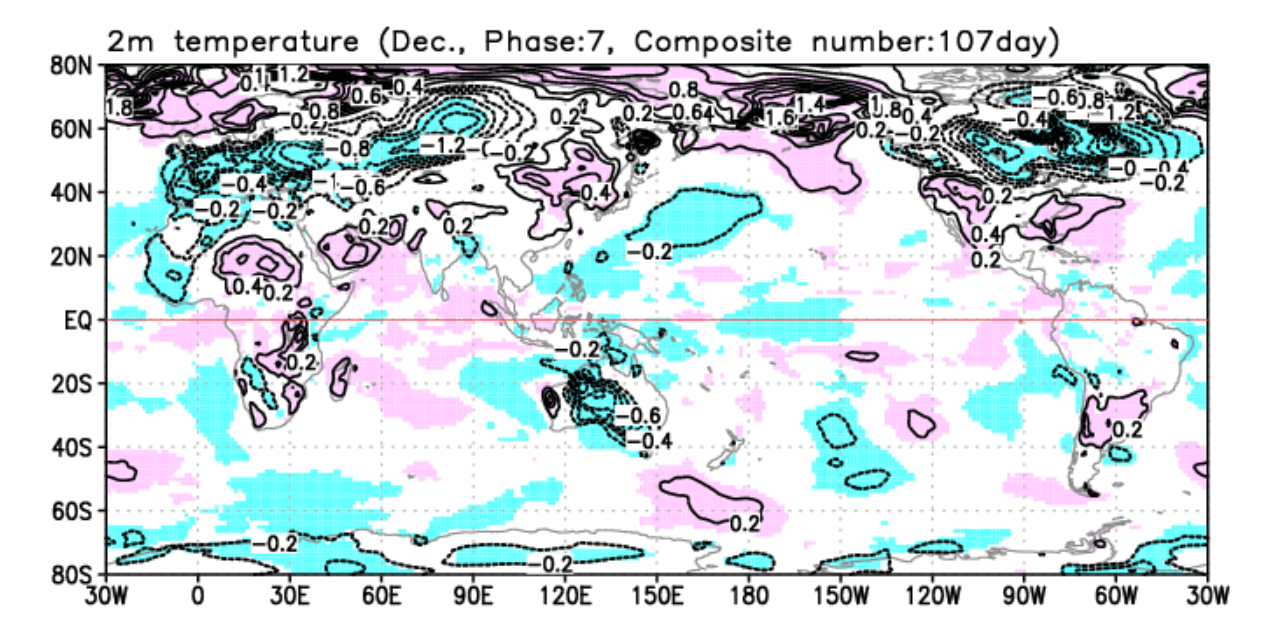
This is the image that we will be looking for in the main part of the article below, which is the weather forecast for the rest of December. The forecast above for the MJO shows a strong signal for phase 7, so we should be seeing some of this reflected in the weather patterns.
We are now going from the atmosphere down into the Ocean. We will look at the famous large-scale, long-term, climate influencer that is setting the main playing field for the winter season 2021/2022. It is the ENSO in the tropical Pacific Ocean, which we have talked about before.
ENSO – LA NINA
Keeping it simple, ENSO is short for “El Niño Southern Oscillation”. This is a region in the tropical Pacific ocean. It is always changing between a warm and cold phase, called El Nino and La Nina, respectfully.
ENSO has a major impact on the tropical convection patterns (storms) and the complex interaction between the ocean and the atmosphere. We can observe long-term pressure changes in the tropics as ENSO switches between warm and cold phases. With some delay, these changes affect the circulation over the rest of the world.
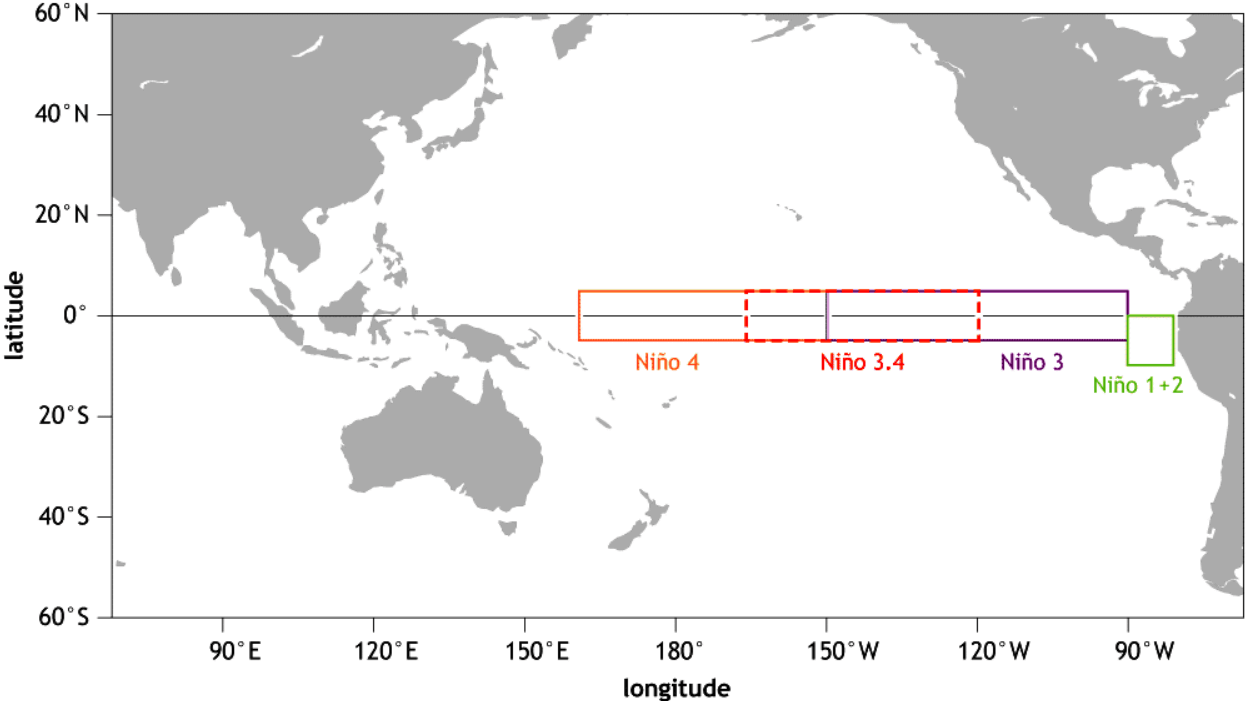
The image below shows the ENSO regions in the tropical Pacific. Most analysis and forecasts are based on a combination of regions 3 and 4, seen on the image as the Nino 3.4 region. Region 3 covers the eastern tropical Pacific, while region 4 covers the central and western parts.
Each ENSO phase has a different effect on the pressure and weather in the tropics. This translates to the overall global circulation and thus impacts the weather worldwide differently. A specific phase (cold/warm) usually develops between late summer and fall and typically lasts till next summer. But some events can last even up to two years.
The cold ENSO phase is called La Nina and the warm phase is called El Nino. Their names literally translate to “the girl” from the La Nina, and the name El Nino translates to “the boy”, indicating an opposite dynamic between the two phases.
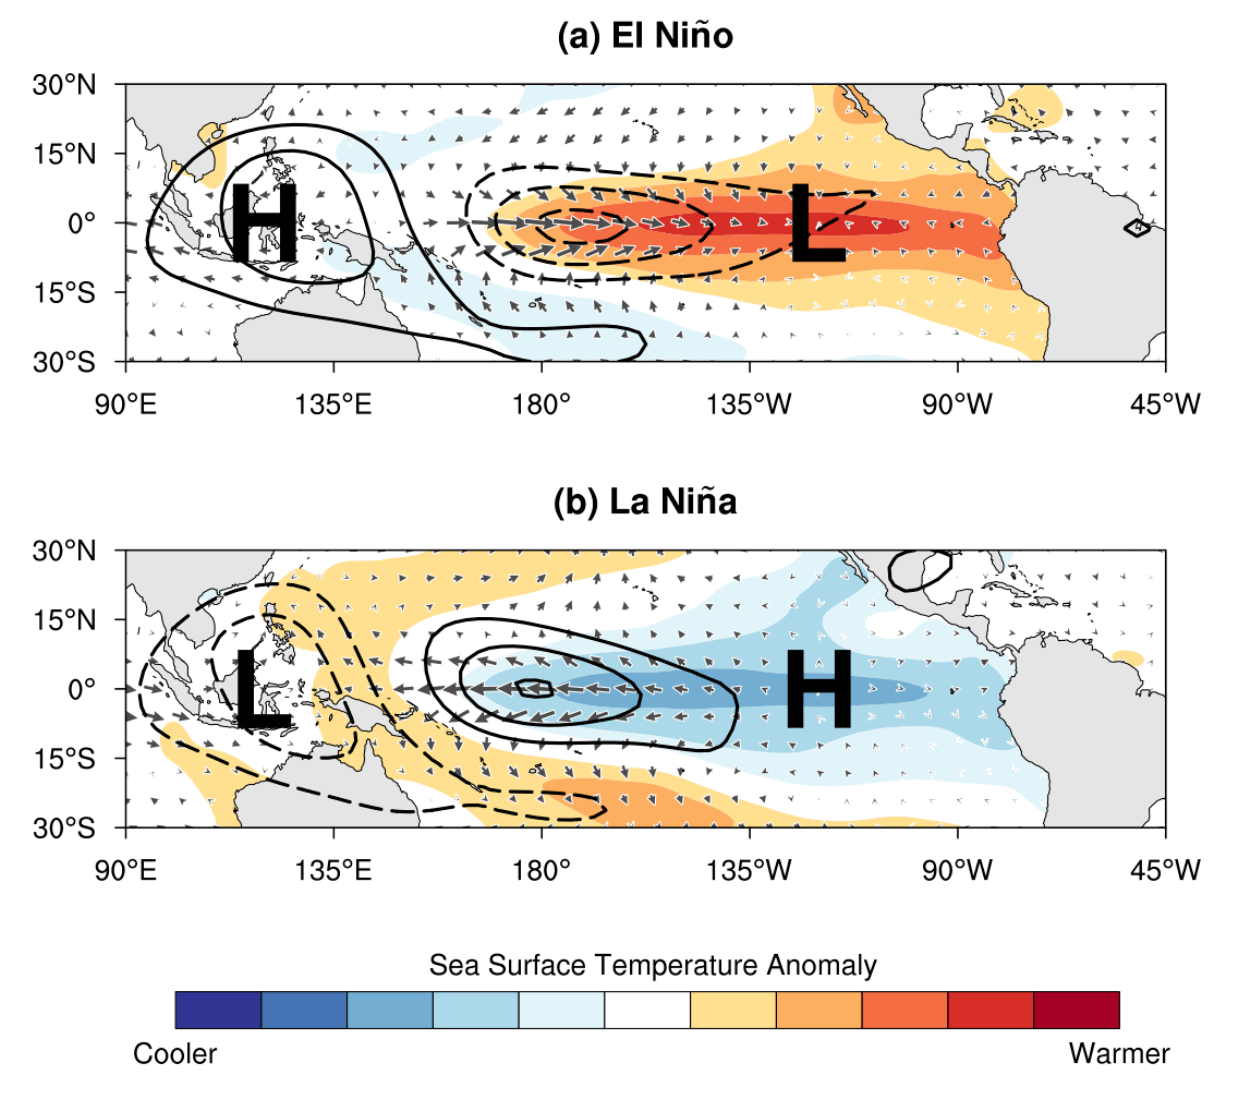
But besides the temperatures, one of the main differences is also in the pressure state. During an El Nino, the pressure over the tropical Pacific is lower, with more rainfall and storms.
But during a La Nina, the pressure over the equatorial Pacific is high, creating stable conditions and less precipitation. This obviously translates into the global circulation, affecting both Hemispheres over time.
Below we have the global ocean temperature anomaly analysis from NOAA. We can clearly see the strong cold anomalies in the tropical Pacific Ocean. That is the current ongoing La Nina phase. The strongest cold anomalies are currently found in the eastern parts, going more than 3°C below the long-term average.
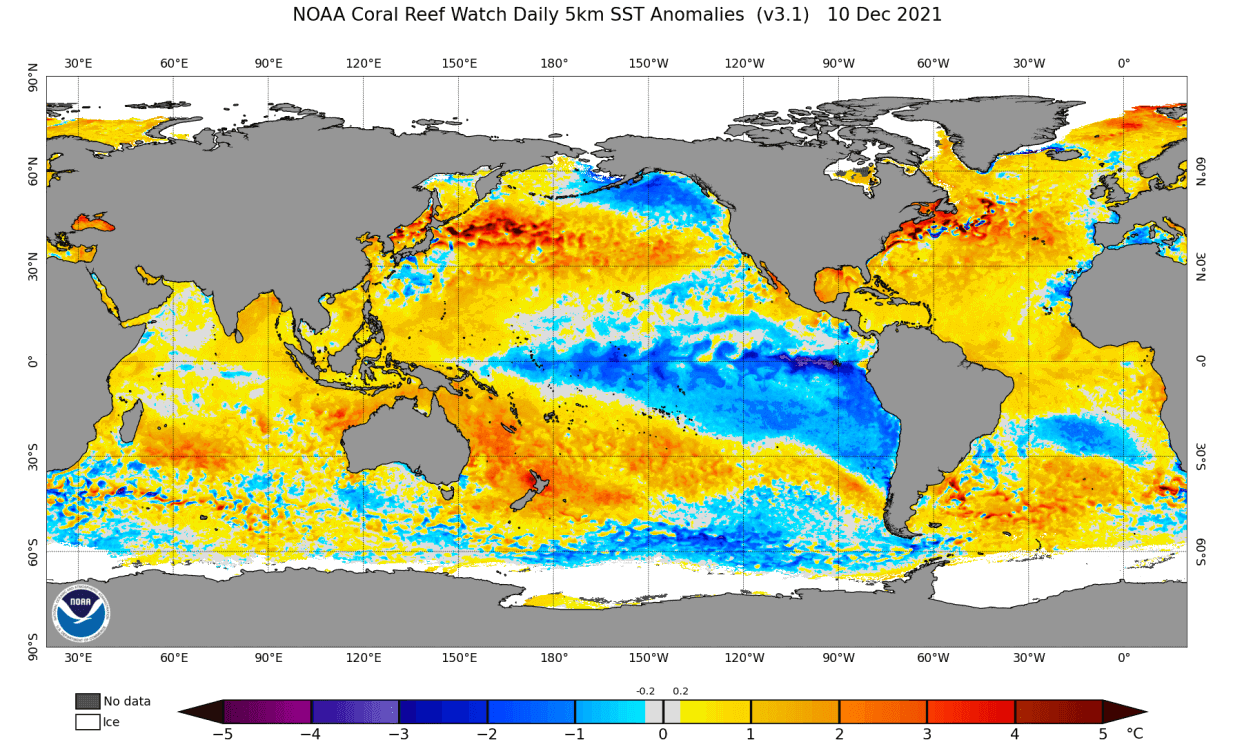
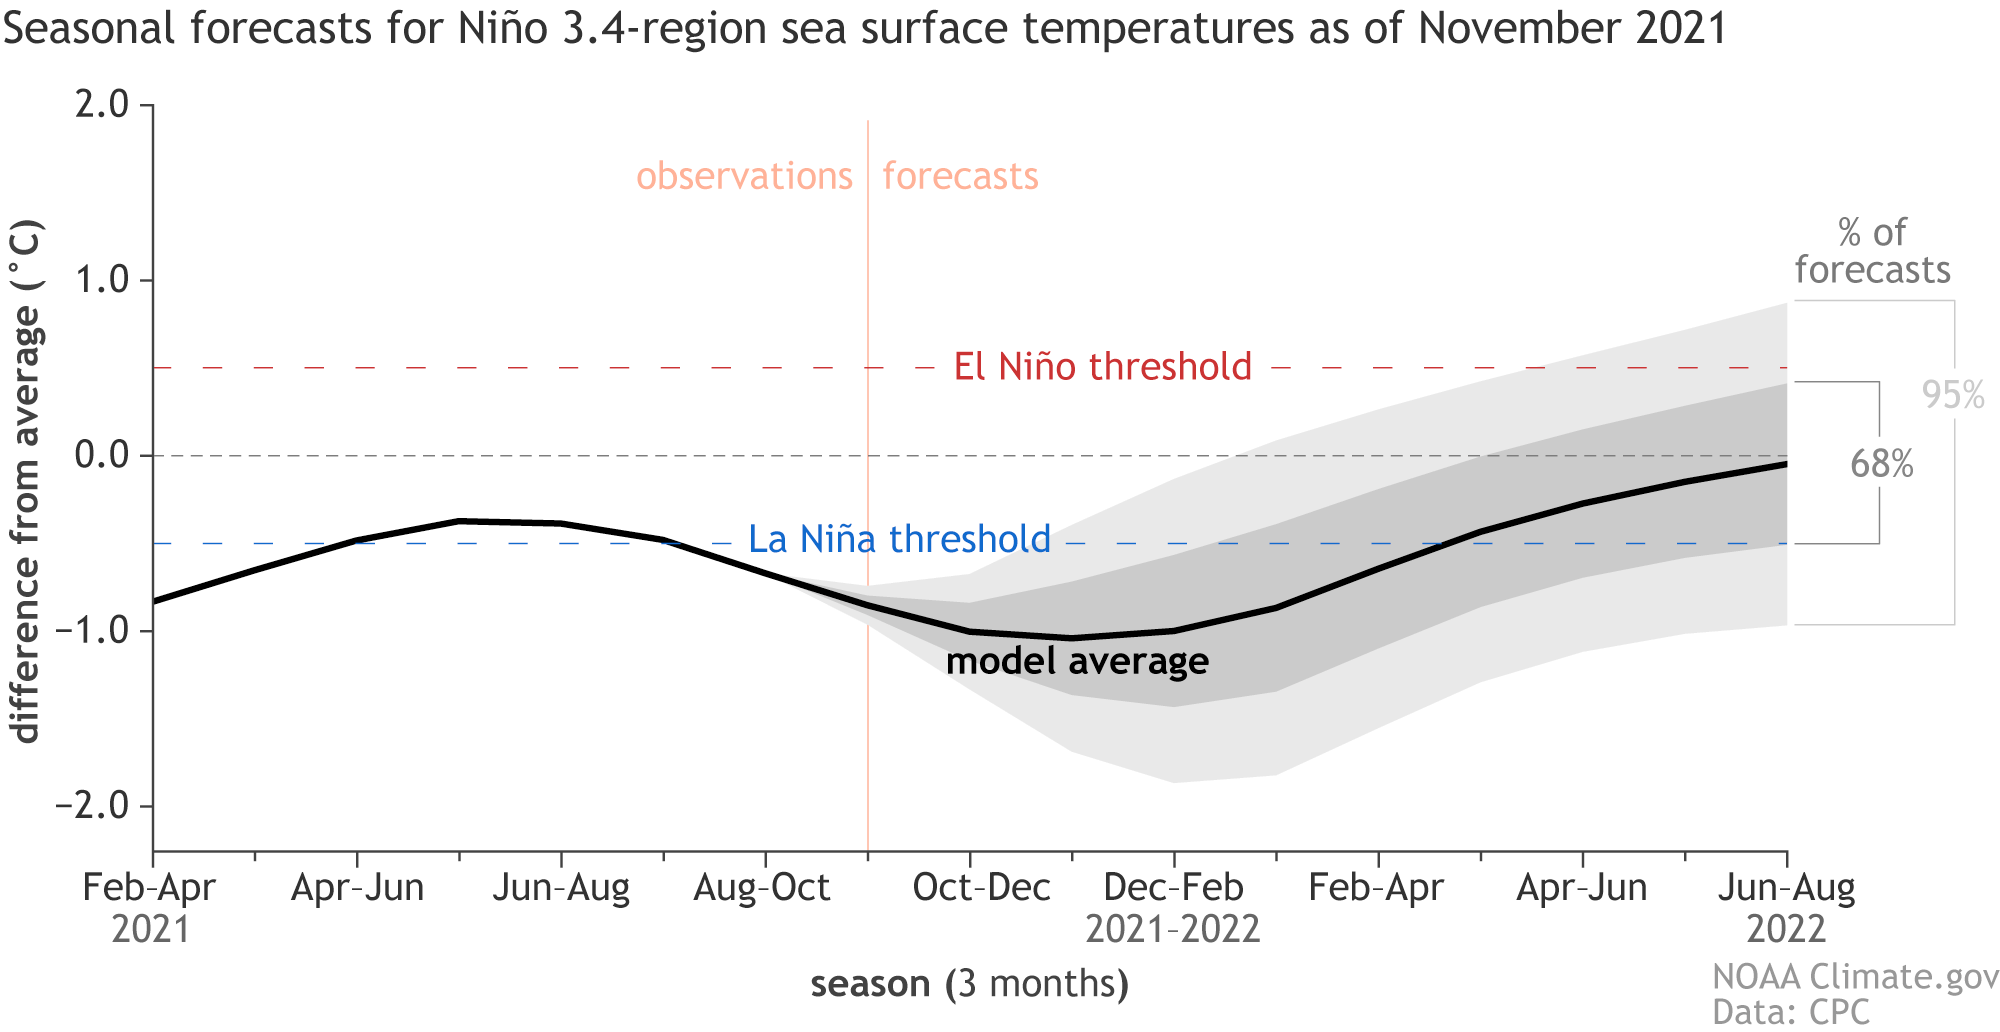
The forecast calls for the La Nina to last well over the winter and into Spring 2022. This is a typical scenario, with a more neutral state during the warm part of the year. Typically a new phase tends to develop in late summer or early fall.
Below we have the average winter pressure pattern combining multiple years with an active La Nina phase. The main takeaway is of course the high-pressure system in the North Pacific and low pressure over Canada. That is the typical fingerprint of the cold ENSO phase. Over Europe, we see high pressure over Scandinavia and northwestern Europe.
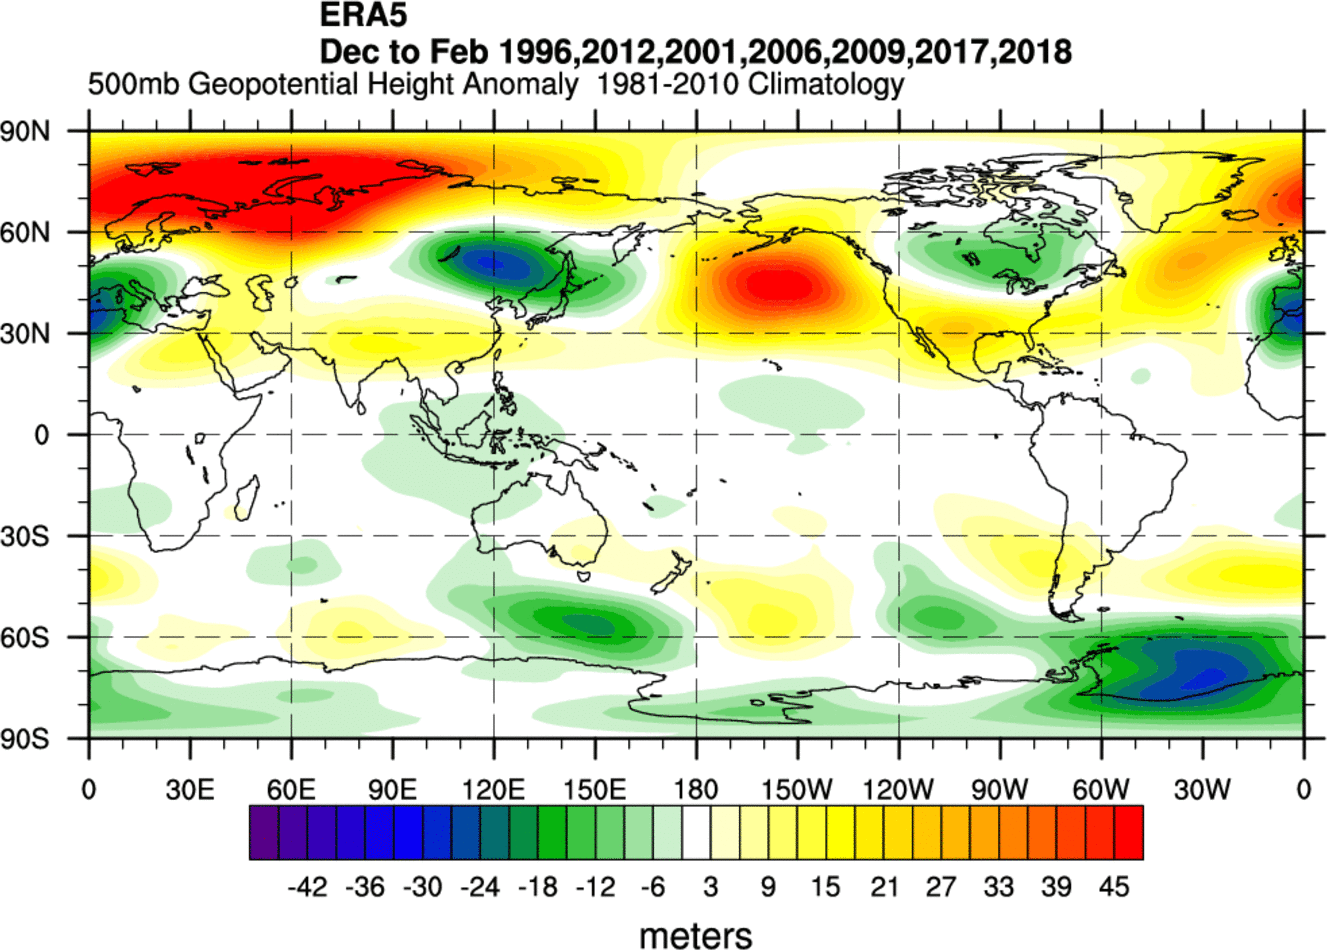
If you remember the MJO from the previous segment, this was also the main signature of phase 7 we have now entered. A high-pressure system in the North Pacific and northern Europe and low pressure over Canada and the northern United States.
This means that the MJO and the La Nina are in this case can “boost” each other, as they both force towards the same pattern. We will now be looking for this pattern in the forecast, to see how the influence of these two “crowns” of winter weather will translate into our every day for the rest of December.
WINTER WEATHER PATTERN FORECAST – DECEMBER 2021
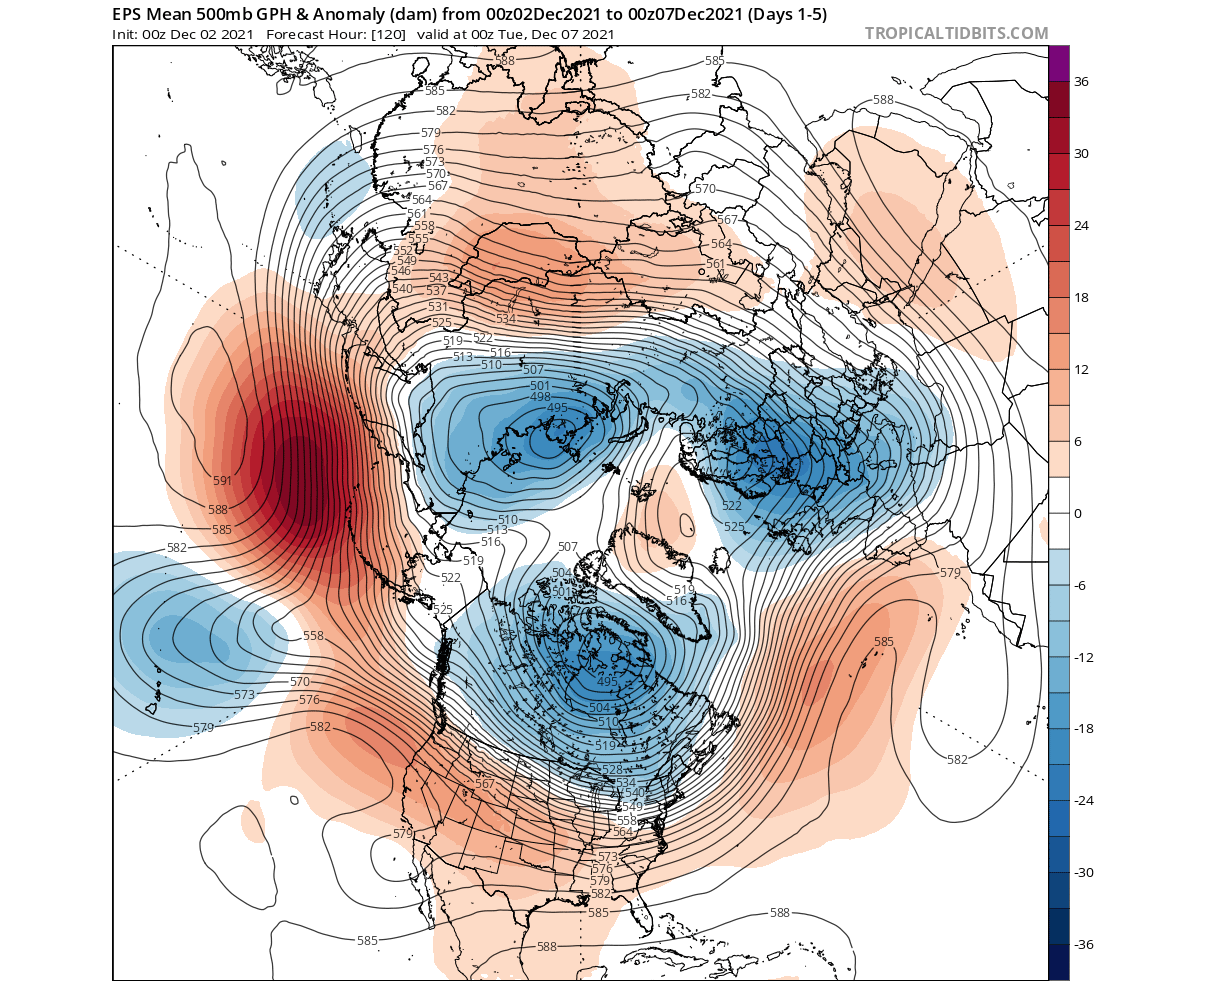
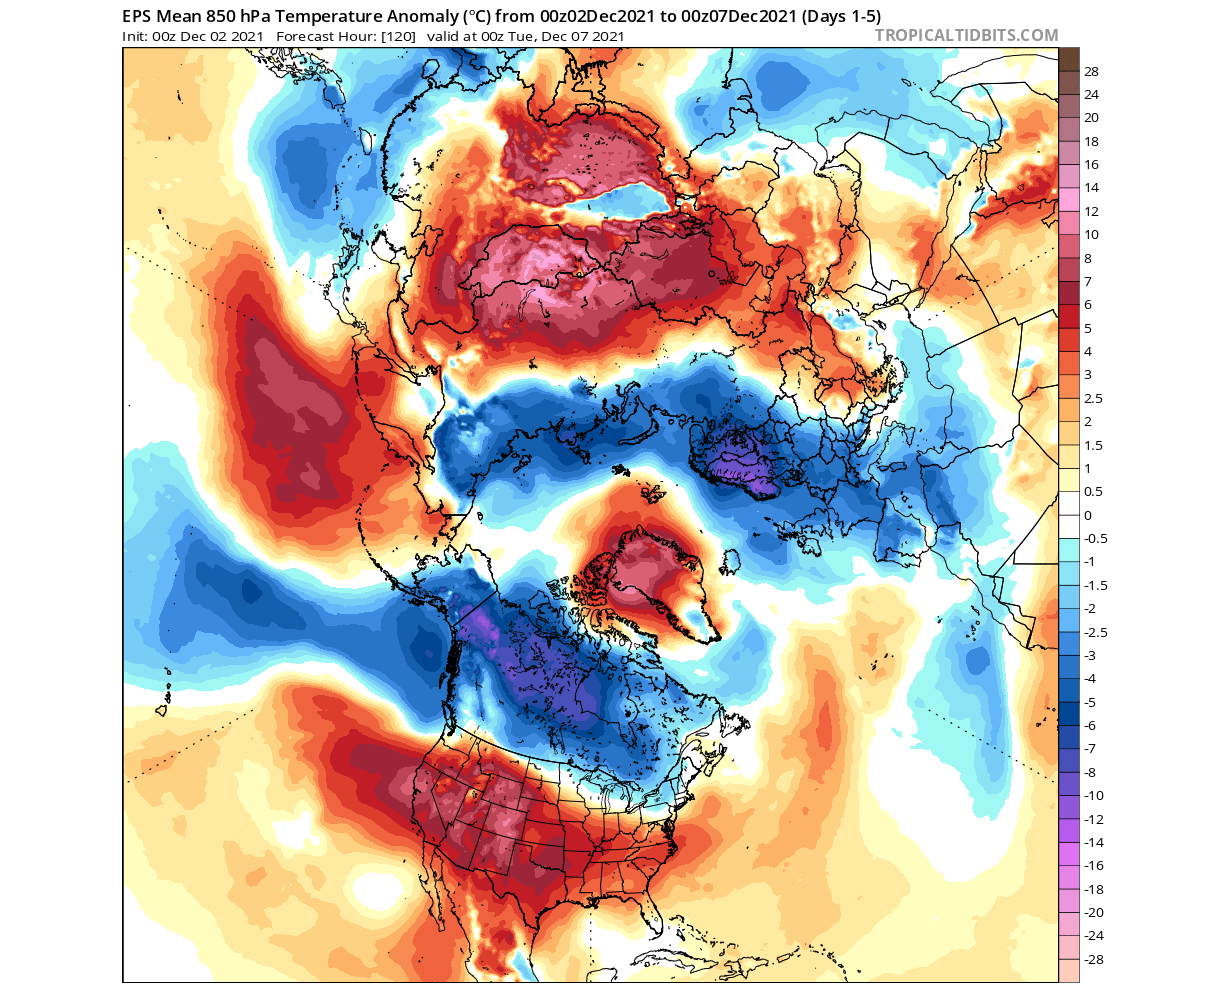
December started off pretty wintery already in Europe, while most of the continental United States were under milder weather. A low-pressure system was present over Canada, with higher pressure seen building in the North Pacific.
Looking at the temperatures, we can see most of Europe under colder than normal temperatures. Especially noteworthy are the record cold conditions for this time of year in Scandinavia. Also, very cold temperatures were present in Canada and Alaska. we had warmer than normal temperatures over most of the continental United States, with the exception of the far northern regions.
Looking at the latest forecast for mid-month, we can notice a change in the pressure pattern. A high-pressure system is starting to rise again in the North Pacific, into the Aleutians. We also have higher pressure rising over Europe. A special pattern is over the United States, with a low-pressure system entering from the west, creating strong southerly flow over the eastern part of the United States.

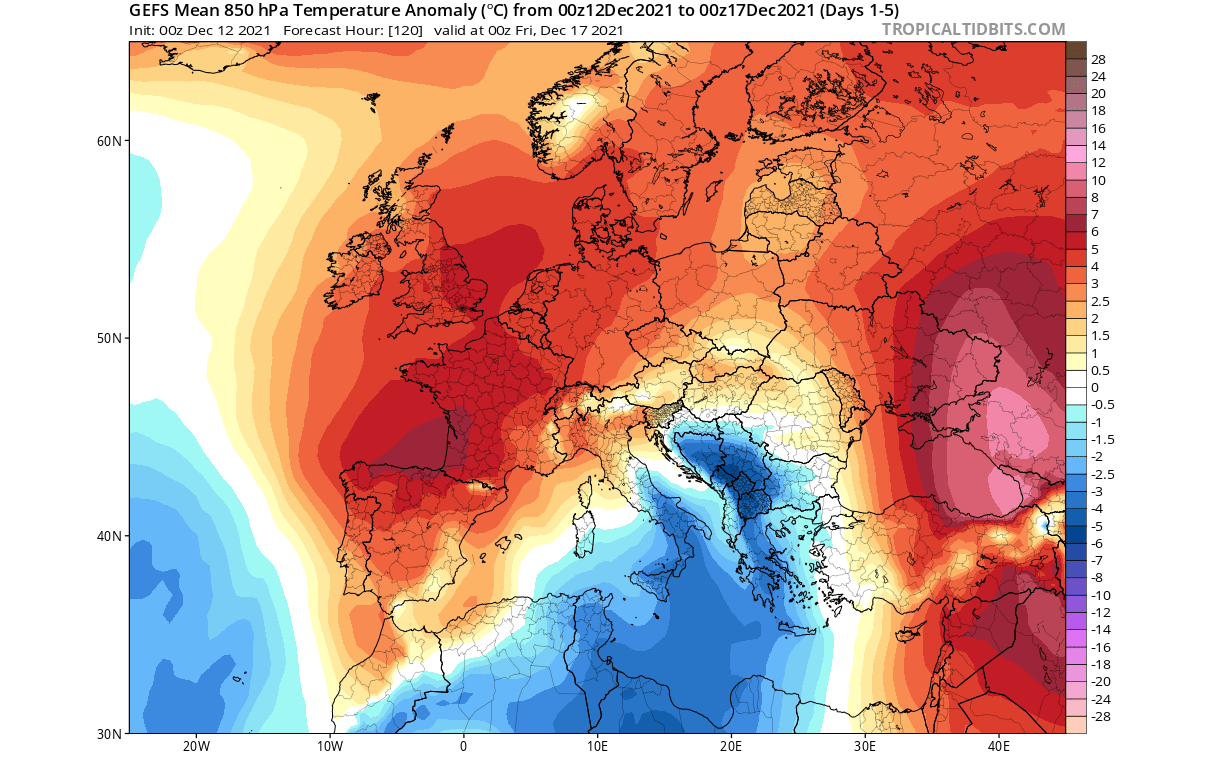
Looking at Europe first, we can see a much different pattern compared to the first part of the month. Warmer than normal temperatures will expand over much of western and northern regions, with the expanding high-pressure system also bringing mostly drier weather.
Over North America, we can see a strong weather contrast. Much colder than normal temperatures over western Canada and Alaska, expanding into the western United States. At the same time, unseasonably warm weather is expanding over the central and eastern parts of the United States.

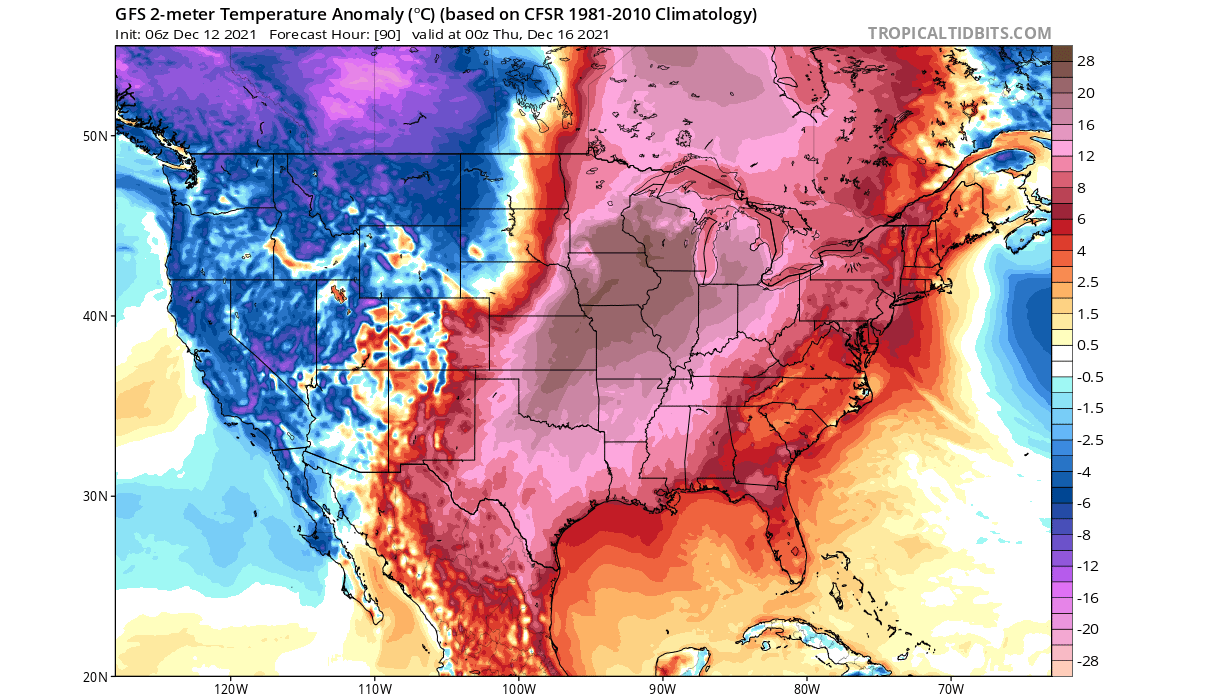
Looking closer at the strong anomalies, we have the temperature forecast for mid-week below. Notice very strong cold anomalies in the northwest United States and western Canada, and much warmer than normal conditions across the central and eastern United States. Maximum deviations will be exceeding 20°C (40°F) above the long-term average.
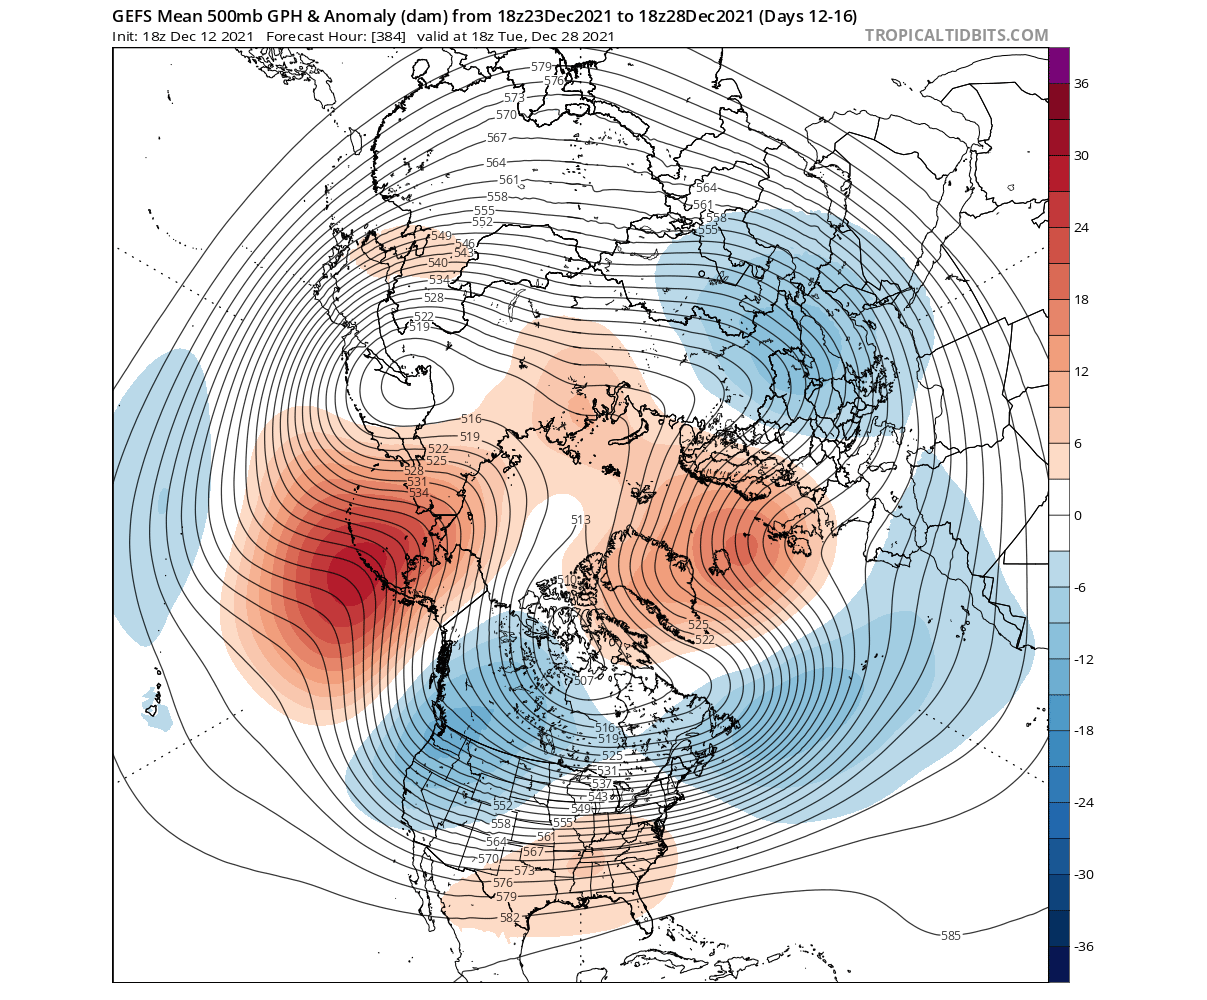
Going further into December, we are going to witness a strong amplification of the pressure pattern. As you can see below, two strong blocking systems will be present over the North Pacific and northwest Europe and the North Atlantic. If you remember back to the previous segment, this exactly represents the MJO and La Nina patterns.
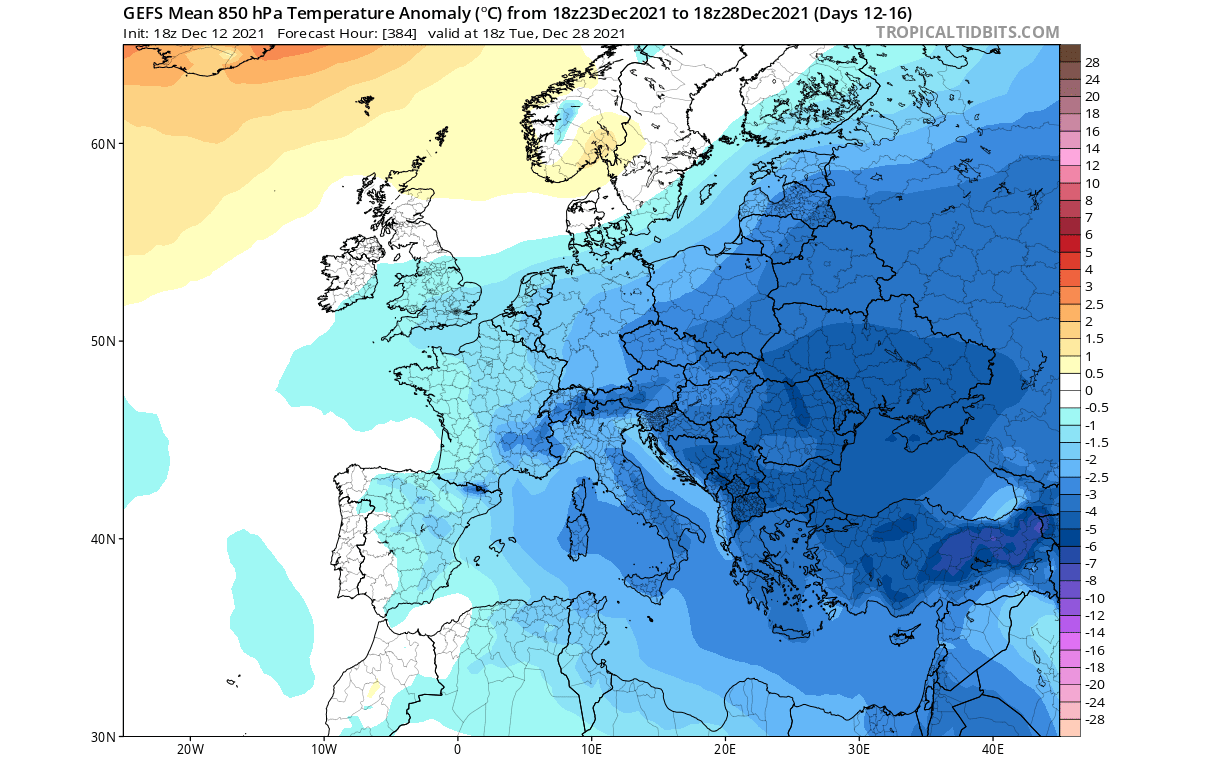
Looking at Europe first, we can see colder air returning from the east over much of the continent. Warmer anomalies are lifted further into northwestern and northern Europe, as the blocking high-pressure system rises towards the north.

Over North America, we can see that the strong warm anomalies are moving out for now. That is also thanks to the strong high pressure in the North Pacific, which helps to amplify the jet stream over the northern United States. Such positioning helps to create a cold air outbreak in the northern and central parts of the United States. The southeastern United States remains warmer than normal.

LATE MONTH WEATHER FORECAST
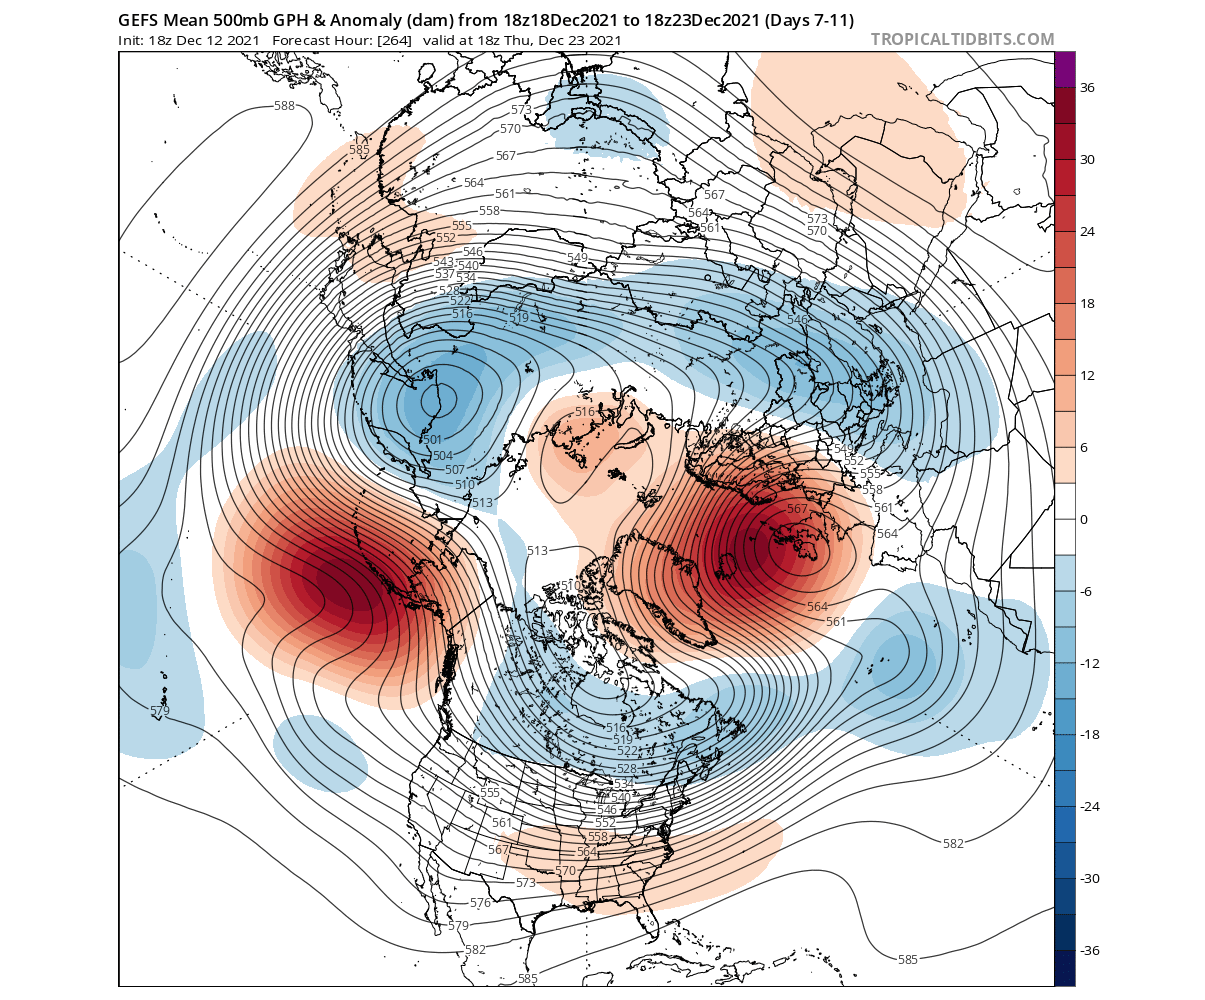
Going into late-month, the pattern persists. Strong blocking high pressure sits over the Aleutians, a signature of the La Nina and the MJO phase 7. The Blocking high also remain over northern Europe and the North Atlantic. We can now see a descending low-pressure area into the western United States. At this point, it means higher pressure rising in the southeast of the United States.
In Europe we see a continuation of the cold pattern for most of the continent, expanding further towards the British Isles and Scandinavia. This period also contains the Christmas holidays, which will at least be colder than normal, if not snowy in some places. We will look at the early Christmas trends further below.
Over North America, we can see a strong cold pool developing further over western Canada, extending down into the northwestern United States and the Midwest. Despite seeing warmer temperatures in the southern half of the country, the strong cold pool can quickly produce a cold outbreak. Typically that is done when a low-pressure area moves from the west/northwest towards the eastern United States.

NOAA also regularly releases their 8-14 day forecast for the United States. Below we have the temperature forecast, where they call for the colder weather in the west and parts of the Midwest, and warmer than normal in the south and southeast. As we have seen on the latest forecast above, this can still produce cold outbreaks very quickly into the central part of the United States.
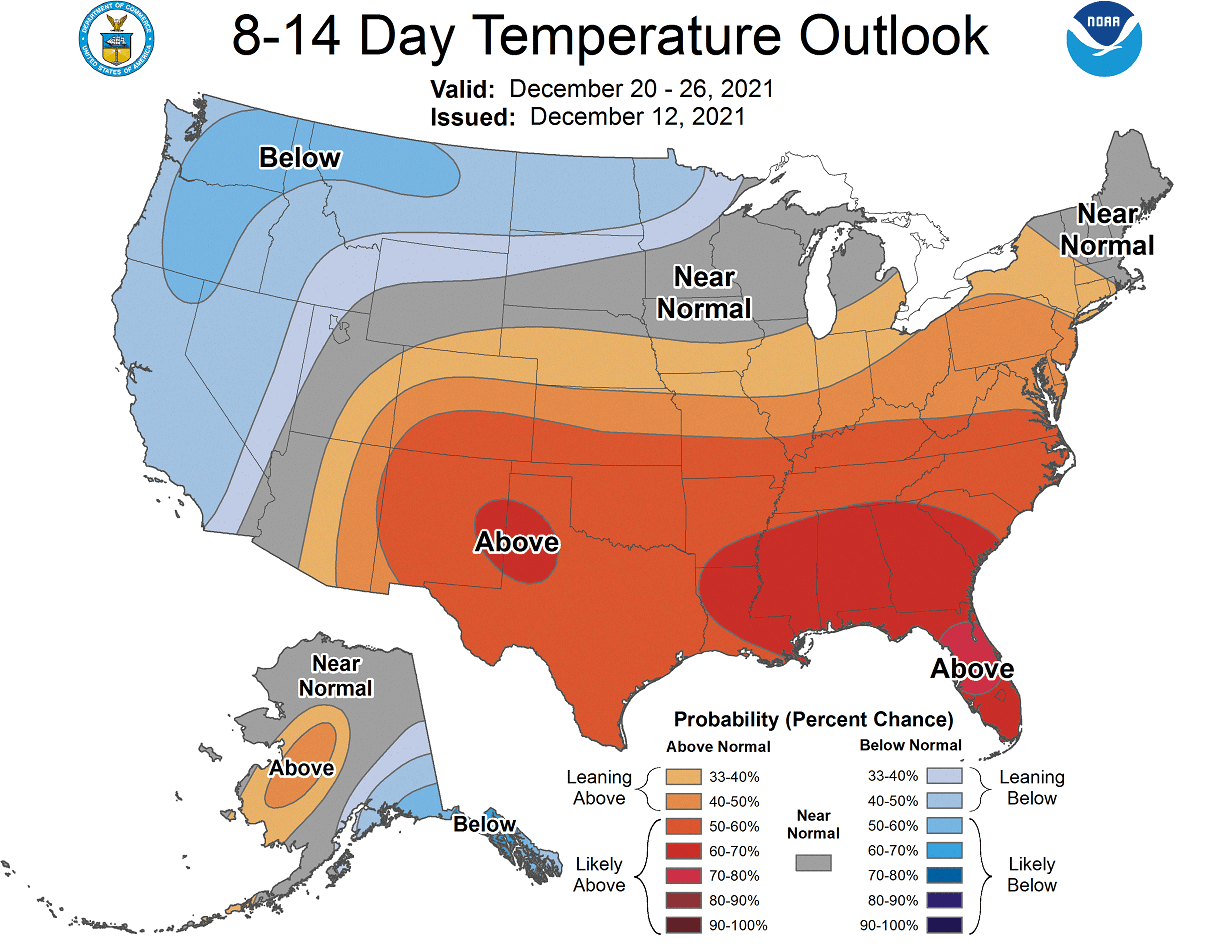
The forecasts have just begun to fully grasp the changes in the tropics and with the pattern overall, so it is expected for the official NOAA forecast to expand the normal and colder area further into the central and northeastern regions.
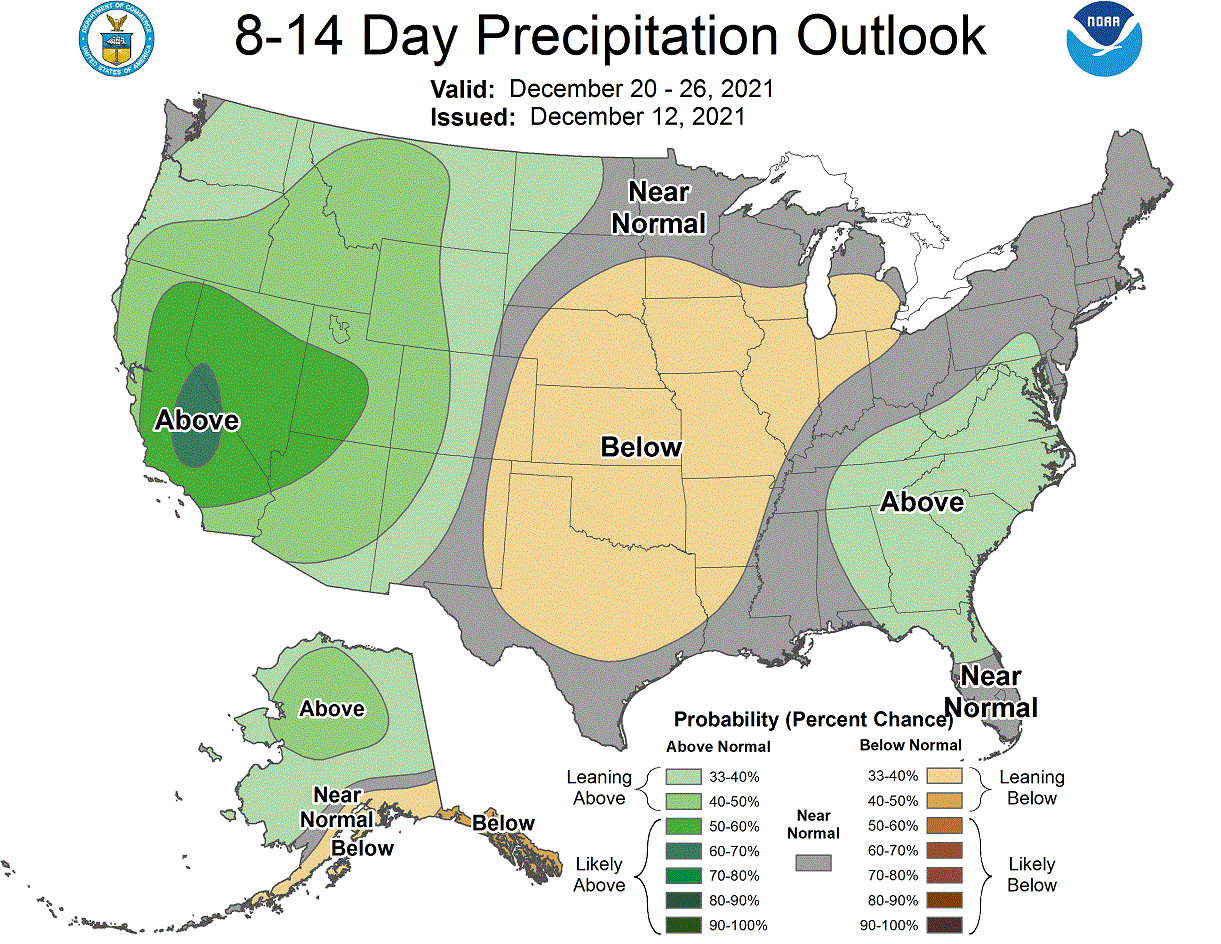
We have the precipitation forecast below, which calls for more precipitation in the west and in the east. The central United States can expect drier than normal conditions later in the month.
But this period also covers the Christmas holidays. And every year, people are wondering if they will experience a white Christmas in their area. We will look at the early trends for the Christmas period, along with some long-term historical probability. You can expect more a detailed look into white Christmas 2021 in our upcoming articles.
WHITE CHRISTMAS EARLY FORECAST
Before looking at the trends, we need something to compare them to. Usually, the best comparison is the historical probability for a white Christmas, as we can see the most common areas that get snow on the ground during the holidays.
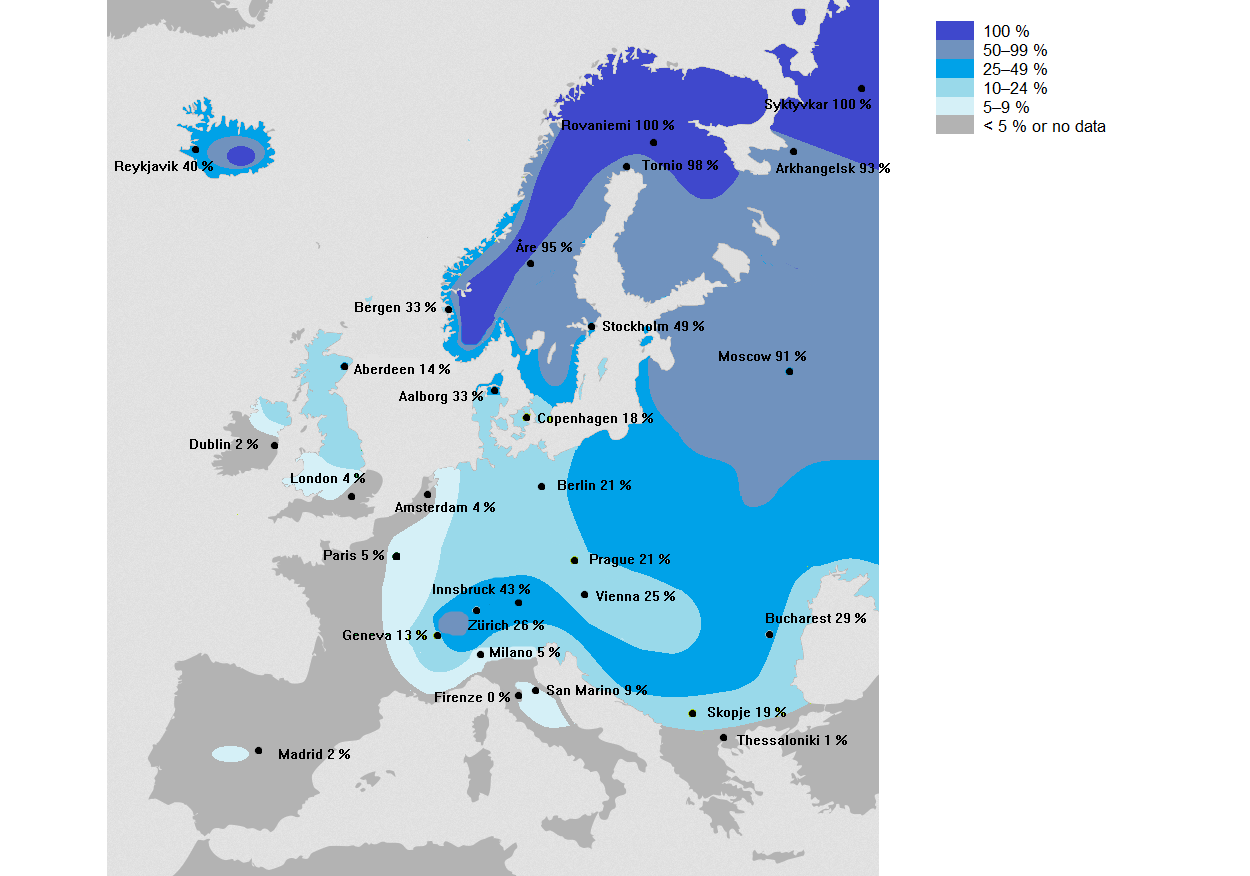
Starting in Europe, we have a map by the Reddit user Haayoaie. We can see the highest probability in northern Europe, with the higher altitudes of central Europe and the Balkans following behind. This is of course strongly connected to colder air, which is found in northern Europe and at higher altitudes.
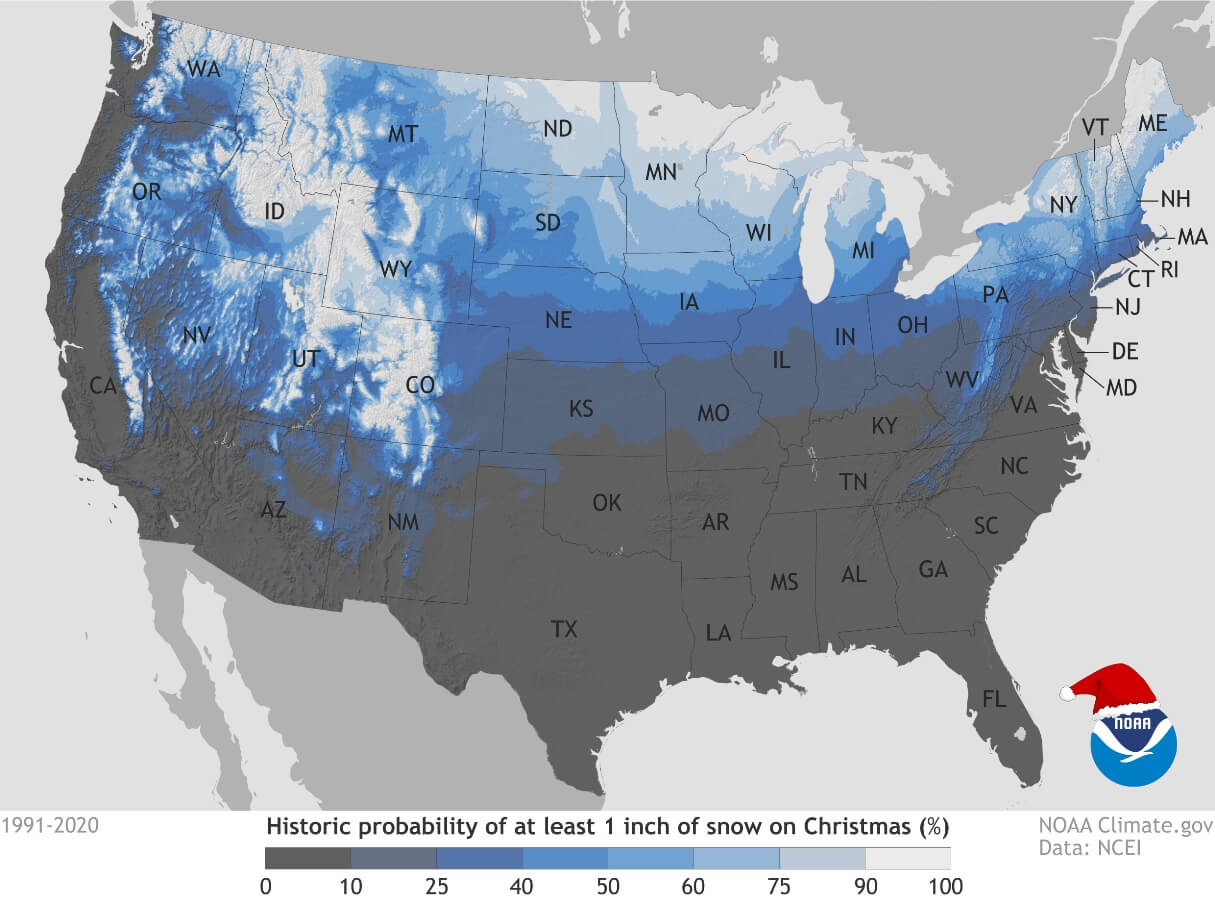
Over the United States, the story is of course the same. The biggest probability for a white Christmas is over the Rockies, the Midwest, and the northeastern United States. Probability diminishes quite fast towards the south. This is especially the case in La Nina winters, where the southern and southeastern United States tends to be warmer than normal.
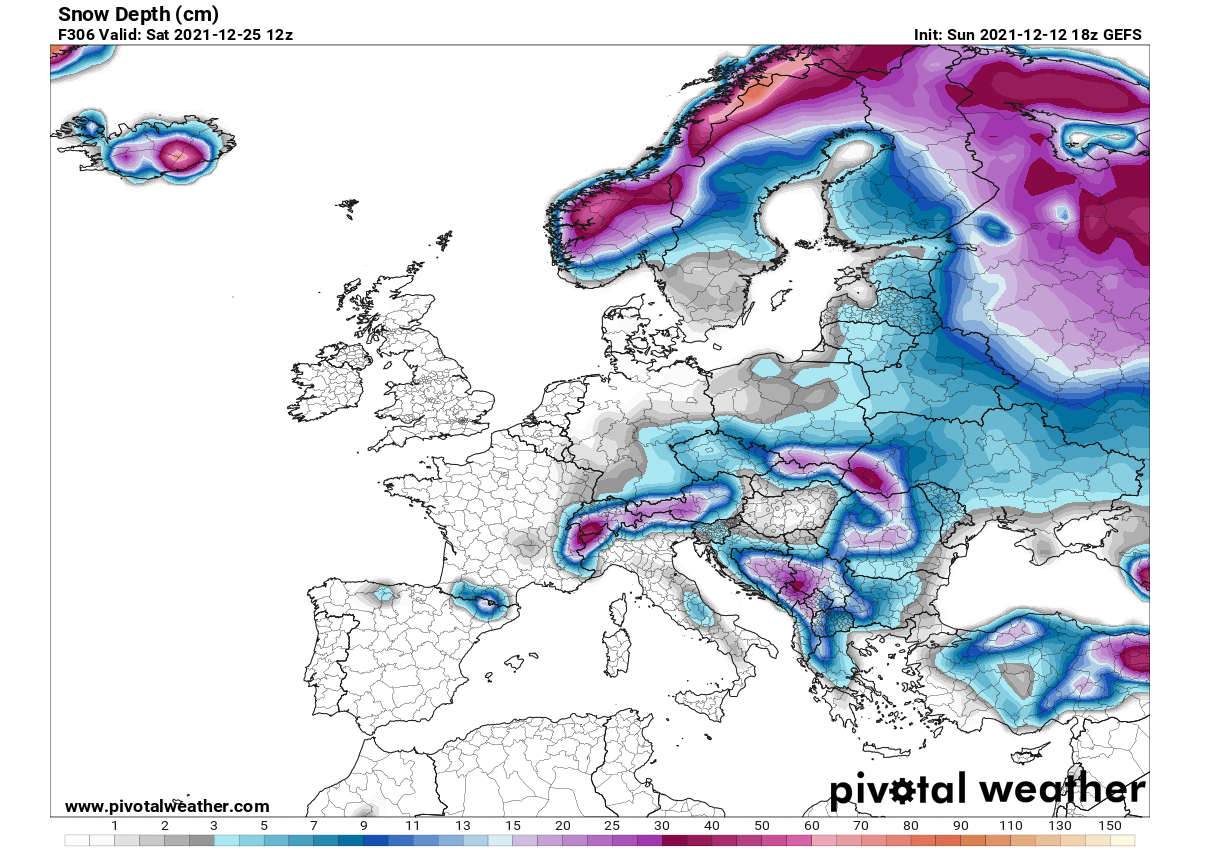
Looking at the actual early snow depth forecast for Christmas, we can see a similar picture as in the historical probability. Northern Europe and the higher altitudes in central and southeastern Europe tend to get more snow on the ground for the Christmas holidays. Some lowlands in central Europe and the Balkans also have a good chance for snow on the ground, thanks to the colder temperatures.
Over North America, the story is no different. Canada is of course entirely covered with snow. But in the United States, we see snow cover in the Rockies and the northwest. The snow cover is likely to extend across the Midwest into the northeastern United States on Christmas day. This is an early forecast, and we will release more detailed forecast articles for white Christmas in Europe and the United States.

EARLY 2022 WINTER WEATHER PATTERN
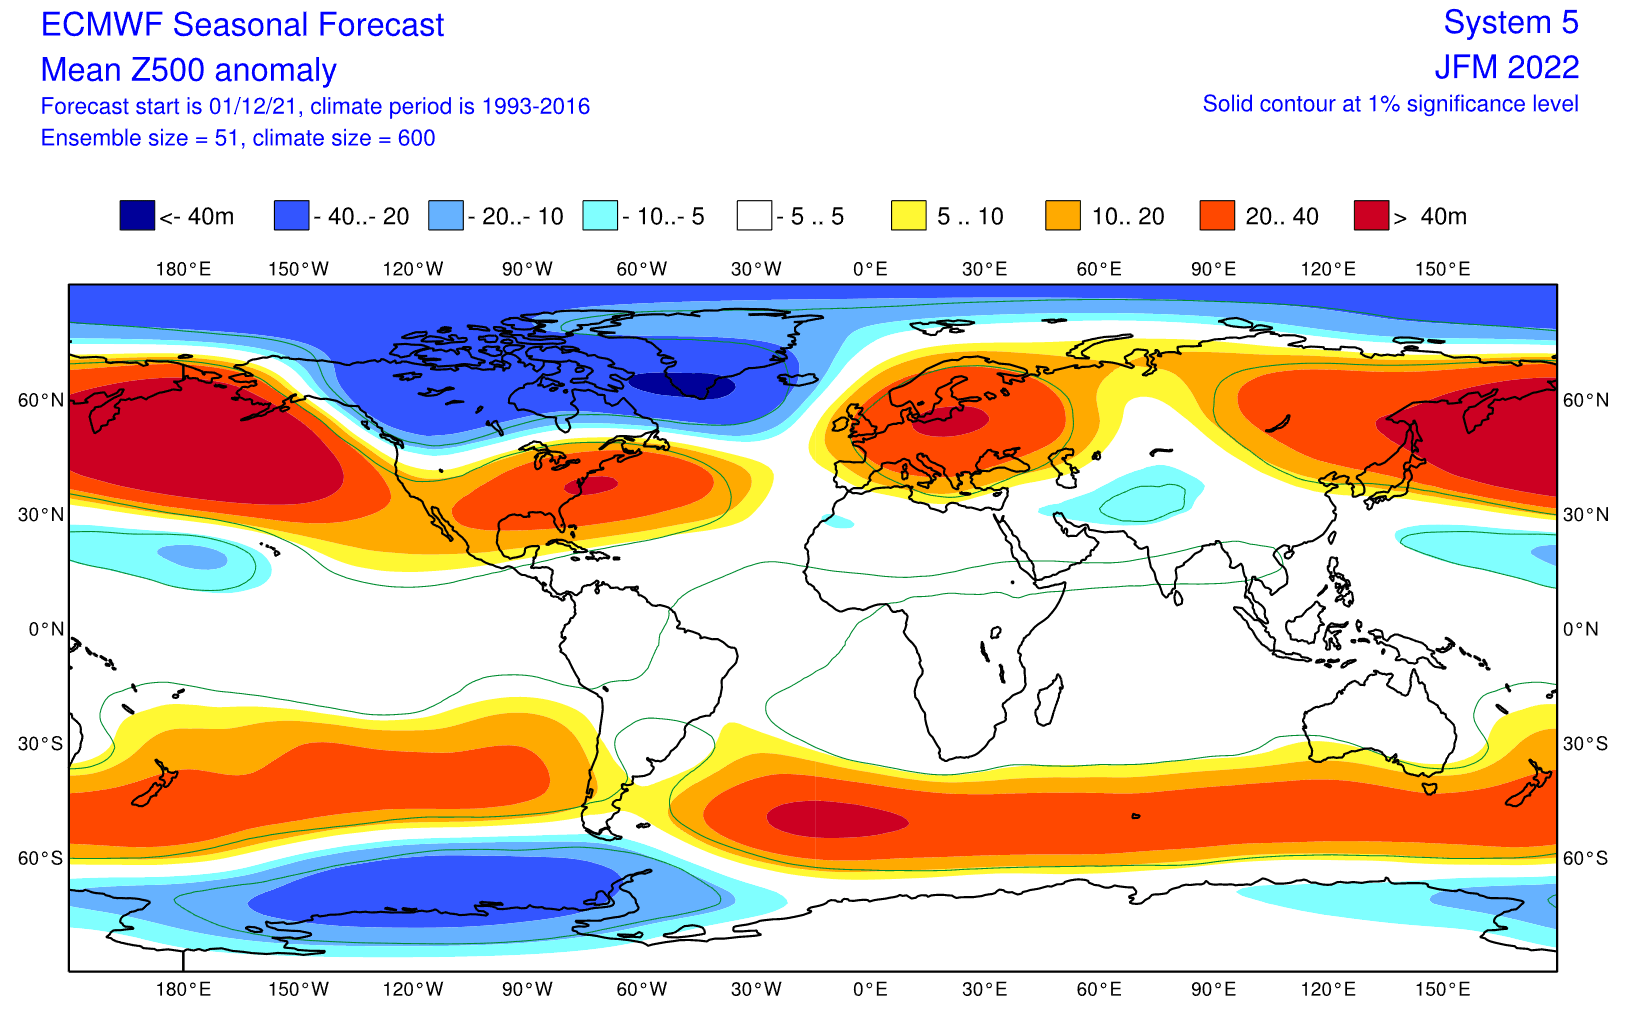
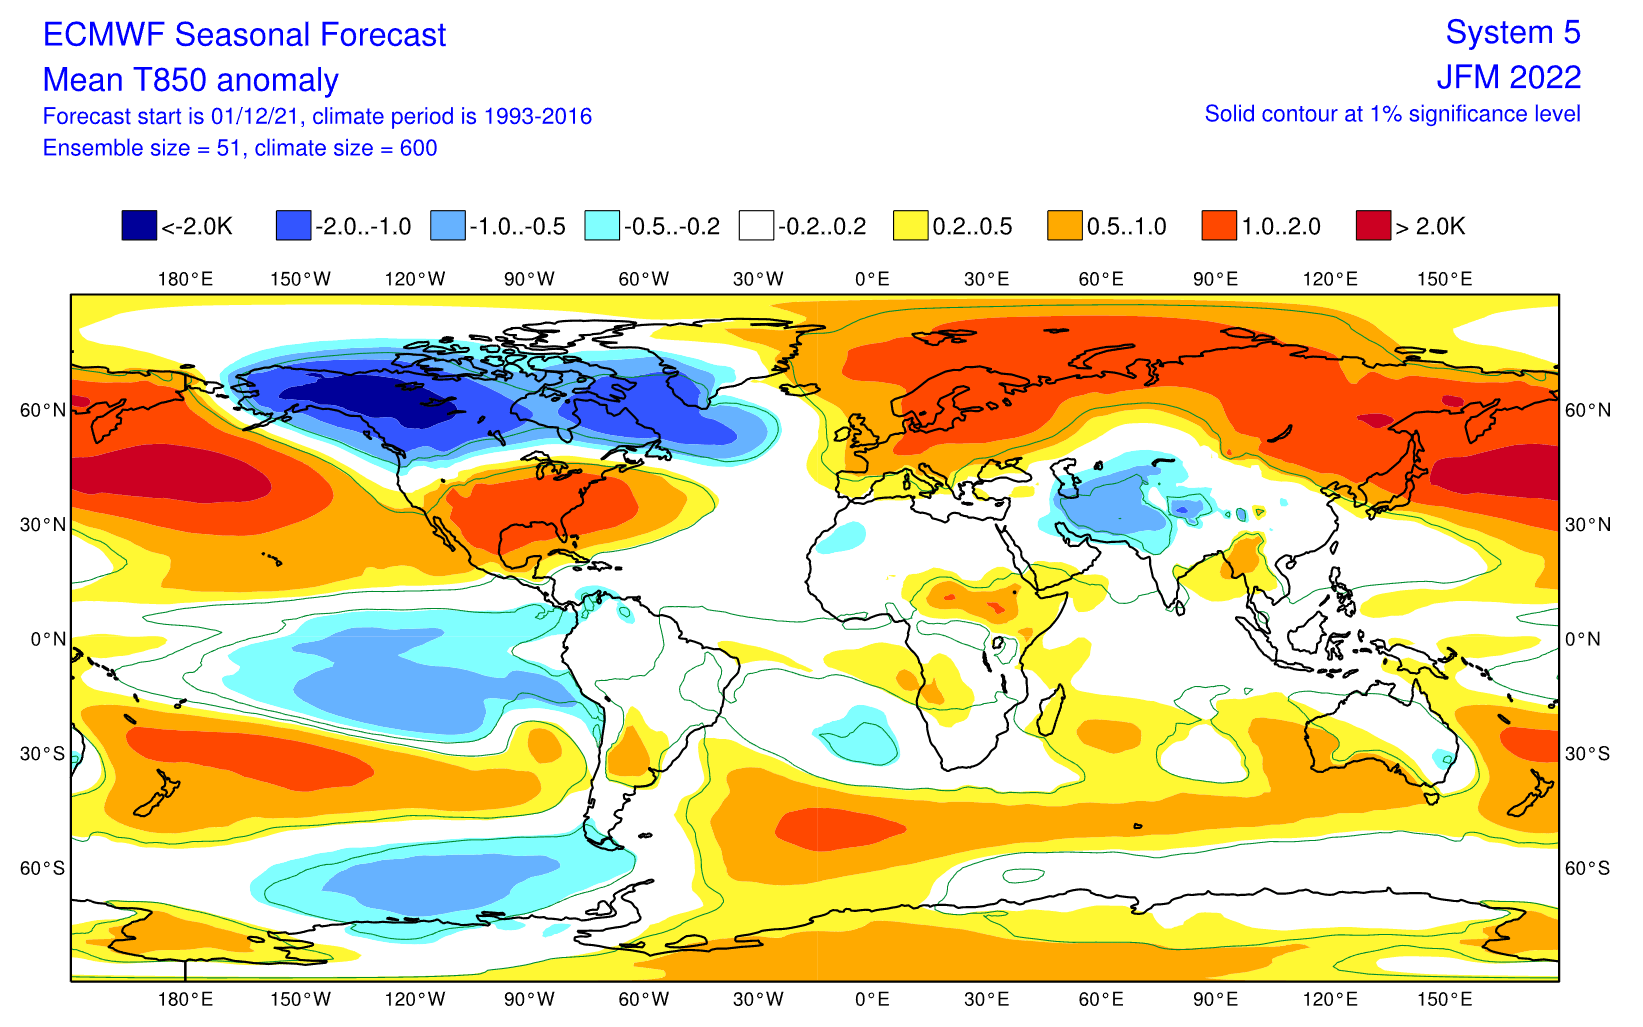
Looking at the seasonal trend for early 2022, we will use the ECMWF forecast. The period in question is the January-February-March season, so the first Spring month is included in the forecast. But since the winter months have typically more powerful patterns, the signal from the March forecast can have a weaker contribution to the average.
The forecast is the latest and was issued earlier this month. As we can see below on the pressure pattern forecast, the strong high-pressure system in the North Pacific is still present. That is the signature of the La Nina and is likely to stay present into the early Spring season. Notice the much lower pressure over most of Canada, also extending over the Polar regions.
Looking at the global airmass temperatures, we see the strong cold pool in western Canada standing out. That is forming this month and is set to stay till the end of the winter season. Notice the warmer temperatures over much of Europe, which would suggest a pattern change, following the colder than normal December.
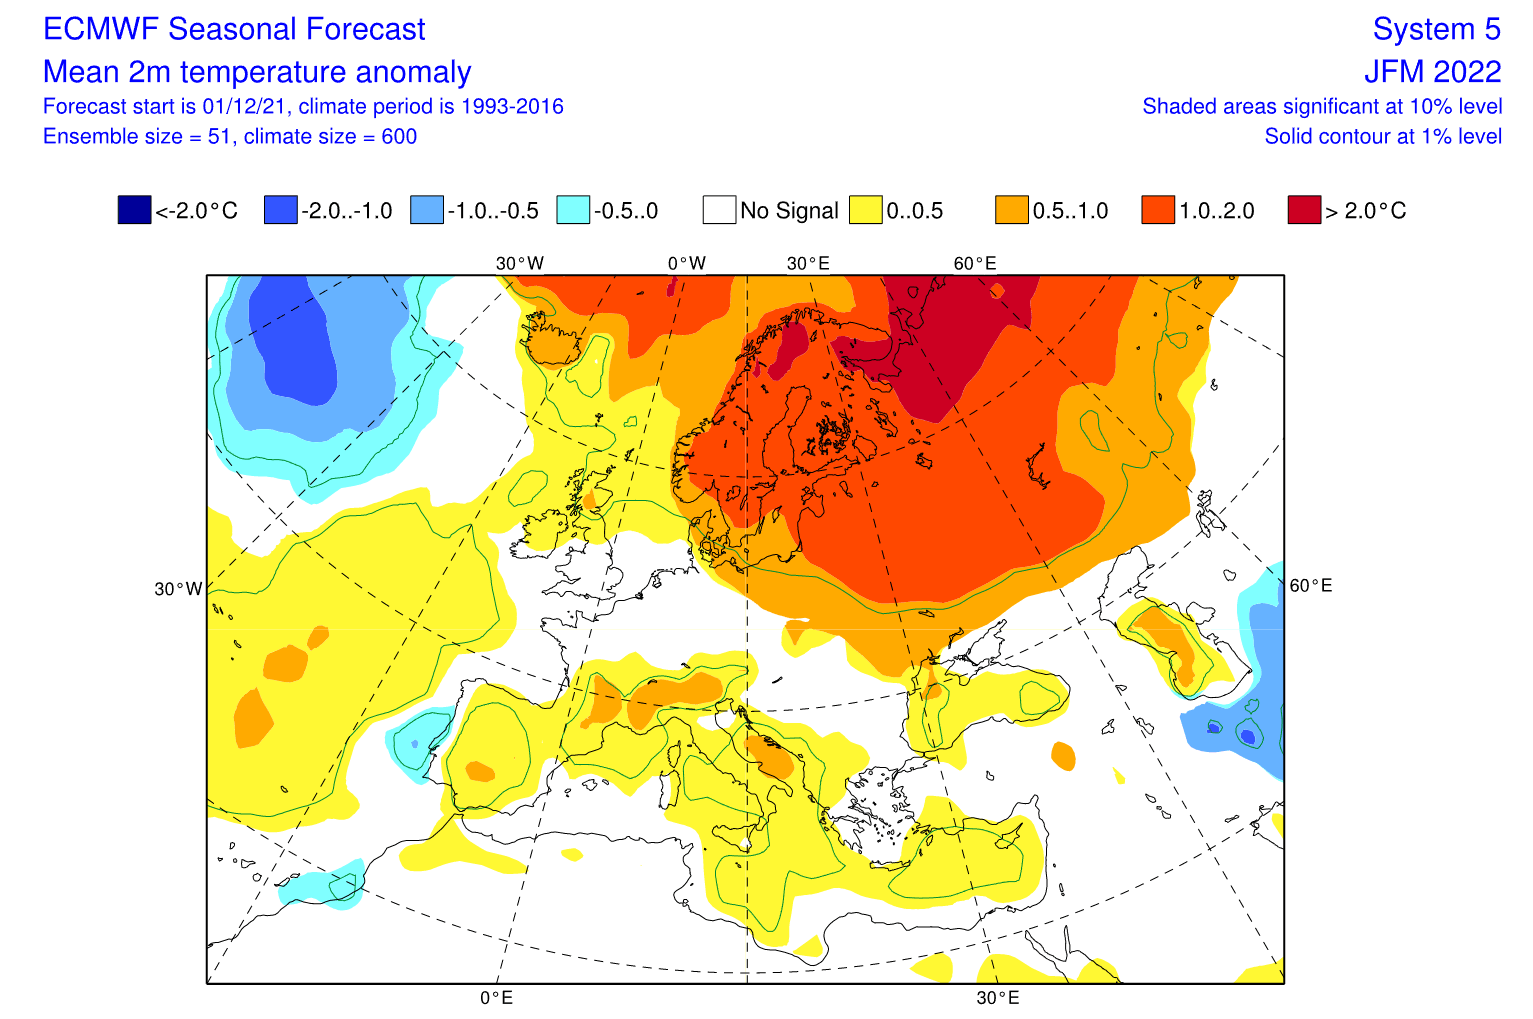
Looking closer at Europe we see the surface temperatures to be mostly above normal in northern Europe. There is however a neutral zone in parts of central Europe, suggesting that colder air intrusions can continue in January and February, similar to what we are seeing now in December, but with a lesser frequency.
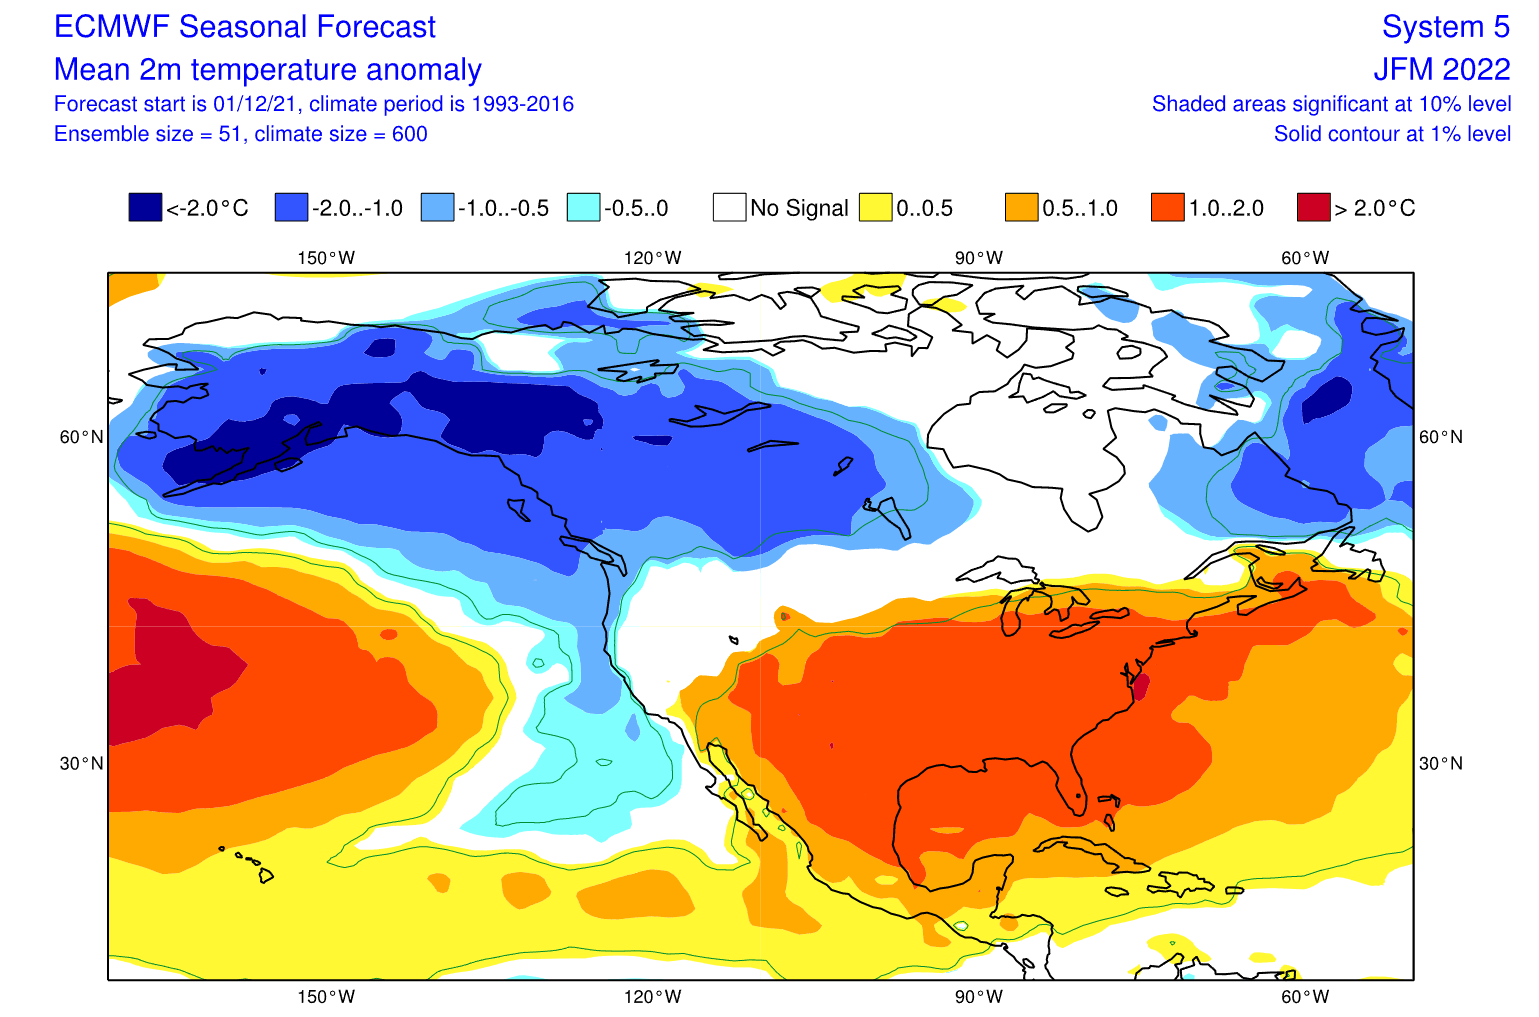
Over North America, we see the large cold pool over western Canada and Alaska, resulting from the north flow due to the blocking high over the North Pacific. In this pattern, cold air can quickly spread into the midwest and the central United States, as we have seen this month already, despite generally warmer than normal conditions on average.
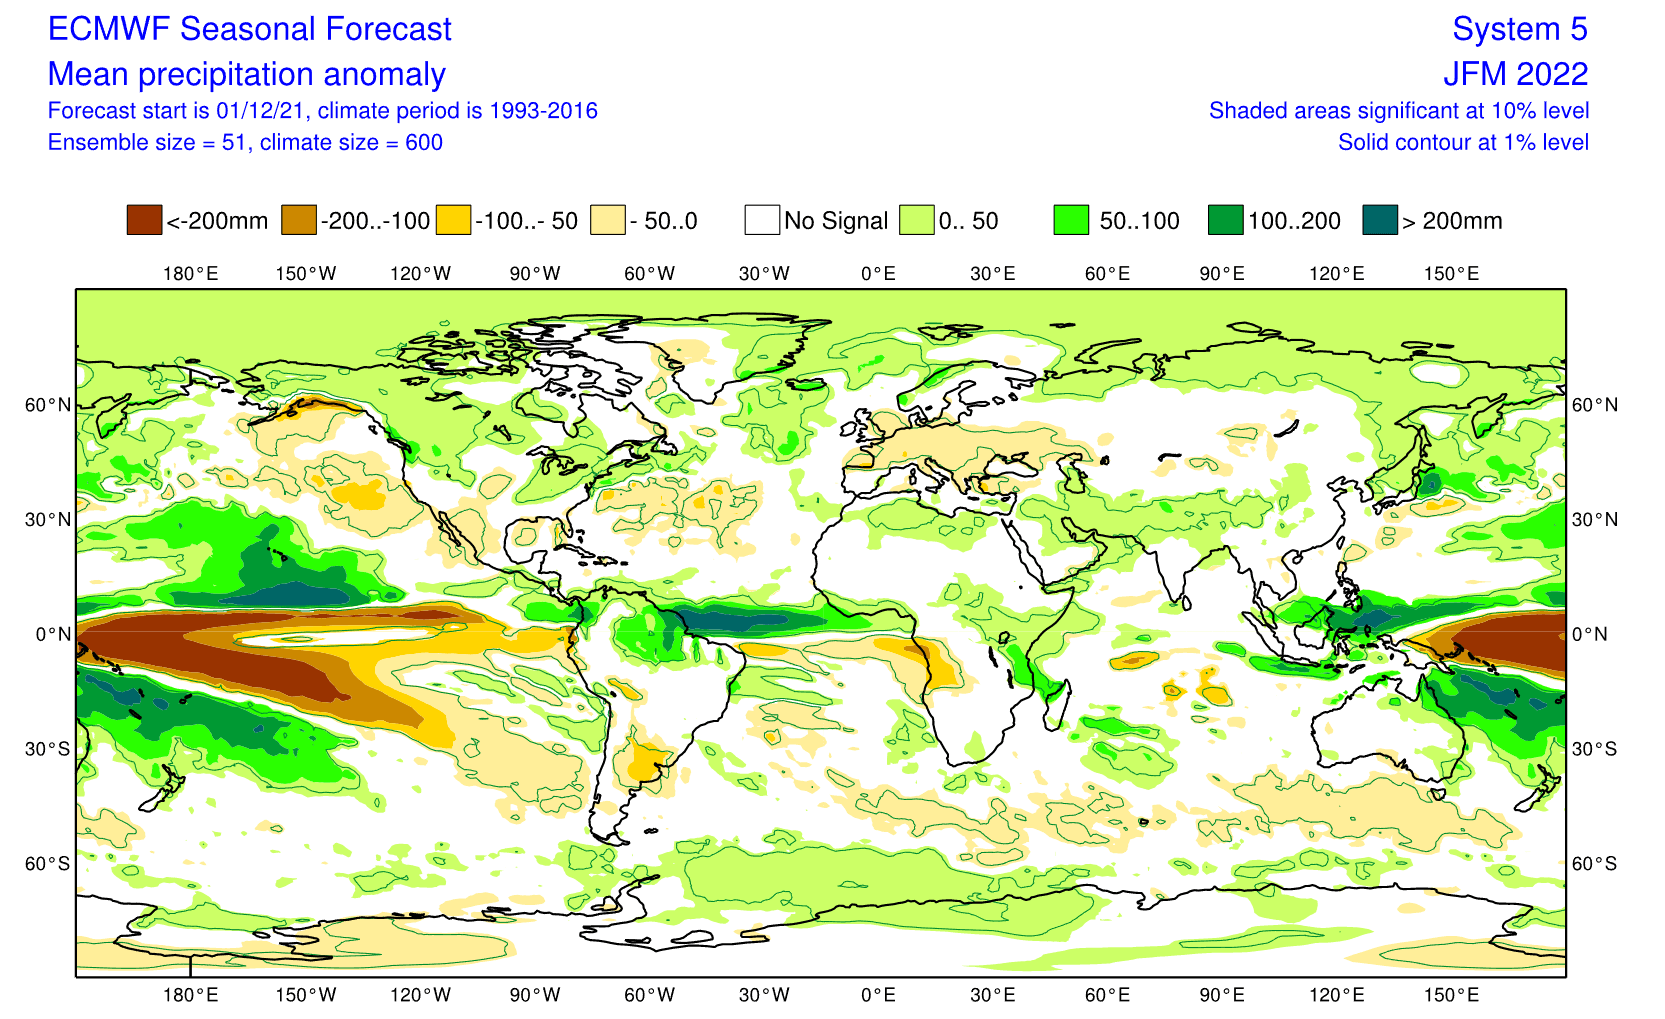
Looking quickly at the global precipitation forecast, we see mostly drier than normal conditions over Europe. More precipitation is forecast over Canada, which is mostly snowfall. More precipitation is also forecast over northwestern and northeastern parts of the United States. The southern United States is mostly normal to drier than normal.
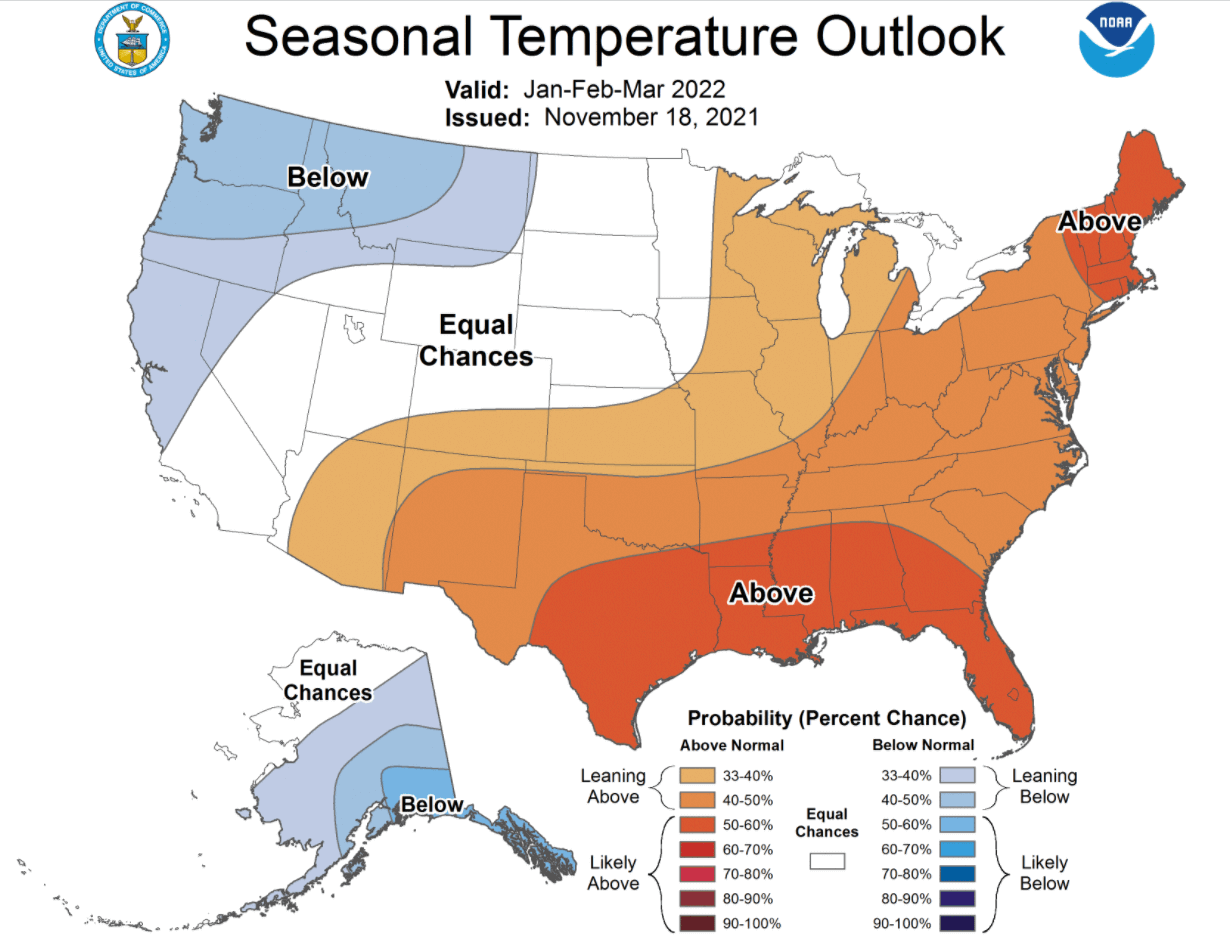
Below we have the official temperature forecast for the United States by NOAA, for the Jan-Feb-Mar 2022 season. It shows the temperature probability, with colder to equal chances in the northern United States. The southern half of the country and the northeast have a higher probability of warmer than normal weather, which we saw in the long-range forecast above.
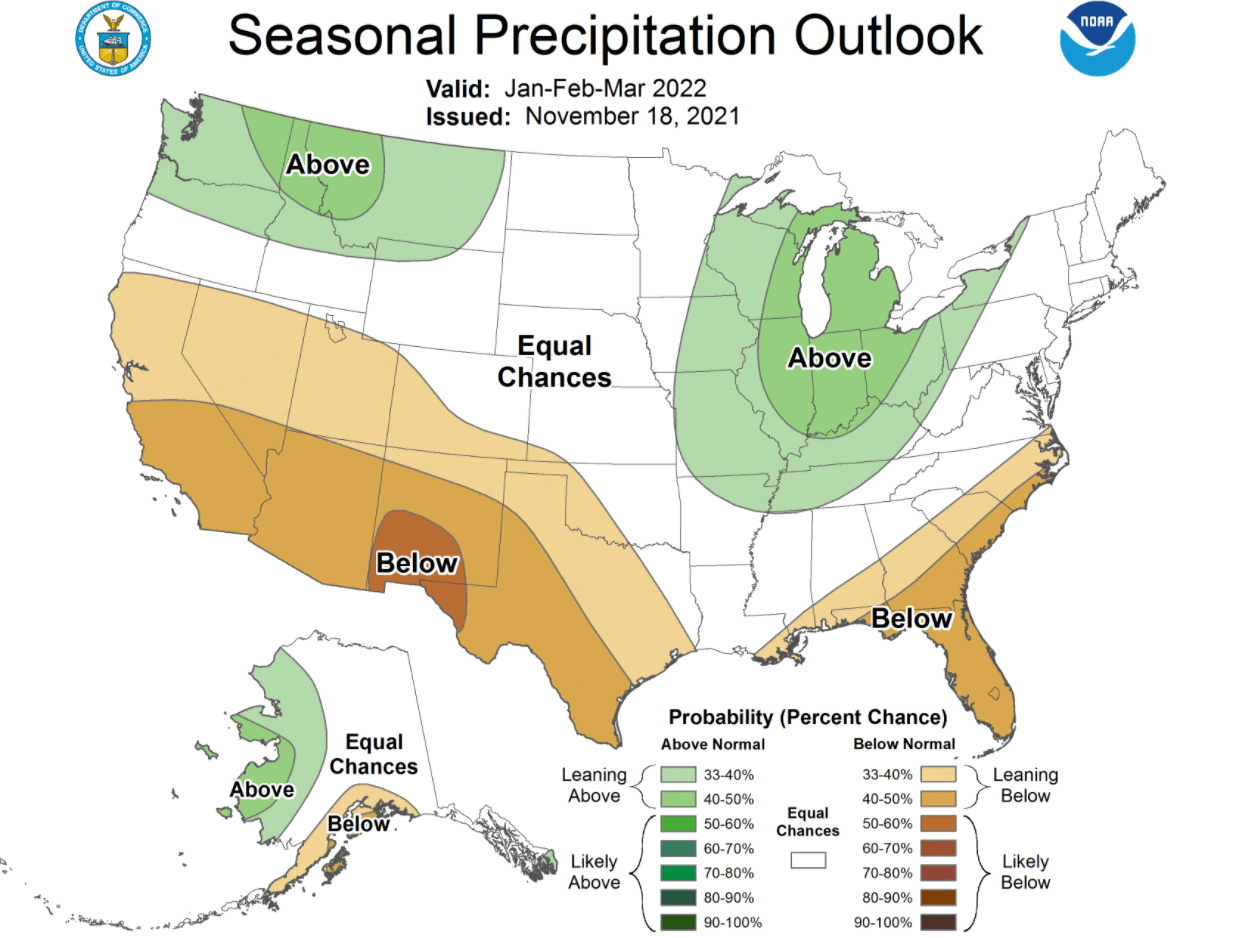
The official precipitation forecast also supports the models above. We see an equal-to-higher probability for more precipitation (and snowfall) in the northwestern and the northeastern United States. The Southern United States is forecast to have a drier than normal start of the new year.
We will release regular weekly and monthly updates during the winter season as fresh forecasts and data are available. So make sure to bookmark our page. Also, if you have seen this article in the Google App (Discover) feed, click the like button (♥) there to see more of our forecasts and our latest articles on weather and nature in general.
SEE ALSO: