The Atlantic Ocean is one of the global areas that greatly affect the weather and climate in the United States and Europe. In the past weeks, unusual temperature anomalies were detected in the subtropical North Atlantic Ocean. This part of the ocean is known to have an important connection to the Atlantic hurricane season and the other weather seasons ahead.
Global weather is in a constant flow, connected through space and time. Using satellites, we can track the motion of clouds and pressure systems worldwide. This motion is caused by pressure changes and winds, which are crucial in the connection between the oceans and the atmosphere.
We will look at the latest ocean anomalies in the North Atlantic. Also, we will try to find historical signals to help us understand how these anomalies will likely affect the seasonal weather ahead. But first, we must understand what drives these ocean temperature anomalies.
PRESSURE AND WINDS
Across the world, there are many different regions with persistent prevailing winds. The most important ones are likely the trade winds.
Trade winds are the prevailing easterly winds that circle the Earth near the equator. They are stronger and more consistent over the oceans than over the land. As a result, trade winds often produce partly cloudy sky conditions characterized by shallow cumulus clouds and stable weather.
The trade winds were named by the crews of sailing ships that depended on the winds during westward ocean trade crossings.
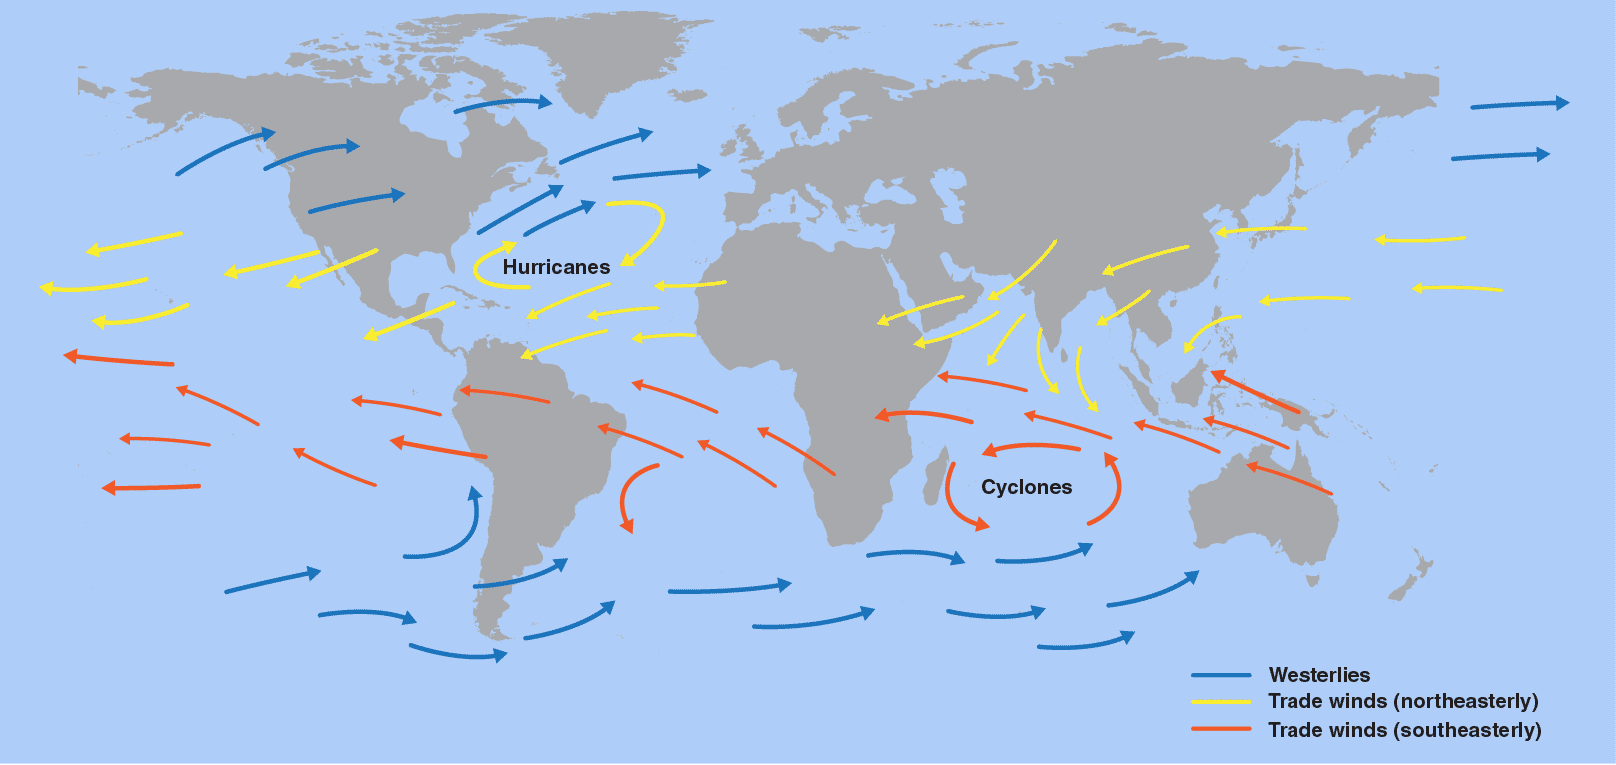
In the image below, you can see the global surface wind patterns, with global trade winds in yellow and red. In the North Atlantic, the circulation pattern is clockwise, as a high-pressure system is present in that region.
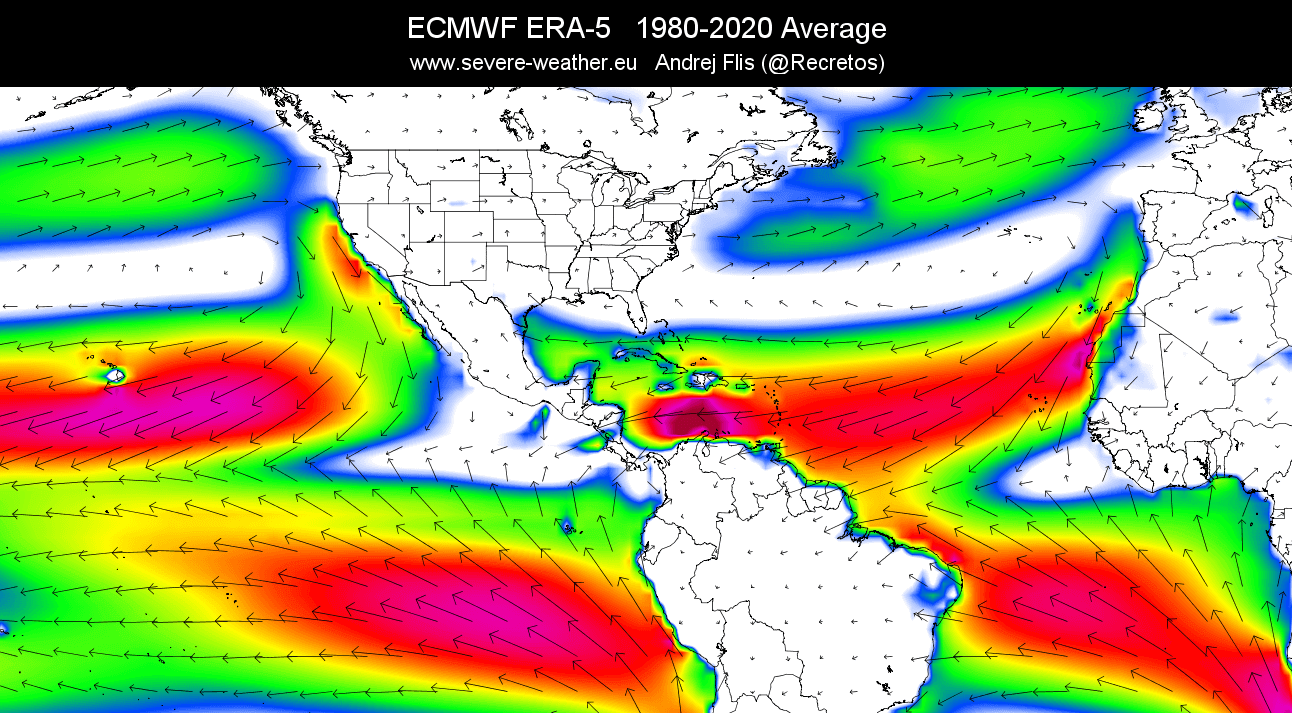
Below you can see an image that shows the actual average surface winds from the past 40 years. This nicely reveals the prevailing easterly trade winds across the subtropical and tropical North Atlantic. You can also see the clockwise circulation in the North Atlantic.
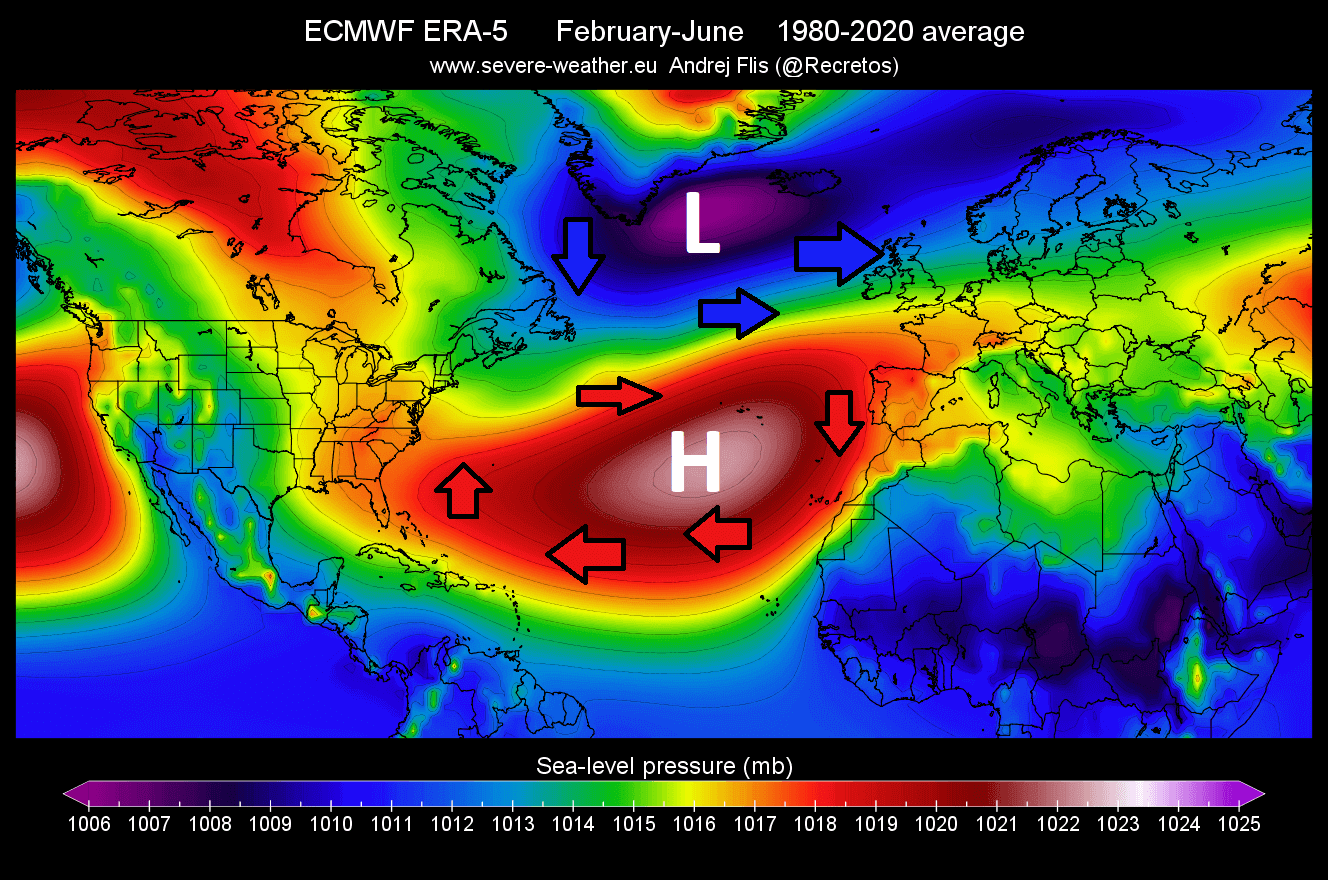
We produced another 40-year average, this time for sea level pressure. The data reveals a persistent high-pressure system in the subtropical North Atlantic. There is a low-pressure dominant in the subpolar North Atlantic. This helps explain the trade winds’ direction, as a high-pressure system spins clockwise.
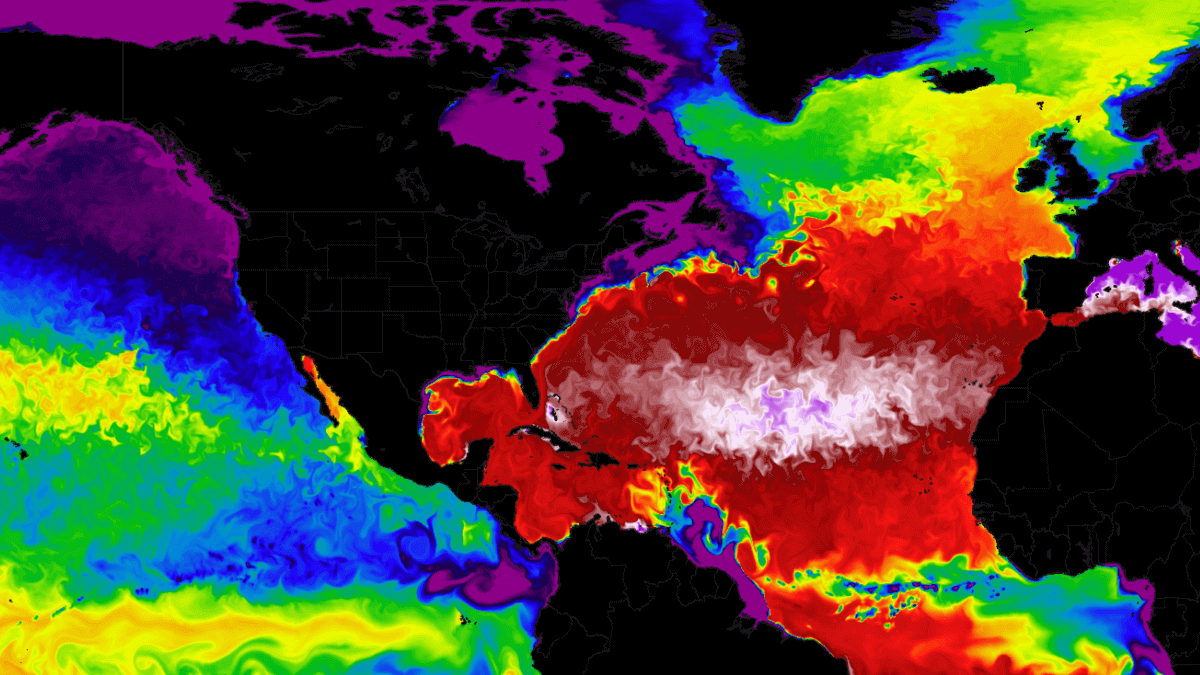
To show a practical example, we produced a high-resolution video that shows the Atlantic Ocean temperature anomalies from Winter to Spring. Notice the ocean area from the southeast United States to Western Europe. There you can see fast changes in temperature anomalies due to the changes in the strength of the trade winds. Especially noticeable is the warmup from April into May.
So to recap, the trade winds are easterly/northeasterly winds. As they blow across the ocean, they typically cool the ocean’s surface by bringing the deeper, colder water to upwell to the ocean’s surface. But weaker trade winds (or westerly winds) can mean the opposite, leaving calmer waters with less mixing, allowing the ocean temperatures to rise.
Such a case is currently active in the North Atlantic, with weaker trade winds, pushing the ocean temperatures to record highest for this time of year.
UNUSUAL ANOMALIES ACROSS THE OCEAN
Before going into the latest ocean development, we must know what an anomaly means. In simple terms, it means a deviation from the norm or a deviation from the average.
When it comes to oceans or weather, a temperature anomaly means that the temperature is either higher or lower than it should be for that time of year.
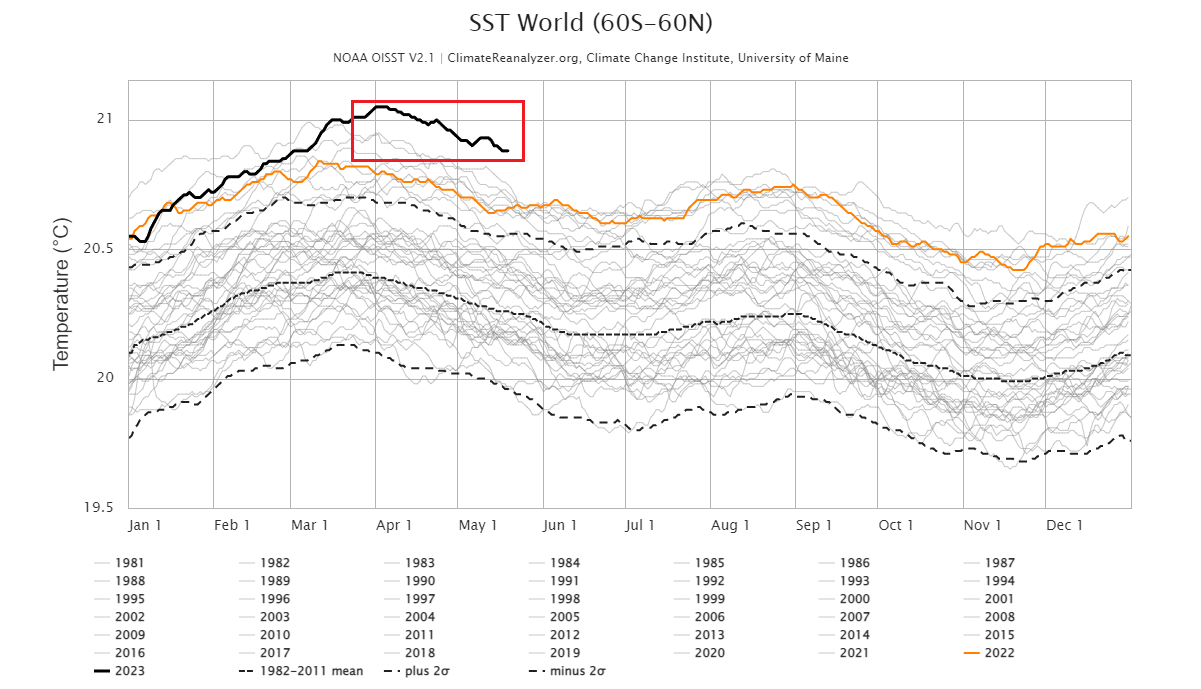
The graph below from Climateanalyzer shows the temperature anomalies for the North Atlantic. The black line is the year 2023 so far. You can see that the ocean temperatures are running way higher than normal for this time of year, being the highest ever in known satellite observation.
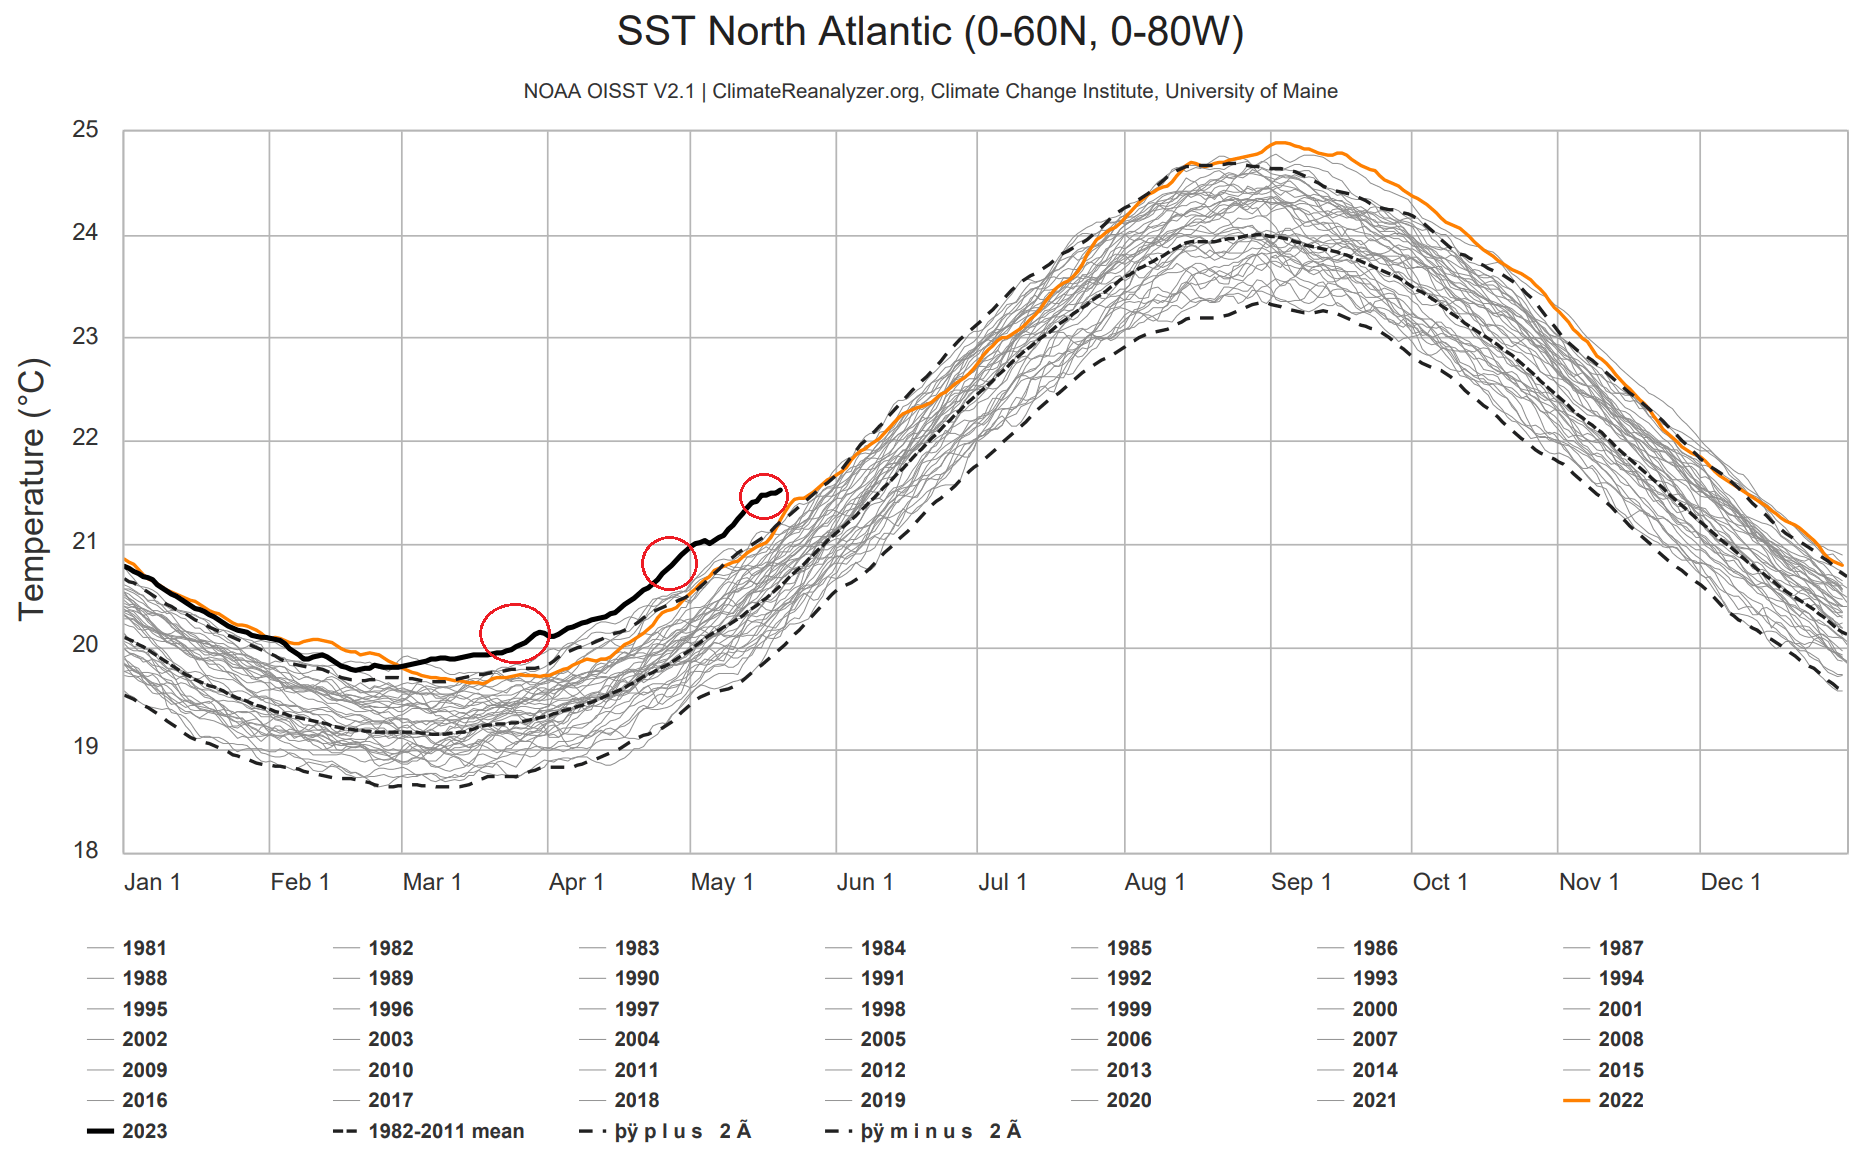
You can see three marked areas on the graph. Those are temperature peaks in March, April, and May. We will quickly recap what happened in those peaks and how the atmosphere helped to drive the trade winds and ocean temperatures.
In early Spring, we saw strong pressure changes starting across the North Atlantic, linked to higher atmospheric processes. The image below shows the pressure anomaly in mid-March. You can see a blocking high over eastern Canada and southwestern Europe.
A broad low-pressure zone expanded over the United States, with a strong low-pressure anomaly over the Atlantic. As the low-pressure system spins counter-clockwise, this powered westerly winds across the subtropical Atlantic. And westerly winds are opposite to trade winds, meaning warming rather than cooling.
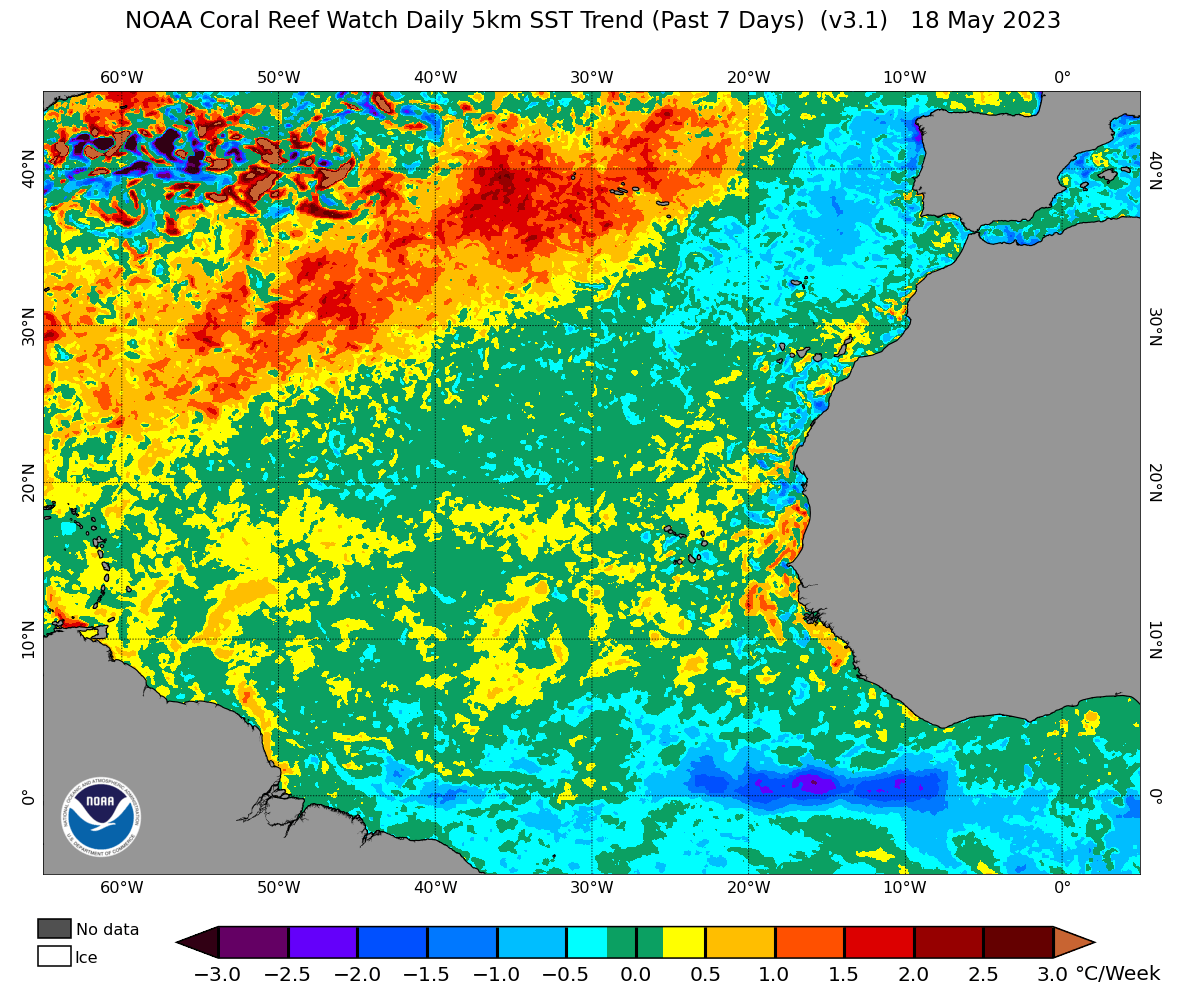
Below is an ocean analysis for the North Atlantic, showing 7-day temperature trends. It reveals ocean surface temperature changes. You can see a broad area of warming ocean across much of the subtropics, driven by the anomalously weak trade winds.

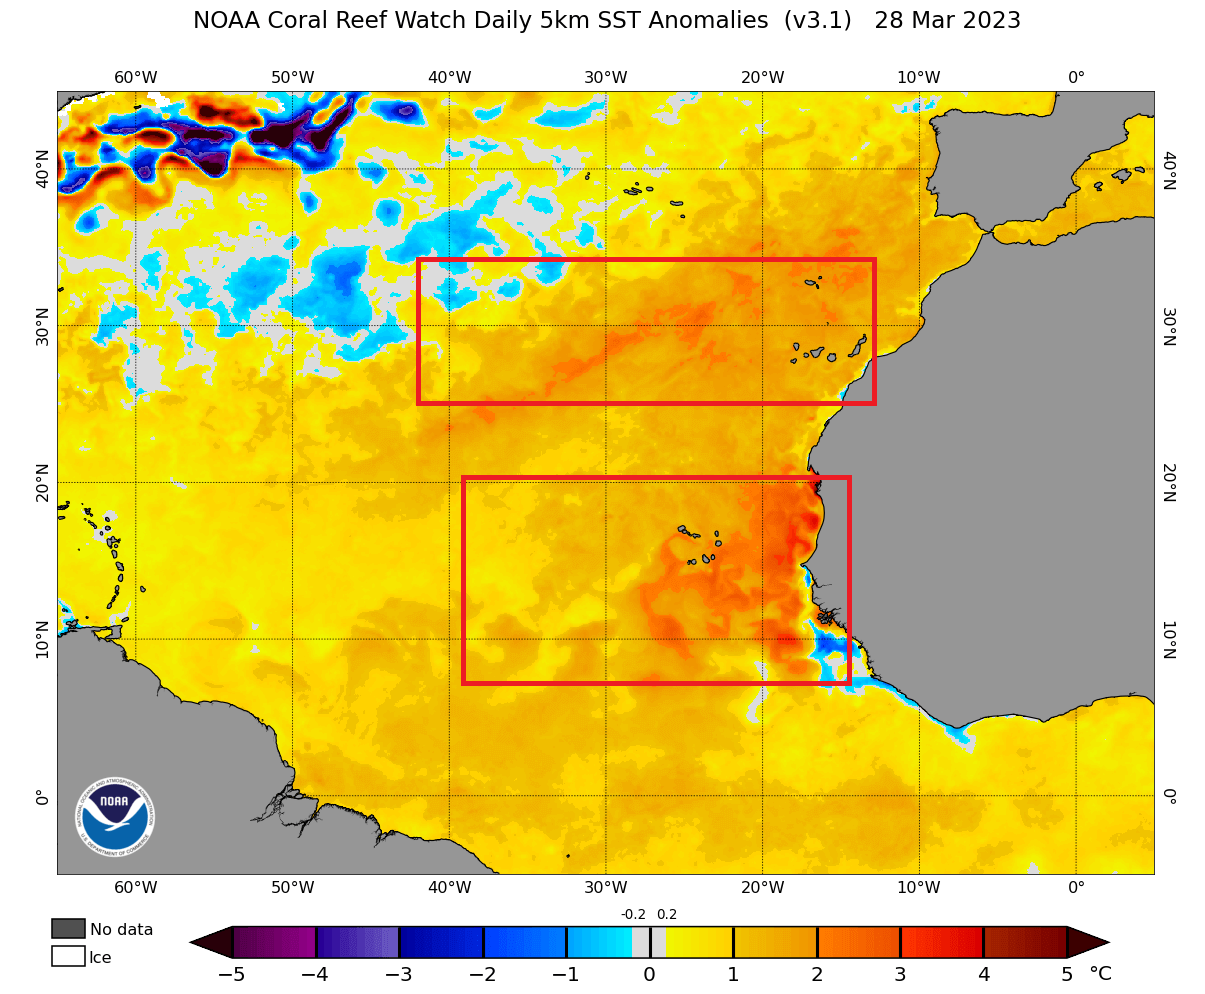
The final ocean surface anomalies for late March show two ocean “hotspots” developed. One area was around Cape Verde, and one further to the north. The peak anomalies in this period already exceeded 4 degrees Celsius.
In April, the pressure pattern persisted. Eastern Canada and Greenland were still under a high-pressure blocking system. That produced a pressure drop over the eastern United States and even more over the Atlantic.
Winds are driven by the changes in air pressure, which meant that even stronger westerly wind anomalies were developing across the North Atlantic.
This is best seen in the 7-day ocean temperature changes image below, focused on late April. You can see a strong and obvious ocean warming streak across the North Atlantic. This is directly in line with the strong westerly wind anomalies, warming the ocean surface.
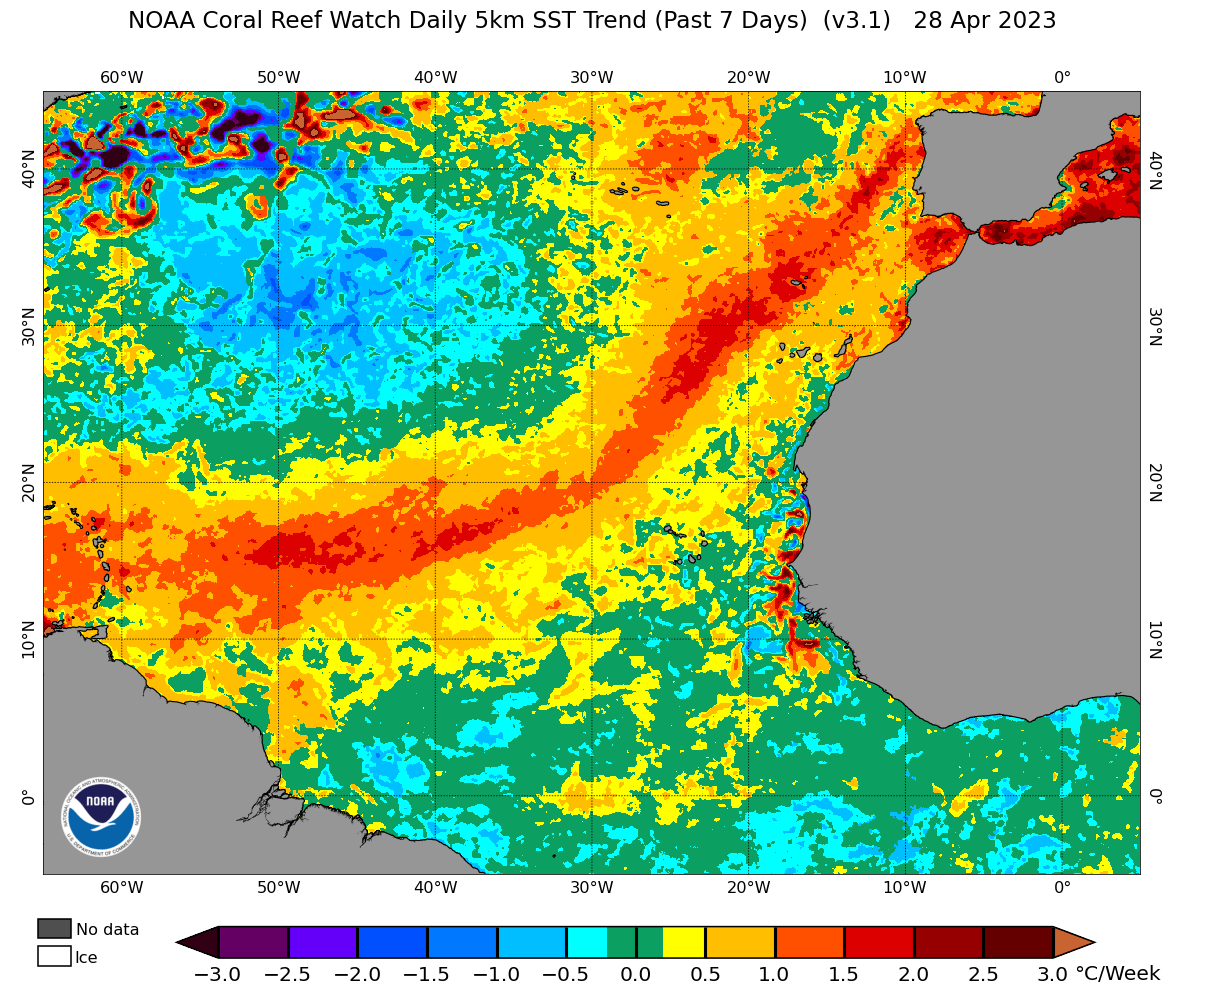
Looking at the final ocean temperature anomalies below, you can see the two warming areas expanding. The Cape Verde anomaly expanded to the west, while the northern area expanded further to the North. Anomalies were not much stronger than in March, but they expanded, now covering a larger area.
The expansion of strong ocean anomalies has produced a record-high temperature peak in the North Atlantic, as seen in the earlier graph. But below, you can see the data from a reconstructed dataset, showing the April monthly data from 1850 to 2023.
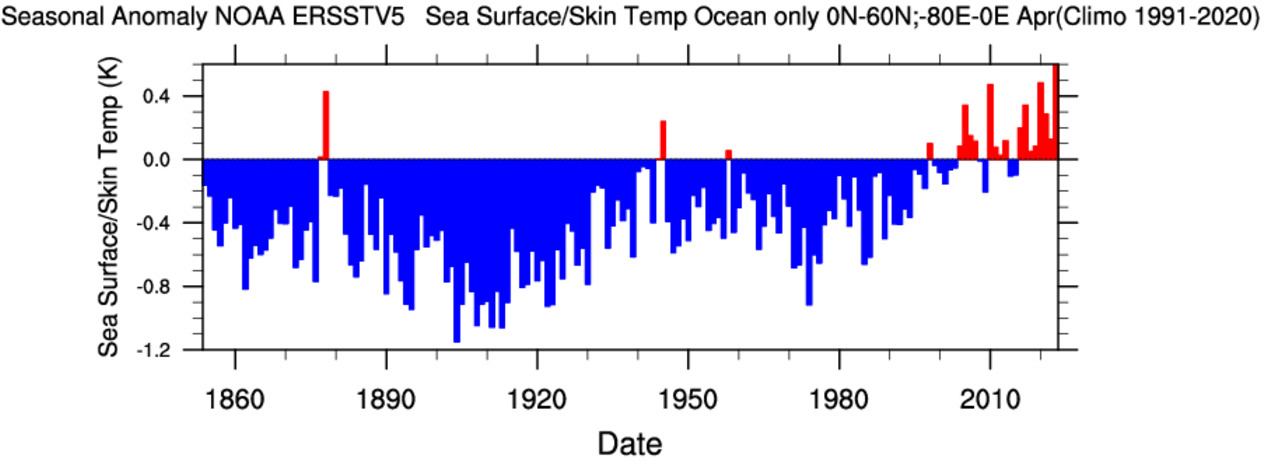
As you can see, based on reconstructed data going back over 170 years, there has not been an ocean anomaly as strong as in April across the North Atlantic. This graph is based on reconstructed data, which would need a separate article to explain how it is obtained.
But it is safe to say it is good enough to have a historical context of the real scale of these ocean anomalies currently ongoing.
LATEST OCEAN DATA
Looking at the atmospheric data for early May, you can see low-pressure dominance continuing across the eastern United States and the Atlantic. The difference is that the low-pressure zone is moving slightly to the north. And a high-pressure area is returning to the subtropics.
The ocean temperature response was also stronger to the north, seen in the image below, showing the 7-day surface temperature change. Again, a large swath of ocean warming is to the north, while you can still see some temperature increase across the so-called MDR (Main Development Region).
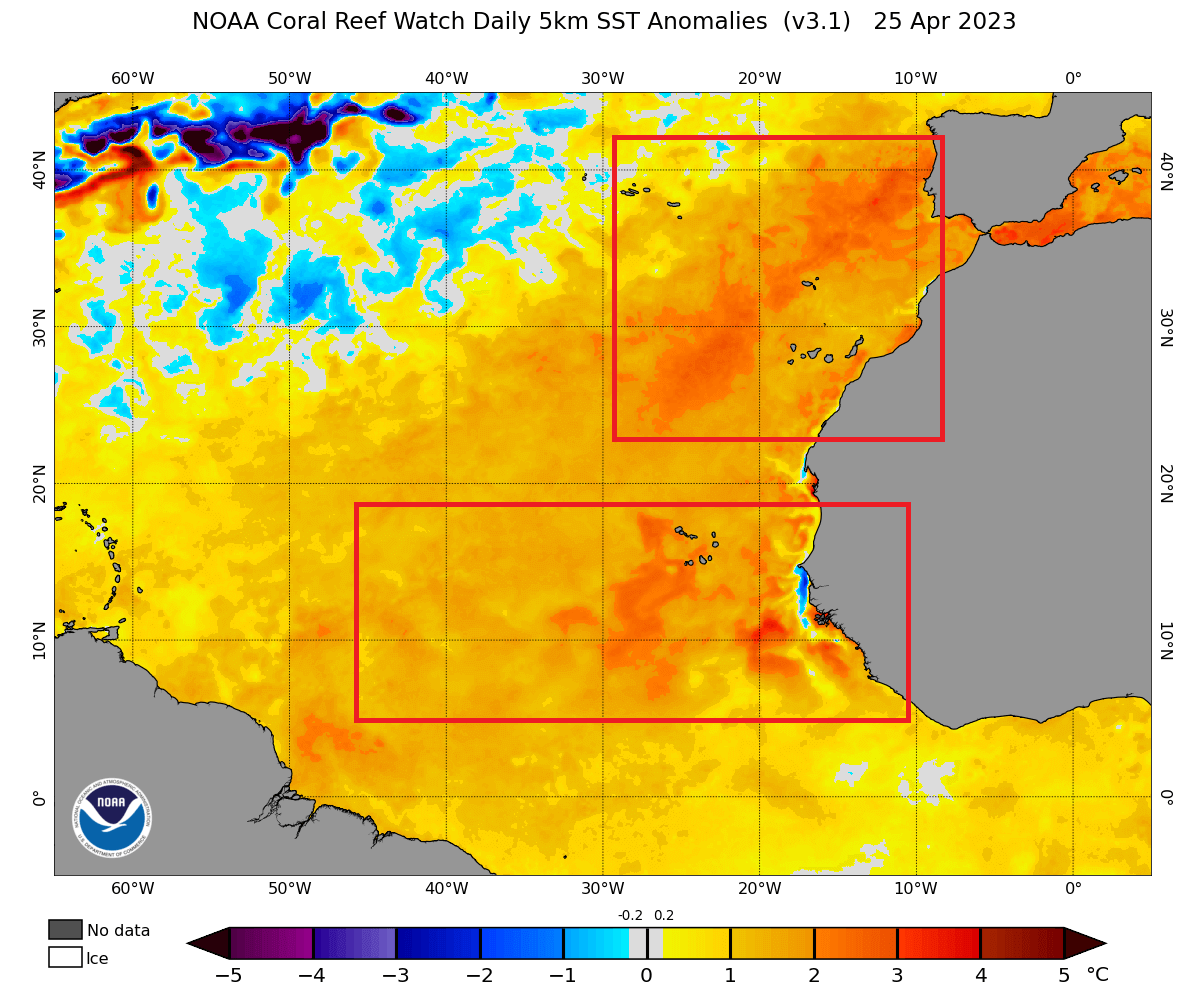
The Main Development Region (MDR) got its name from the Hurricane season, as seen marked in the image below. It is where tropical systems form and strengthen during the Hurricane Season. That is why this is monitored more closely, as warmer oceans provide more energy for developing tropical storms.
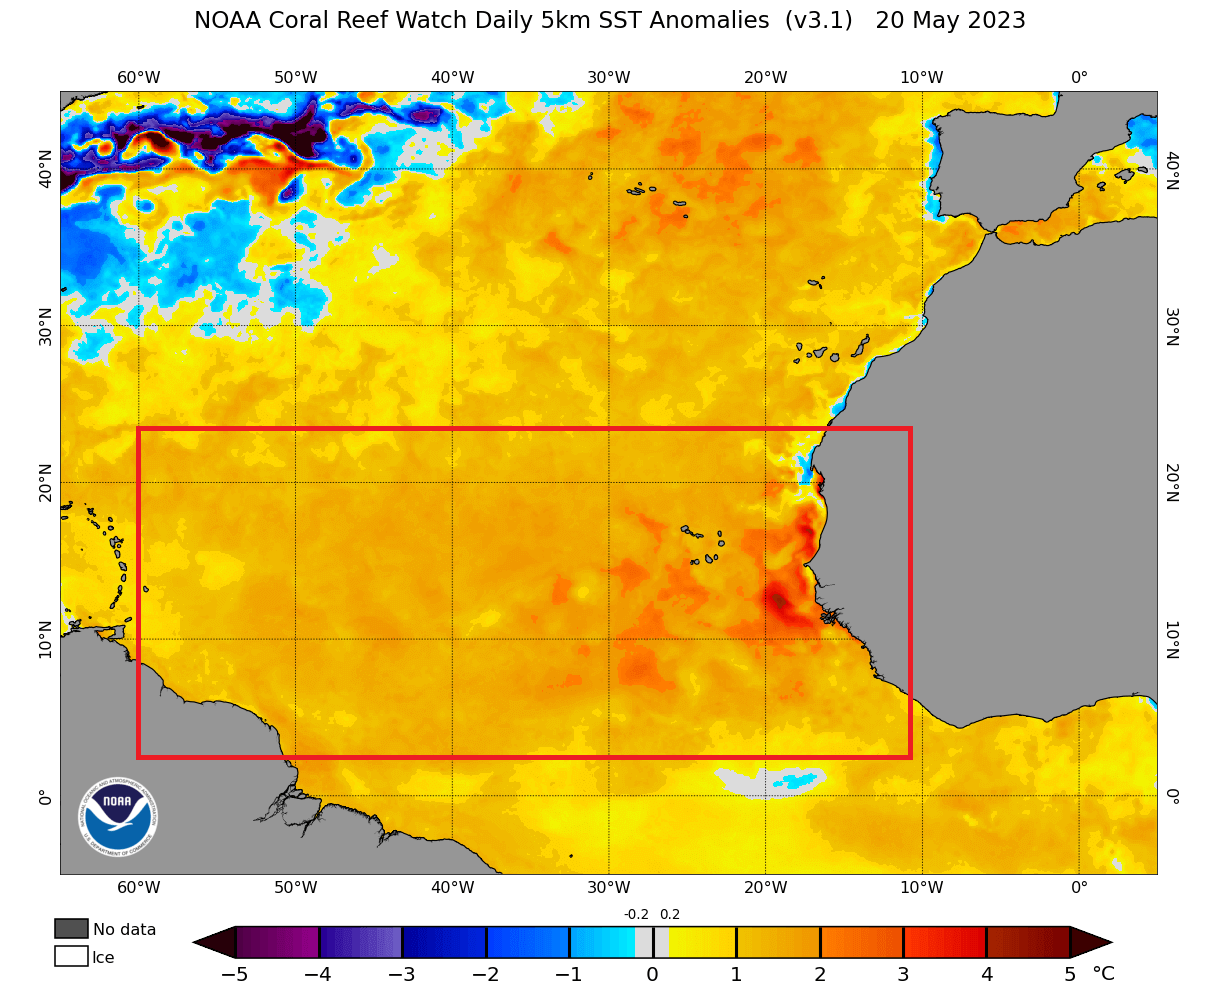
As you can see in the analysis above, the MDR is much warmer than normal. Peak anomalies are currently exceeding 4 degrees Celsius, focused around Cape Verde.
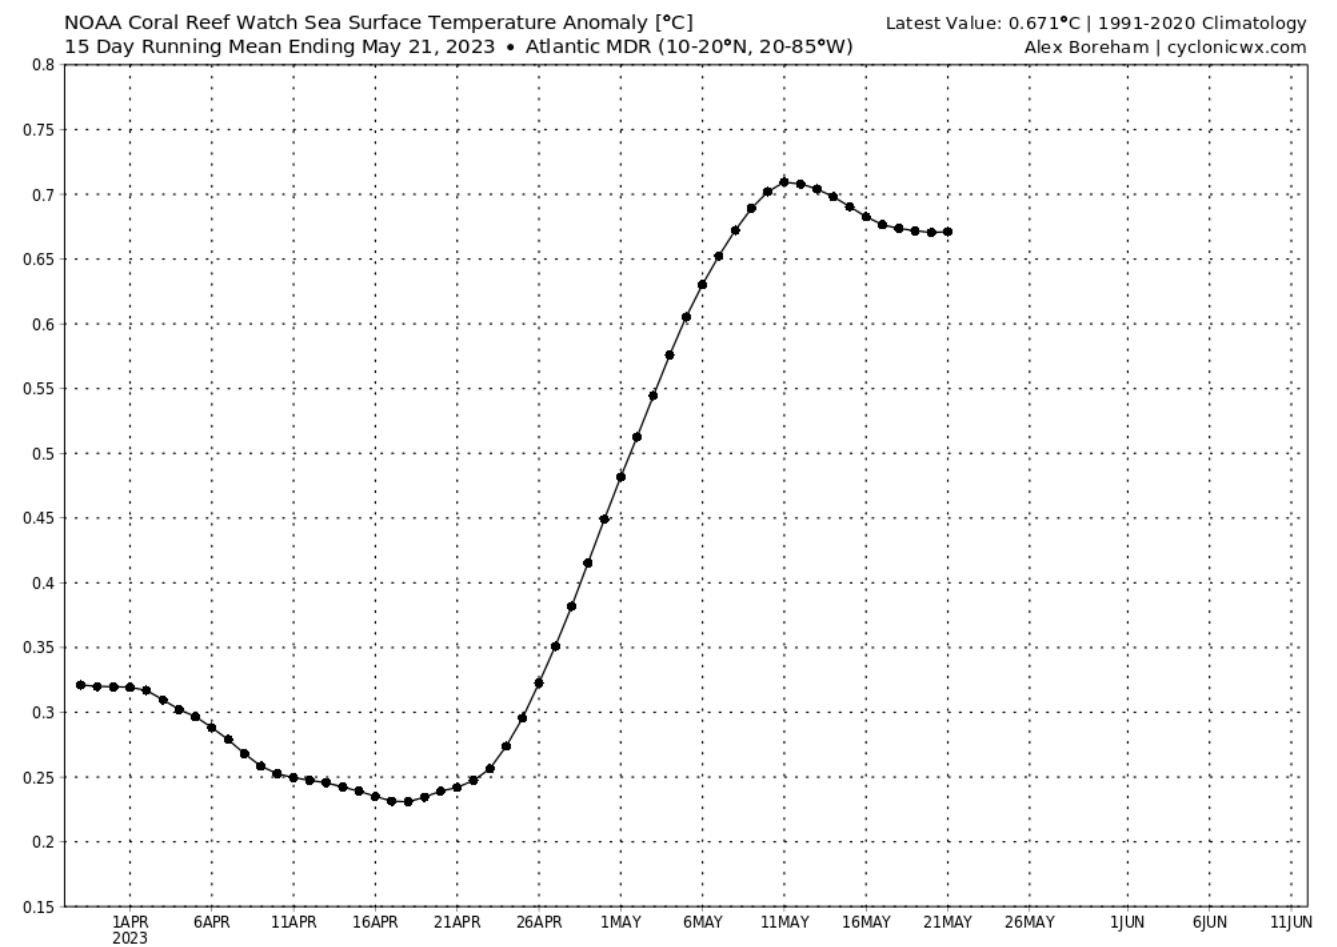
The graph below by Alex Boreham shows the temperature anomaly progression in the MDR zone, showing a fast and steady temperature increase since late April.
But the record high ocean temperatures are not only detected in the North Atlantic Ocean. Looking at the global ocean temperature anomaly map below, you can see many hotspots across the global oceans.
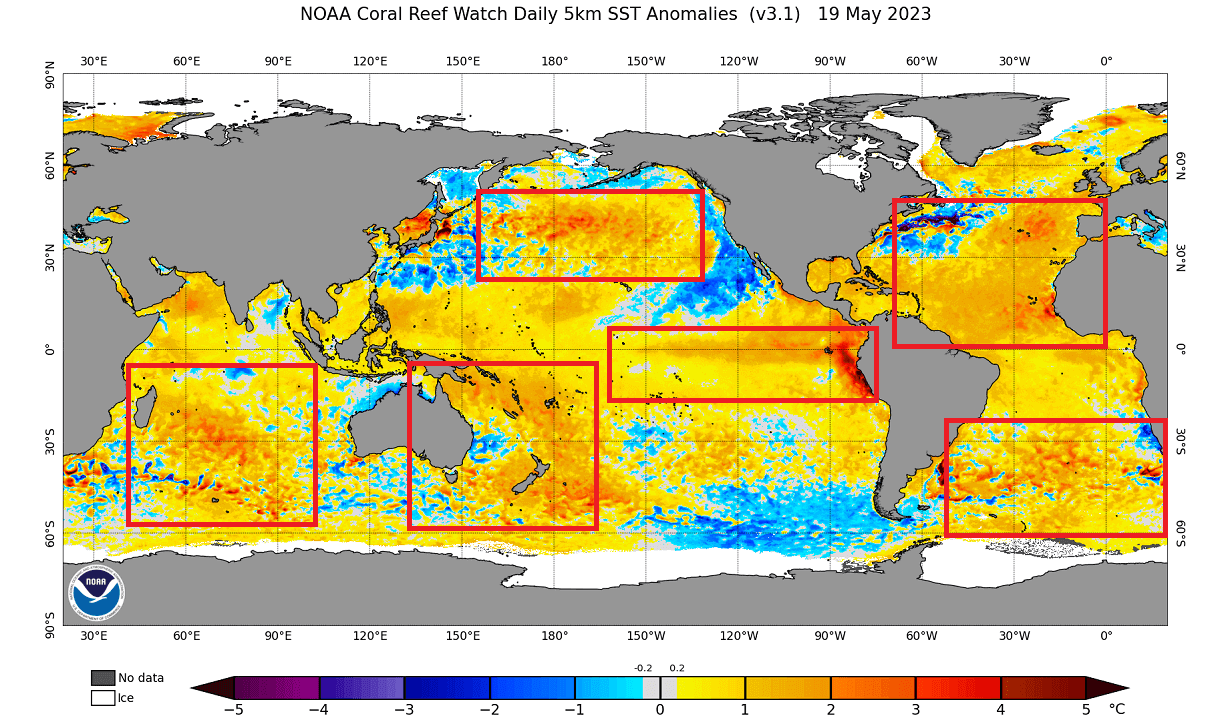
We can see some cold ocean anomalies too. But in the global picture, the ocean hotspots do prevail. And you can see in the graph below that the global oceans are currently running at record high levels, not seen at least in the satellite era (since 1980).
Before we go on to the potential impacts of these unusually strong ocean anomalies, we have to look at the latest forecast and what it shows for the North Atlantic development.
ATLANTIC OCEAN FORECAST
Forecasting ocean temperatures is not an easy task. However, because the connection between the ocean and the atmosphere is so strong, it is crucial to have a good weather forecast before models can calculate the oceanic response.
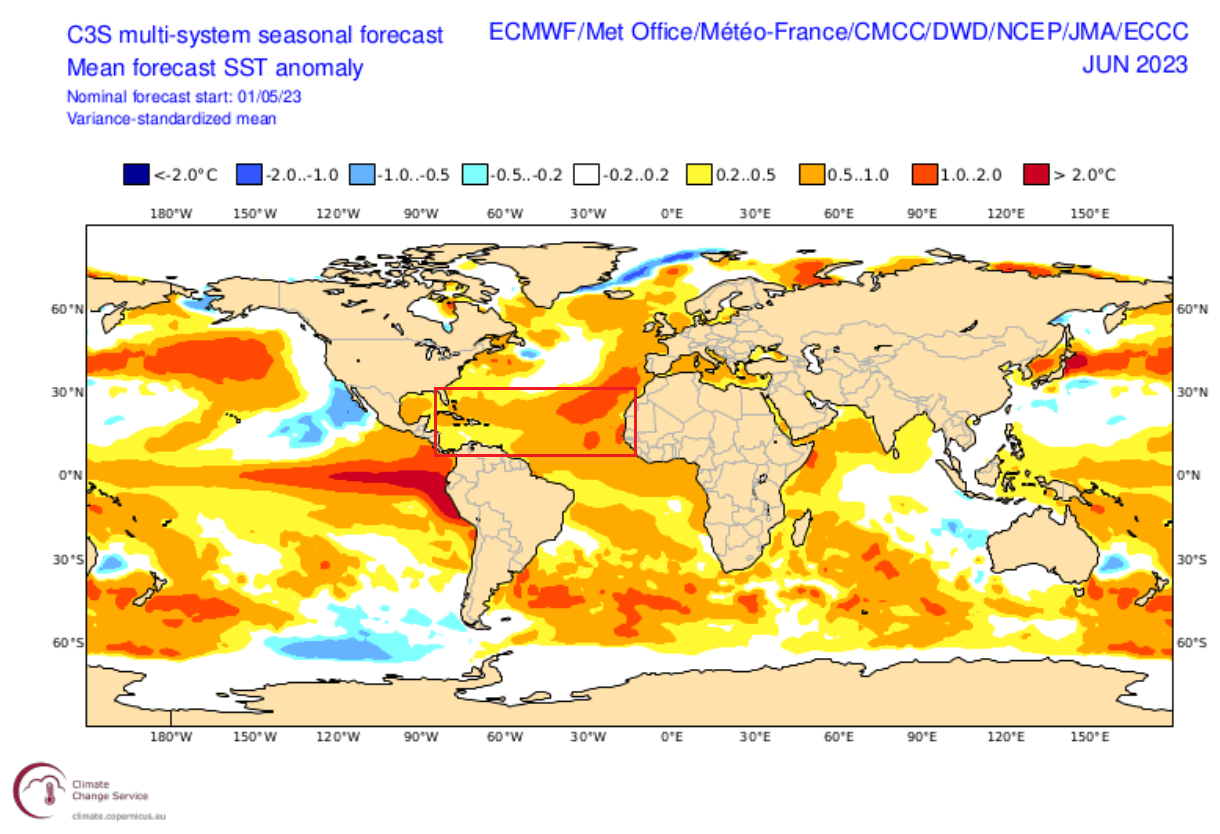
Below is an ocean anomaly forecast for June, combined with several different global long-range forecasting systems. You can see the strong anomalies across the Atlantic continuing, keeping the main development region (MDR) much warmer than normal.
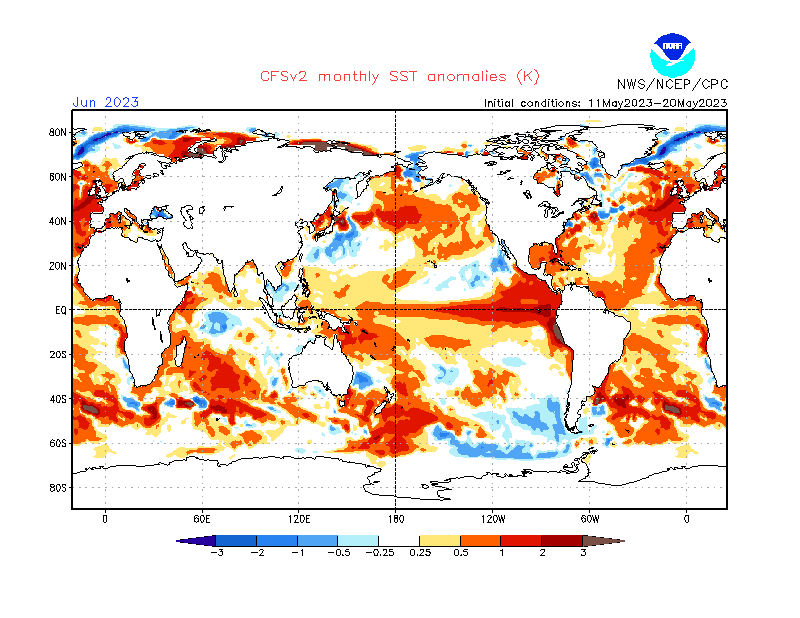
The same solution can be seen in the forecast by the CFS model, run and developed by the NOAA/NCEP in the United States. So you can see a much warmer North Atlantic in June and, of course, across the MDR as well.
So, what do these warm anomalies actually mean for future weather development? The most immediate effect that we can find in the historical data would be the Atlantic Hurricane Season.
ATLANTIC OCEAN AND HURRICANES
As the weather and winds can influence the ocean, so does the ocean influence the weather. Oceans hold a lot of energy, which can be used by weather systems and pressure patterns. The most obvious direct weather influence of the ocean is on the tropical systems.
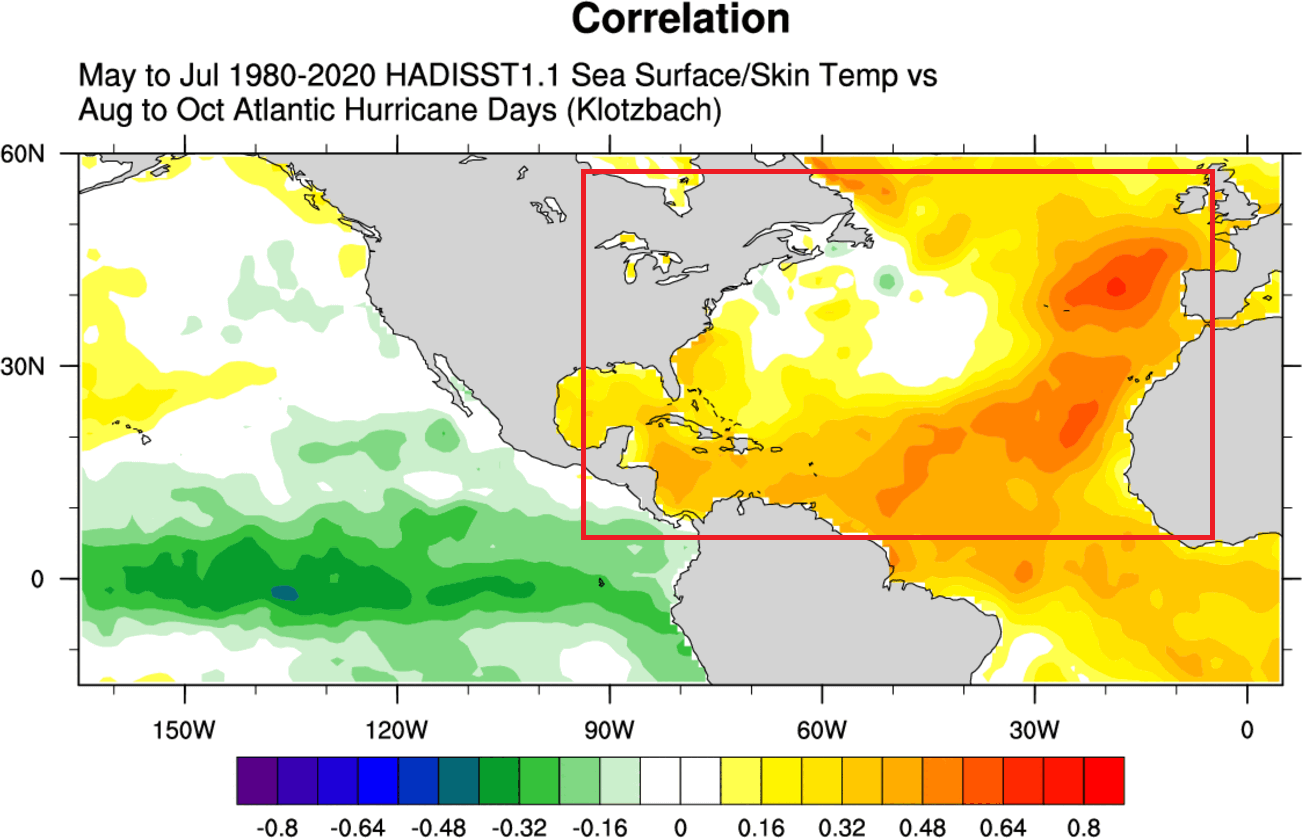
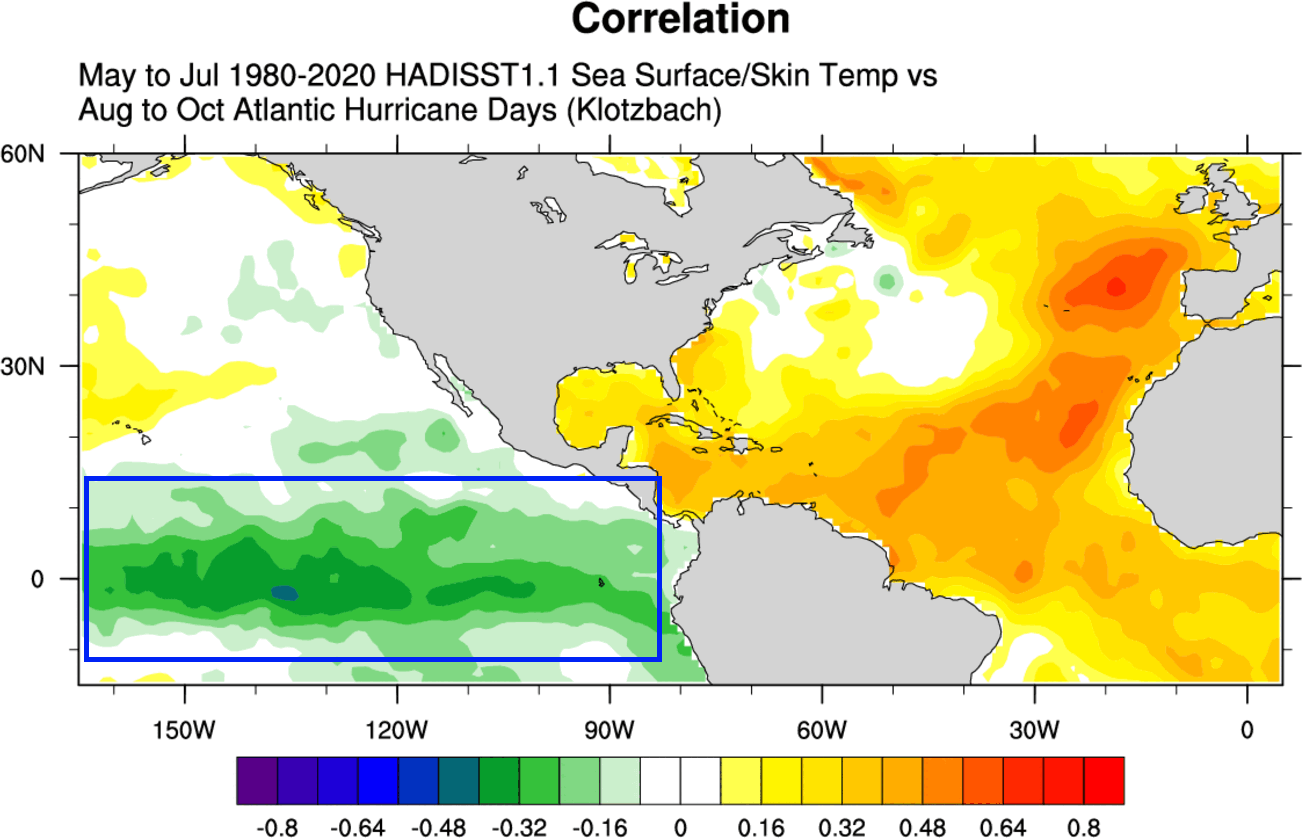
Below is an interesting graphic that shows the correlation/connection between the spring ocean temperatures and the energy of the following Atlantic hurricane season.
The image shows the spring ocean temperatures corresponding to the more active hurricane season. What stands out is, of course, the warmer tropical and subtropical North Atlantic Ocean. This is the exact same pattern that we currently have in the North Atlantic.
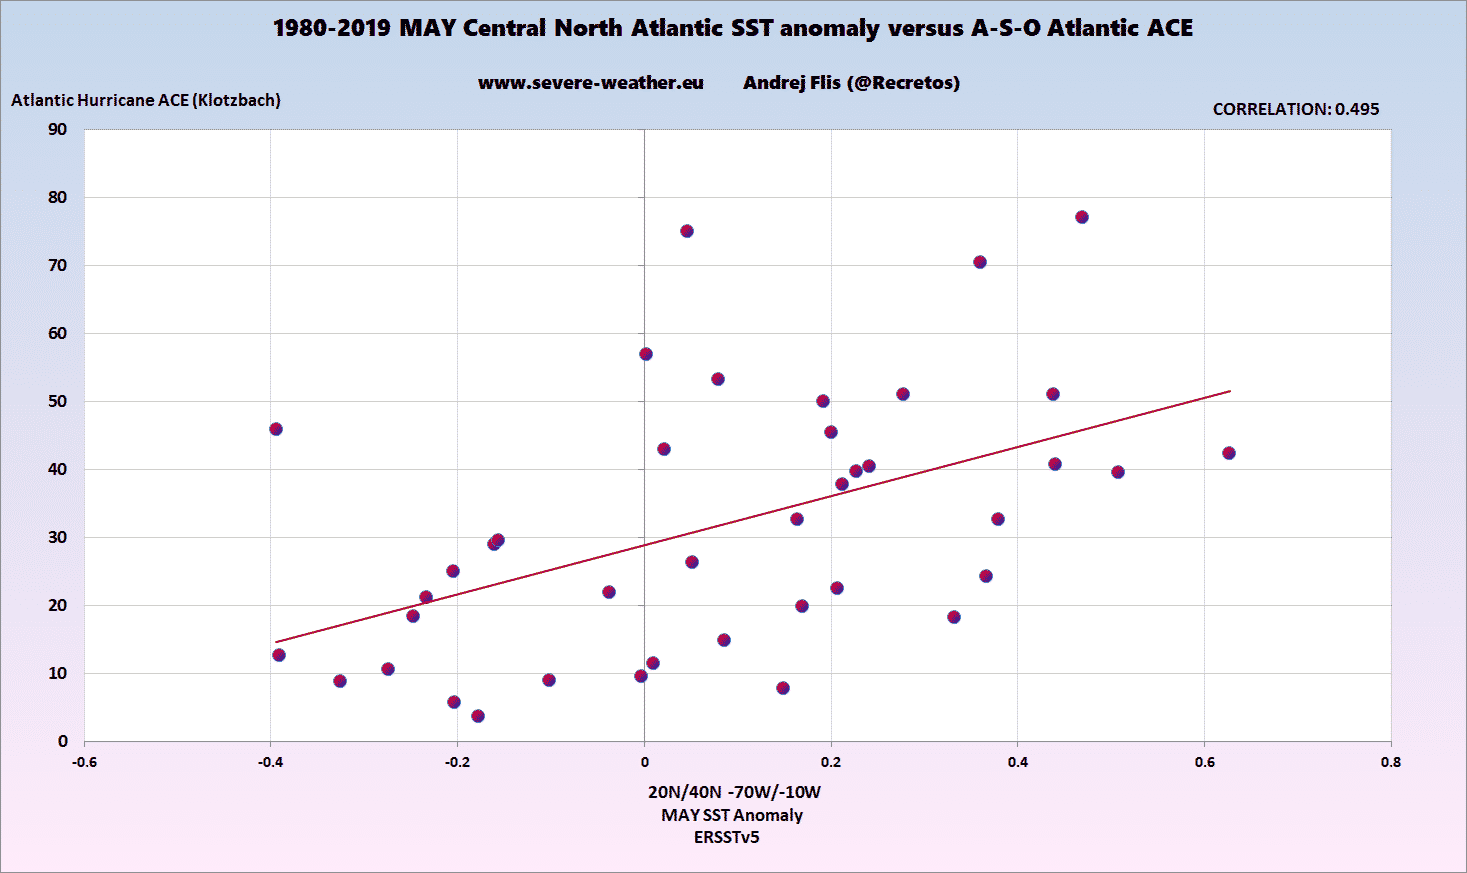
We produced two special graphics, which directly compare the May and June subtropical North Atlantic ocean temperatures with the hurricane season activity in the past 40 years. The bottom axis shows ocean temperature anomaly, and the vertical axis shows the Atlantic ACE index, which is an index of total hurricane energy released.
The first image shows the May ocean temperatures. You can see that the more we go to the right (warmer spring ocean), the more the Atlantic hurricane energy increases in the following season. This corresponds to more storms or stronger storms. Each dot represents one year or one season.
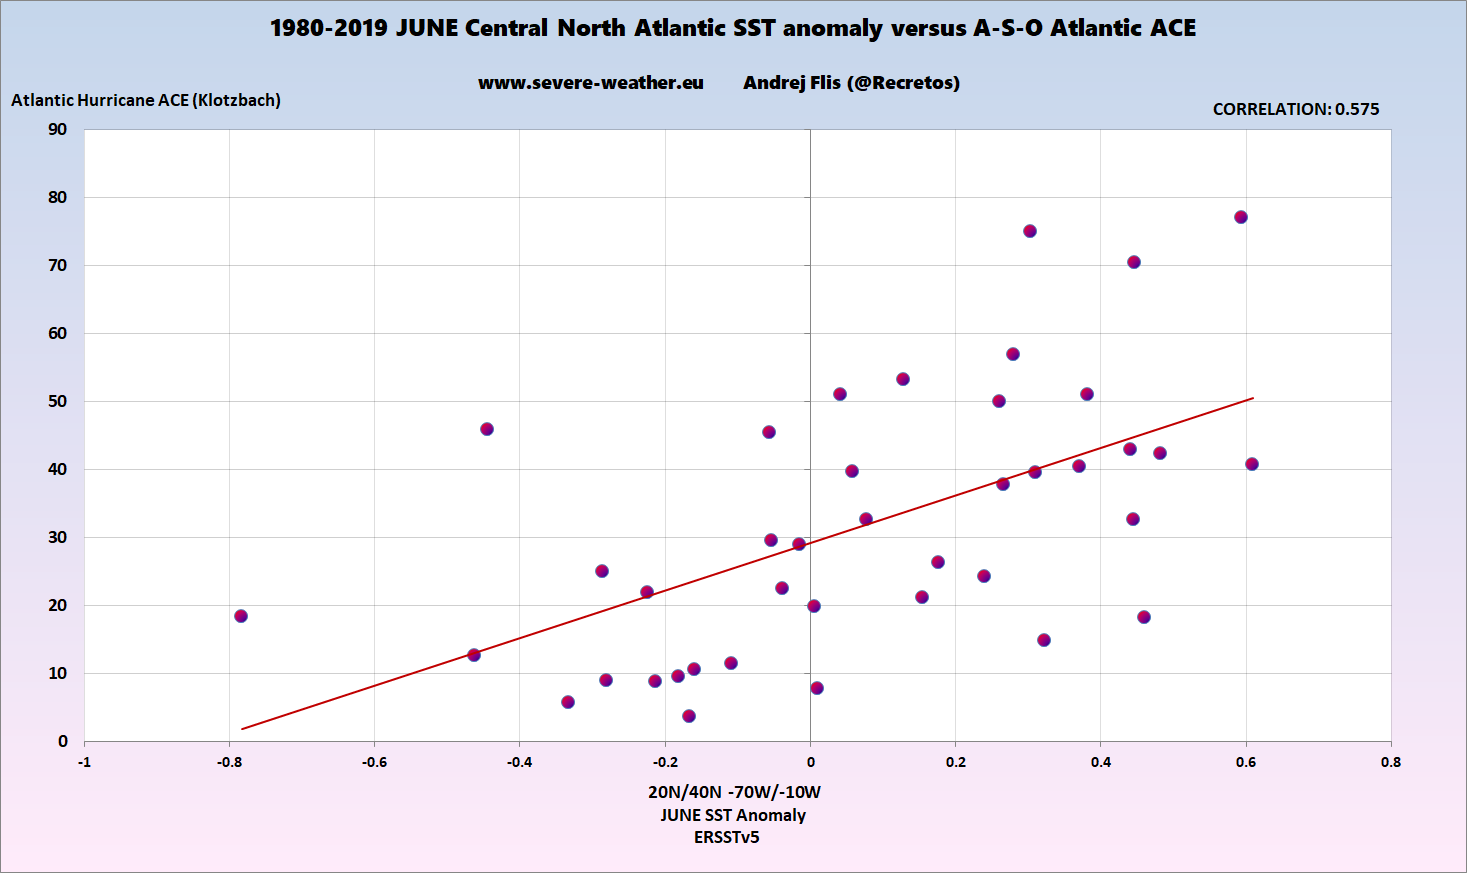
The second image shows the relationship between the June ocean temperatures and the hurricane season. Here, the relationship is perhaps even more obvious. Warmer than normal June subtropical Atlantic is now a strong signal for more or stronger storms.
The reason for this connection is perhaps quite simple. As the oceans get warmer than normal in Spring and into summer, they will likely stay warmer into Autumn. It is harder to massively cool down the entire tropical and subtropical ocean in summer.
Warmer oceans provide more available energy for the tropical systems and can cause stronger storms if other factors allow it. However, this does not mean that there will be more landfalls, as that depends on the overall pressure patterns and steering mechanisms.
So looking at the overall data and historical analysis, you can see that warm ocean waters in the North Atlantic help create bigger and stronger tropical systems. That is because if the oceans warm up significantly in Spring and early Summer, it’s hard to cool them down, providing more energy for the Hurricane season.
EL NINO INFLUENCE RISING
If we return to the ocean/hurricane correlation plot, notice the negative signal in the tropical Pacific. That is the negative ENSO signal, also known as the La Niña. That helps to support favorable atmospheric conditions over the tropical Atlantic Ocean for storms to intensify and last longer.
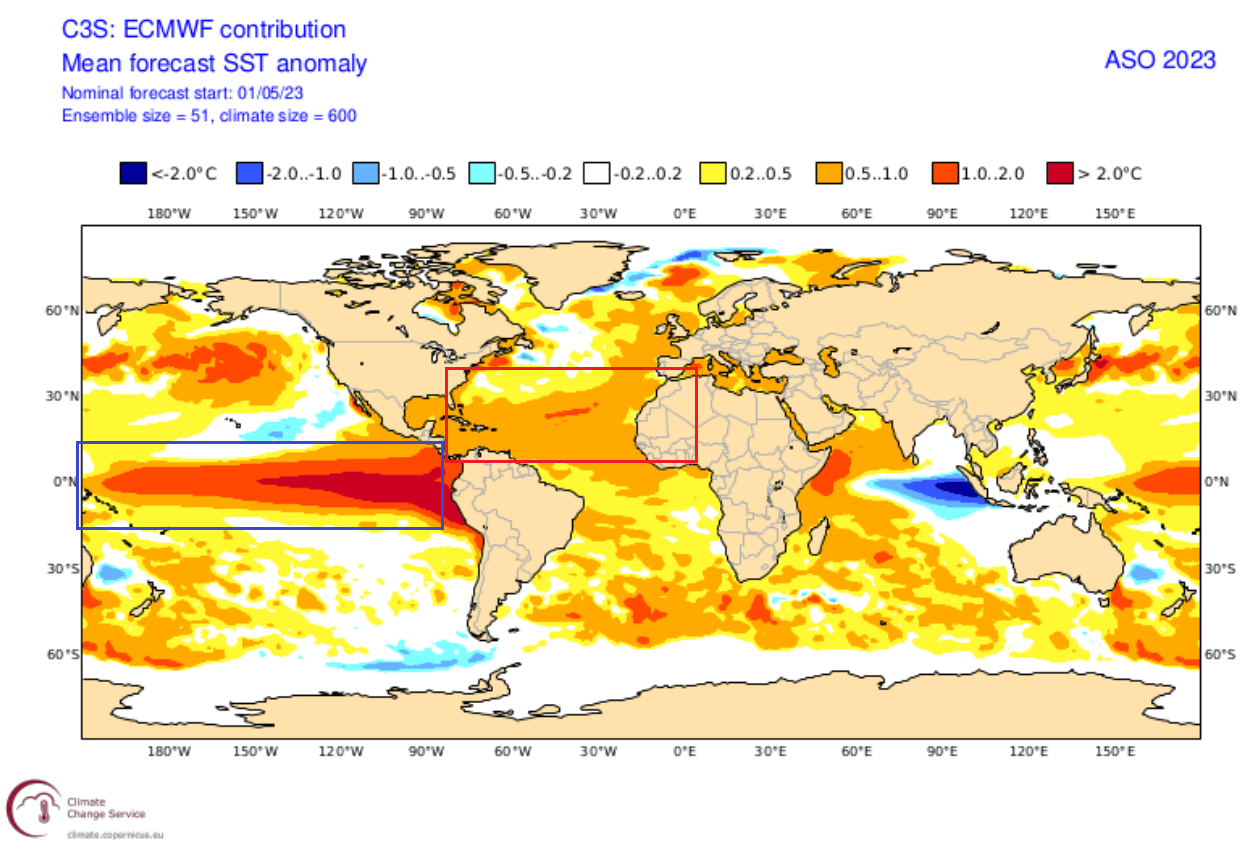
But below is the actual ocean temperature anomaly forecast for the peak of the hurricane season 2023. Again, you can see the same warm North Atlantic pattern. But the tropical Pacific is in a strong warm state, namely the El Niño 2023 event. This is the opposite of the signal that shows as favorable for more/stronger tropical storms.
Based on the available data, it is well known that an El Niño event reduces the number of Hurricanes and tropical systems overall in the Atlantic. The reason is stronger wind shear, preventing the storms from organizing and powering up.
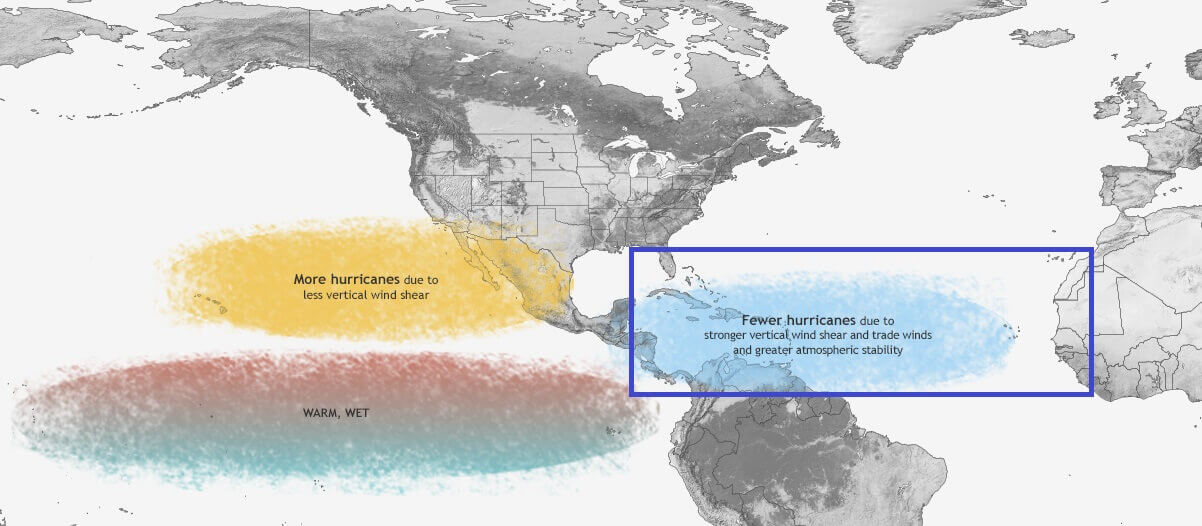
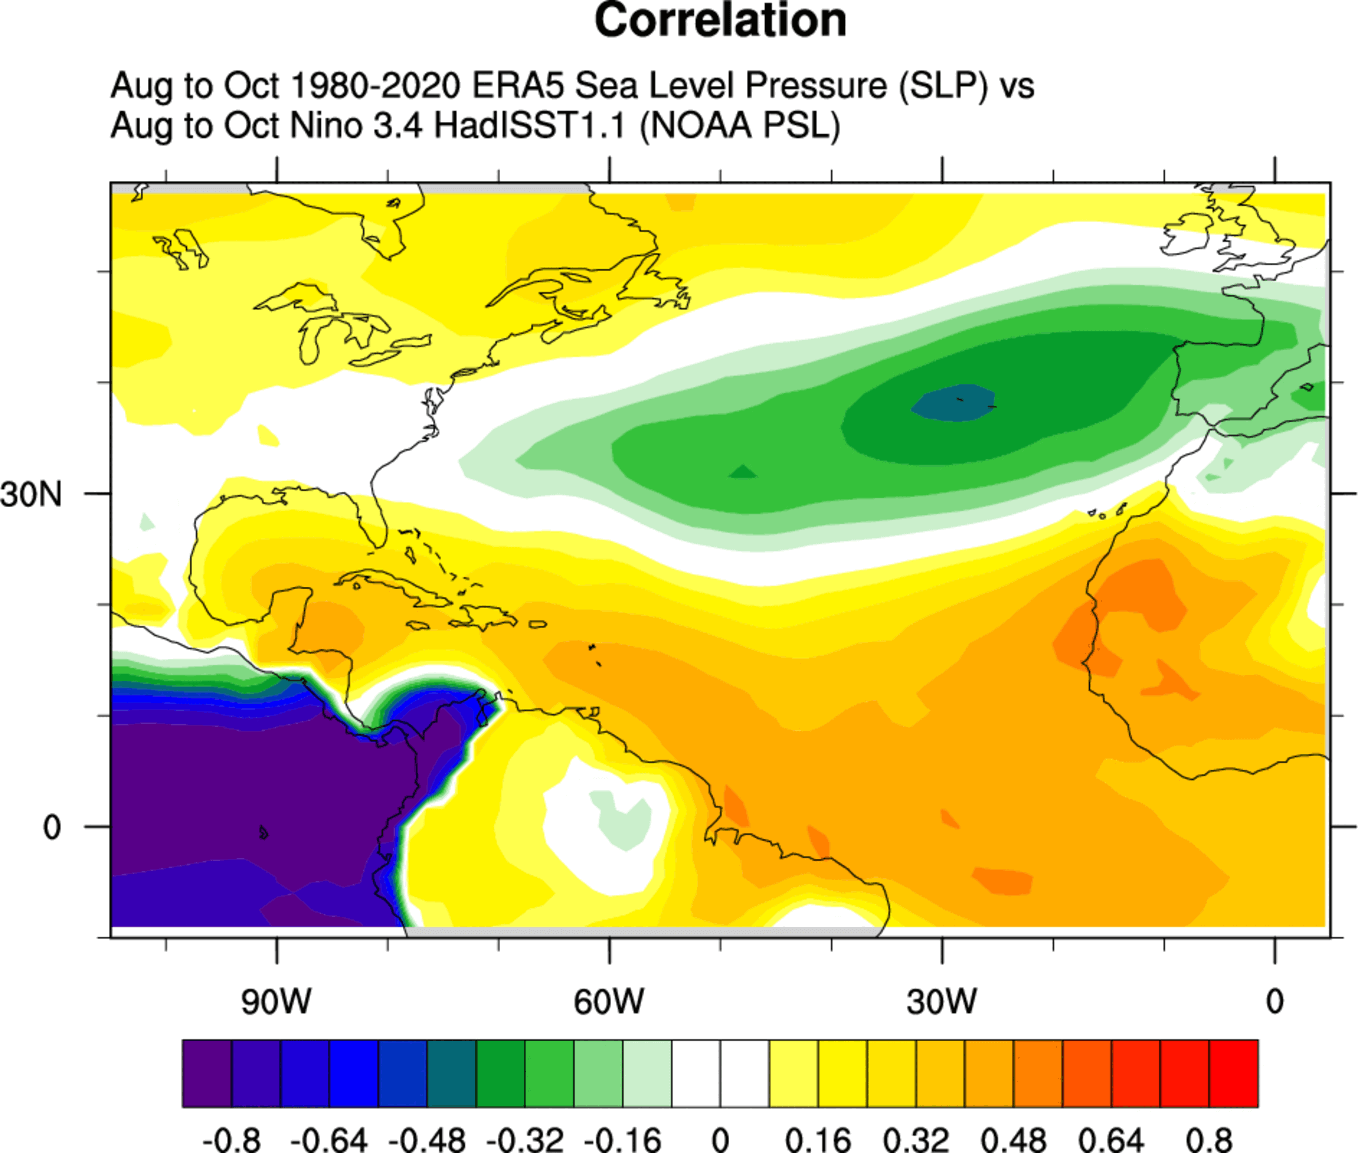
We produced a historical re-analysis of pressure trends during an El Niño event. As you can see, there is mostly higher pressure across the tropical Atlantic, right in the main development region of tropical systems.
Also, looking at precipitation, you can see much drier trends across most of the tropical storm regions. For example, during an El Niño hurricane season, the Gulf of Mexico, the Caribbean, and most of the tropical Atlantic are drier than normal.
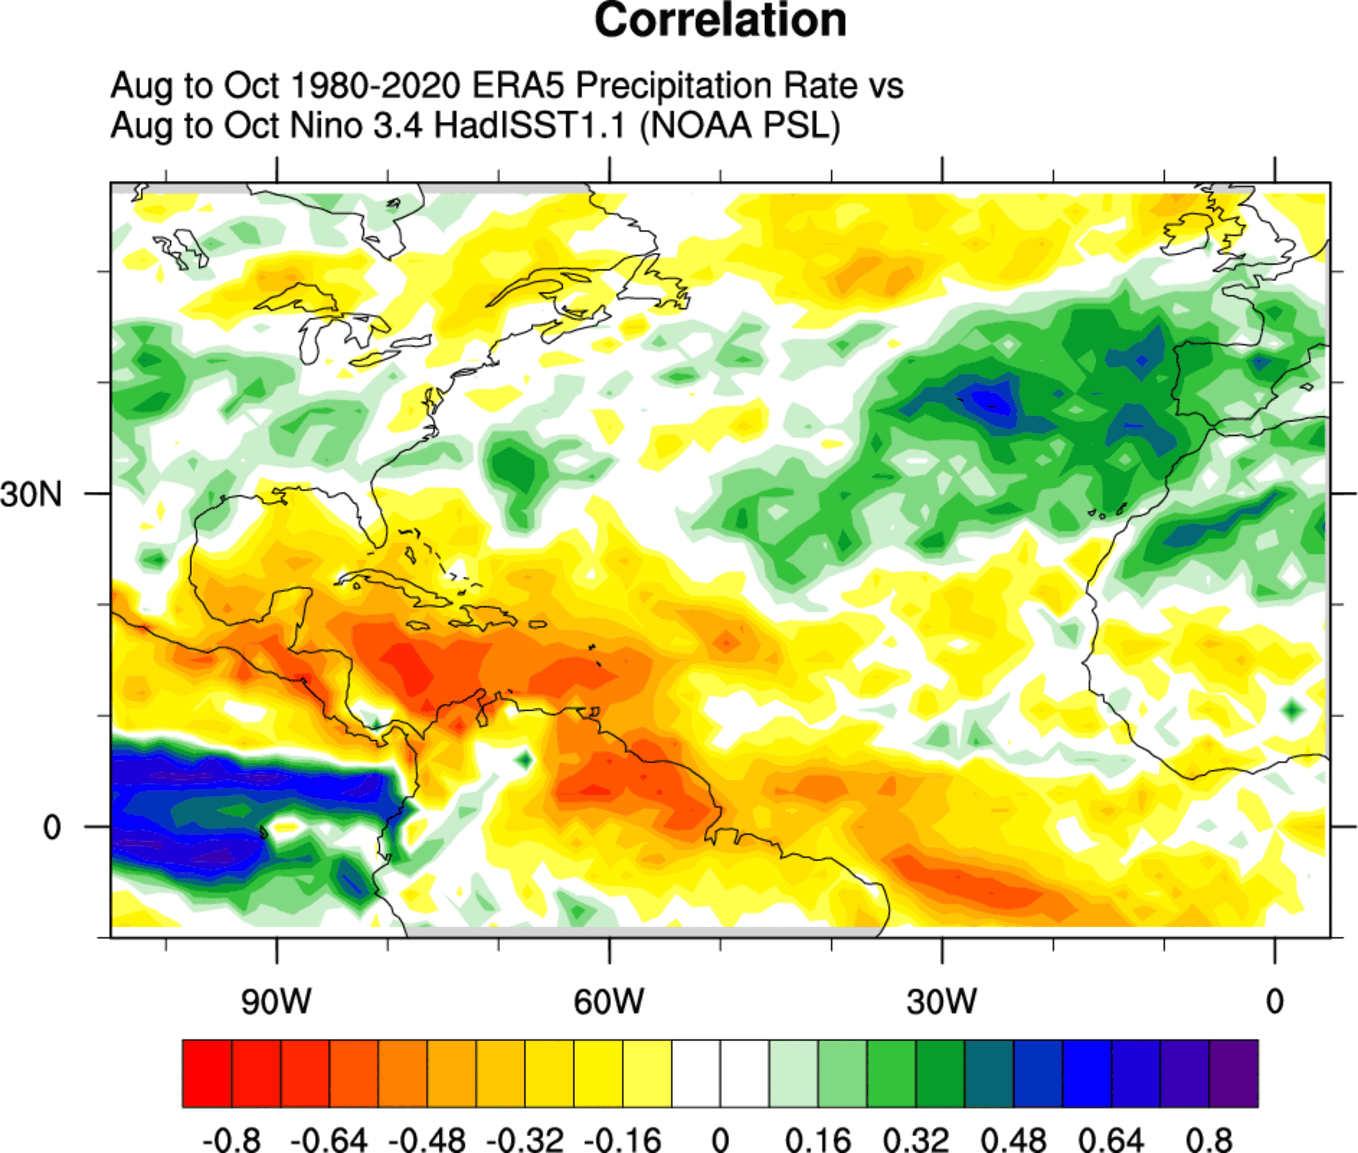
This is mostly a result of higher pressure and more stable conditions across the board. This means fewer tropical storms and weaker systems. So an El Niño can greatly reduce the chance of a strong hurricane impacting the United States.
But, this still does not mean that no storm can reach the coast of the United States. The number of storms is lower, as is their strength. But only one storm is enough to do major damage to the coastal areas.
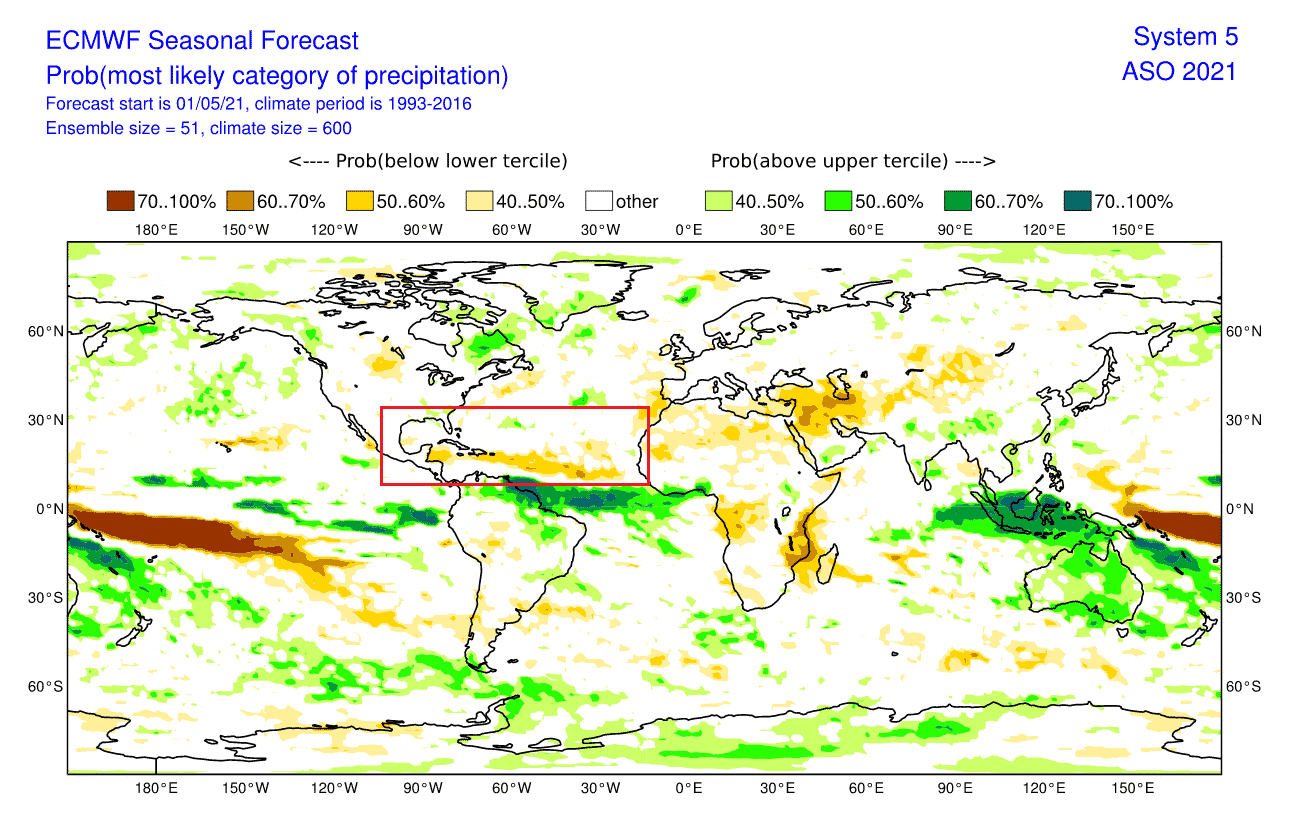
Looking at the precipitation forecast from the European ECMWF model, we can see less precipitation during the tropical season in the main development region. This could indicate that despite the supportive ocean conditions, the atmosphere might not allow a superactive tropical storm season as El Niño is active.
Based on all the historical data, there is a high chance that the current warmer-than-normal subtropical Atlantic Ocean will translate into supportive conditions for the tropical season.
But as a lot depends on the atmospheric conditions, an El Niño will provide a harder environment to make storms develop into stronger hurricanes. So at this point, it is hard to say who will prevail. However, while El Niño does look strong, the record-warm Atlantic Ocean is not to be ignored.
We will keep you updated on global weather development and long-range outlooks, so bookmark our page. Also, if you have seen this article in the Google App (Discover) feed, click the like (♥) button to see more of our forecasts and our latest articles on weather and nature in general.
Don’t miss: