A powerful Super El Niño continues to build in the Pacific. This creates what I call an atmospheric hurricane shield for the United States, lowering the overall risk of Atlantic hurricane development and U.S. landfalls by creating unfavorable tropical conditions.
This comes from the latest analysis and forecast data, which show a hostile setup for Atlantic hurricane development: sinking air, record-strong wind shear, and lack of moisture, all keeping the 2026 season exceptionally quiet near its seasonal peak.
In this article, I will look at the latest Atlantic and Pacific signals, how they are changing the global atmosphere, and what the forecasts show for the rest of hurricane season and the United States landfall risk. I will also look at why a quieter hurricane season can offer early clues about Winter 2026/2027 patterns, and even a Polar Vortex connection.
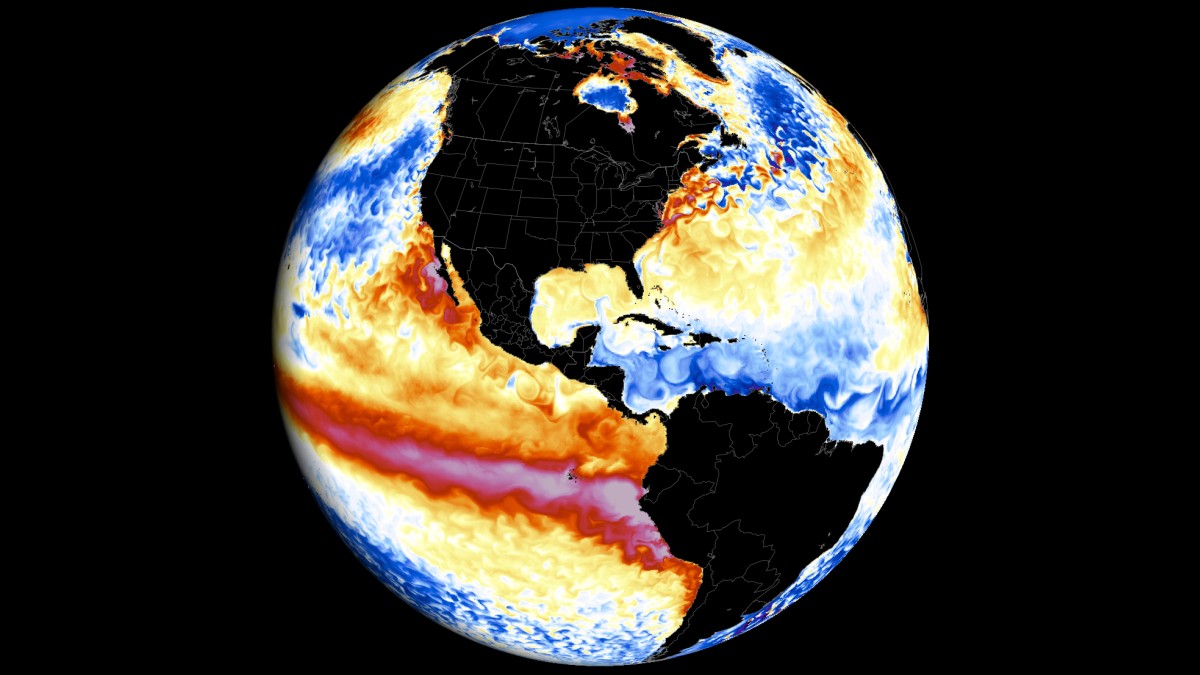
Super El Niño 2026: From the Pacific Into the Atmosphere
Ocean anomalies play a very important role in the global weather system. Pacific temperature anomalies are known to directly affect hurricane season and thus the United States. The best-known and most influential area is the large ENSO region in the tropical Pacific, which shifts between warm (El Niño) and cold (La Niña) phases. We are currently in a growing strong El Niño phase.
The image below shows the typical atmospheric circulation during an El Niño event: Rising air in the central and eastern Pacific increases precipitation and lowers pressure over that region. At the same time, descending air in the western Pacific produces stable weather and high-pressure conditions.
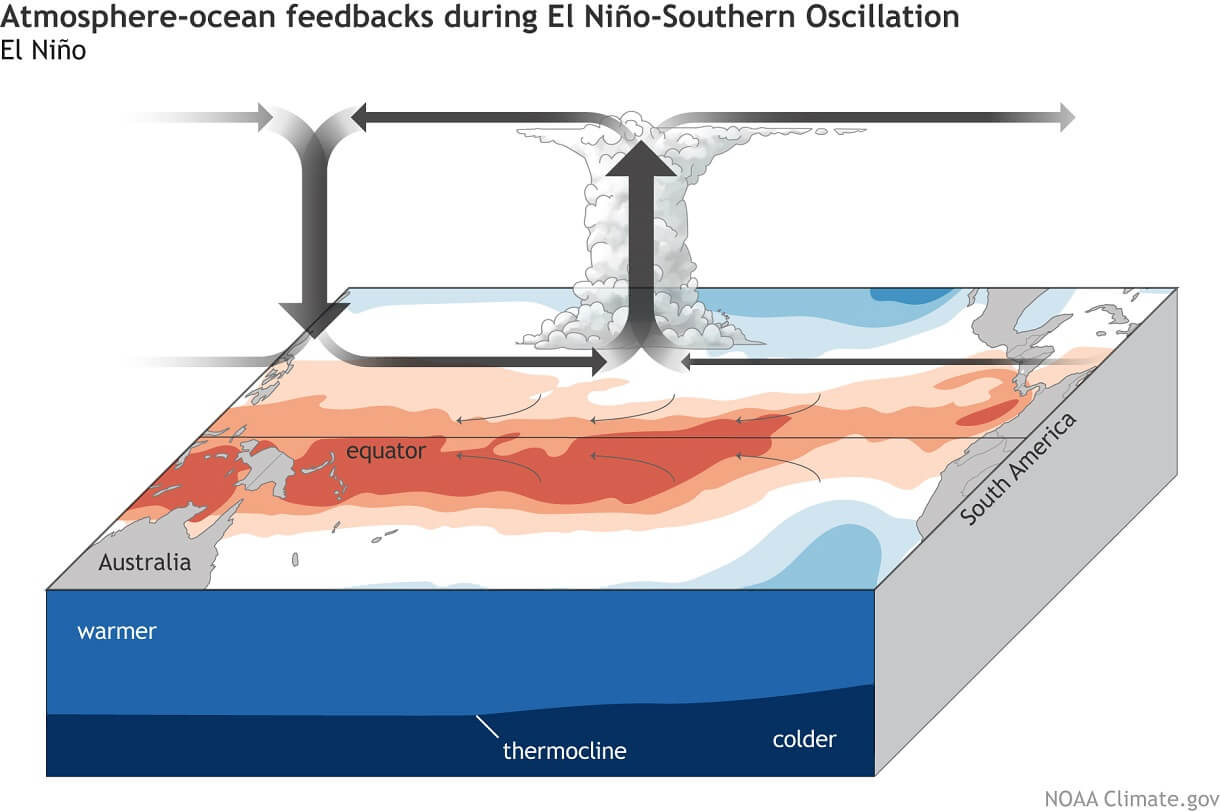
This creates a strong impact on tropical rainfall and pressure patterns, affecting the ocean-atmosphere feedback system. It then extends across the whole tropical region and from there toward both poles, making this a planetary-scale event.
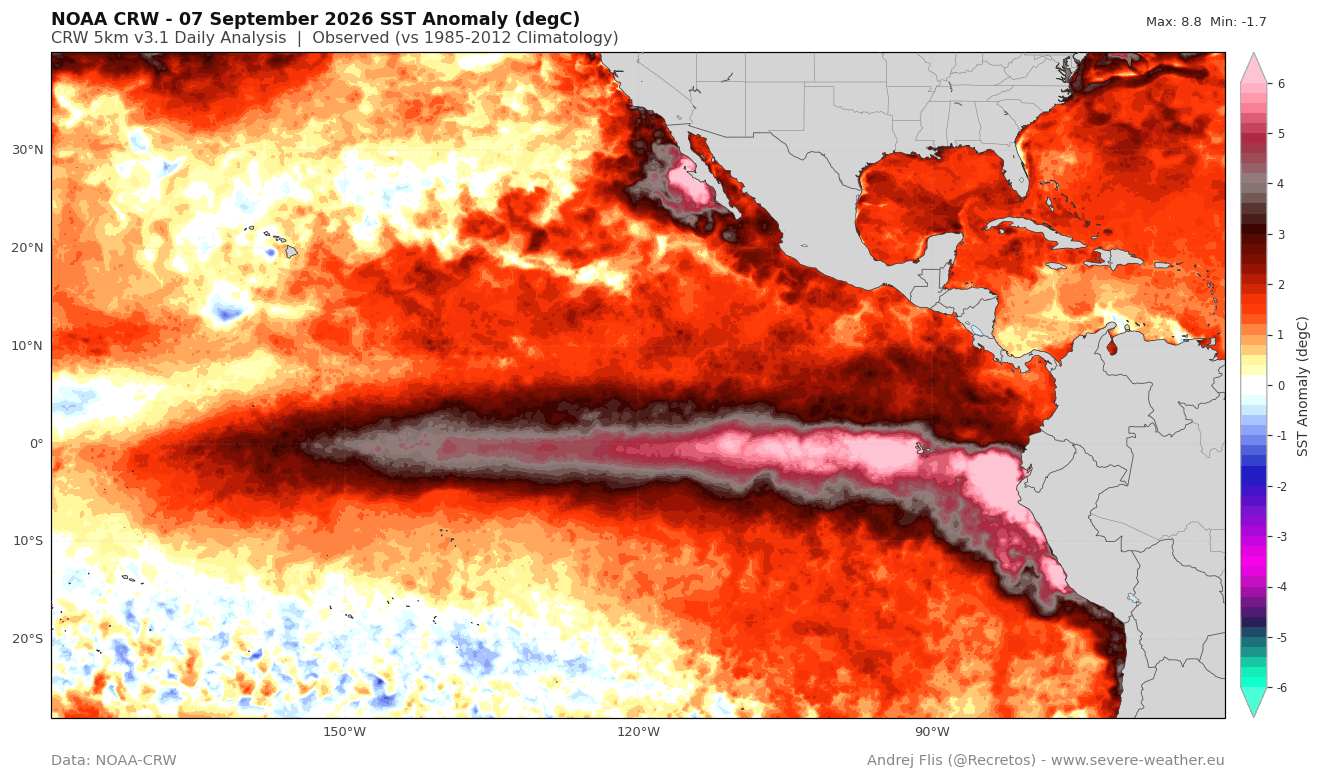
Below is my latest ocean analysis, created from NOAA-CRW data. You can see significant warm anomalies across the tropical Pacific area (ENSO region), with peak anomalies exceeding 7°C (12.6°F) above normal in the eastern regions. This is a very strong event unfolding, with strong seasonal impacts expected to follow.
In the image below, we can also see the NCEP CFSv2 model forecast, which shows this event reaching and exceeding the Super El Niño threshold. You can also see that it is forecast to exceed the last 3 Super El Niño events by some margin. This is already evident in the analysis above, which shows a very strong event.
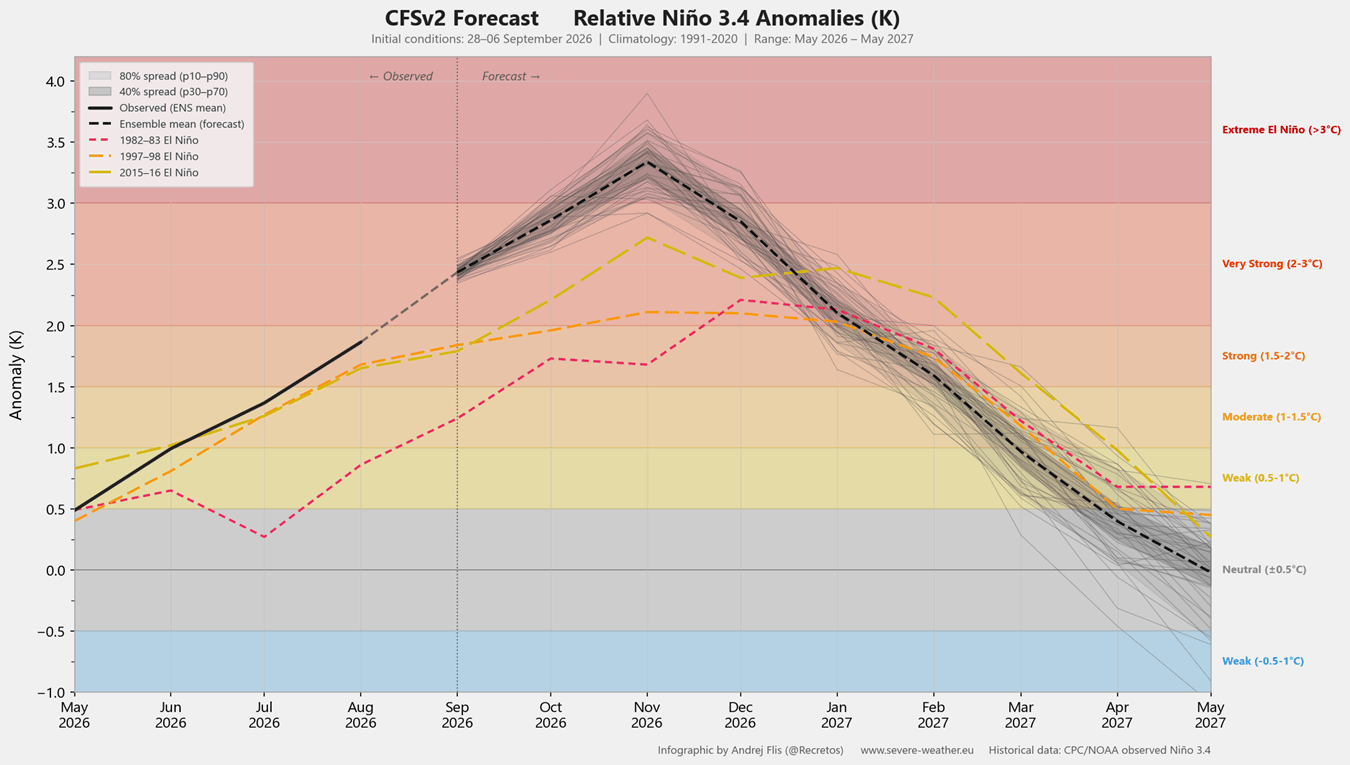
To be recognized as a Super event, sustained seasonal values must exceed +2 degrees, which we have already passed. If the forecast above verifies, this would make the 2026/2027 El Niño event the strongest in over a century, if not further back.
A major part of the Super El Niño is also hidden below the ocean surface. Below is a video produced from high-resolution subsurface ocean data. It shows the development of a strong subsurface anomaly over the past 3 months, with visible eastward movement and rapid growth. You can also see it expanding, rising to the surface as a Super El Niño event.
This is called a Kelvin wave, and it provides a stable supply of energy to keep the El Niño strong well into the Winter season, also supported by the latest forecasts. But without waiting for Winter, we can already see strong impacts of El Niño on global circulation.
The Atmospheric Shield: How the Super El Niño Suppresses Hurricane Activity
The impact of El Niño on the hurricane season is well researched. The image below shows the number of hurricane landfalls per ENSO phase, with El Niño clearly producing the lowest U.S. landfall numbers and the lowest probability of a major hurricane landfall in the United States.
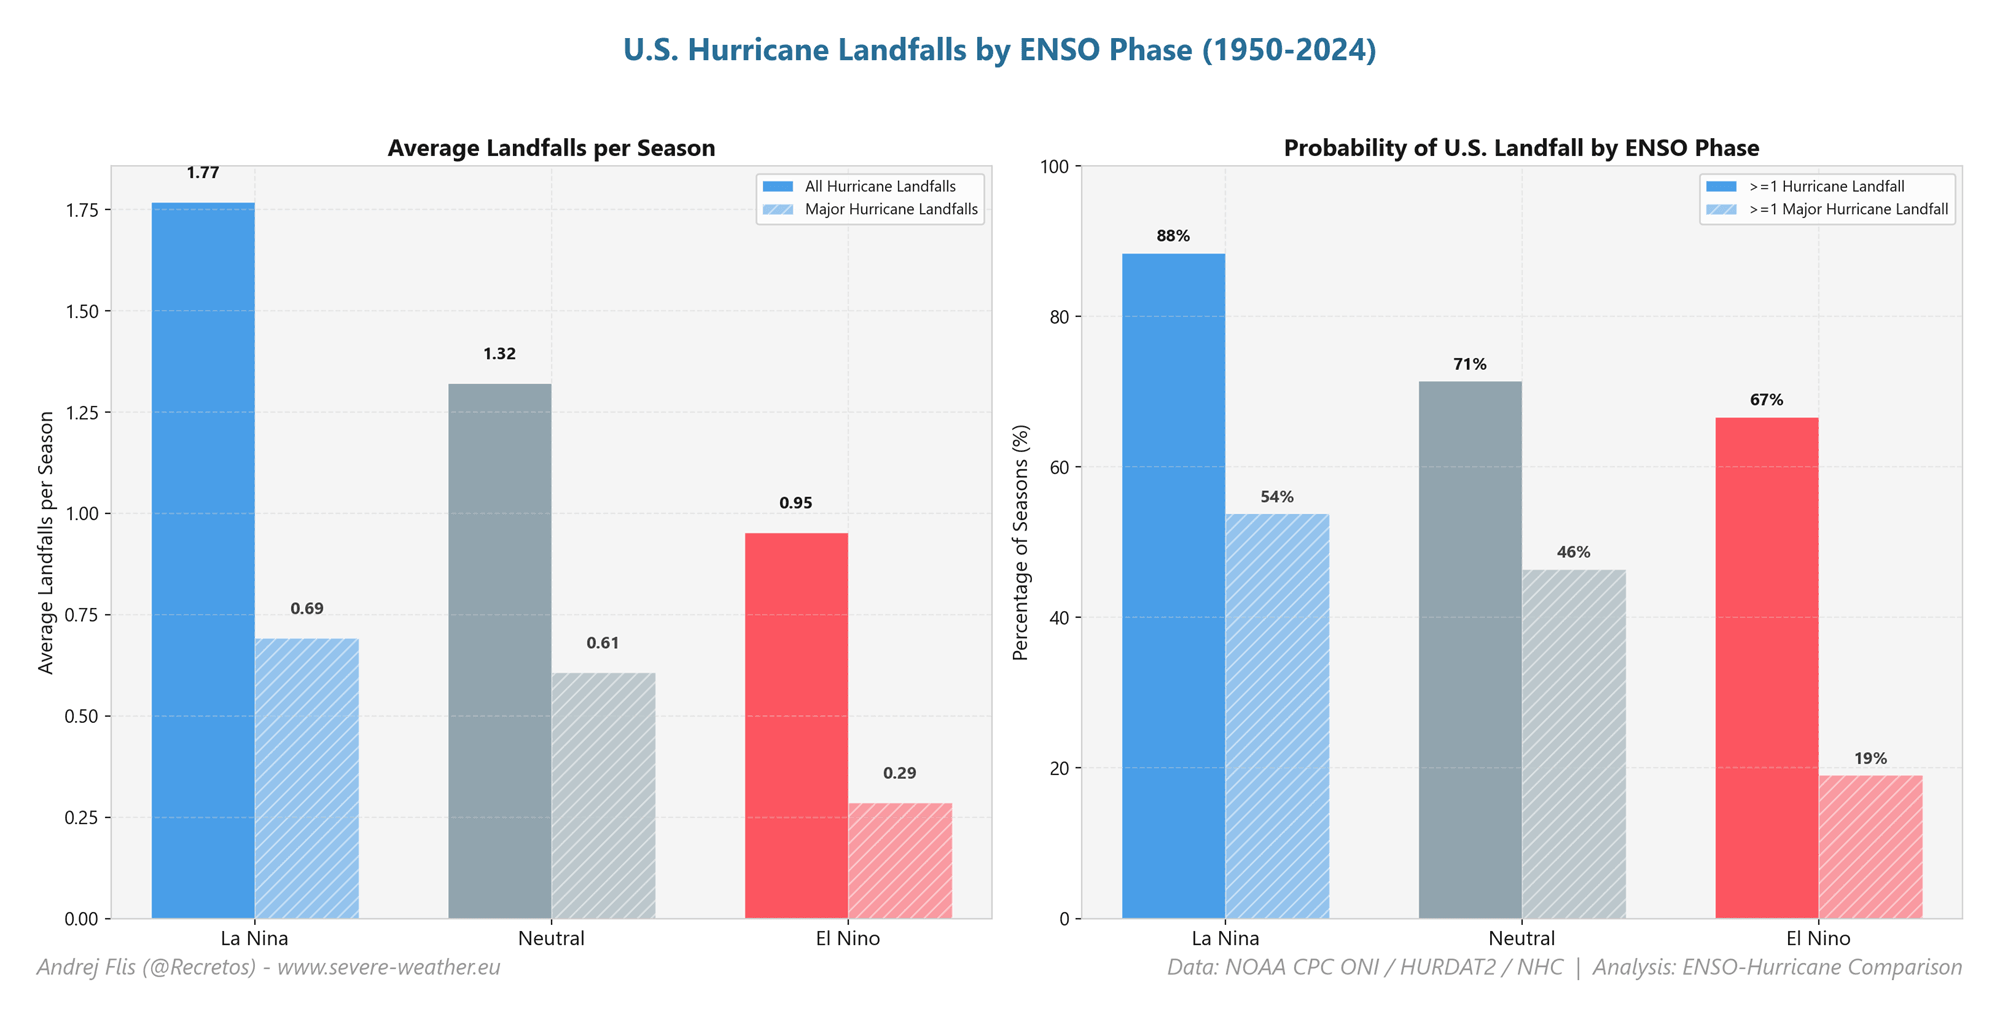
This directly reflects the changes El Niño usually brings to the atmosphere, creating an atmospheric shield that reduces hurricane activity and potential United States landfalls. But with a very strong El Niño currently emerging, it is expected to keep the Atlantic much quieter than normal this season.
Below is my simple schematic that shows how exactly the El Niño atmospheric shield works during the hurricane season. Mainly, it produces an atmospheric flow that causes a hostile environment for tropical storms, protecting the U.S. from landfalls. Note the location of the main development region (MDR), which is the area where most systems form during the season.
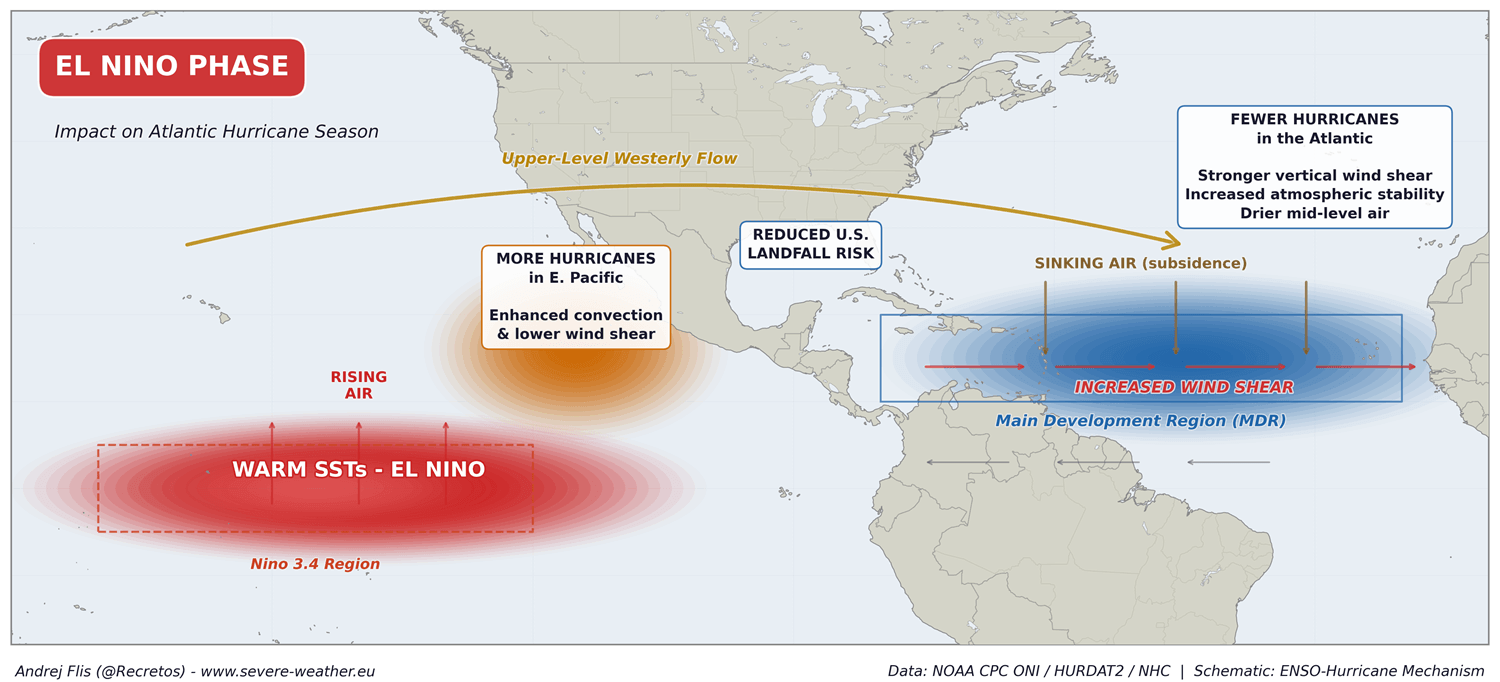
There are 3 main impacts from an El Niño on the Atlantic hurricane season: increased wind shear, sinking air (subsidence), and drier mid-levels. This creates an atmosphere that really tries to slow down and suppress tropical activity in the Atlantic.
For the 2026 season, the El Niño impact is strikingly obvious when we look at the progress so far in the image below. To estimate hurricane season activity, NOAA uses the total strength and duration of Atlantic tropical storms and hurricanes, called the Accumulated Cyclone Energy (ACE) index.
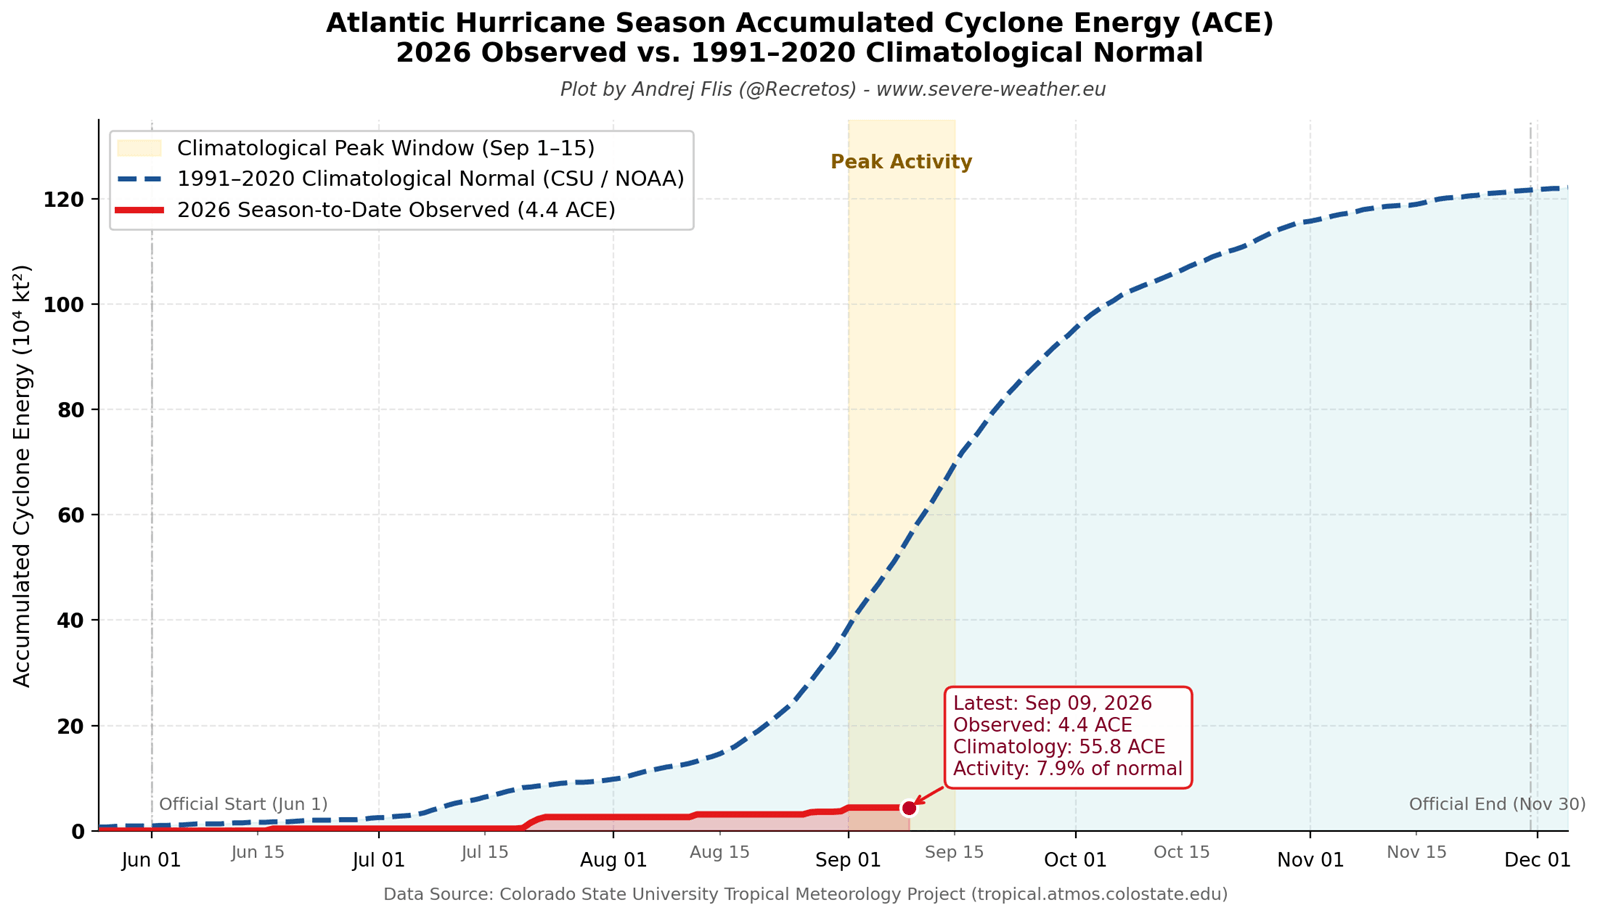
You can see the long-term normal ACE value line (blue) and the 2026 values so far (red). A significant lack of activity is evident, with the total ACE at only around 8% of what is normal at this point in the season. So far, total energy has come from only 5 short-lived named systems, none of which has reached hurricane status.
A more direct El Niño impact can be seen in the wind shear plot below by Dr. Philip Klotzbach, a leading expert in seasonal hurricane forecasting. Atlantic wind shear is far above the historical average throughout July and August, with data ranking 2026 wind shear the highest on record for the period in the last 47 years.
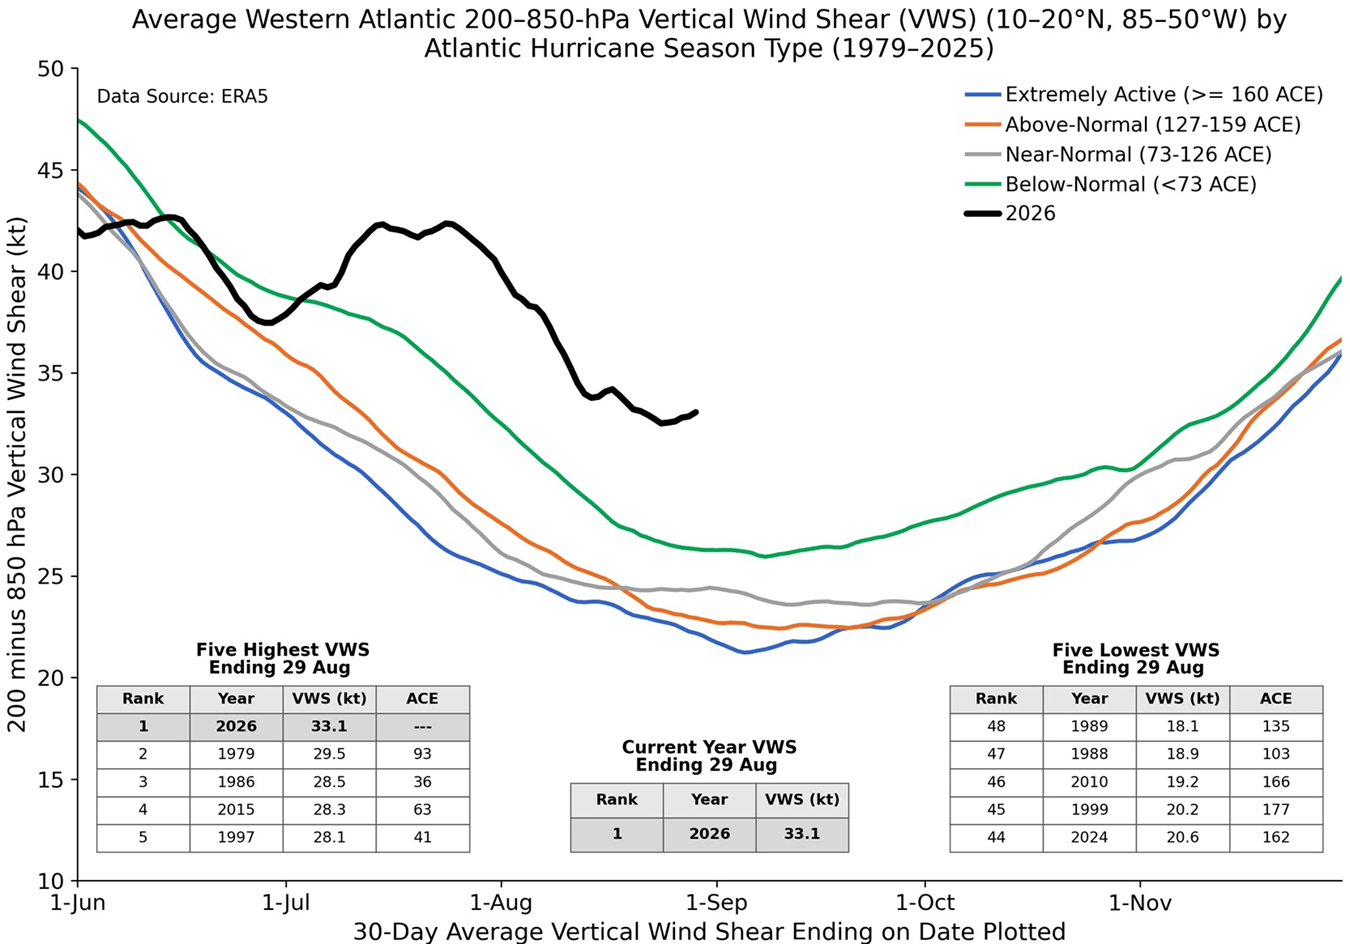
Strong wind shear means that winds blow at different speeds and directions at higher altitudes, effectively tilting and tearing apart the vertical structure of a tropical system. This allows dry air to enter the core of the system, cutting off its fuel and preventing it from strengthening.
Another hurricane suppression mechanism is drier air in the lower atmosphere. Below is the 925mb level (800 meters – 2,625 feet) relative humidity anomaly for July and August that I made from new NOAA CORe data. You can see a broad area of below-normal moisture in the main development region, further limiting tropical development.
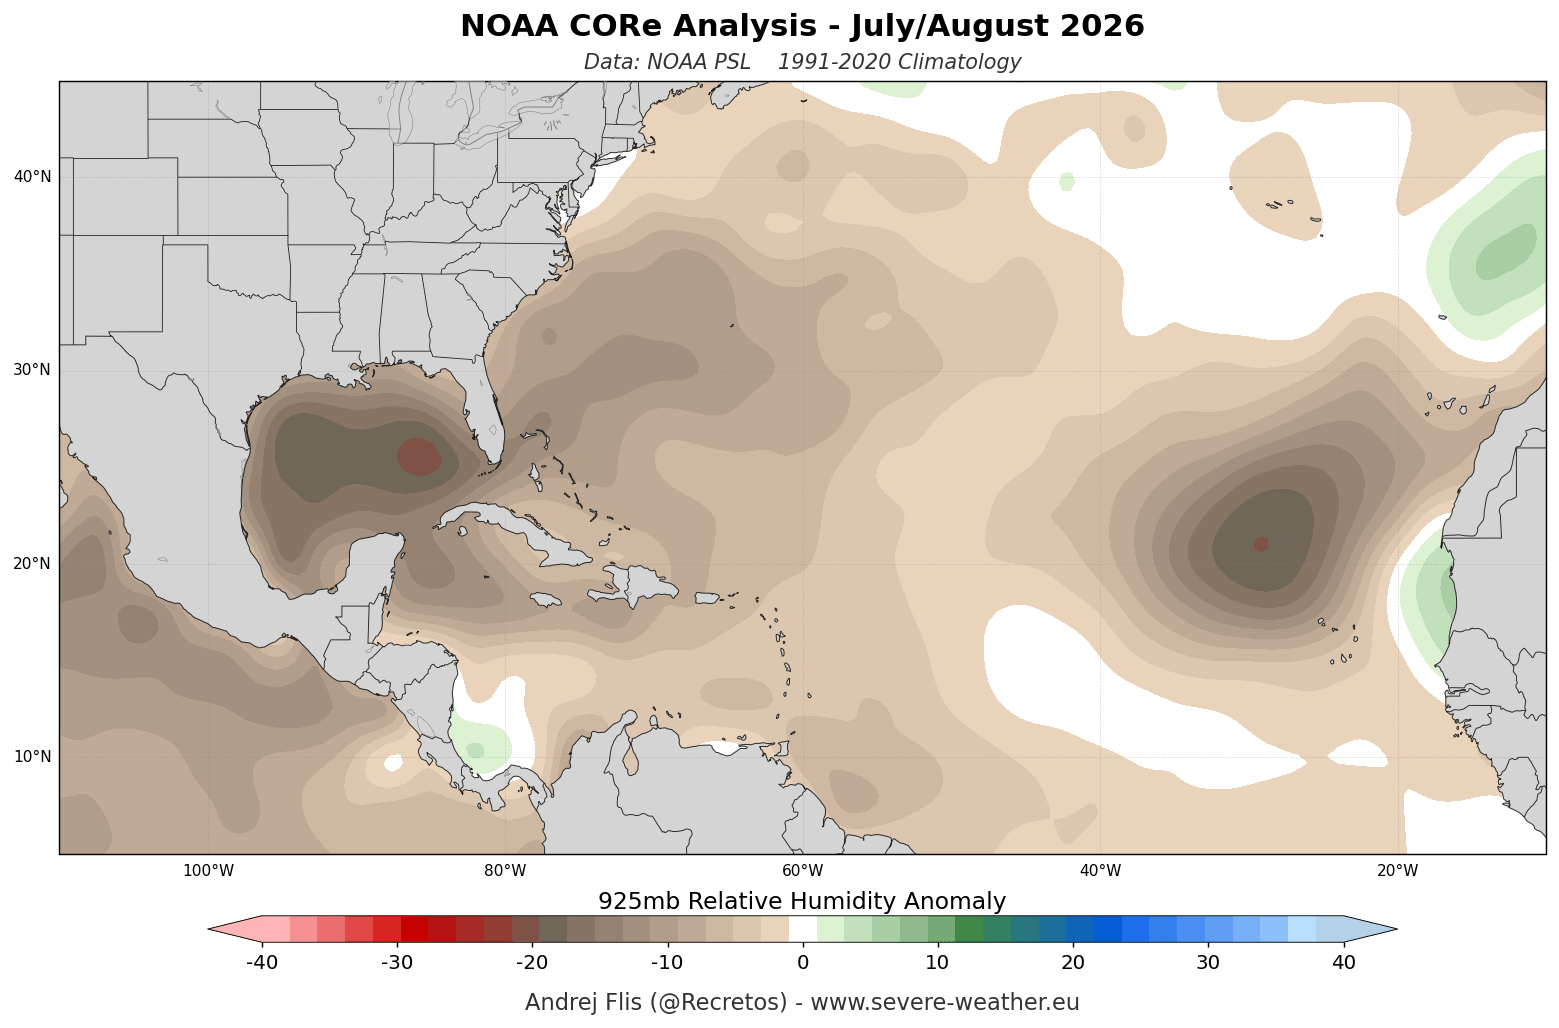
This is consistent with the broad El Niño moisture response found in recent research (linked below). It shows that stronger El Niño events are associated with reduced humidity across the tropical Atlantic and increased subsidence, extending through the lower and middle troposphere, suppressing tropical activity.
And despite reaching the very peak of hurricane season, the Super El Niño atmospheric shield is in full effect, with no medium-range landfall threat currently indicated for the United States.
Atlantic Hurricane Forecast: Suppression Continues Through September
Below is the ECMWF ACE forecast for the very peak of the hurricane season in mid-September. The orange column is the long-term mean, while the green column is the actual forecast. It shows very low activity in the Atlantic, far below the long-term average. This further confirms the Super El Niño is already in control of the atmosphere.
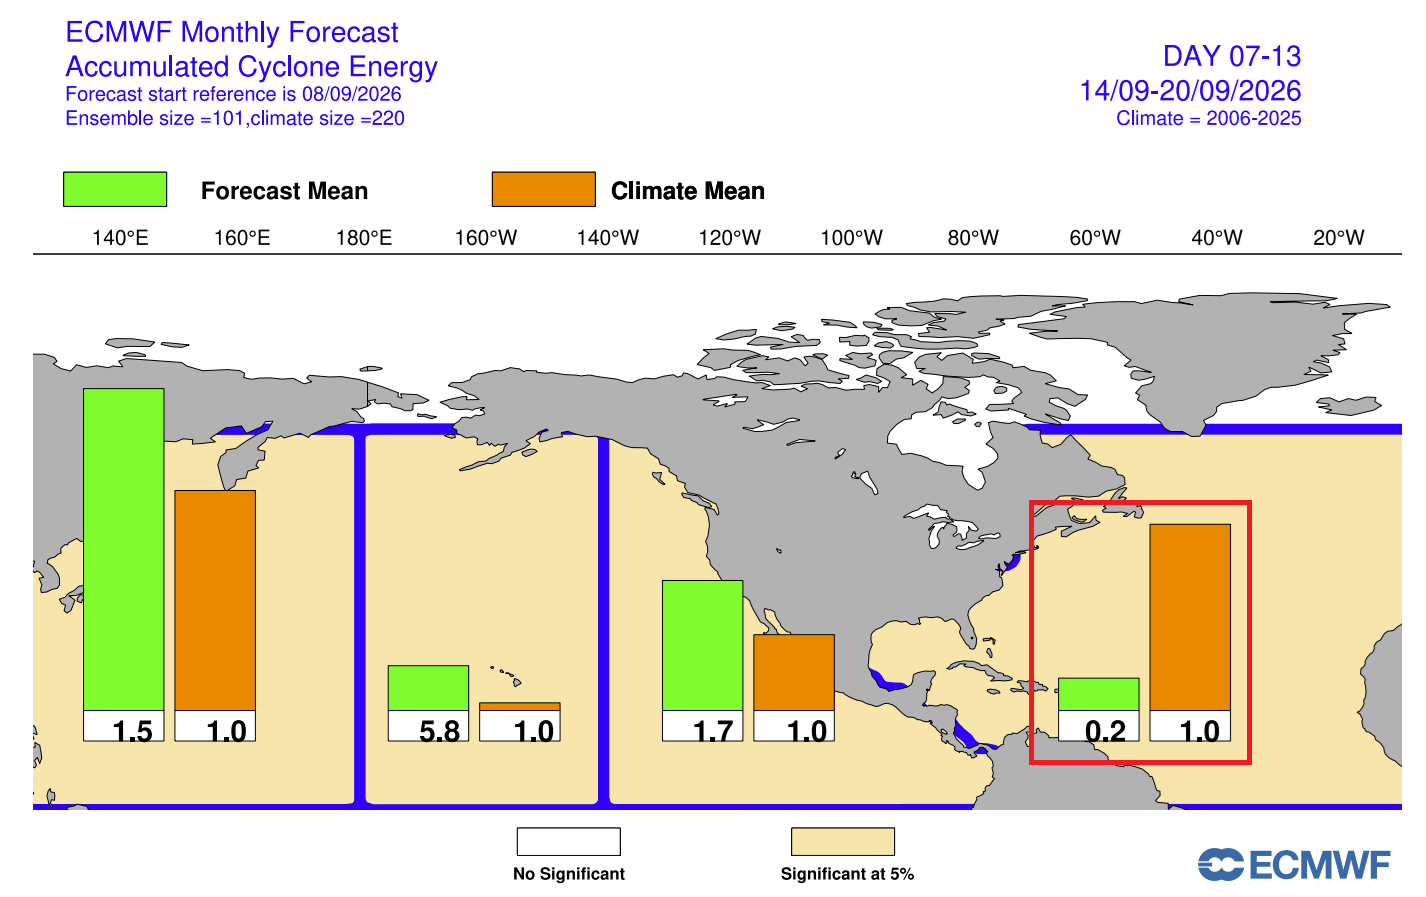
But you can see above-normal activity across all three regions of the Pacific. This is another signature of a strong El Niño: subsidence, wind shear, and atmospheric suppression in the Atlantic, but lower pressure and lifting in the Pacific, supporting tropical activity.
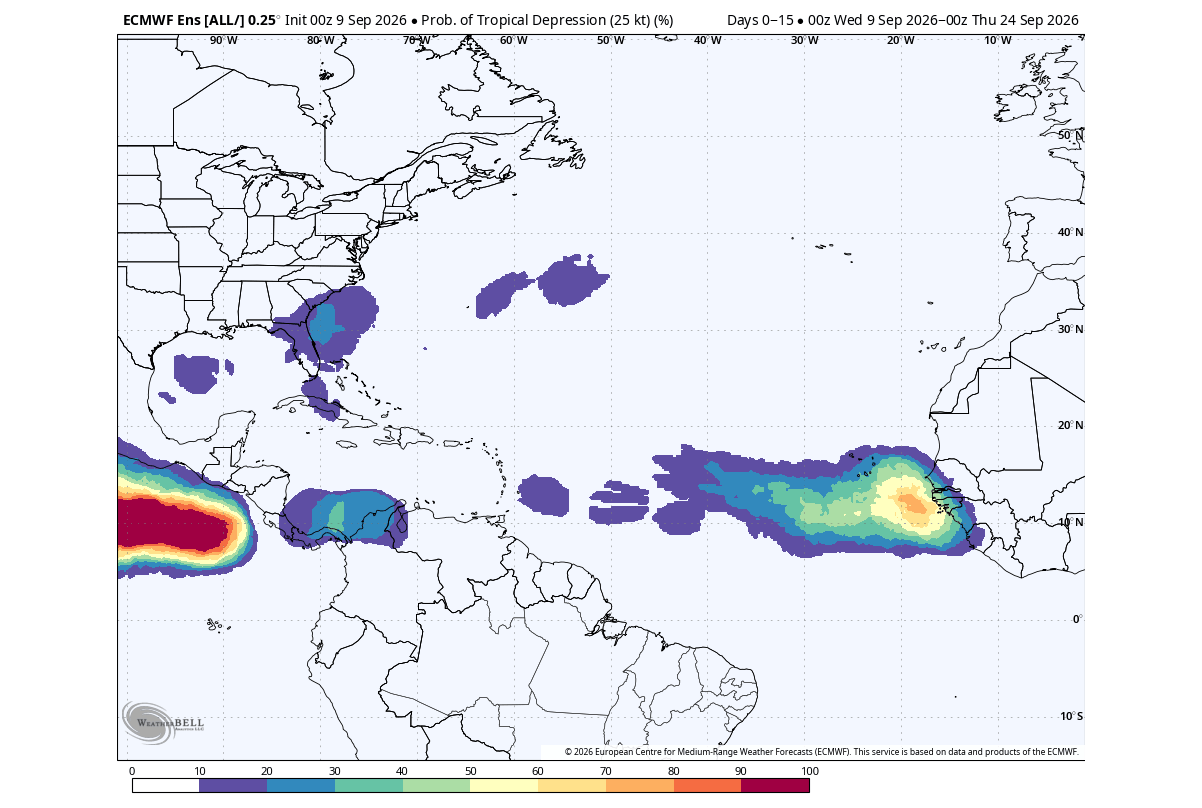
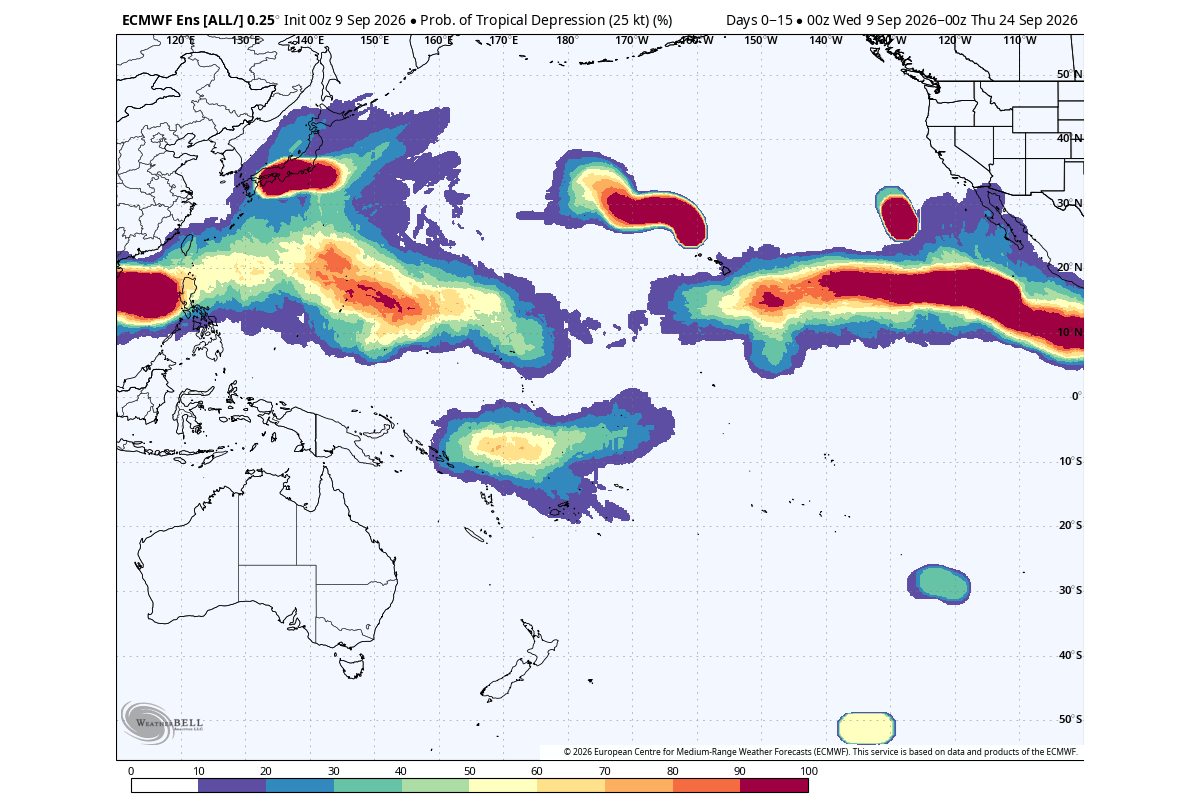
The medium-range 15-day probability forecast highlights a significant suppression in the Atlantic basin during the peak of the season. Some moderate-to-high tropical depression probabilities are confined near the West African coast, rapidly fading westward in a hostile atmosphere.
The next image shows the rainfall forecast for the same period and is perhaps the most telling indicator we can use. You can see below-normal precipitation over the whole main development region (MDR), indicating fewer clouds and storms overall, making widespread tropical activity very unlikely.
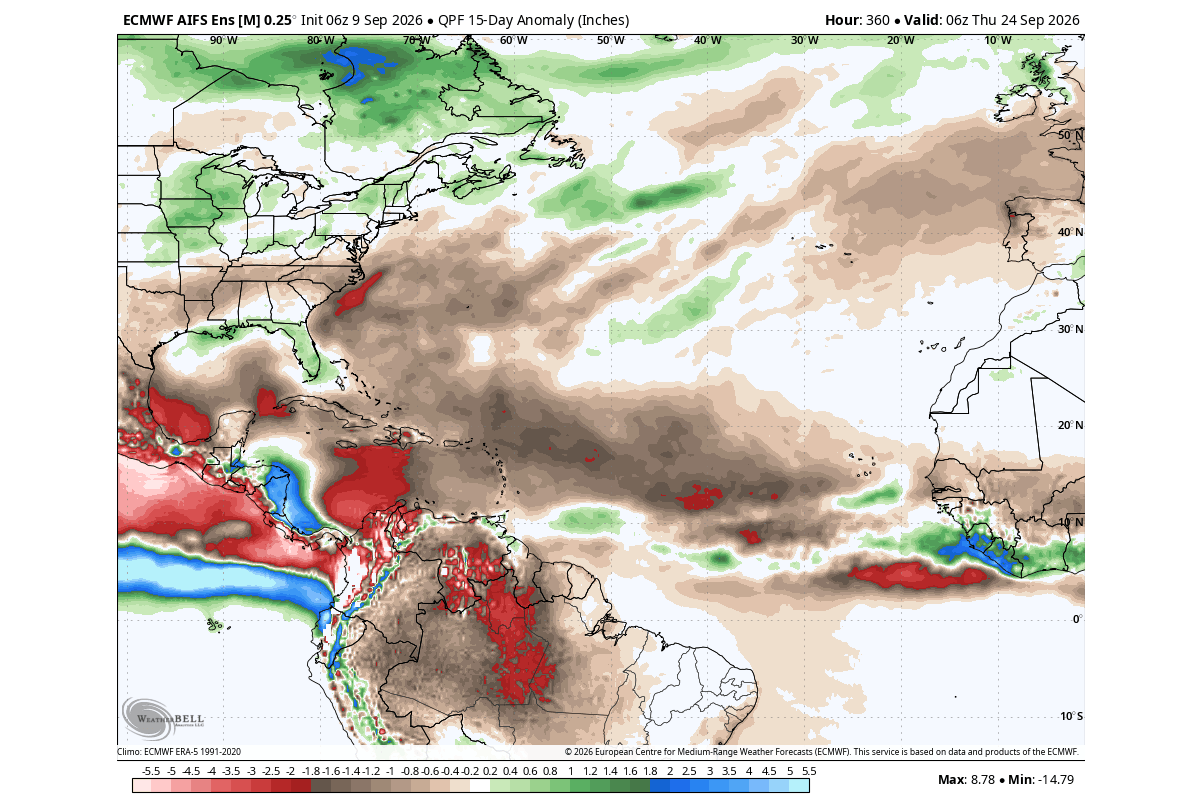
You can also see a well-below-normal area around the Caribbean and into the Gulf, and up the East Coast of the United States. This indicates suppressed activity overall, greatly reducing hurricane potential, as expected during Super El Niño events.
In contrast, we can look at the 15-day development forecast for the Pacific, which shows very high tropical activity. This is a clear signature of El Niño, boosting development from the Eastern Pacific deep into the Central and Western Pacific.
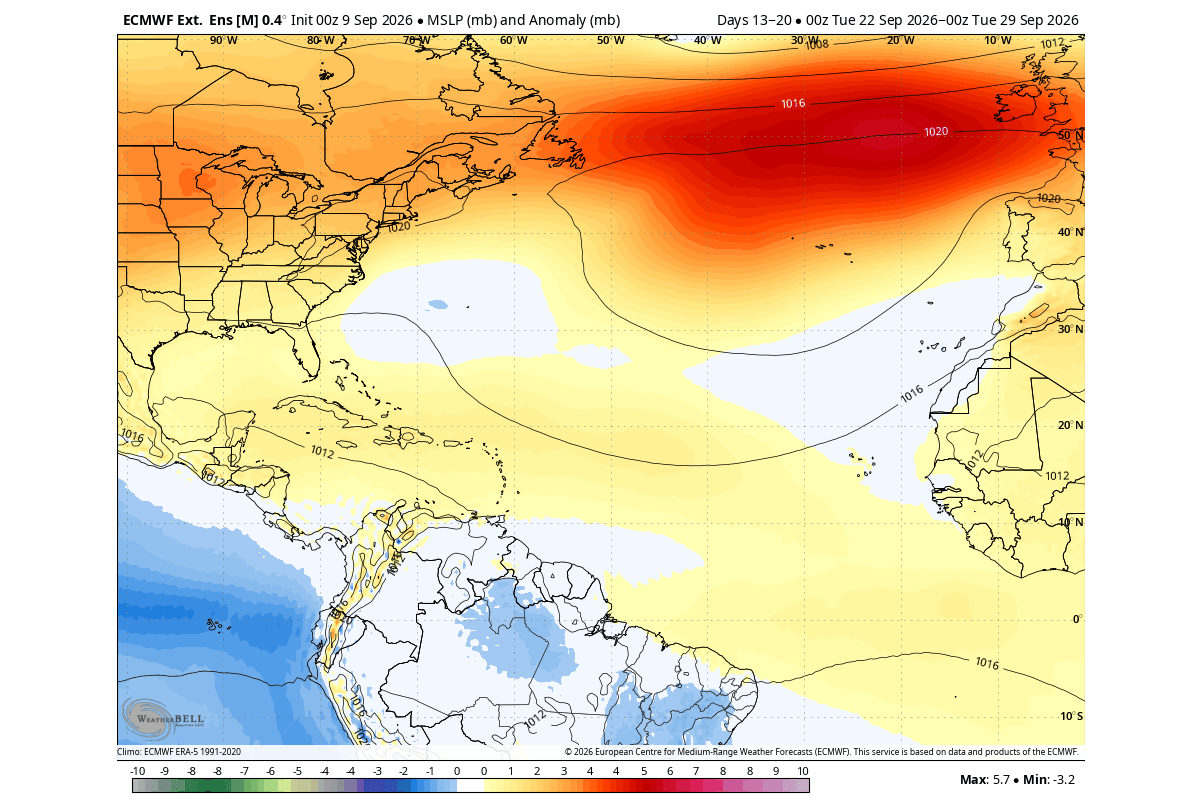
Going into late September, the extended forecast indicates an above-normal pressure trend over the tropics and the MDR area. This region usually shows lower pressure in an active season, but September looks to remain less active in terms of potential hurricanes making landfall in the United States.
The ECMWF extended probability forecast reinforces widespread Atlantic suppression in the final week of September, showing broad below-normal development probability across the Main Development Region, western Gulf, and open North Atlantic.
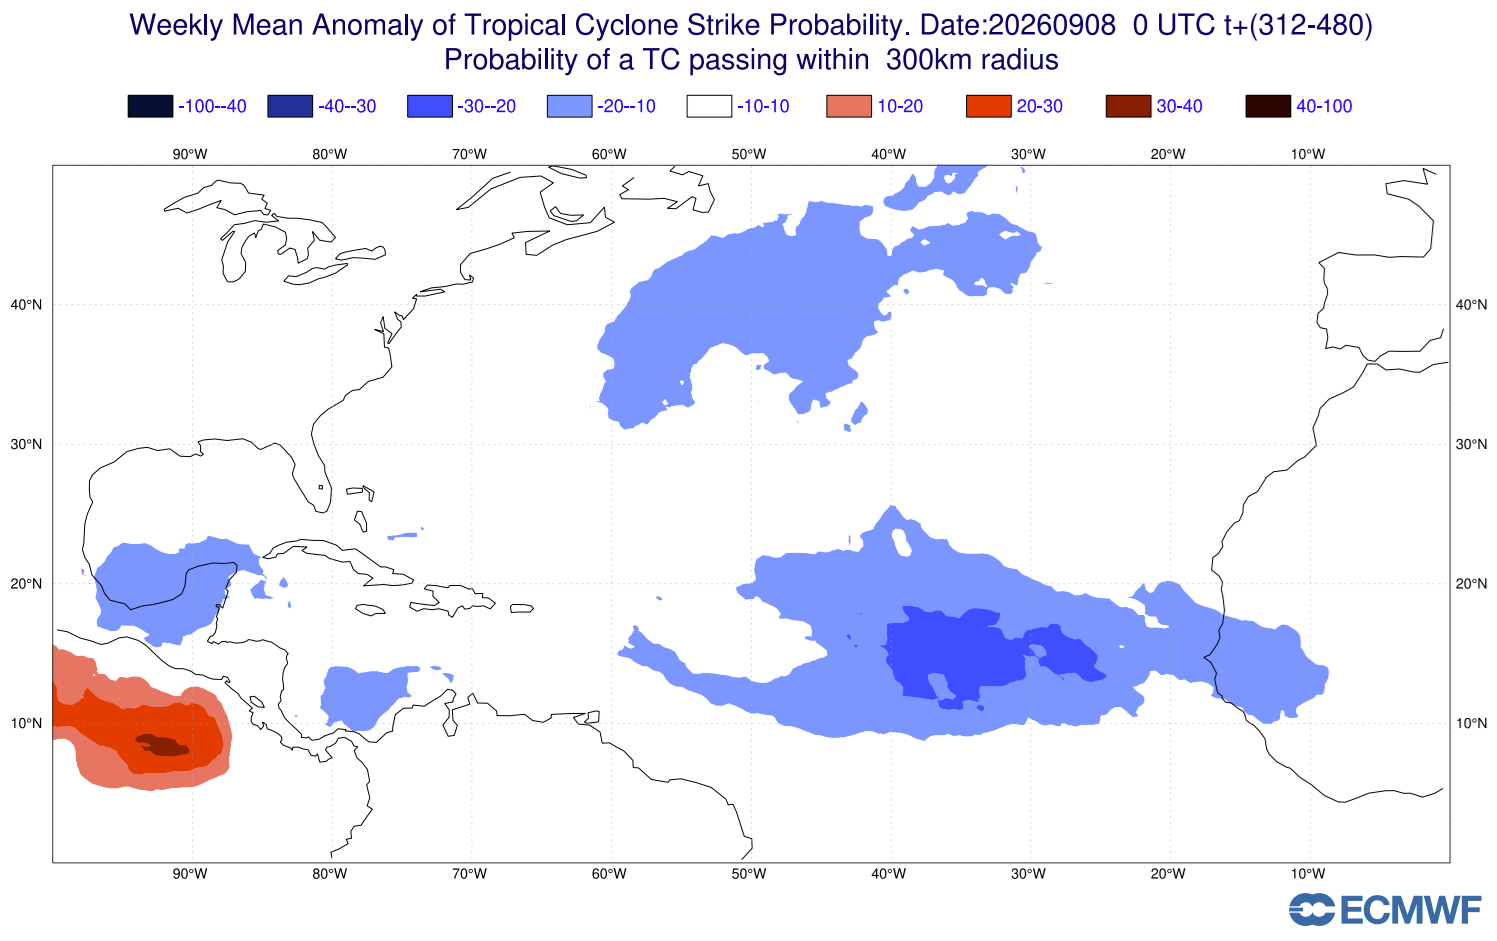
This points toward an early collapse of the Atlantic season heading into October. With the deep tropics largely suppressed, any remaining threat to the United States is more likely to originate close to home, with brief localized opportunities in the Gulf or western Caribbean.
October Hurricane Trends: Super El Niño Keeps the Atlantic Quiet
The atmospheric setup heading into October is probably even worse for Atlantic tropical activity. Instead of allowing the Caribbean to awaken for its typical late-season run, the global circulation is forecast to lock the entire basin into a strongly suppressed state.
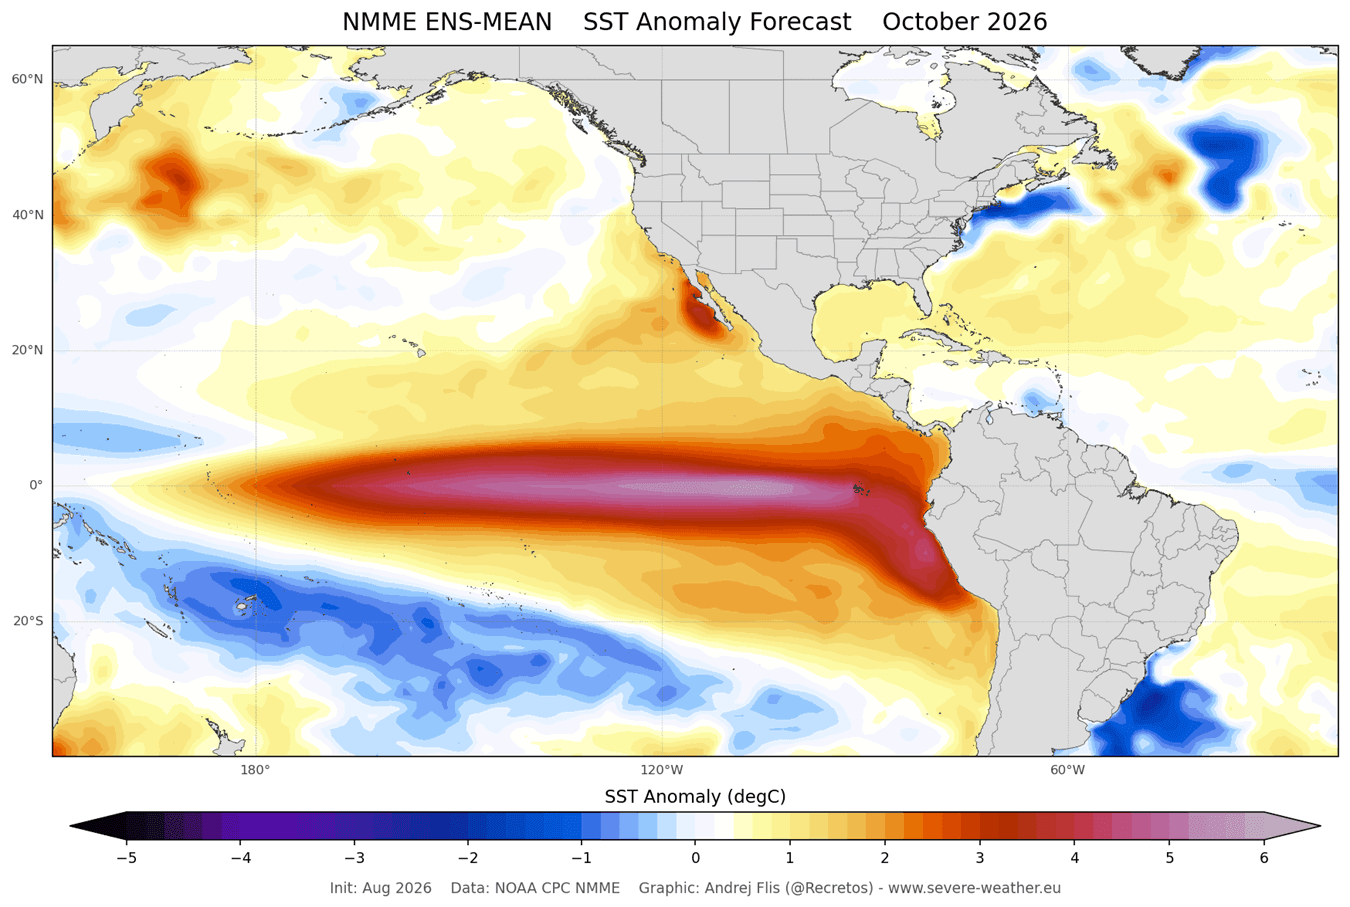
The NMME ocean temperature anomaly forecast below for October shows an intense warm anomaly of the Super El Niño, with core anomalies exceeding +5°C (+9.0°F). This is strong-to-extreme El Niño territory, which means increasing atmospheric impact and an unfavorable Atlantic atmosphere.
Looking below at the ECMWF circulation forecast for October, we can see real Super El Niño domination: A strong anomaly of rising air over the Pacific, but sinking air in the Atlantic and in the western Pacific. This is probably the most textbook example of the El Niño tropical forcing, and real suppression in the main development region.
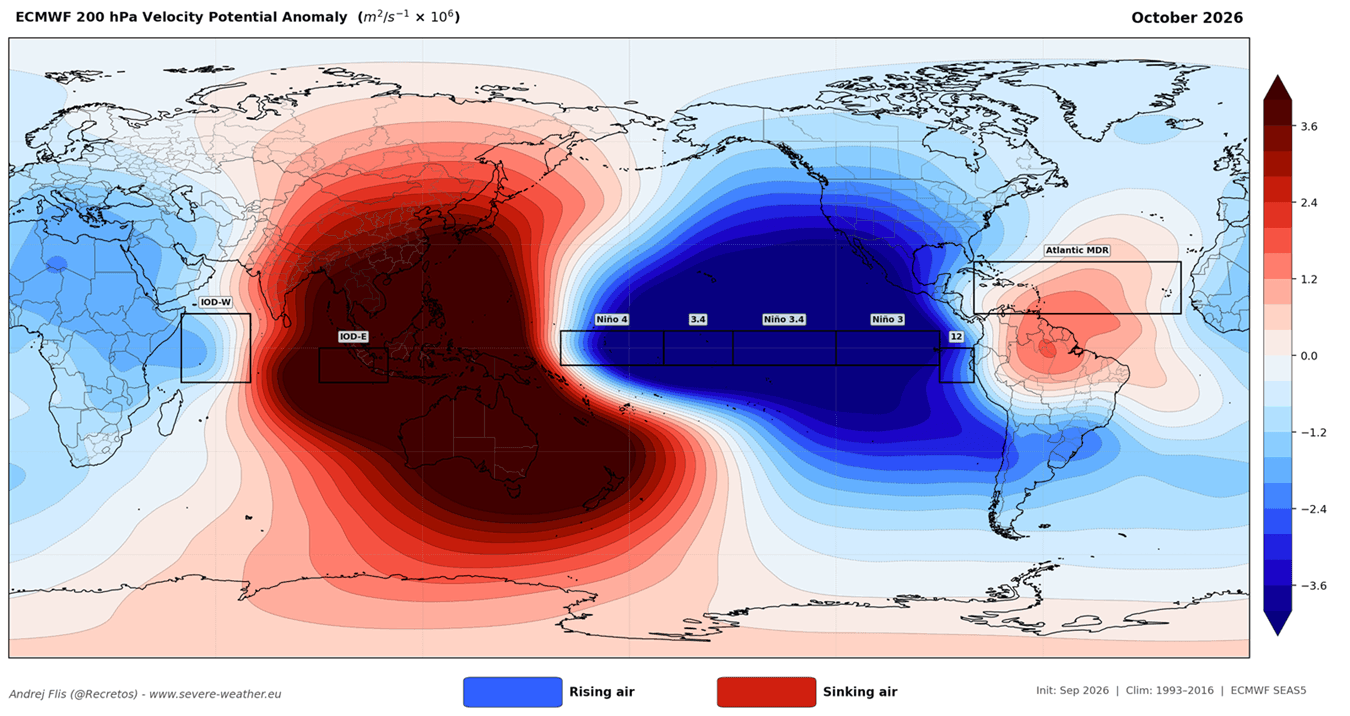
Sinking air (red) means that the atmosphere is subsiding and stable, so there are fewer clouds and less tropical activity.. Rising motion (blue) means more clouds, rainfall, and lower pressure, allowing increased tropical storm activity in specific regions.
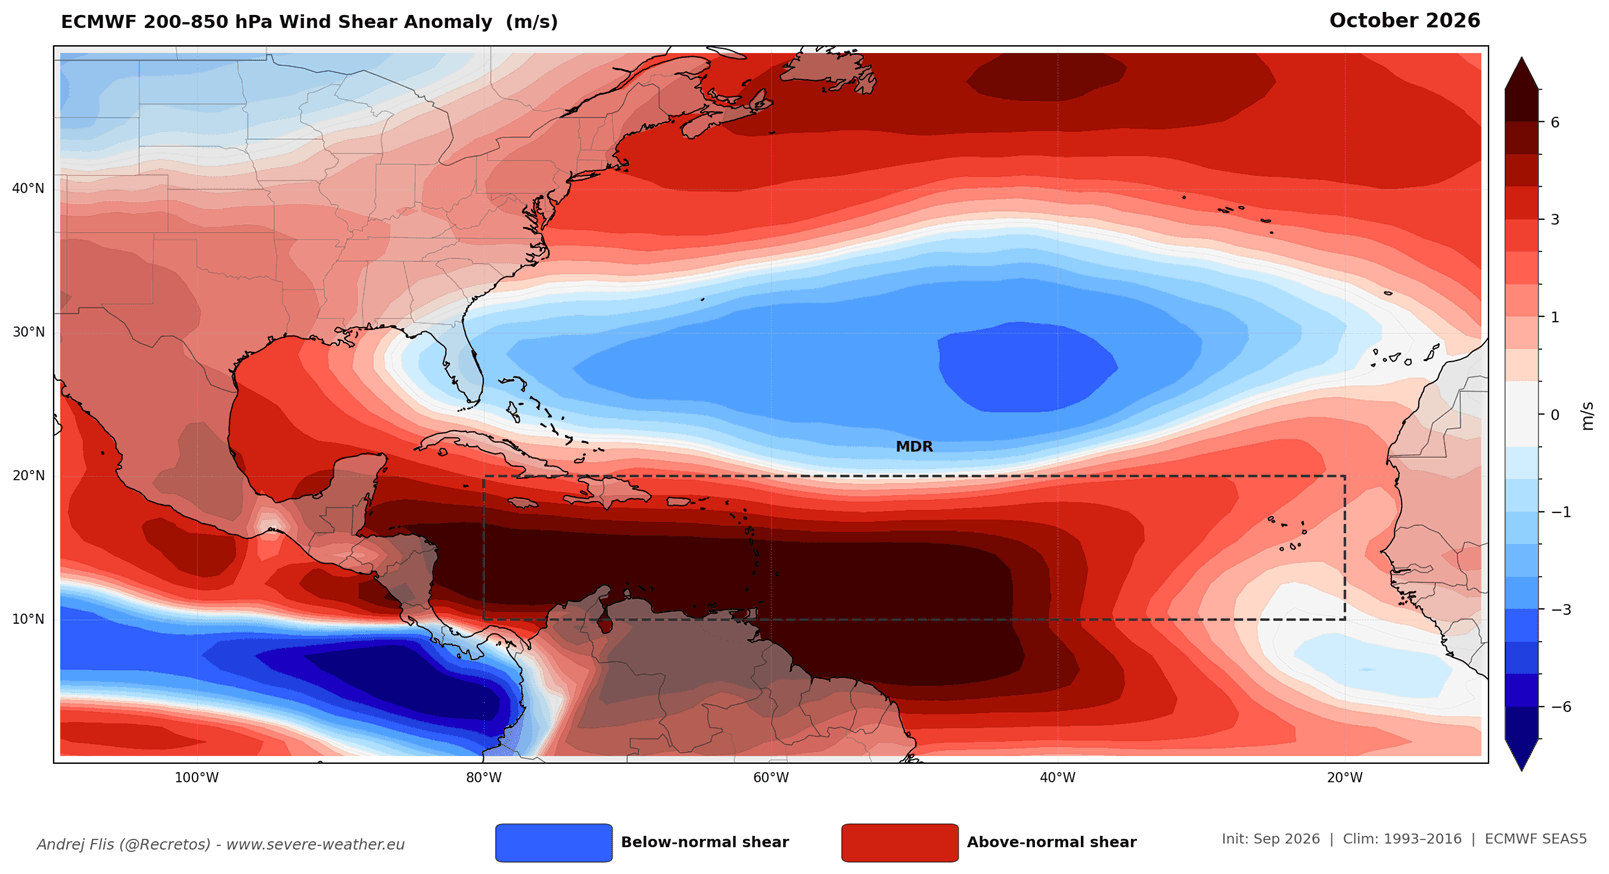
The wind shear forecast for October really reveals just how hostile the atmosphere will be in the Atlantic. A strong shear anomaly across the MDR and toward the United States is destructive for tropical system development, living up to its status as the “atmospheric shield” for the United States.
The direct result of this hostile combination is visible in the 30-day precipitation anomaly forecast below for late September and most of October. A continuous, severe dry signal spans the Caribbean from west to east, which means it is unlikely that we will see any widespread activity coming from there.
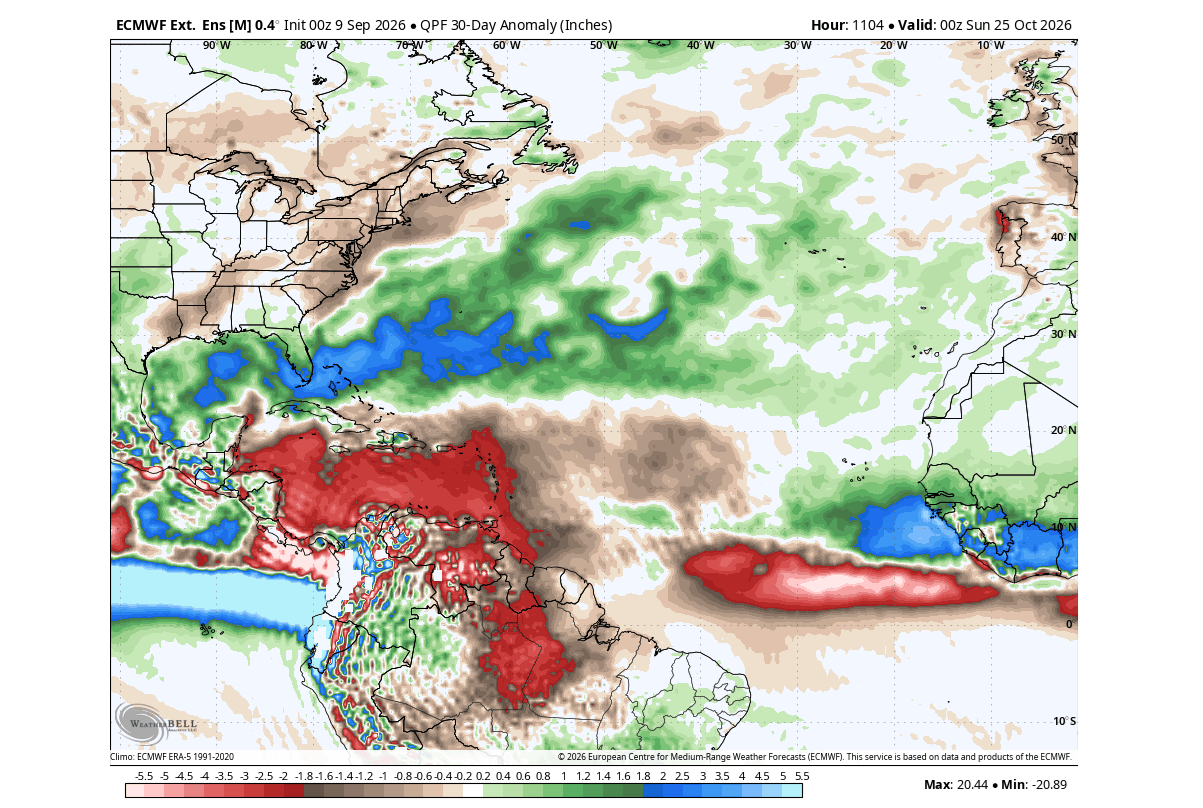
The main precipitation belt is found along the subtropical jet stream and frontal boundaries, over the southern United States and the Gulf. Any tropical or hybrid development during October would face high odds of being torn apart before reaching maturity, with any brief opportunities forced out into the northern subtropics.
I have to be clear that even if weekly and monthly odds are stacked for a near-quiet tropical season in terms of U.S. landfalls, individual systems can still appear, like the 5 so far. But a hostile atmosphere continues to hinder any system from powering up, keeping 2026 on track to finish as one of the weakest Atlantic hurricane seasons on record.
These oceanic and atmospheric anomalies also significantly affect the global weather system. This includes potential connections with the winter season and what a quiet hurricane season could mean for 2026/2027.
Winter Signals from a Quiet Hurricane Season
These tropical anomalies also act as early indicators of broader atmospheric changes. So the same global conditions that create a Super El Niño and a very quiet hurricane season can also drive a specific weather pattern the following Winter.
Below is the temperature pattern connection for the winters following weak hurricane seasons. You can see a colder air anomaly over the United States. This is consistent with a low-pressure pattern over the south-central United States and the North Atlantic, with higher pressure over Canada and Europe.
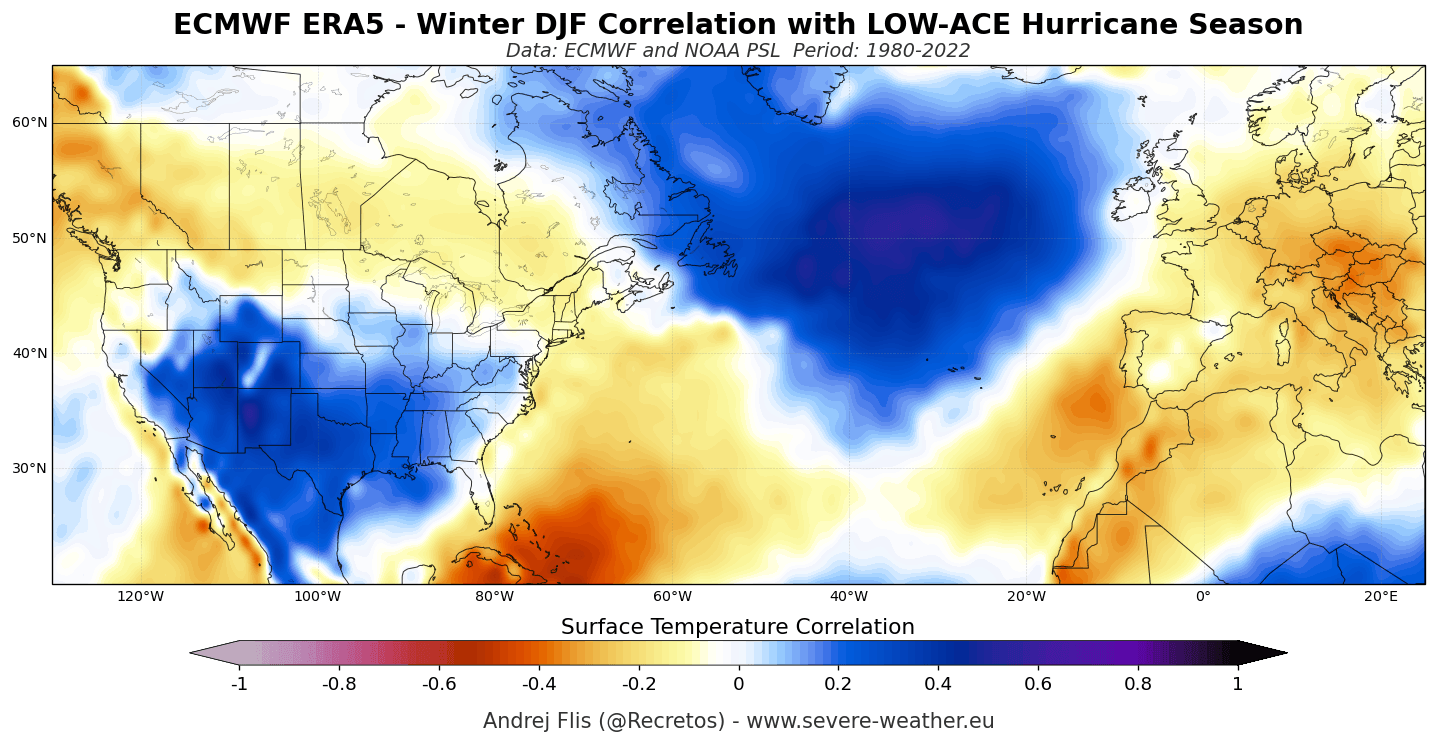
This looks very much like a winter pattern in El Niño years, known for also creating weaker hurricane seasons. So this analysis perfectly shows an overall connection between Winter, El Niño, and hurricanes in the data.
The latest ECMWF seasonal forecast properly aligns with the historical signature above. It indicates below-normal temperatures across the southern and central United States in mid-to-late winter 2026/2027, contrasted by significant warmth across Canada under a high-pressure zone.
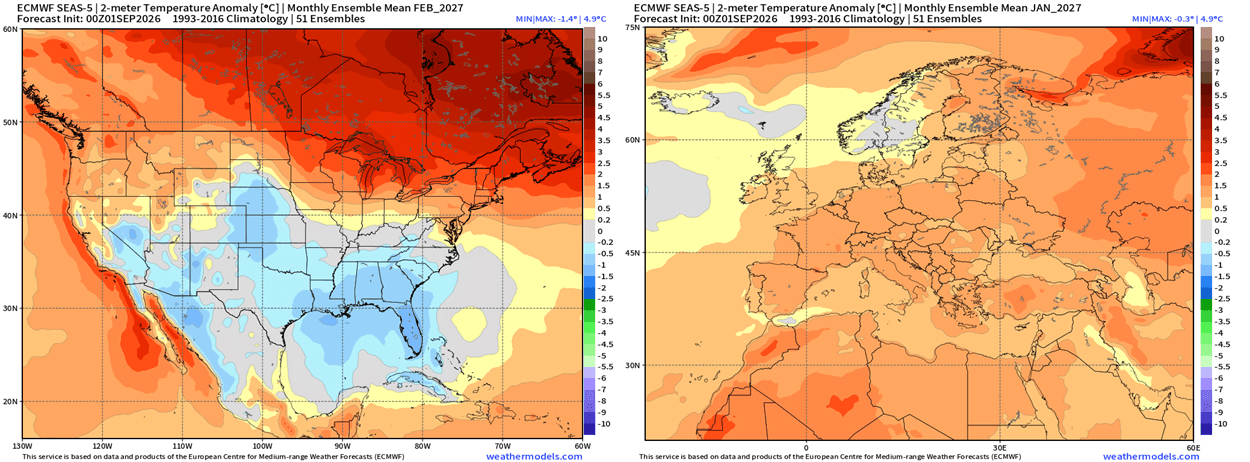
For Europe, the mid-winter outlook favors widespread above-normal temperatures across the continent, as the historical analysis above also suggests.
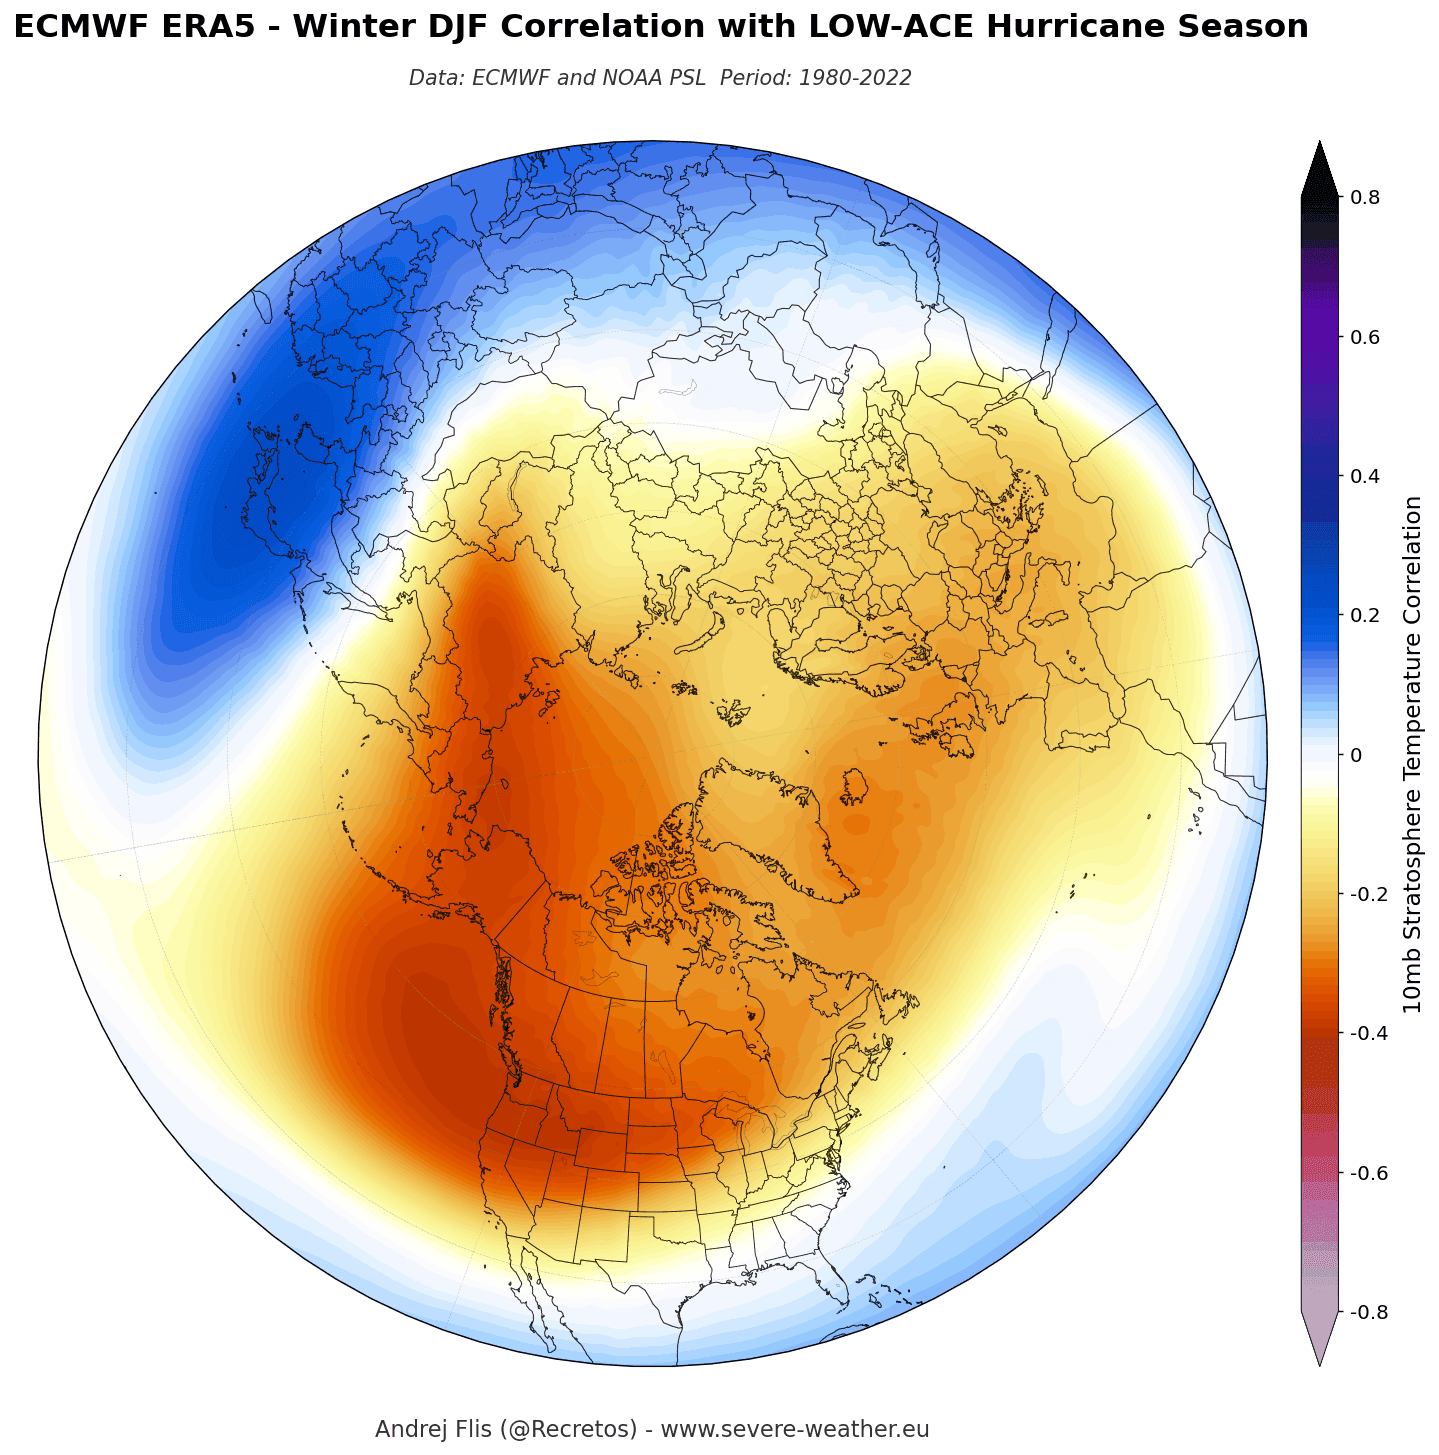
But what I have also found is a connection in the stratosphere. The image below shows a warmer winter stratosphere and a weaker/disrupted Polar Vortex, following a slow hurricane season. This does not imply that hurricane season directly impacts the Polar Vortex, but there is likely a common El Niño factor at play that also includes the Pacific impacts and atmospheric waves.
With this in mind, I loaded and plotted the latest forecast data for the stratosphere. Below you can see the Polar Vortex wind forecast, which is how we estimate its strength. In this latest seasonal data, we can clearly see an interesting deceleration and a potential disruption trend starting in early January.
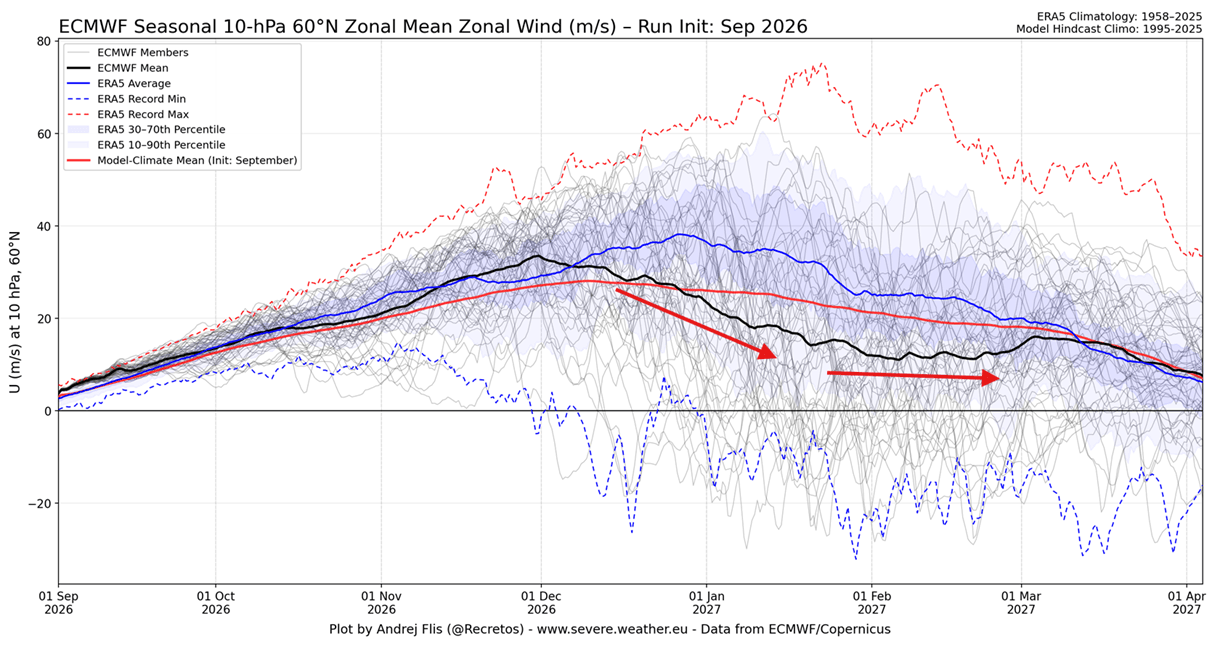
The forecast line (black) goes far below the long-term average line (blue), and the model’s own normal (red). This indicates a power drop or a disruption trend for the Polar Vortex in January/February 2027. As shown above, mid-winter disruption can follow weak hurricane seasons, and both are likely linked to the Super El Niño impact.
A weak Polar Vortex can disrupt the jet stream pattern, leading to a strong winter weather response. As a result, it has a harder time containing the cold air, which can now more freely escape from the polar regions into the United States or other mid-latitude regions.
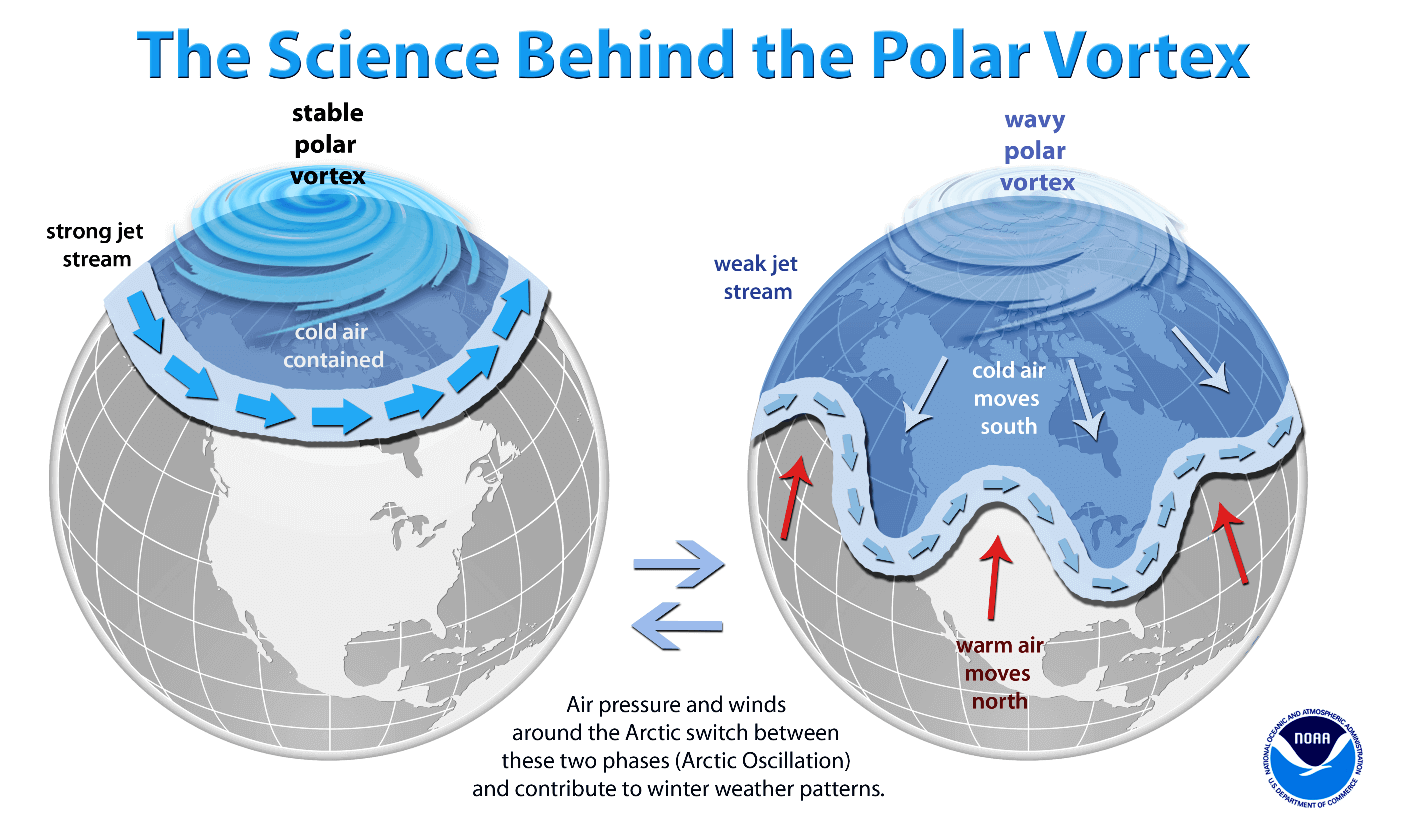
So, for a colder and snowier Winter, your best bet is a weak Polar Vortex. In nature, a weak Polar Vortex can also mean a complete breakdown of the stratospheric circulation, resulting in the spill-out of cold air from the polar regions.
I will also soon publish a more in-depth analysis of the 2026/2027 Polar Vortex, which is just starting to emerge, and the bumpy path it has ahead, due to the strong El Niño developing.
Scientific Studies Used in this Article
- El Niño and Atlantic Hurricane Activity: The Influence of ENSO Diversity on Future Atlantic Tropical Cyclone Activity – Mueller et al. (2024).
Winter 2026/2027 Snowfall Predictions: New Data Shows a Strong Super El Niño Snow Pattern for 2026/2027
Some of the forecast and analysis images in this article are from NOAA and WeatherBell, using a commercial license.
We will keep you updated on global weather development and the latest long-range outlooks, so bookmark our page. Also, if you have seen this article in the Google App (Discover) feed, click the like button to see more of our forecasts and our latest articles on weather and nature in general.