A new and stronger warming event is developing in the Stratosphere, which will collapse the polar circulation. As a result, a so-called Sudden Stratospheric Warming event is now forecast to displace the Polar Vortex and potentially shake the weather patterns in the coming weeks.
Weather and the stratospheric Polar Vortex are strongly connected, especially in the cold weather season. So high-energy events such as stratospheric warmings can always have a high-impact result.
You will see what is currently going on in the Stratosphere and how the warming events are brewing around the Polar Vortex. But after that, we will also look closely at the latest trends, which are starting to show the typically expected weather impacts from these high-power stratospheric events.
ATMOSPHERIC POLAR VORTEX CIRCULATION
To understand what the Polar Vortex is, we can try and visualize it. In simple terms, it is a single name that describes the broad winter circulation over the northern (and southern) hemispheres.
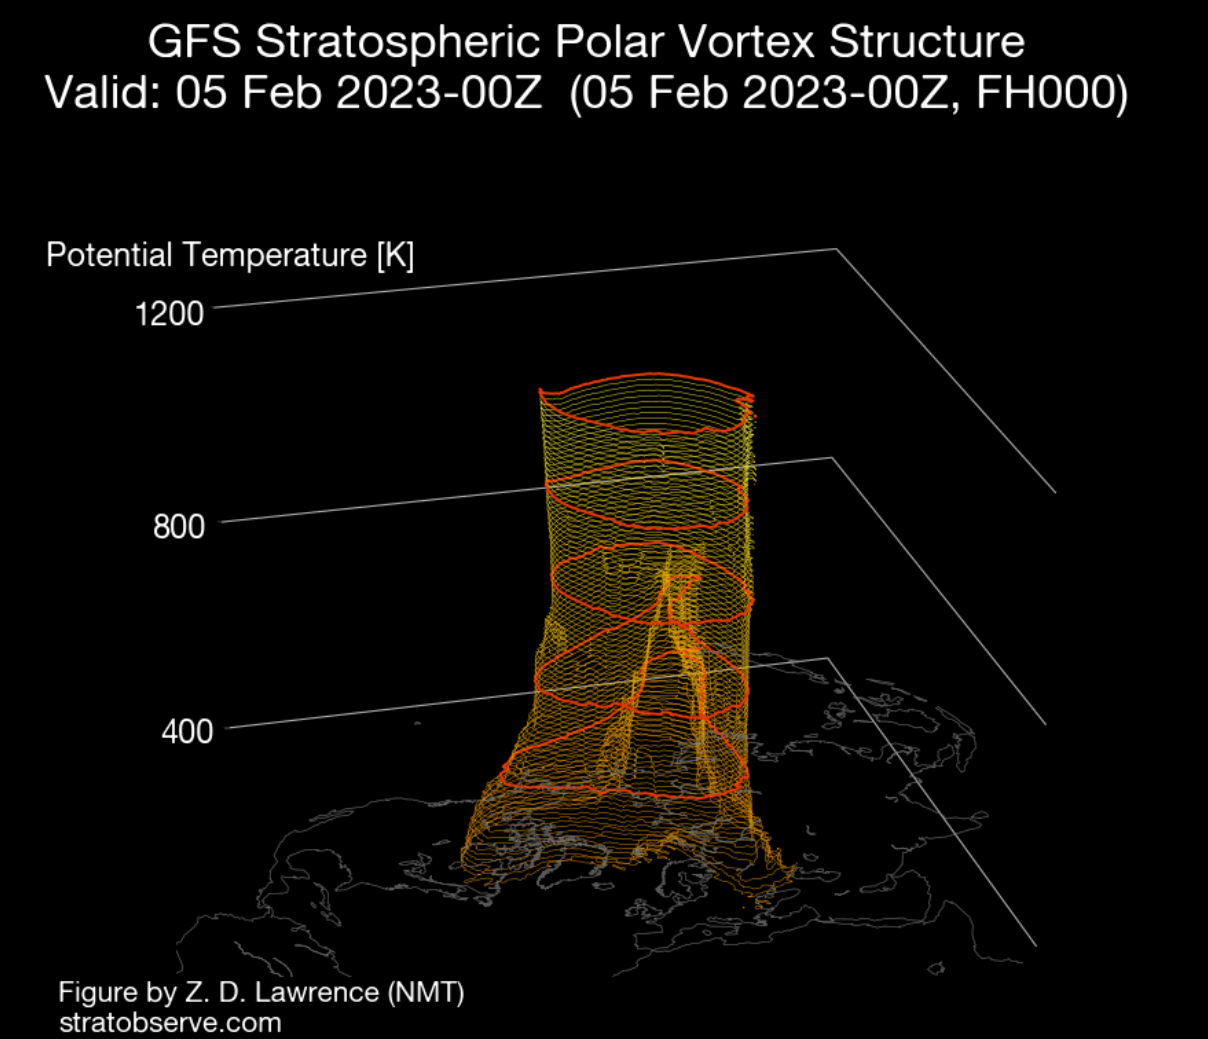
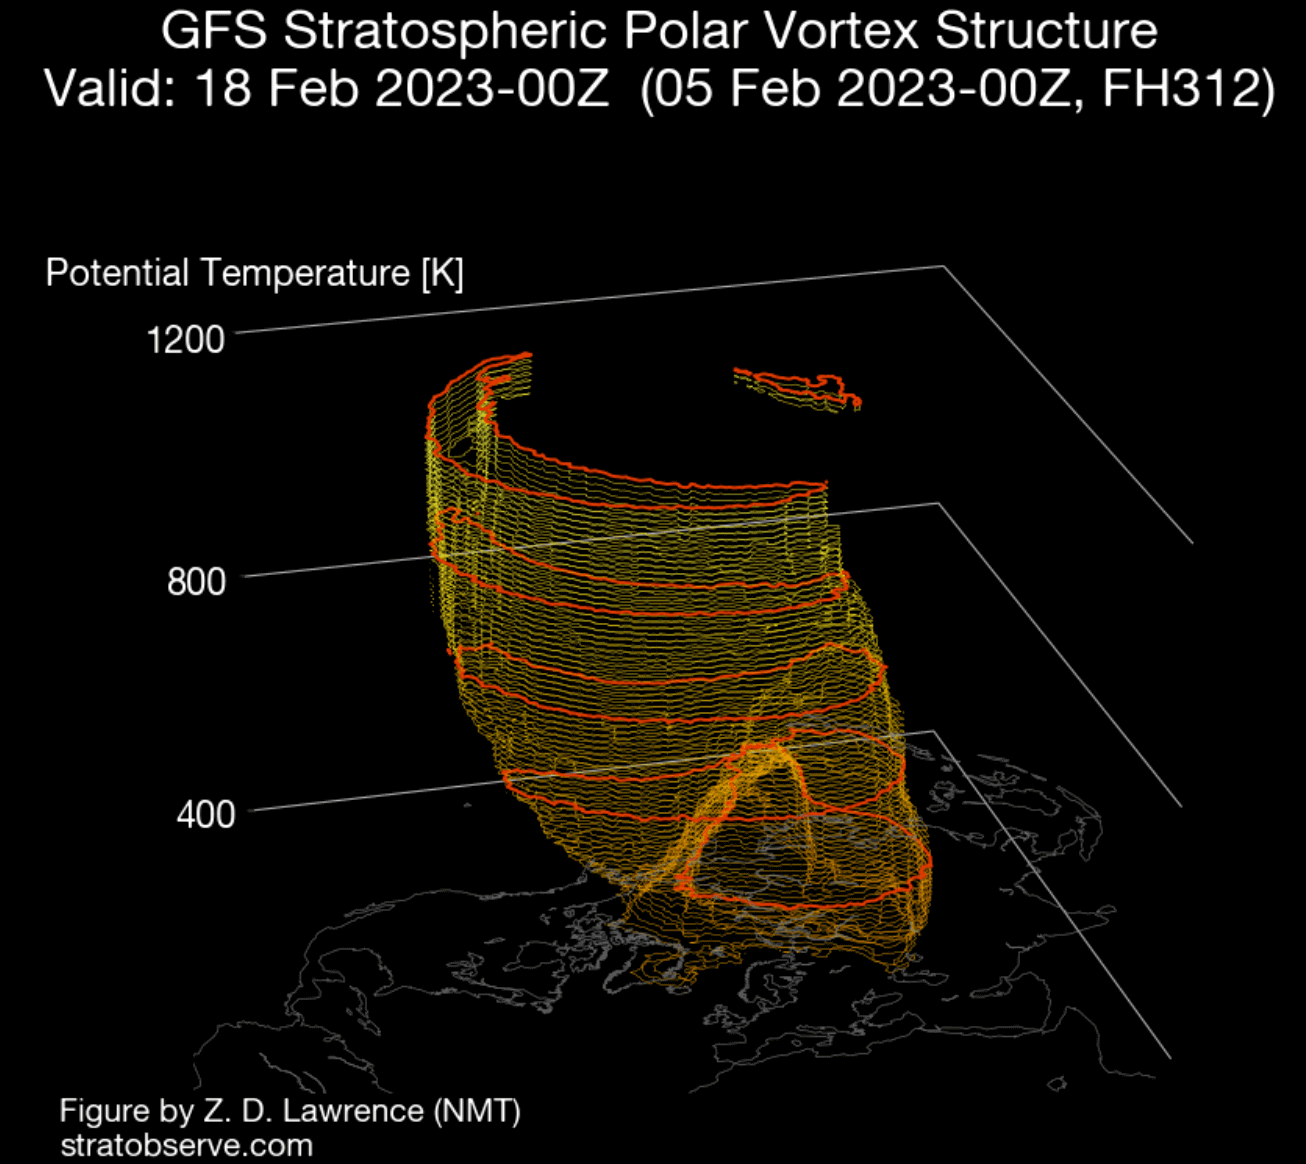
Below, you can see a 3-dimensional image of the Polar Vortex. The vertical axis is greatly enhanced for better visual presentation. In addition, you can see the actual structure of the Polar Vortex, connecting down to the lower levels to the pressure systems.
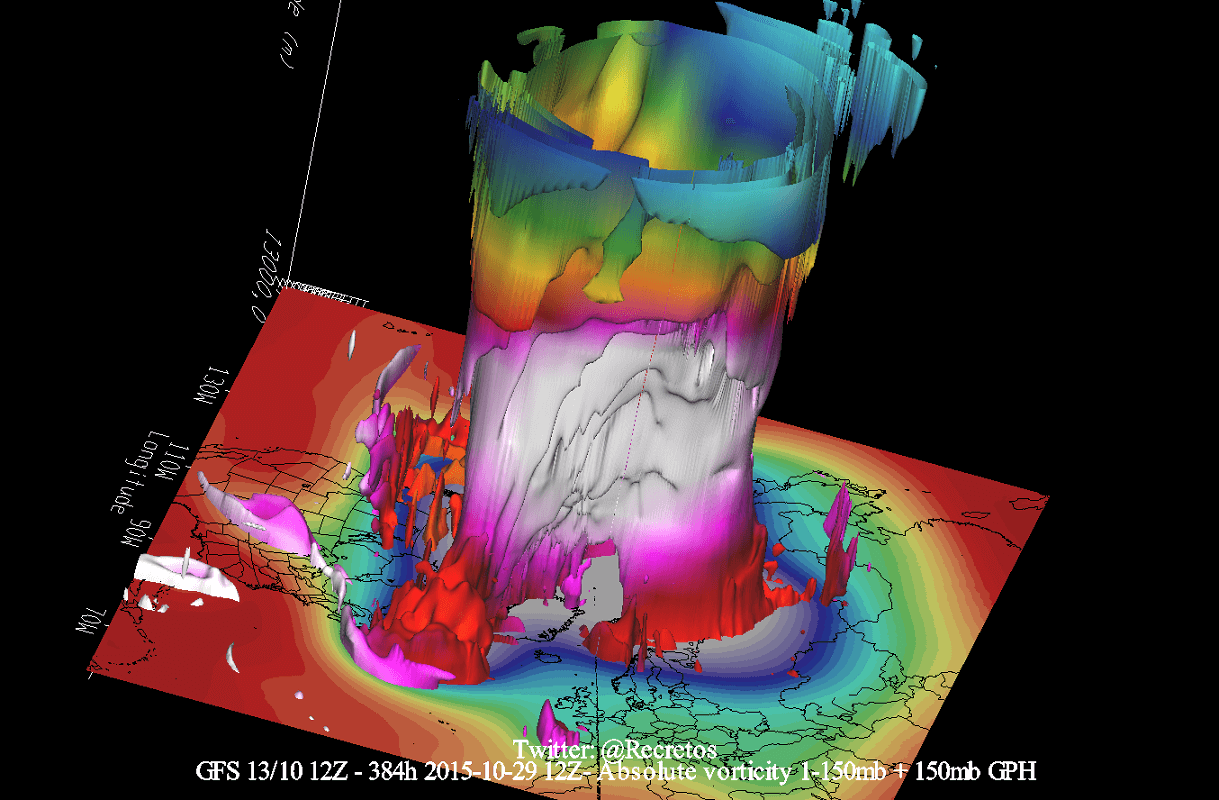
The Polar Vortex extends high up into the atmosphere. You can see the atmospheric layers in the image below. The lowest level of the atmosphere is called the troposphere, where all the weather events are. But above that, we have the Stratosphere, a deeper and drier layer and the home of the ozone layer.
For this reason, we tend to separate the entire Polar Vortex into an upper (stratospheric) and a lower (tropospheric) part. They both play their role differently, which is why we monitor them separately. But it is also very important if they are properly connected—image by NOAA-Climate.
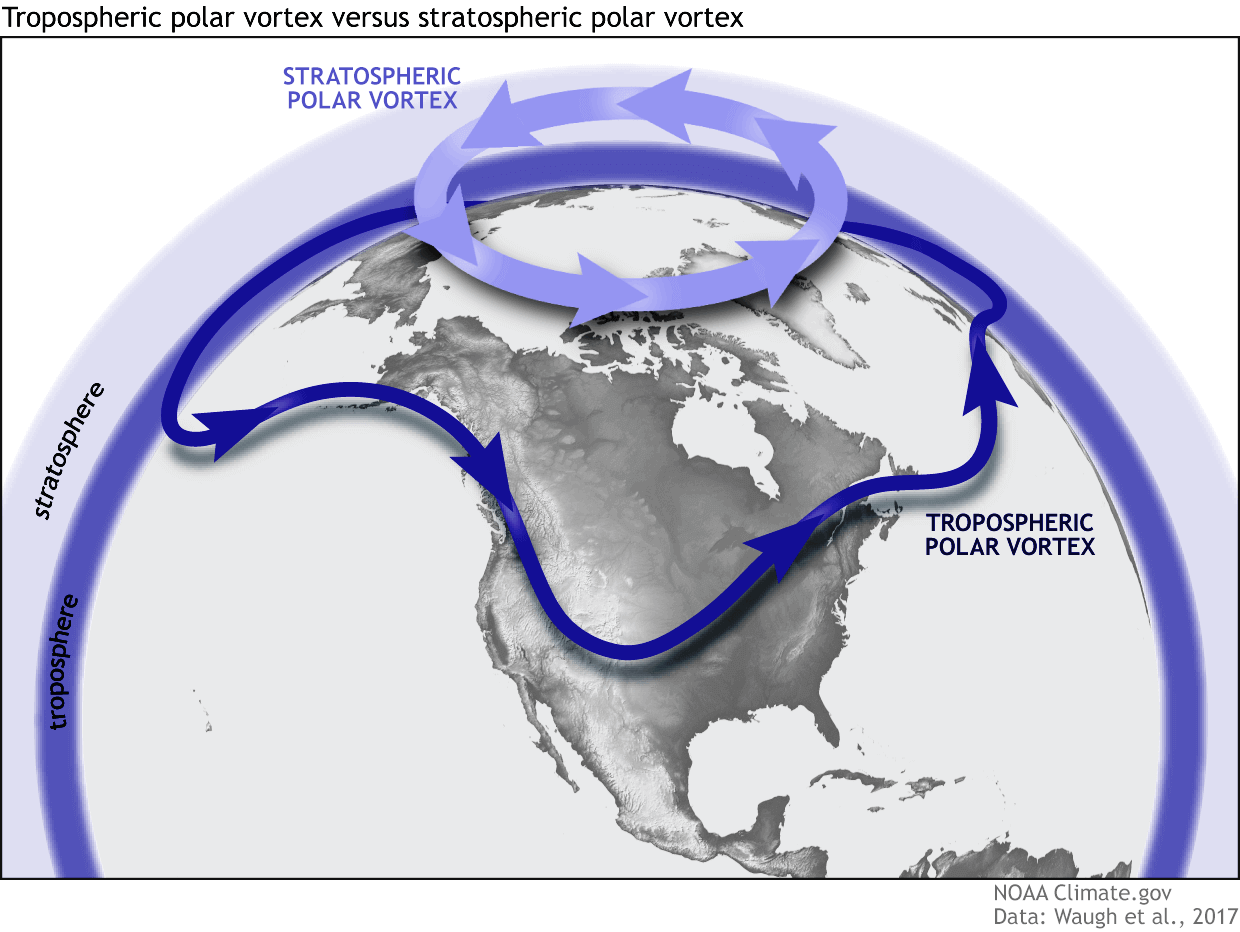
The upper (stratospheric) part is more circular and symmetrical as it spins higher above the ground, with fewer obstacles in its flow. But the lower structure of the Polar Vortex is much more uneven and mainly disrupted. That is due to the influence of the terrain/mountains and strong pressure systems acting as obstacles.
So to recap, the Polar Vortex behaves like a very large cyclone, covering the whole north pole down to the mid-latitudes. It is connected through all atmospheric levels, from the ground up, but can have different shapes at different altitudes.
We monitor any Polar Vortex activity because it can have weather implications across the entire Northern Hemisphere. And that is regardless if it is weak or strong.
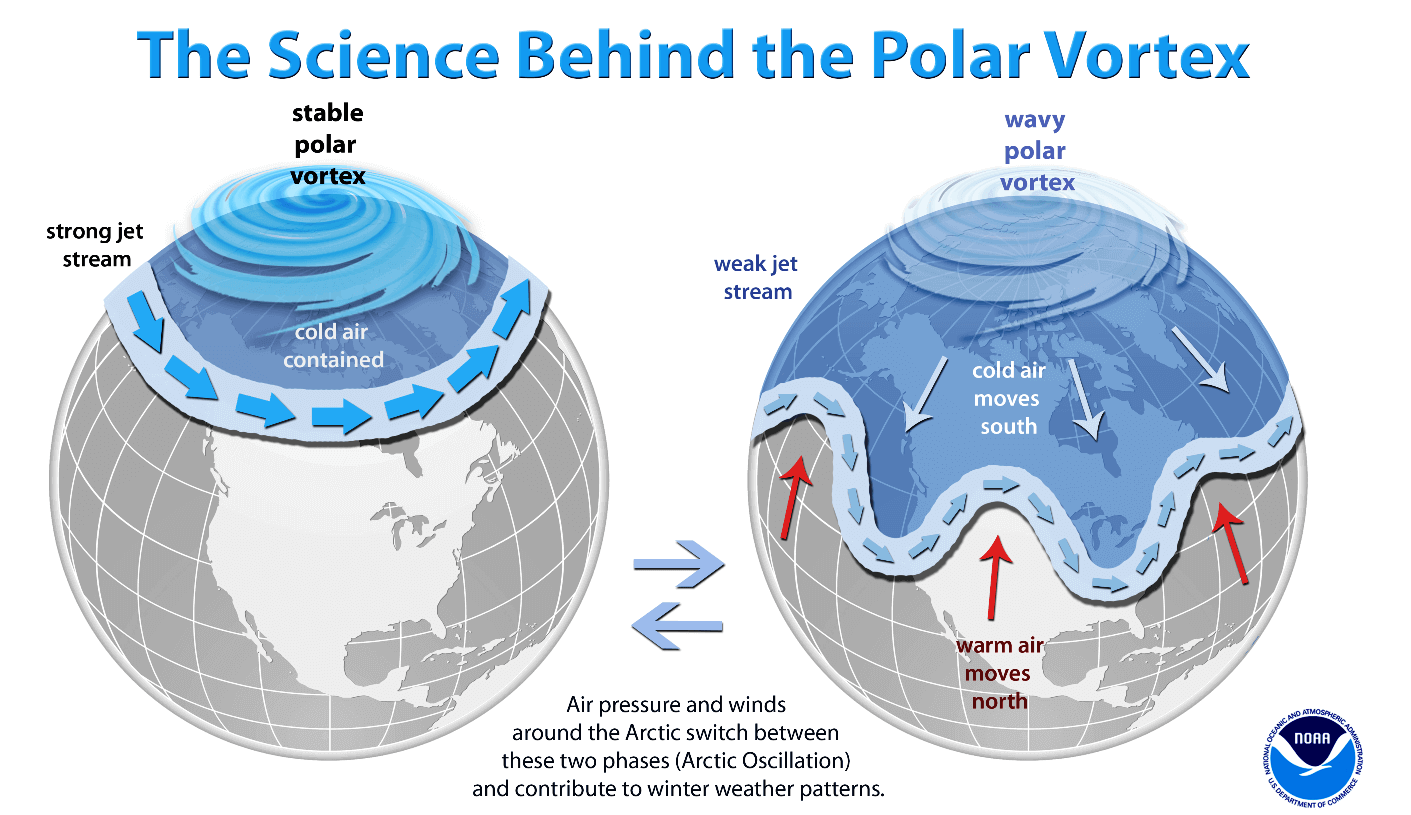
A strong Polar Vortex usually means strong polar circulation. This locks the colder air into the Arctic circle, creating milder conditions for most of the United States and Europe.
In contrast, a weak Polar Vortex creates a weak jet stream pattern. As a result, it has a harder time containing the cold air, which can now escape from the polar regions into the United States and Europe. Image by NOAA.
This is why a Sudden Stratospheric Warming event (SSW) can be such a game-changer, as it can shift the mode from a strong to a weak Polar Vortex in a short time.
To put the Polar Vortex into perspective, we produced a high-resolution video below, showing the Vortex spinning over the Northern Hemisphere in the Stratosphere at the 30mb level, around 23km/14miles altitude.
The video mainly shows that the Polar Vortex is not just one winter storm or a cold outbreak that moves from the Midwest into the northeastern United States.
It is a large cyclonic area spinning over the entire Northern Hemisphere, from the ground up to the top of the Stratosphere and beyond, reaching over 50km/31miles in altitude.
So, what are we looking at in the near future with the Polar Vortex and the weather circulation? In the next image below, you can see the westerly wind speeds across the atmosphere. The bottom is the surface layer, and the top of the image is the top of the Stratosphere.
We can see 3 phases of development in the Stratosphere. First, we have the normal (strong) winds and a strong Polar Vortex (black box). Then a weakening period follows as more energy enters the Stratosphere (orange box).
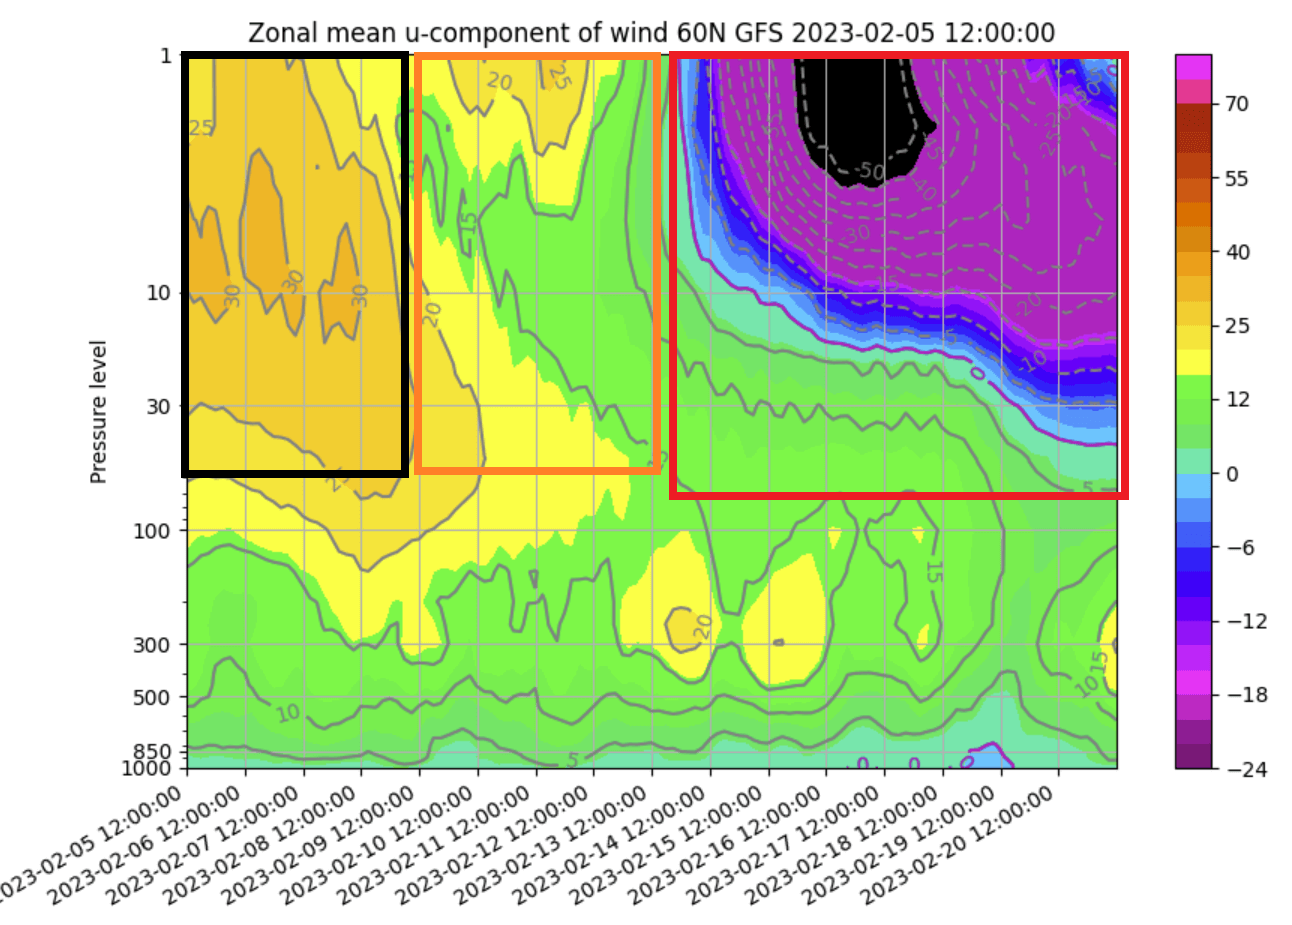
The influx of energy into the Stratosphere creates a major disruption and warming, completely collapsing the upper stratospheric Polar Vortex (red box). As a result, you can see a proper wind reversal from westerly to easterly (negative values) and the breakdown of the normal circulation.
That is the main focus of our article and its possible weather effects on the surface.
STRATOSPHERIC HIGHS AND LOWS
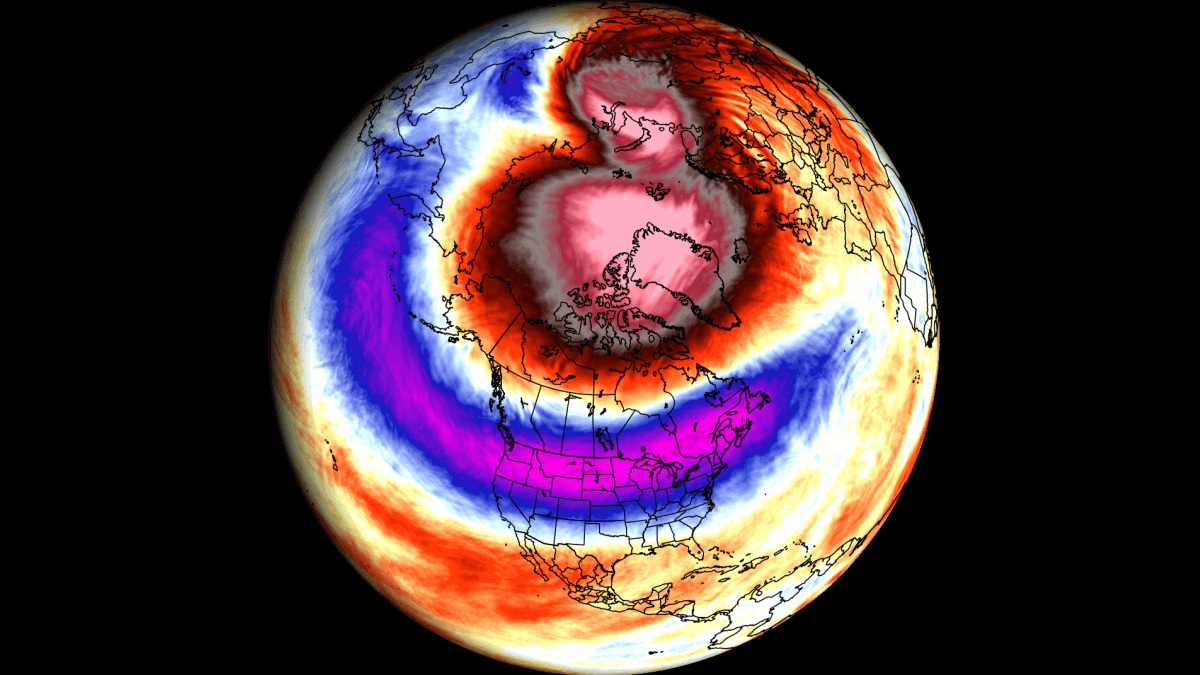
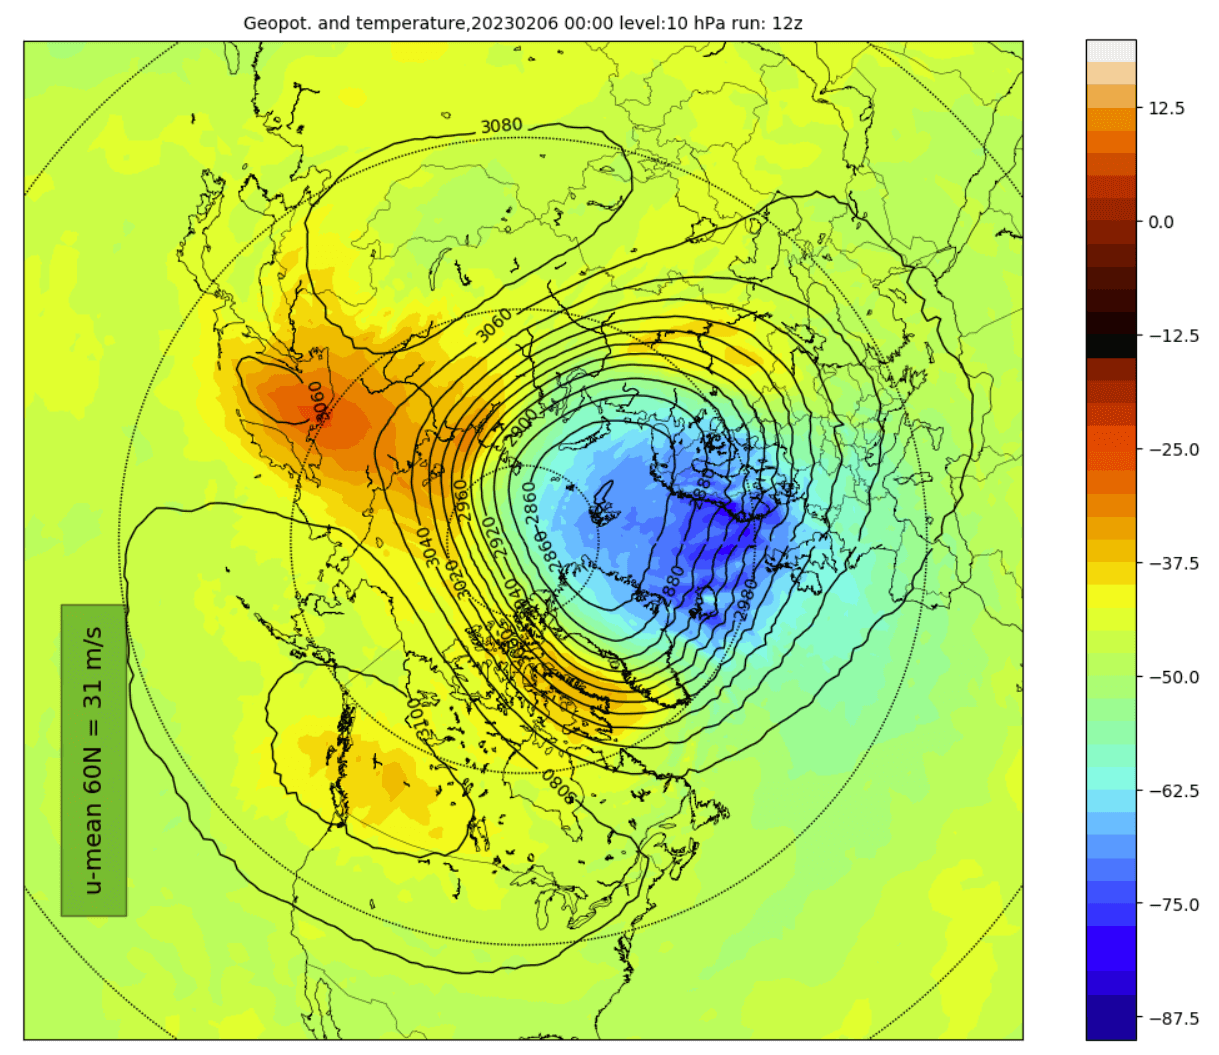
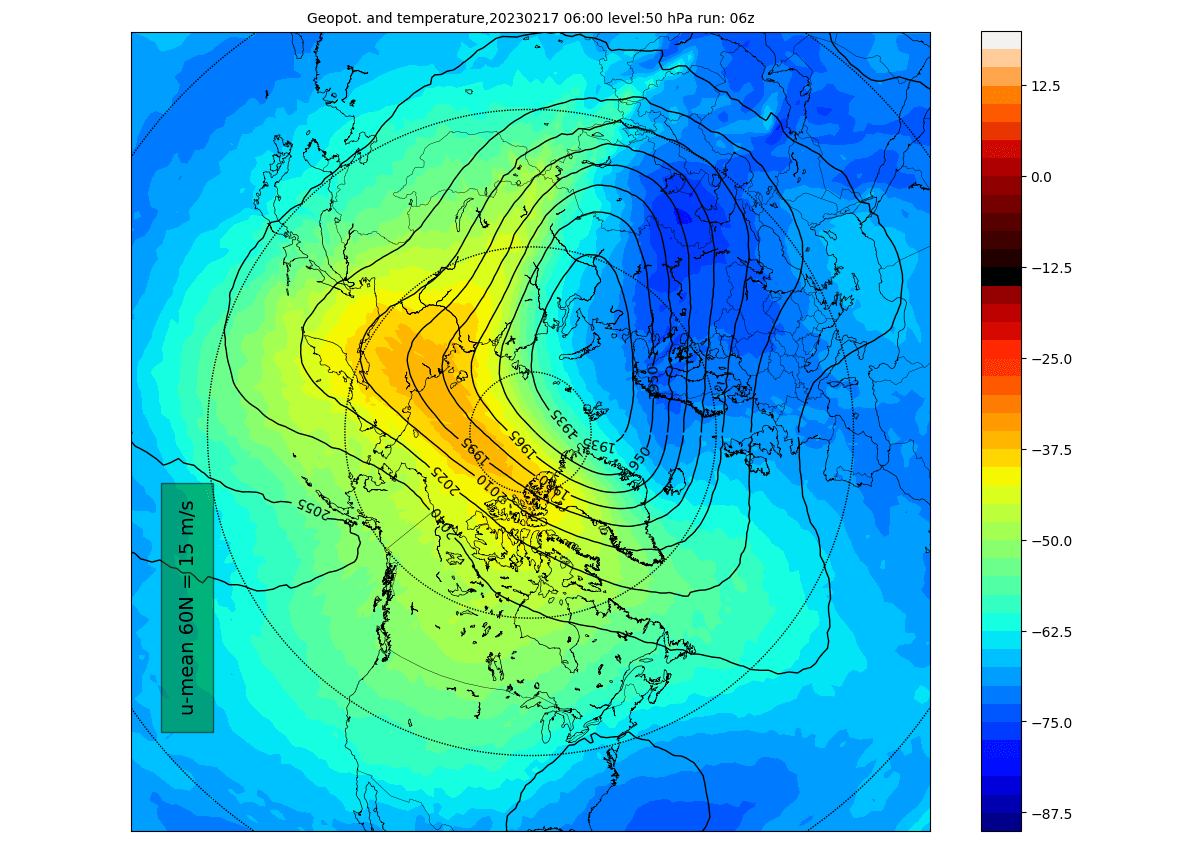
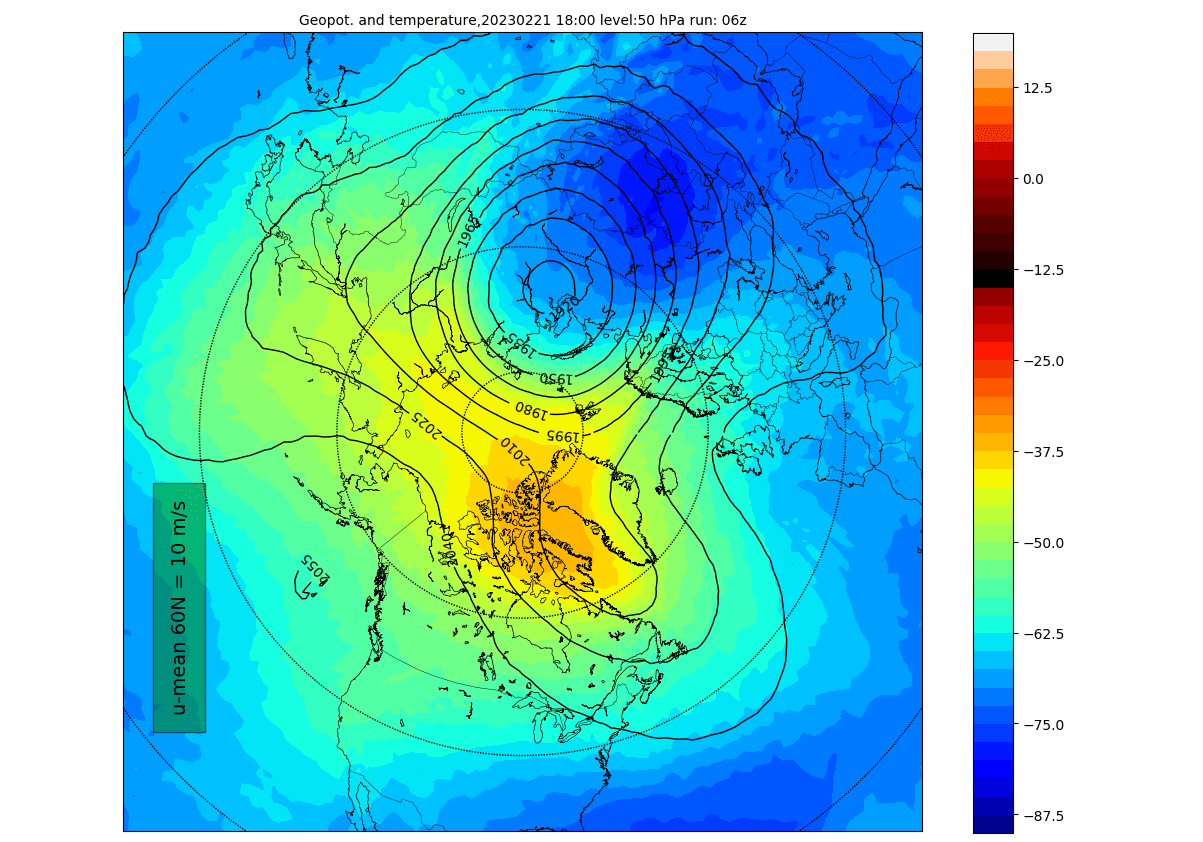
The Polar Vortex is currently in a reduced size, as stratospheric high-pressure systems are compressing it. The image below shows geopotential height and temperature in the mid-stratosphere at the 10mb level (30km/18.5miles). The Polar Vortex looks like a “cyclone” with lower pressure and a colder core.
If we look at the 3D structure, we can fully see the compact structure of the Polar Vortex. It is quite circular at the top but then stretches in the lower levels with more dynamics disrupting the circulation.
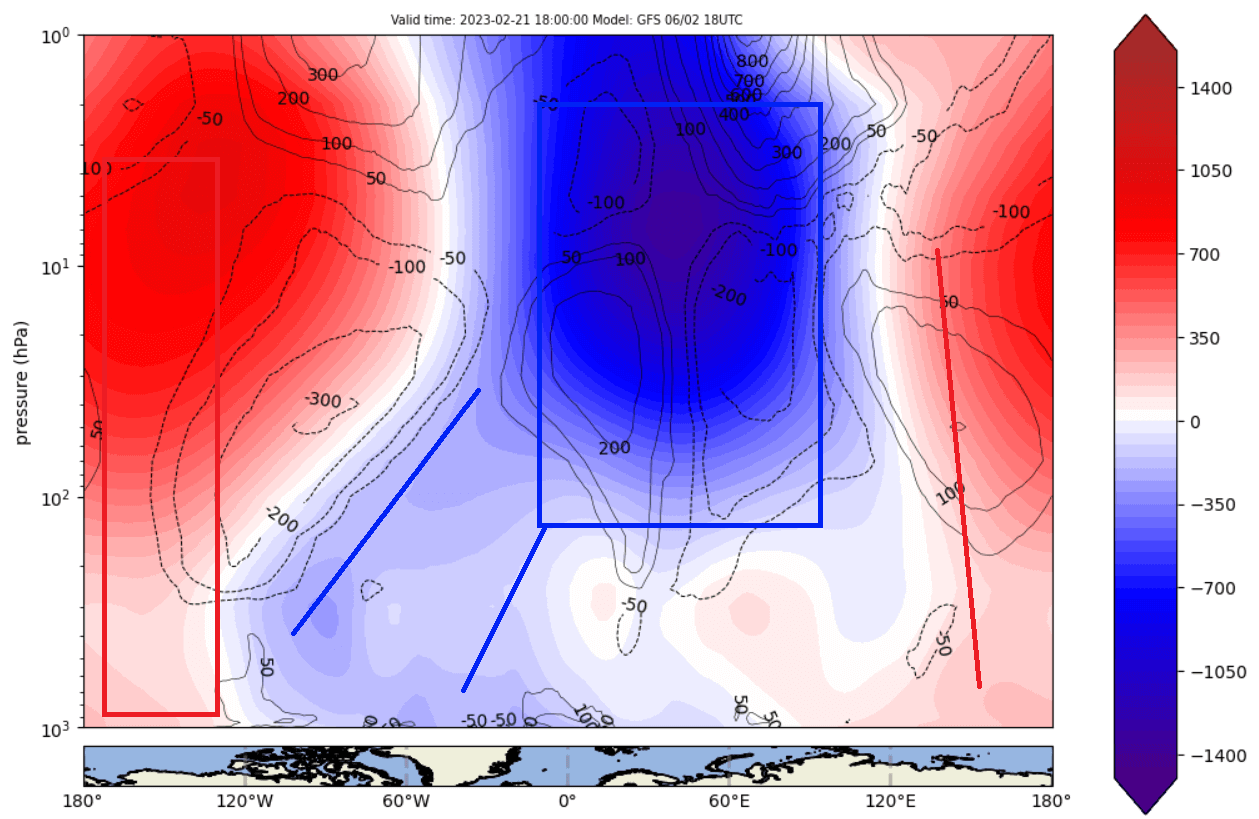
Another way to look at the vertical structure is by looking at the pressure anomalies in the atmosphere. The image below is by weatheriscool.com, and it might look complex but is fairly easy to read. The top of the image is the top of the Stratosphere, and the bottom is the surface level. Blue is for lower pressure, and red indicates higher pressure.
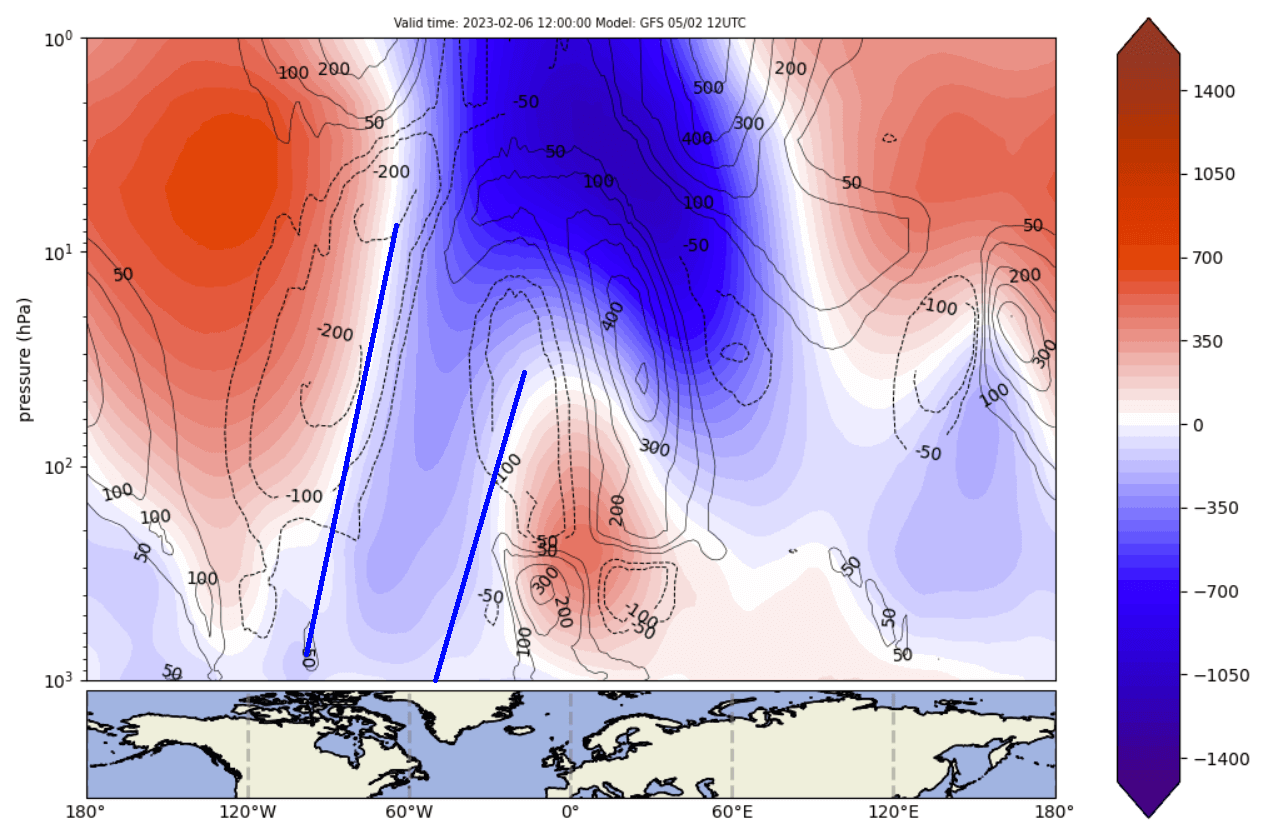
Negative anomalies (blue) extend down from the Stratosphere to the surface levels. This is an extension of the Polar Vortex core, reaching down into eastern Canada and the United States.
Looking below is the pressure pattern analysis for the weekend. You can see the marked broad low-pressure area. This is the main core of the tropospheric (lower) Polar Vortex that had a brief connection up into the core of the stratospheric Polar Vortex.
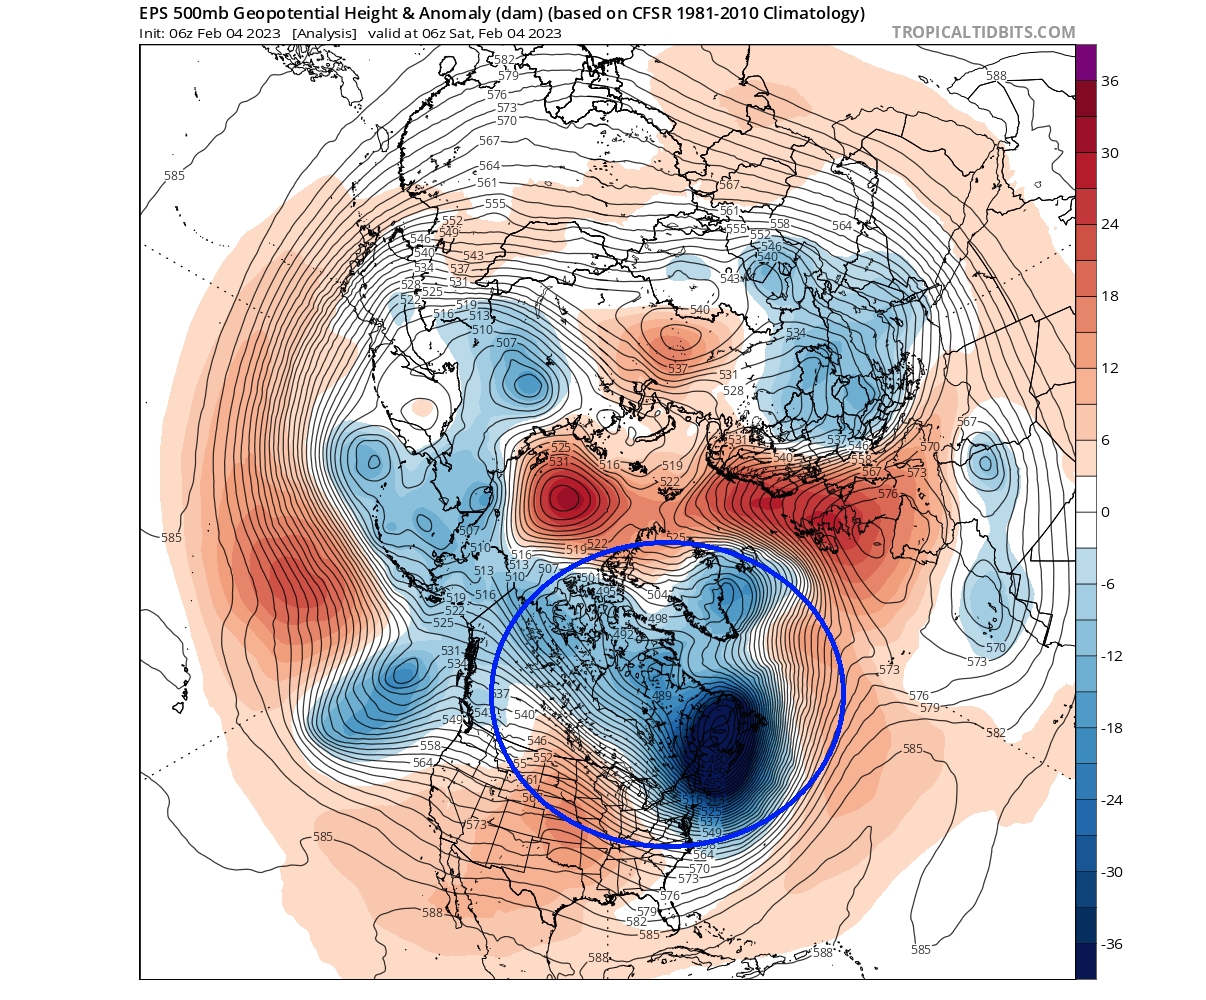
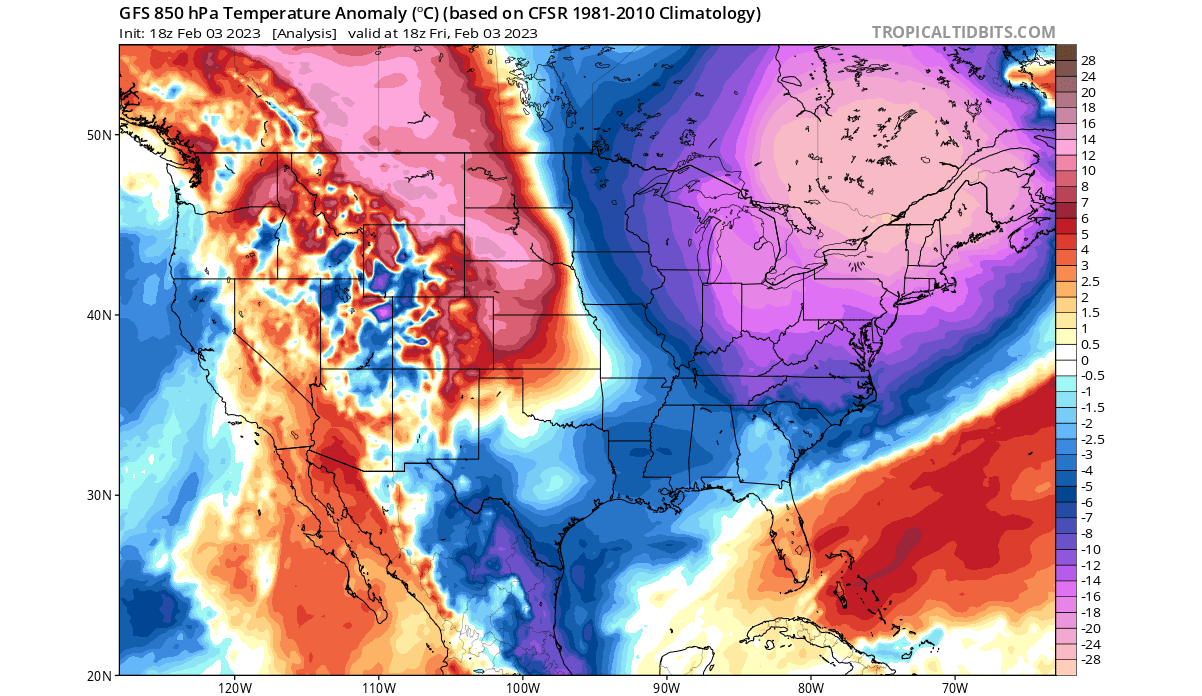
The strong lower core of the Polar Vortex brought very cold air over the Midwest and the eastern United States over the weekend. Such strong low-pressure systems enable strong transport of the cold Arctic airmass from the north.
But looking ahead now, a major disruption is coming for the stratospheric part of the Polar Vortex.
POLAR VORTEX DISRUPTION BEGINS
So we know that a major disruption and warming is coming for the Polar Vortex. But where do these warming waves suddenly come from?
Usually, it is from the direct influence of strong pressure systems, having an impact upwards into the Stratosphere. Pairs of pressure systems are also known as Rossby Waves. You can see an example of Rossby waves in the image below by NOAA.
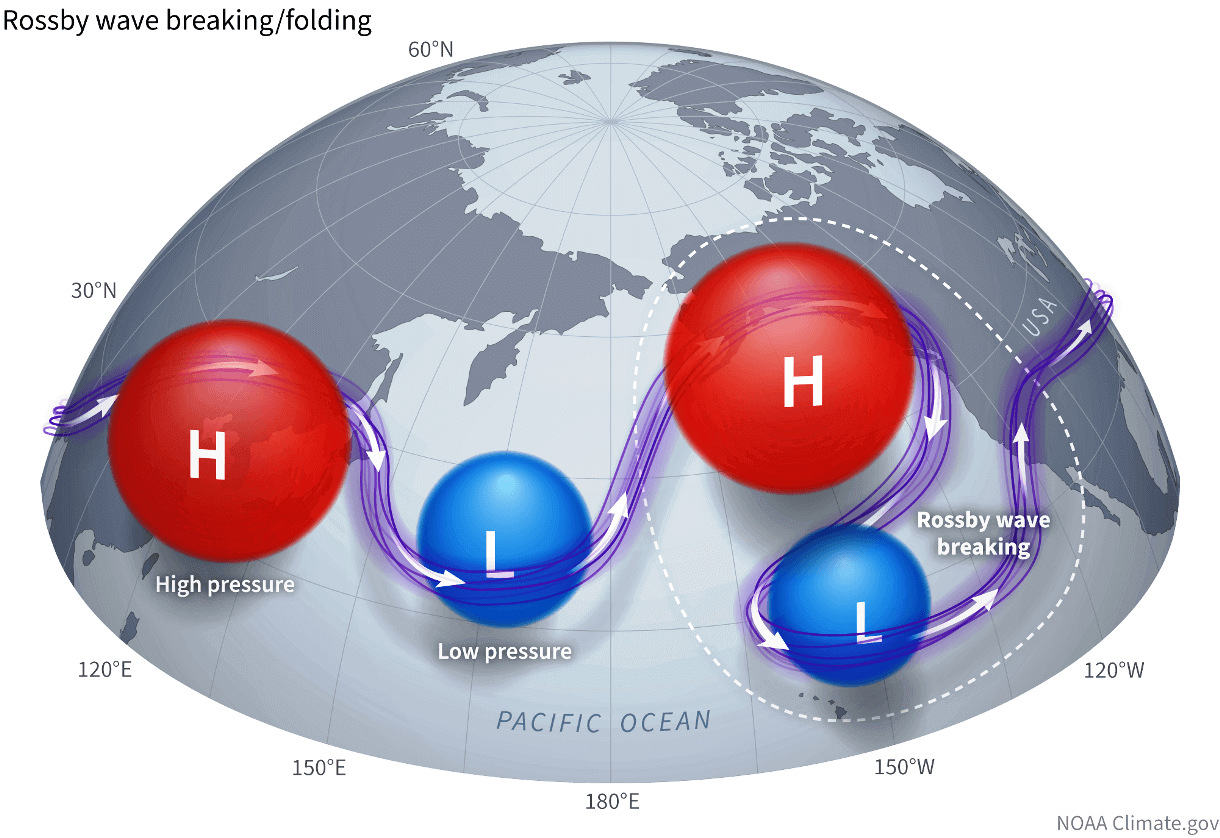
Rossby Waves (a pair of strong high and low-pressure systems) deflect energy upwards into the Stratosphere as they break. That energy can deform the Polar Vortex, temporarily pausing its strengthening or weakening its circulation.
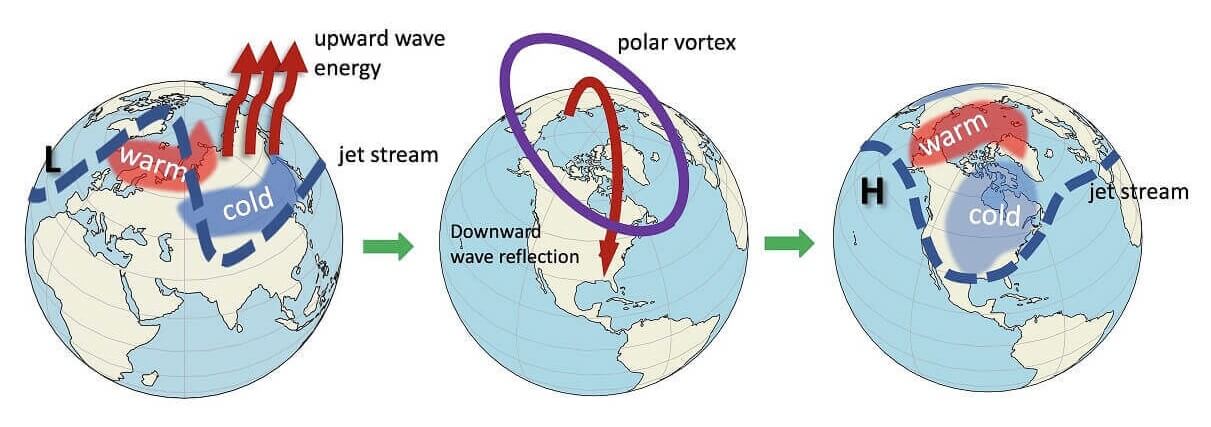
In the image below, you can see the vertical wave activity example. First, the energy goes into the Stratosphere, which impacts the Polar Vortex and later affects the polar circulation back down, changing the weather patterns as the Polar Vortex is disrupted.
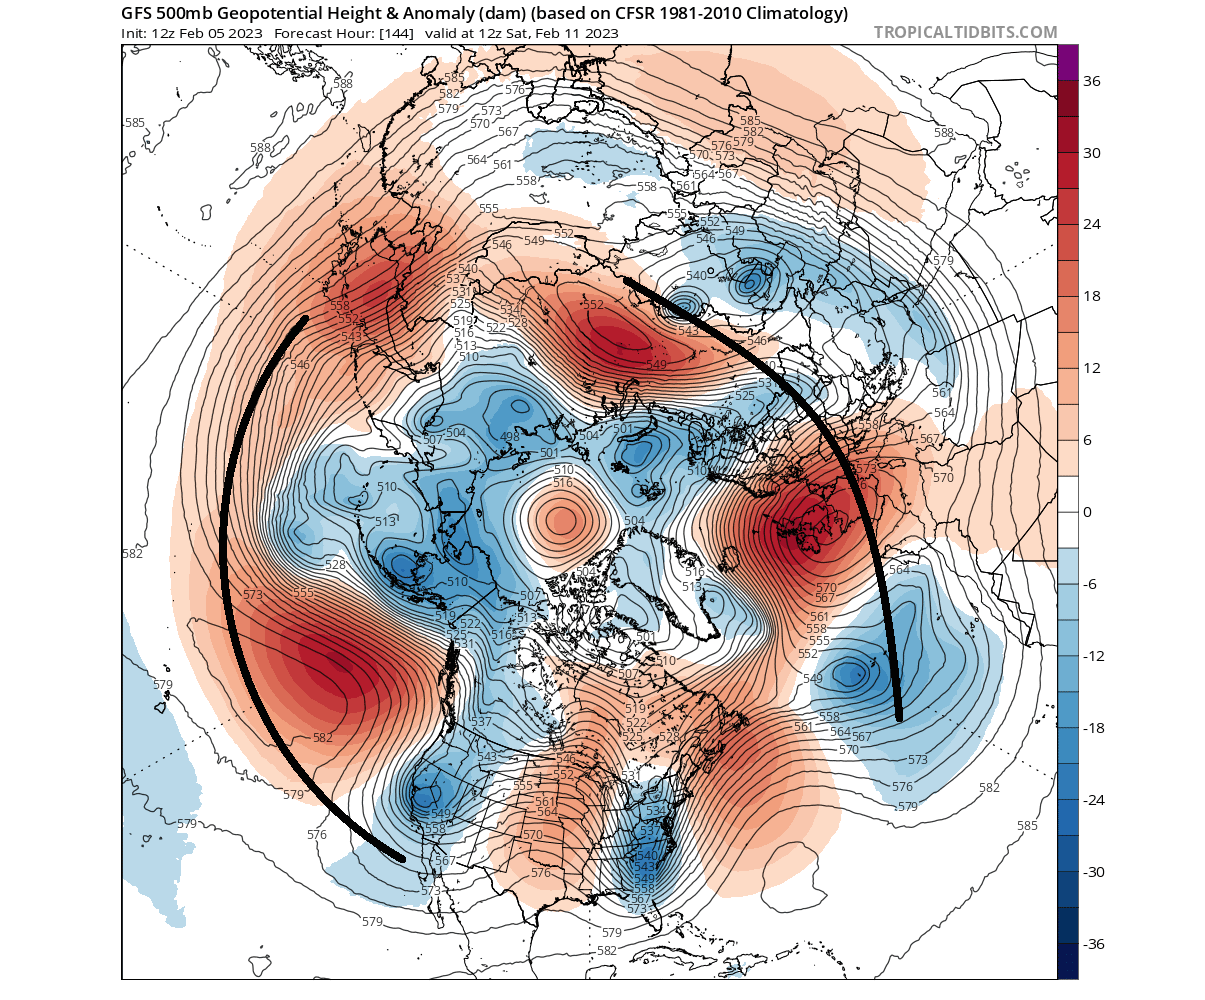
We can see the Rossby waves in the pressure forecast below. Notice the pairings of high and low-pressure regions. This setup enables the “wave breaking,” sending energy upwards into the Stratosphere and disrupting the Polar Vortex dynamics.
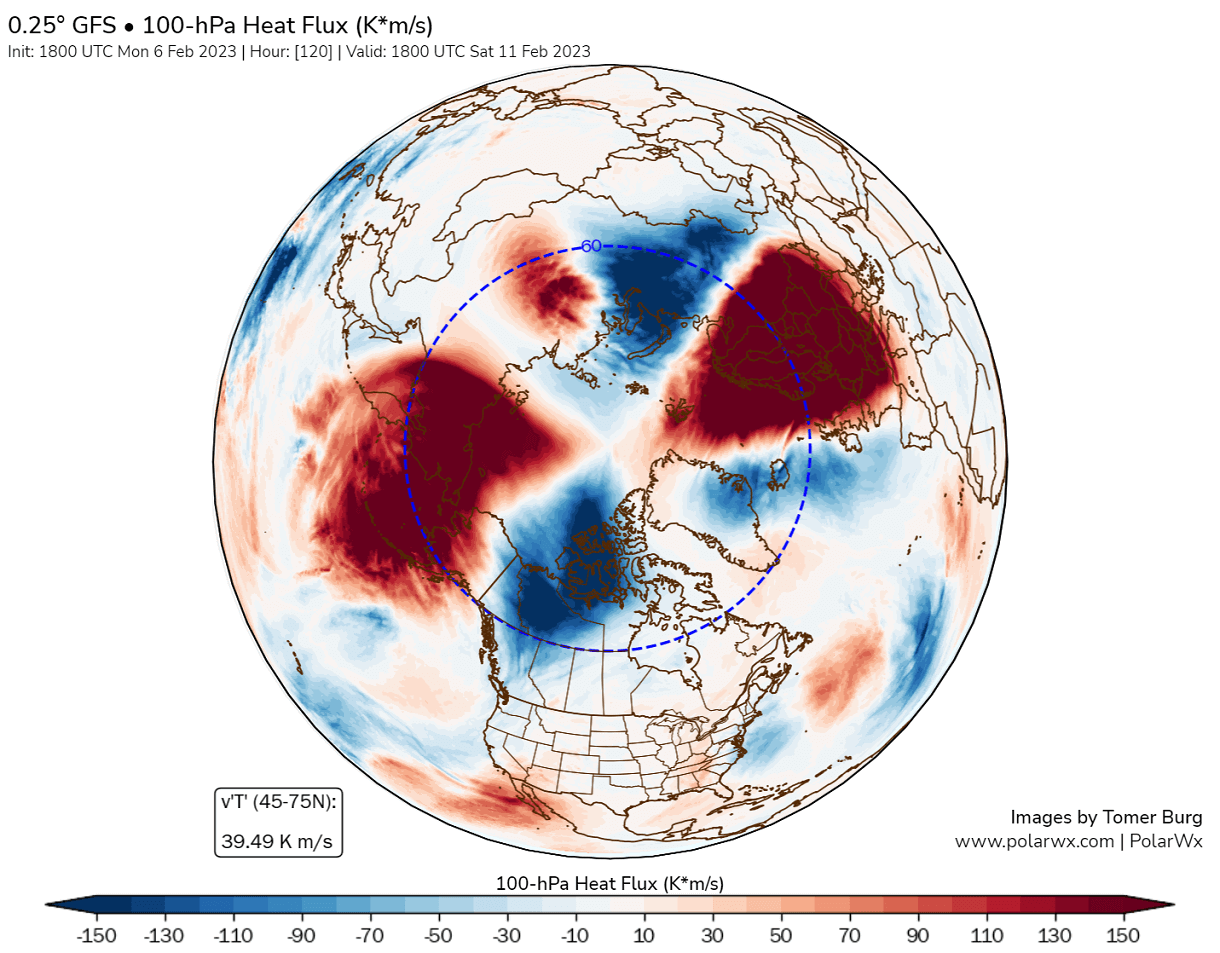
For that purpose, we have a special graphic from Tomer Burg. Below you can see the 100mb heat flux chart. It shows the temperature transport from the troposphere to the Stratosphere. Again, you can see strong regions with positive upward heat/energy transfer in the main Rossby wave-breaking activity area.
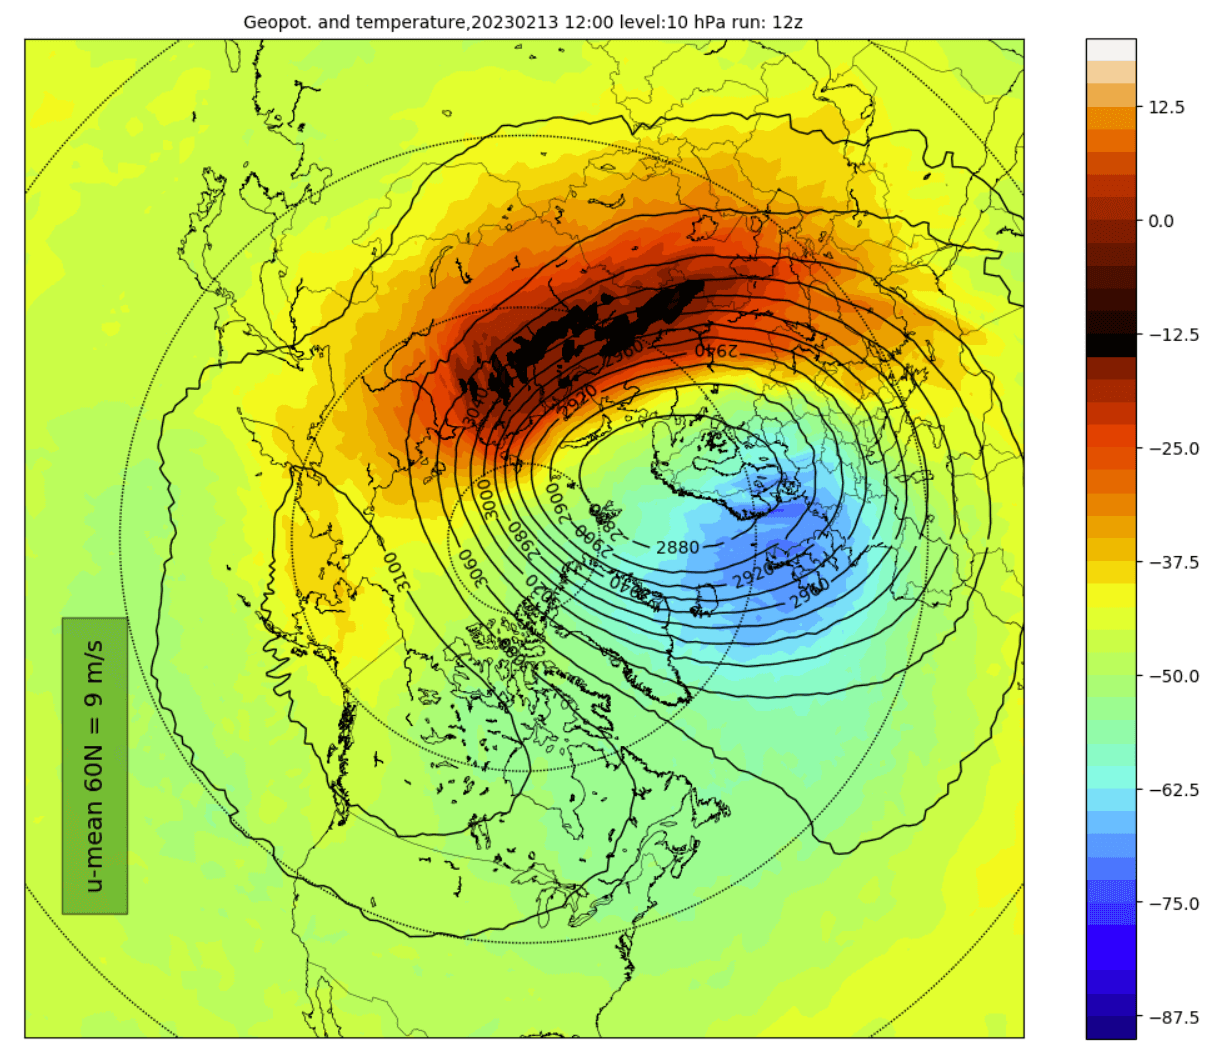
Looking at the Stratosphere, you can see in the forecast below where that energy manifests in the middle levels. A very strong warming area is forecast to appear over Siberia, engulfing the outer layers of the Polar Vortex.
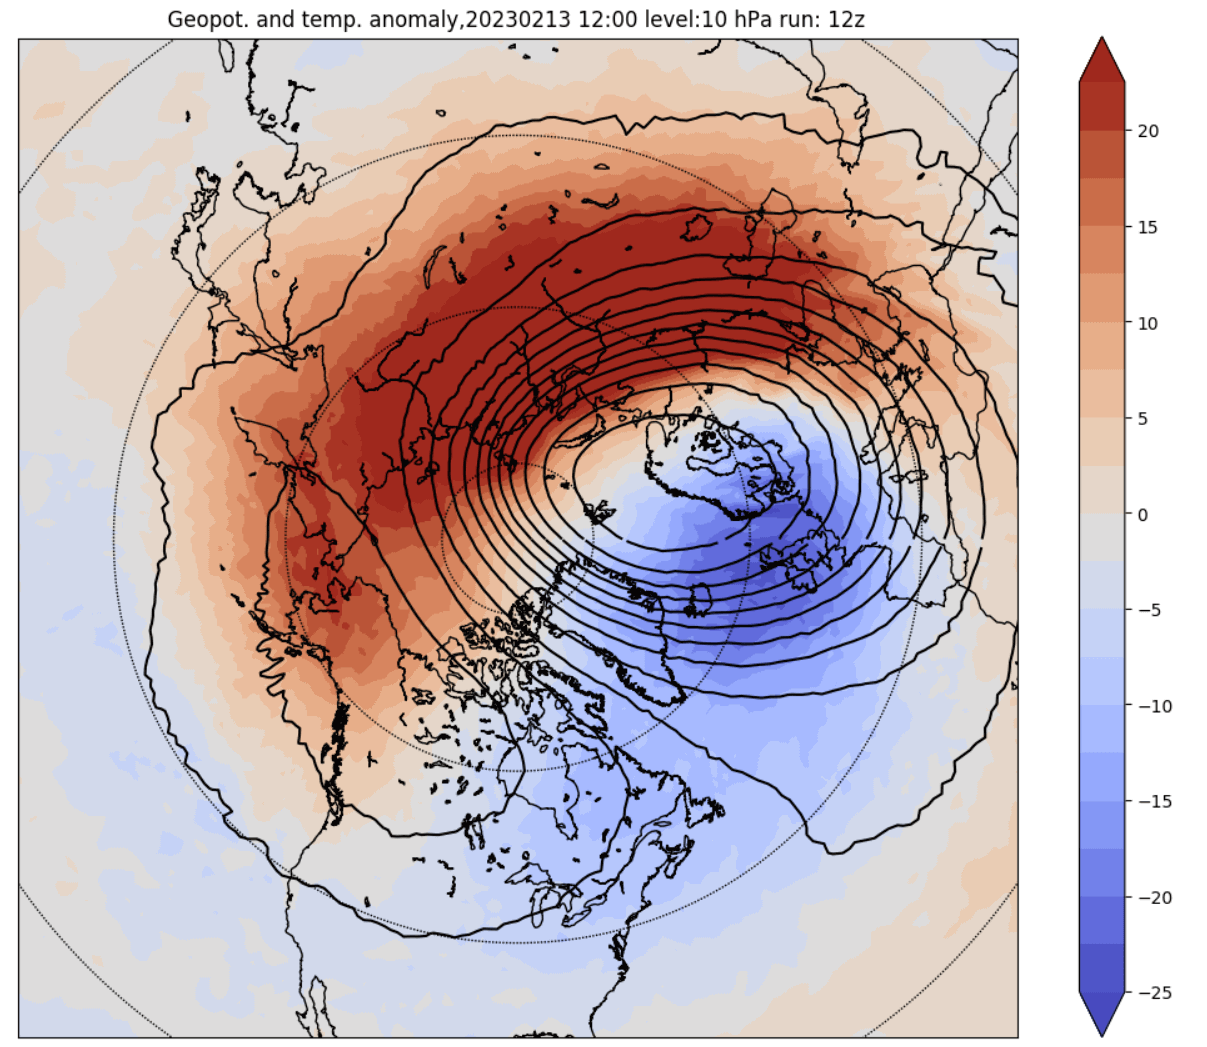
The temperature anomaly also shows the strong, abnormally high temperatures surrounding the Vortex, weakening it further. That works in tandem with a higher-pressure zone emerging over the North Pacific and extending over North America in the Stratosphere.
Below is a forecast for the 30mb pressure level in the Stratosphere, at around 23km/14miles altitude. You can see the Polar Vortex displaced to the east. Even at these lower levels, the warming can still be seen. The lower the warming goes, the more robust it usually is.
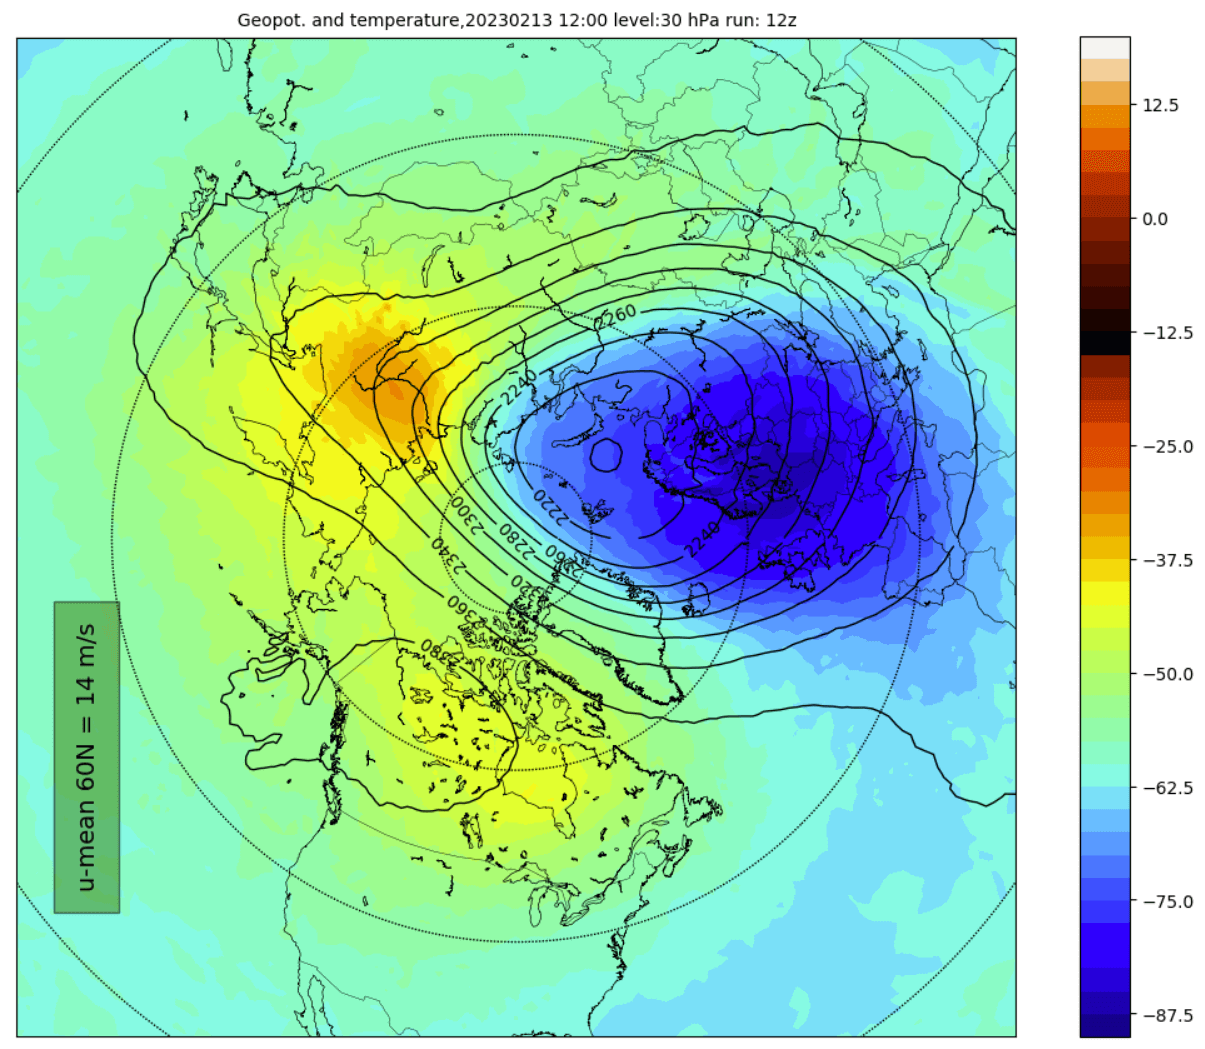
So having a warming wave reach further down into the middle and lower levels of the Stratosphere is a sign of a strong event.
SUDDEN STRATOSPHERIC WARMING EVENT
In around ten days, the Stratosphere is expected to serve up the main course. A proper Sudden Stratospheric Warming event (SSW). Not every temperature increase is marked as a major Sudden Stratospheric Event (SSW). For that to occur, a special condition must be met.
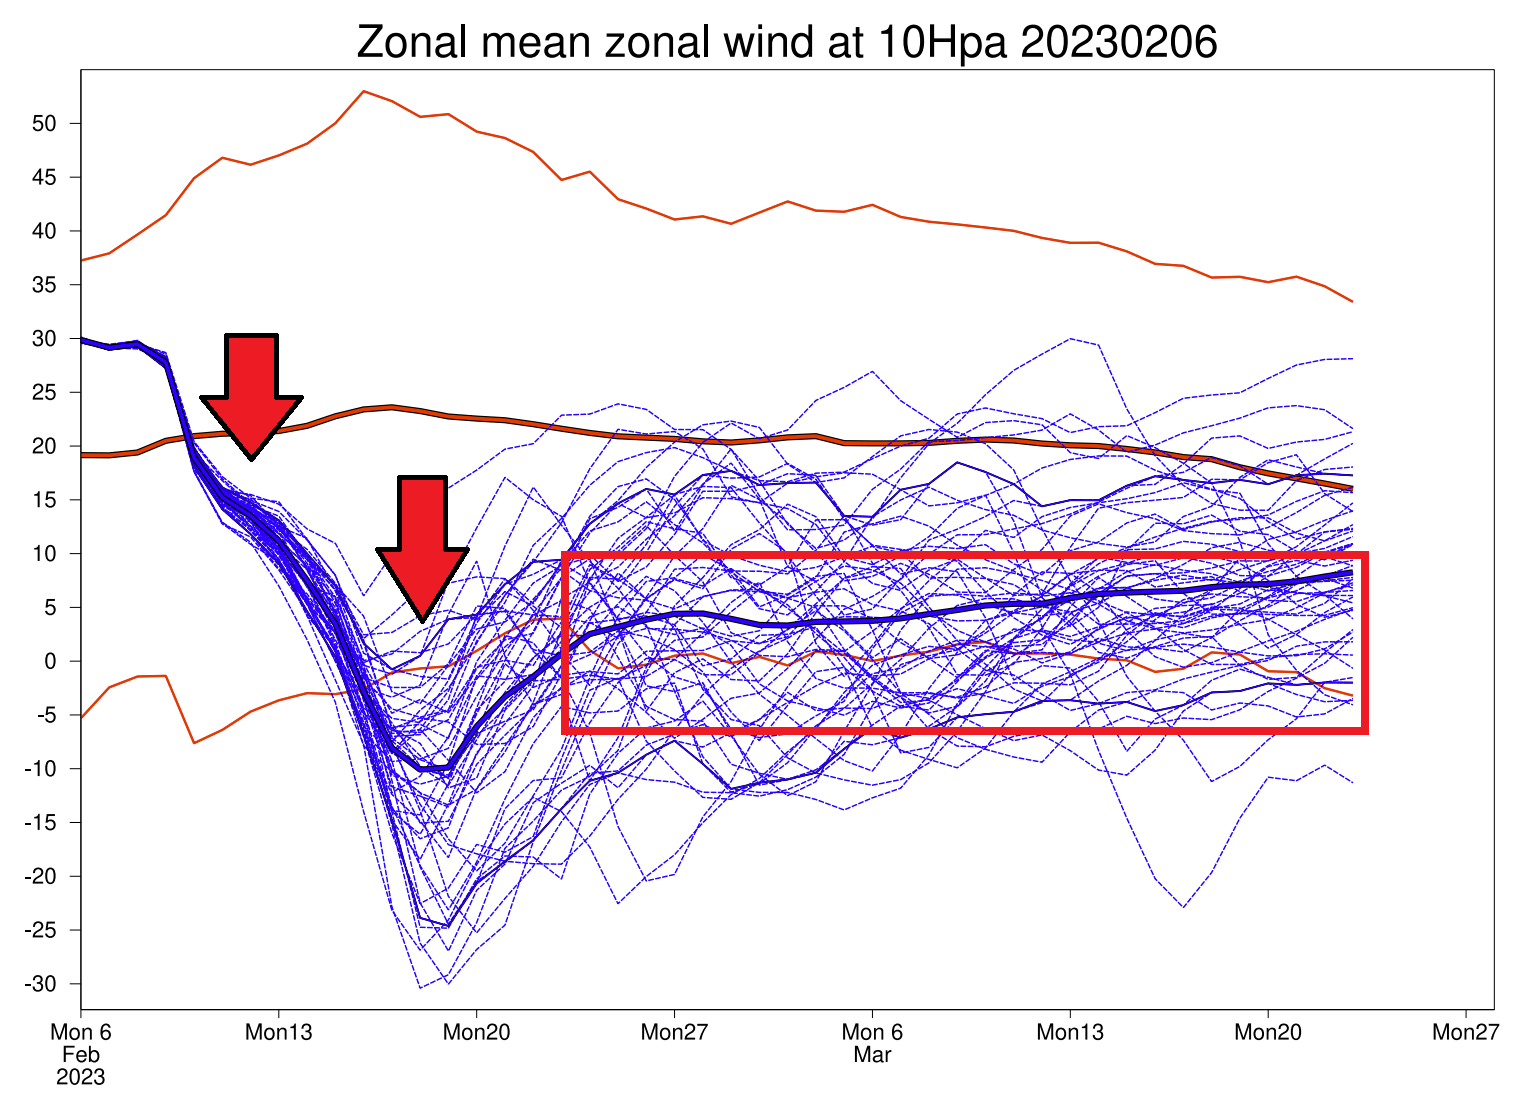
The main condition for an official SSW is reversing the stratospheric circulation from westerly to easterly. You can see that in the latest ECMWF forecast below. It shows the zonal wind reversing into negative territory around mid-month and remaining in that area.
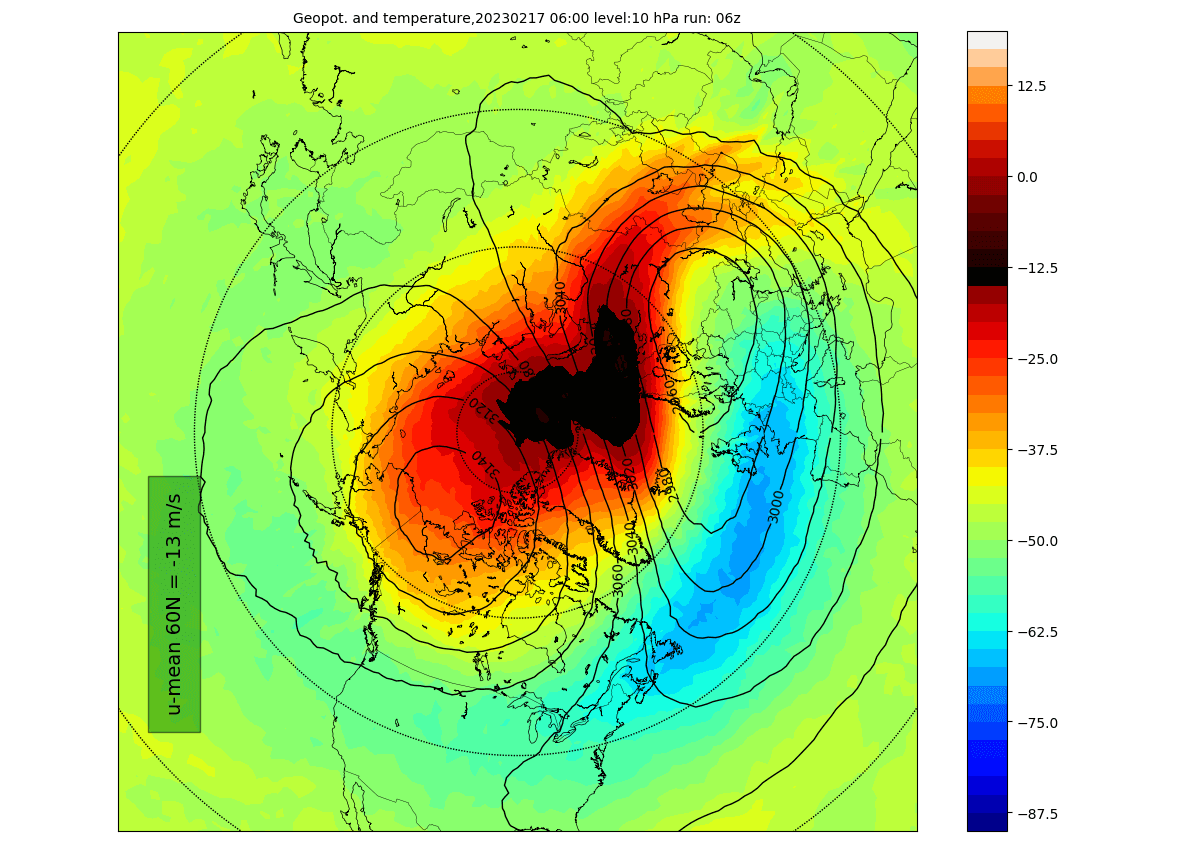
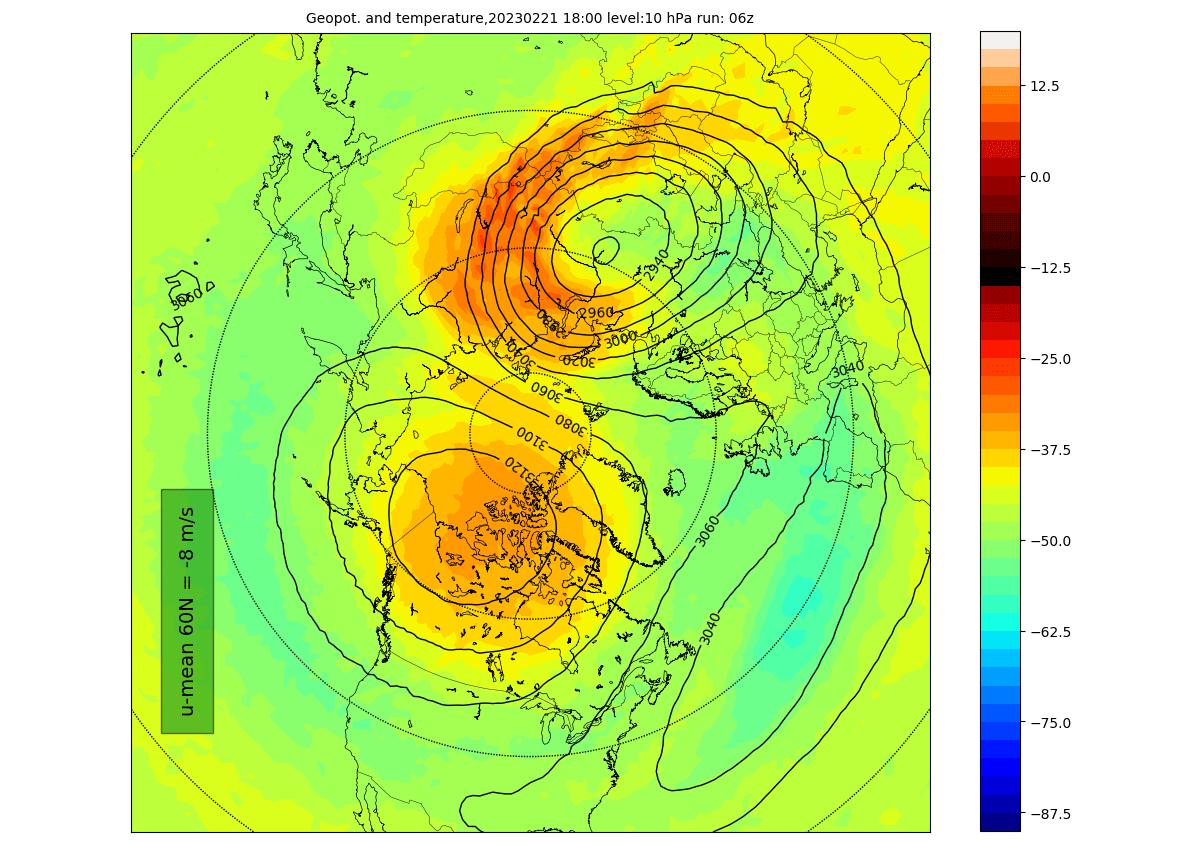
The main hit to the Polar Vortex comes around the 17th of February. You can see the large warming wave in the forecast below for the mid-stratosphere. It takes over the polar regions. It combines with a strong emerging polar “anti-vortex” over the North Pacific and western Arctic to push and displace the Polar Vortex out.
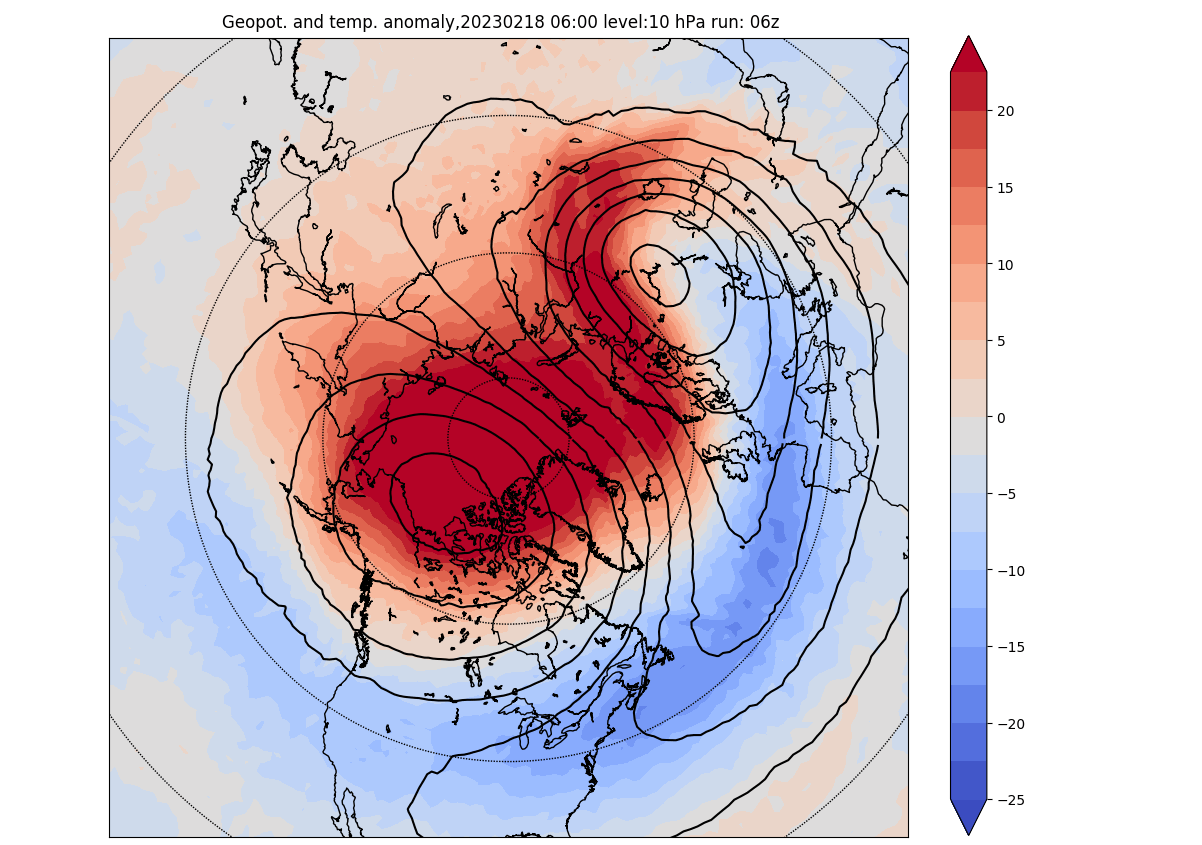
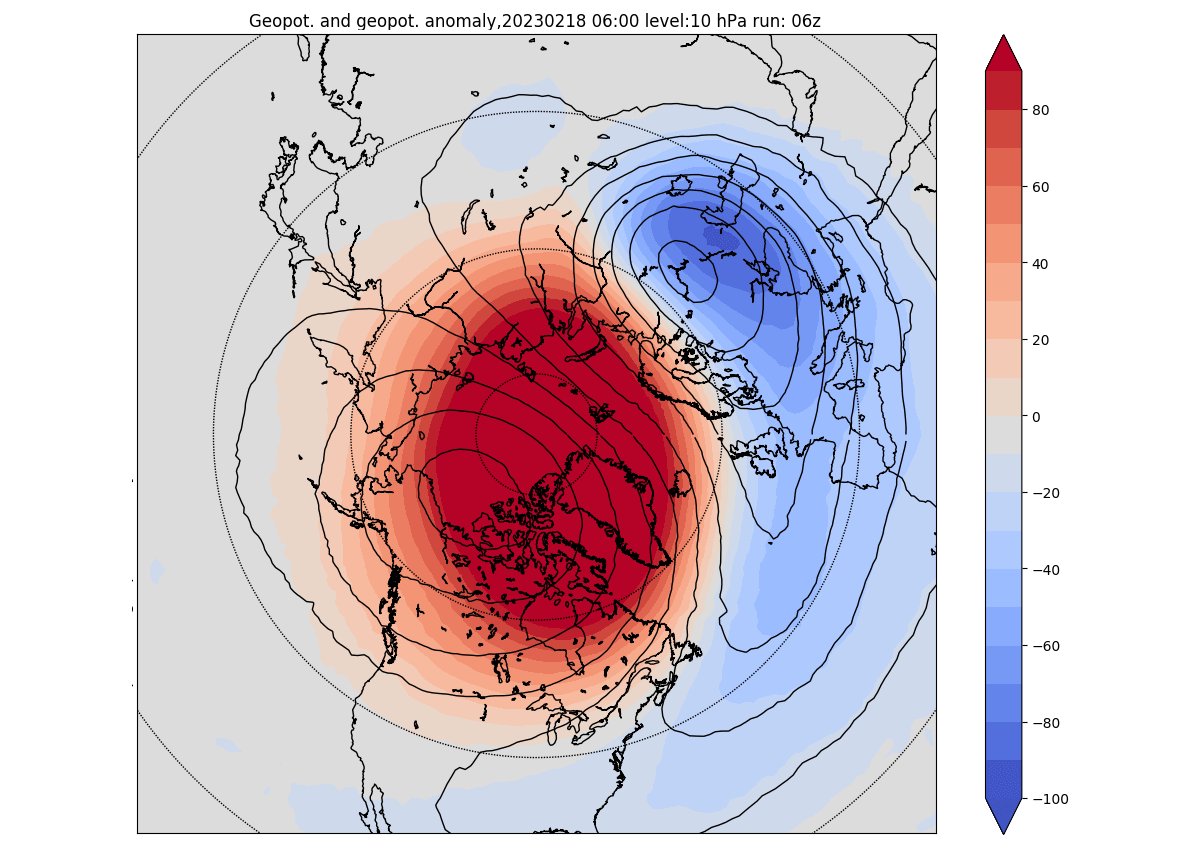
Below we have the temperature anomalies for the same mid-stratospheric levels. It better highlights the actual sudden stratospheric warming event. You can see it completely warms the polar Stratosphere above the normal levels.
Looking at the pressure anomalies below highlights the strong high-pressure system, or the “anti-vortex,” called unofficially. Such strong pressure anomalies can displace the main Polar Vortex and reverse the circulation.
Going further down into the lower Stratosphere (19km/12miles), you can see on the forecast image below that the warming wave is still visible. As we said before, the lower the warming reaches, the more robust it is. So reaching down to these levels shows that this is a strong event. And even at these lower altitudes, the Polar Vortex is still displaced.
You can see that even better if we look at the vertical 3D structure. What is shown is a complete collapse of the upper and middle Polar Vortex. The main shape looks more like a crescent moon rather than a cyclone. Some composure remains in the very lower levels, as the immediate effects are always first confined to the upper and mid-levels of the Stratosphere.
So what can be expected if these effects progress further down?
THE AFTERMATH
The evolution in the Stratosphere is quite straightforward. The warming wave slowly mixes with the colder stratospheric air. As a result, it raises the overall temperature in the Stratosphere, and the high pressure remains more or less in effect, with the Polar Vortex swirling around.
Lower down in the Stratosphere, the warming progresses with some delay but with the same picture overall. The Polar Vortex is displaced, likely towards Siberia.
The vertical pressure anomaly structure is getting more important at this point. It can show connections points and changes in the pressure patterns.
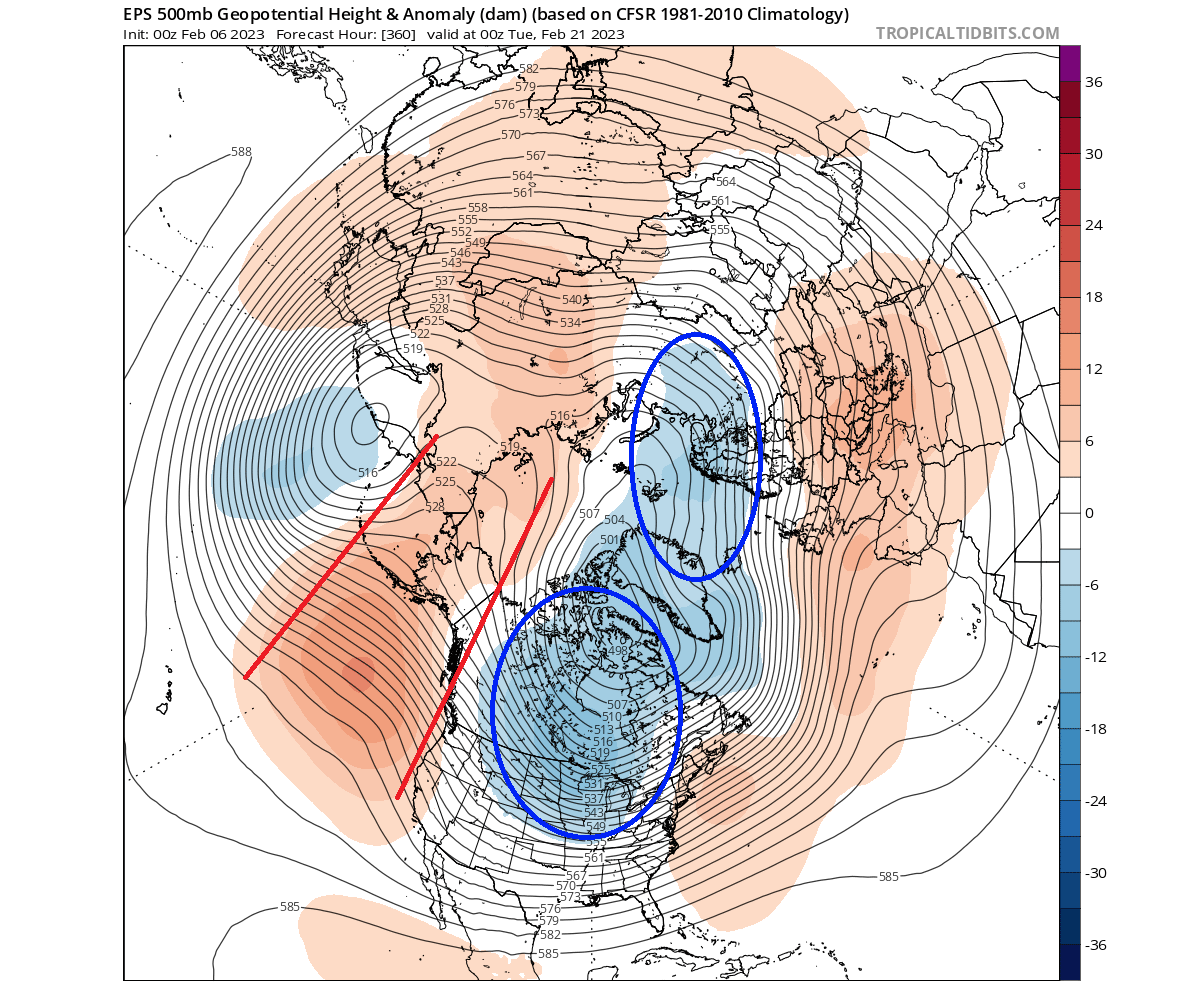
The forecast below shows that the Polar Vortex weakened and pushed eastward. A connection remains with a low-pressure zone over Canada and the northern United States. But the strong developing high-pressure anomaly in the Stratosphere is also nicely seen linked downwards into North Pacific and Alaska.
You can see this if we look at the pressure pattern in the lower levels. Notice the broad low-pressure area over Canada, the northern United States, and Greenland. This is the likely main connection to the stratospheric Polar Vortex, as far as pure anomalies go. And notice the high-pressure anomalies, as mentioned above.
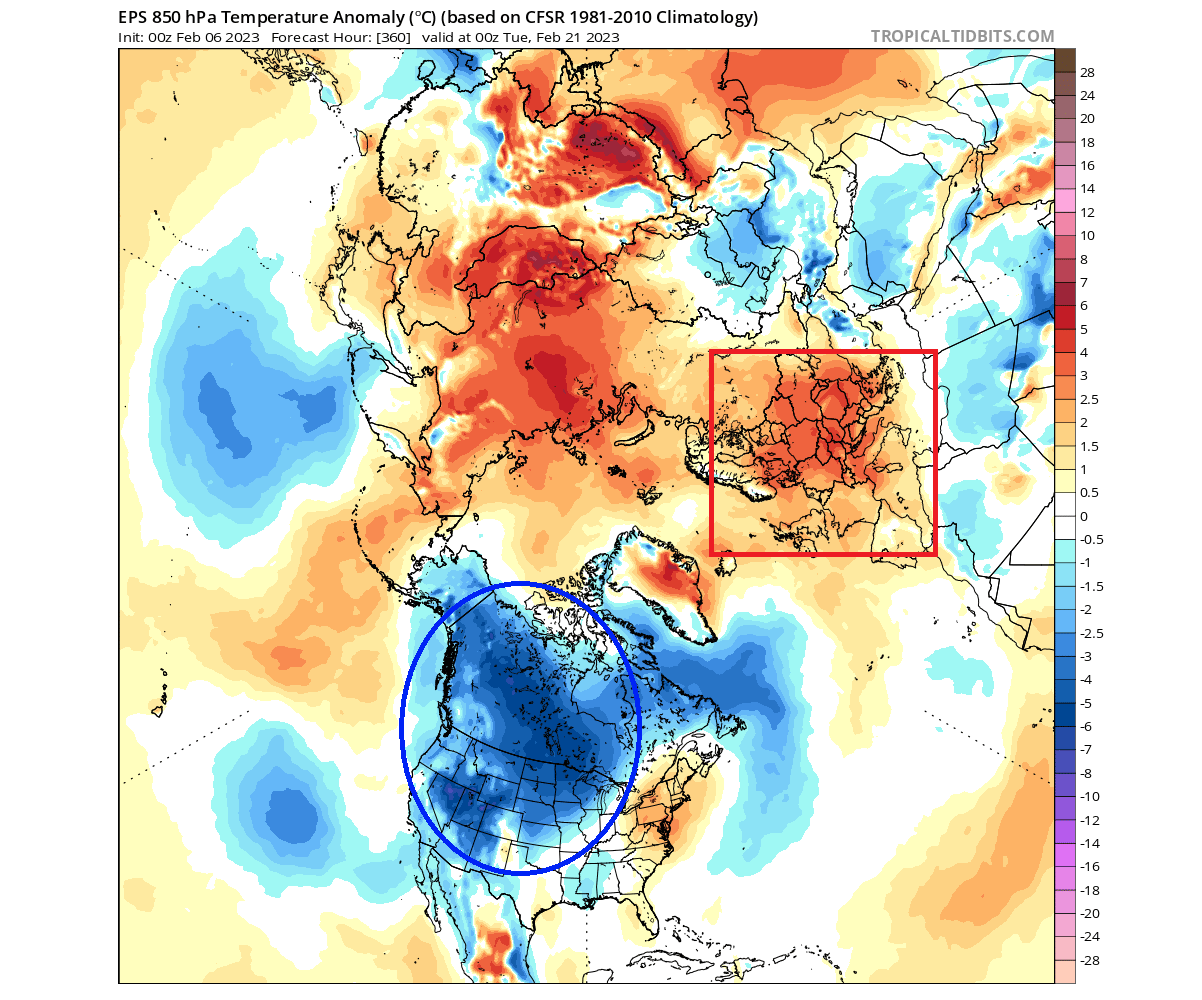
Looking at the temperature forecast for the same period, you can see the cold air returning to much of Canada and parts of the United States. This is because the low-pressure area sits over the northeastern United States and eastern Canada, which enables a northerly flow down into the United States. Europe remains warm at this point.
But, these are not proper weather effects of the Sudden Stratospheric Warming event. These are just linkages between the upper and the lower levels of the atmosphere that are created and manipulated during these events.
Proper weather effects can come several days after an SSW. They have to filter down from the high levels of the Stratosphere down to the lower levels where our weather is.
POLAR VORTEX COLLAPSE EFFECTS
The best way to follow SSW effects development is to look at atmospheric changes over time. Below are three graphics showing temperature, pressure, and wind anomalies in the Stratosphere, changing with time.
The first image below shows atmospheric pressure anomalies. Negative values indicate lower pressure (red anomalies), and positive values indicate higher pressure (blue colors). We have altitude from the ground up to the top of the Stratosphere (~46km/28mi).
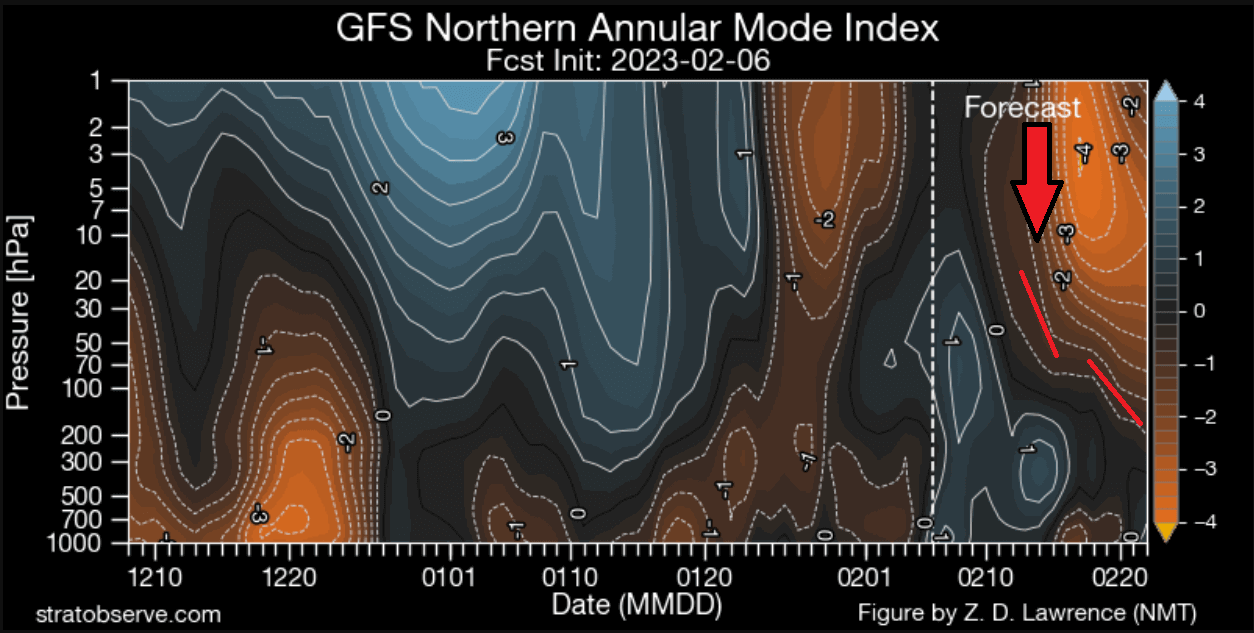
You can see the Sudden Stratospheric Warming event and its progress with time. The anomalies start to shift downwards slowly into the late month. This is the normal expected progress of an SSW that slowly filters down to the lower levels.
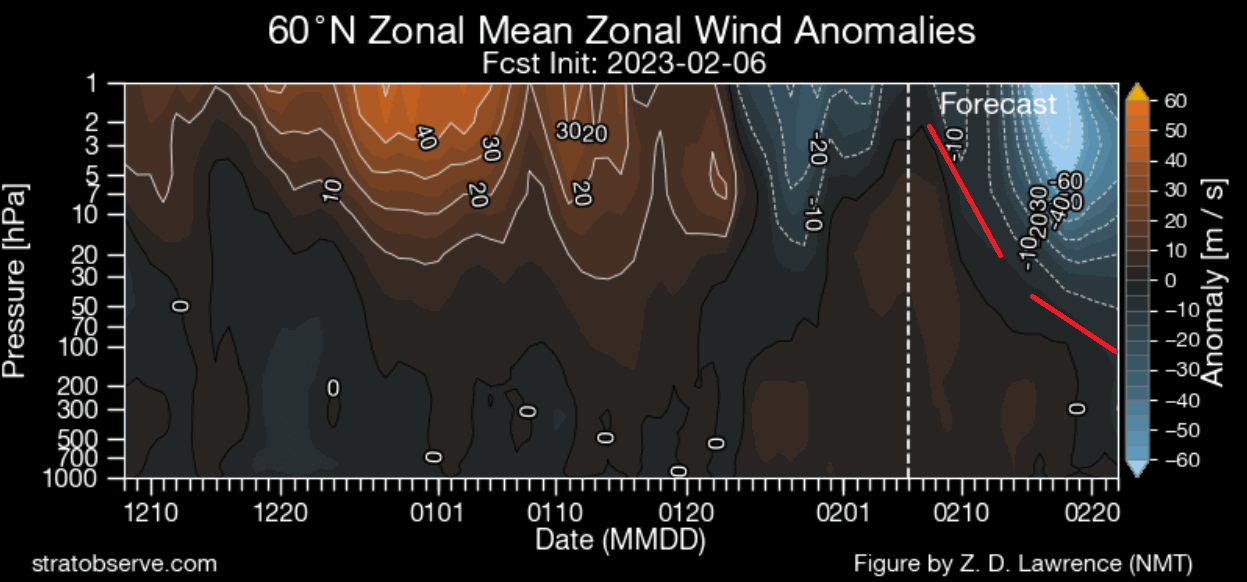
Looking at the winds, you can see the wind reversal (blue/negative). It also shows a downward progression with time, indicating a proper/expected advance of the collapse effects.
Last but not least, we have the temperature progression. Here you can see the stratospheric warming anomalies in the forecast area. It also shows a progression downwards. But this map does not show the whole profile to the ground.
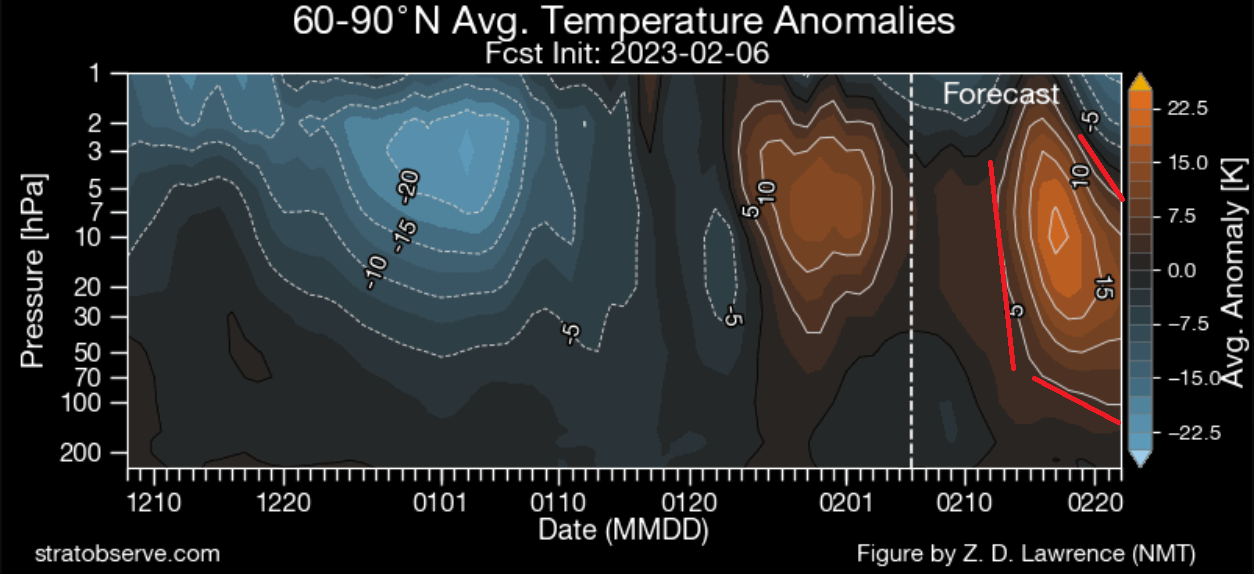
What we can take from this is that the SSW will try to make a run for the lower levels. All main profiles show that: pressure, temperature, and winds. So the way down to the lower Stratosphere is simple. But it is harder to breach through and link with the lower levels of the atmosphere where the actual weather is.
That is not yet in the range of normal weather forecasts. So, we have to use the extended range ensemble forecasts. We mainly use the ECMWF and GEFS extended ensemble solutions. We have to note that both solutions show an SSW development, so that is a good start.
POST SSW WEATHER TRENDS
To know what to look for, we have a special graphic below. It shows the average pressure anomalies 0-30 days after many different Sudden Stratospheric Warming events. So it is an average picture of the first 30 days after many historic SSW events.
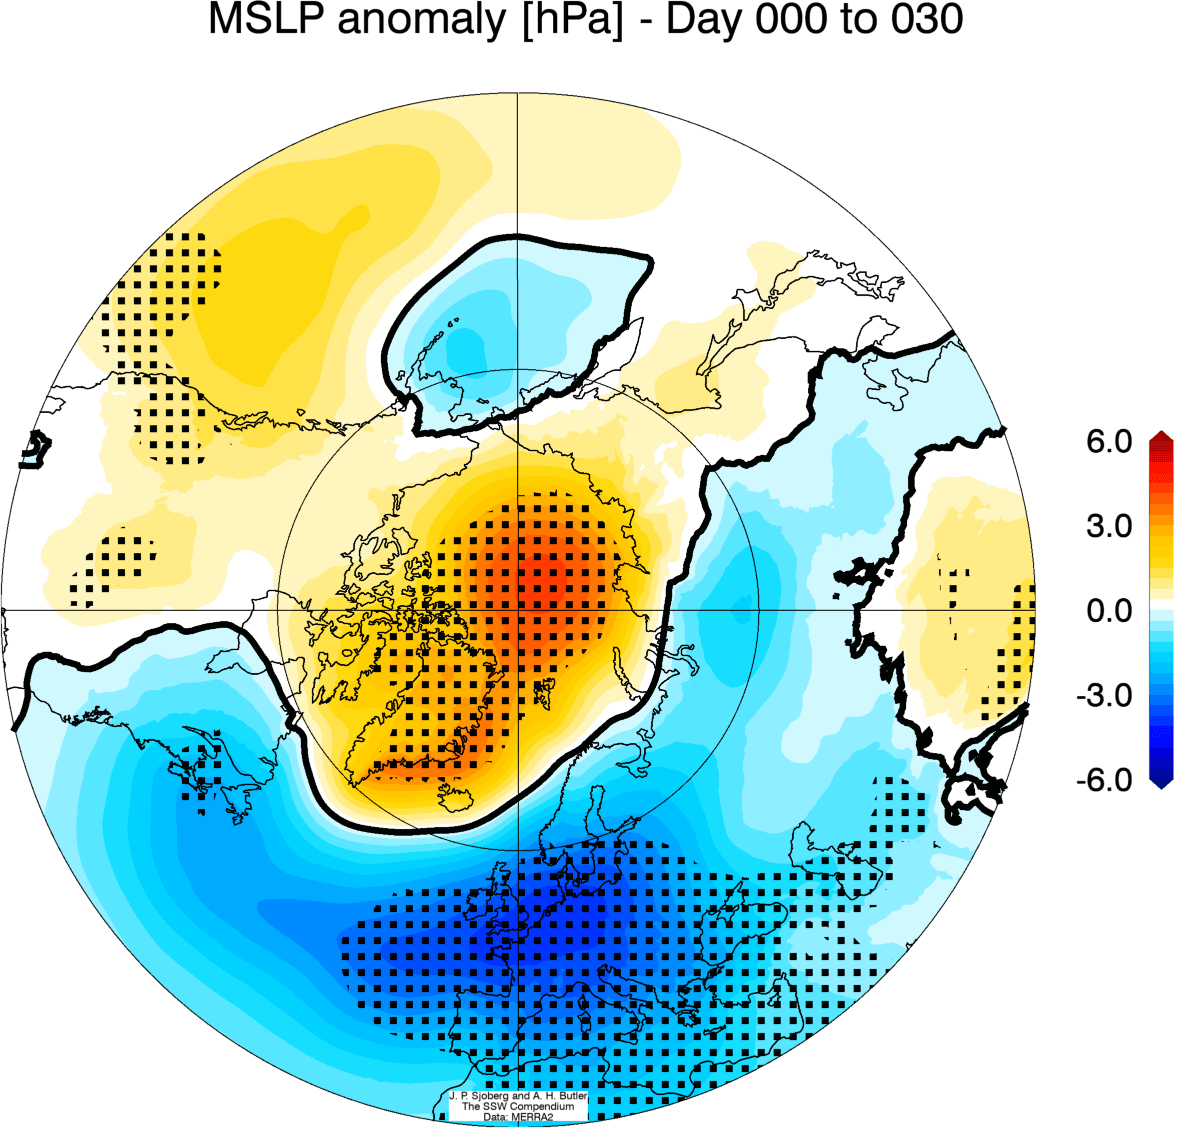
You can see the high-pressure anomaly developing over Greenland and the Arctic. In response, the pressure lowers over Europe and the eastern United States. But note this is an average picture, and not every SSW event is the same. Some never reach the lower levels with their effects.
So looking at the actual forecasts, we first start with the extended GEFS. It shows the pressure anomaly trends for early March. And it shows exactly the expected pressure pattern. So you can see high pressure over the polar regions and low pressure in the lower latitudes.
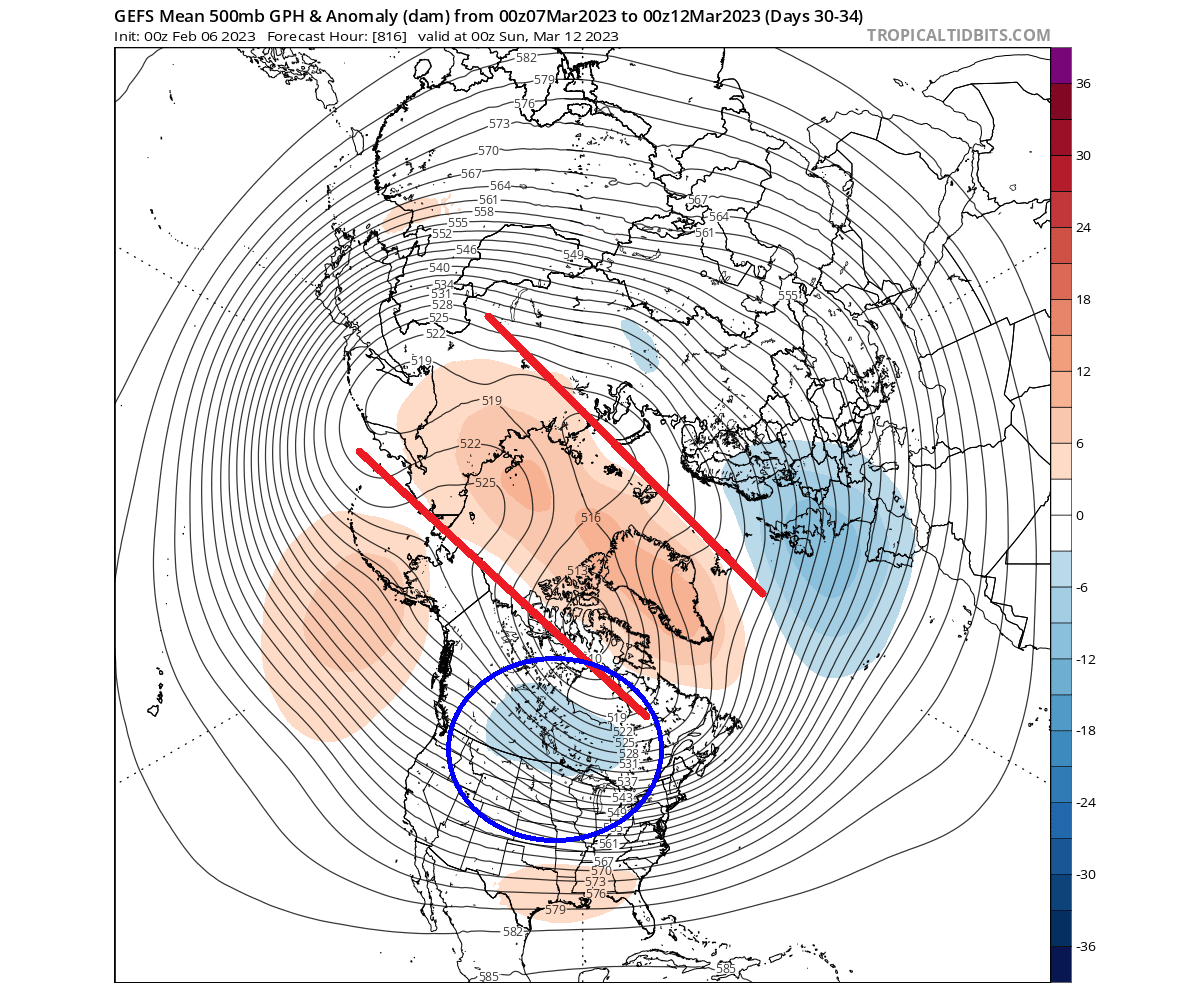
We are stretching the forecasting range here for any normal use. But these are ensemble forecasts, and we are looking at trends (higher/lower – warmer/colder) rather than specific forecasts.
The resulting temperature pattern is no surprise. You can see a cold anomaly over the northern United States, extending into the east and northeast. But note that this is an ensemble mean and a trend, so anomalies are generally weaker (more washed) at this range.
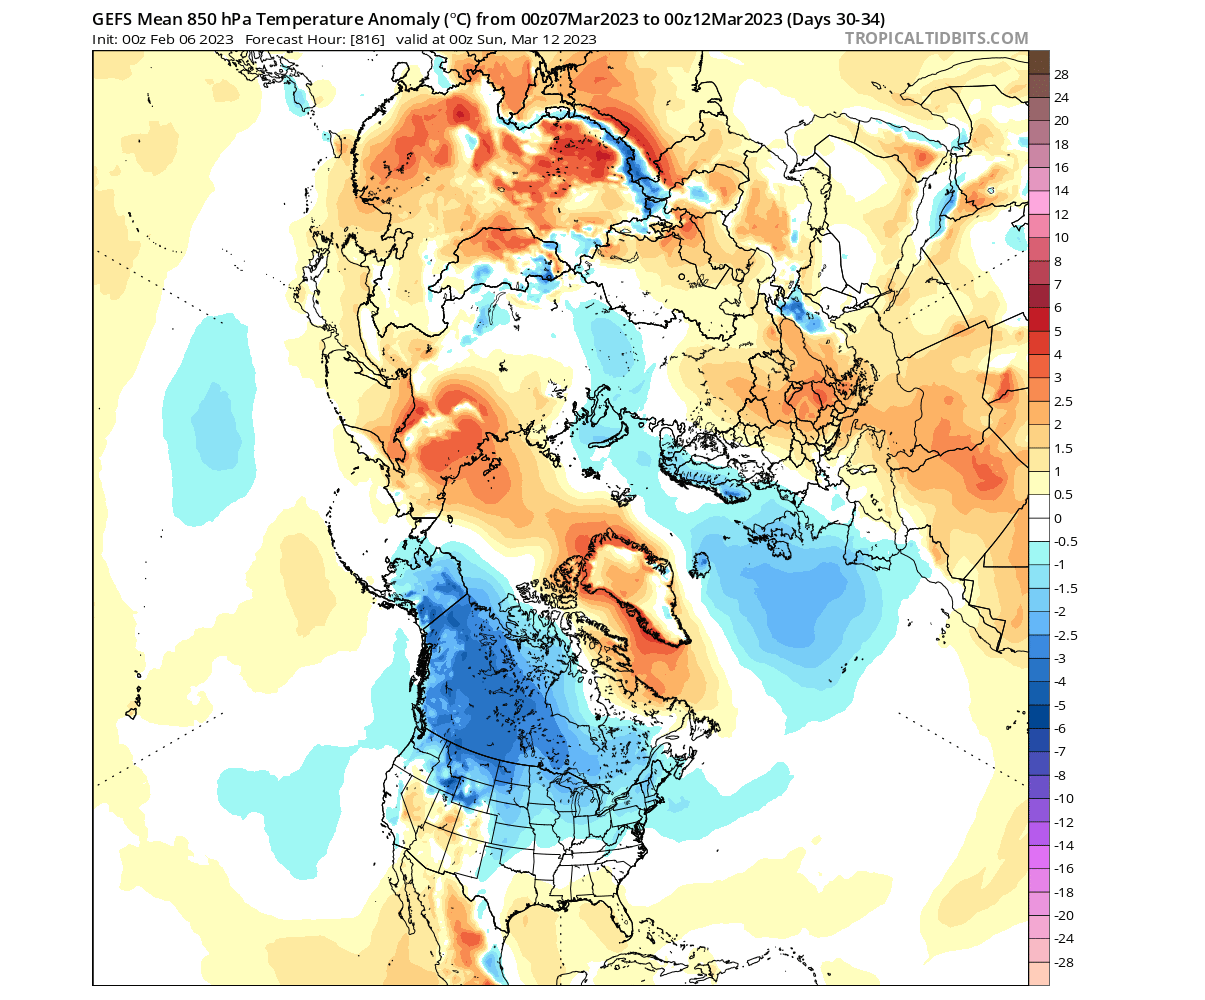
Europe shows a weaker cold signal, as the low-pressure anomaly is forecast further to the west. That means that we get mostly southerly and westerly (warmer) flow over the central parts of the continent. Colder anomalies are shown for the British Isles and northern Europe.
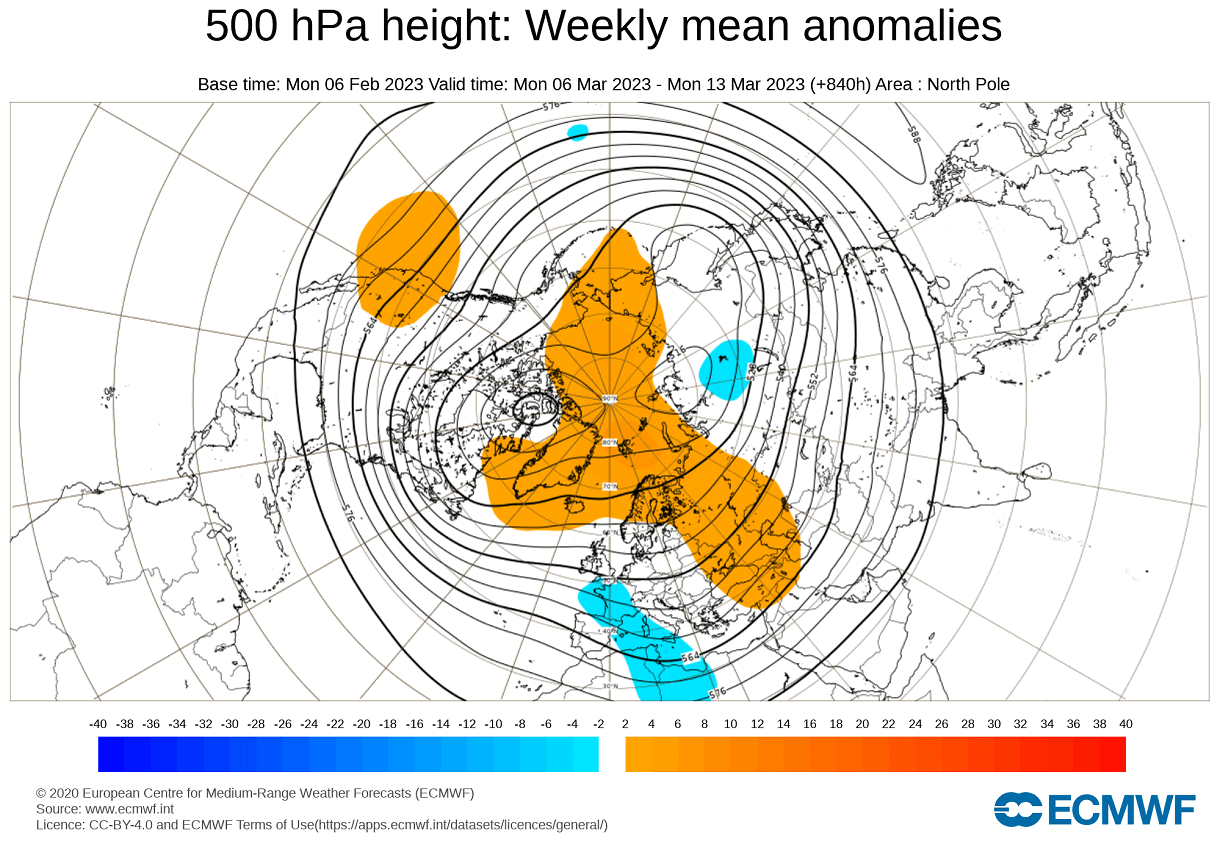
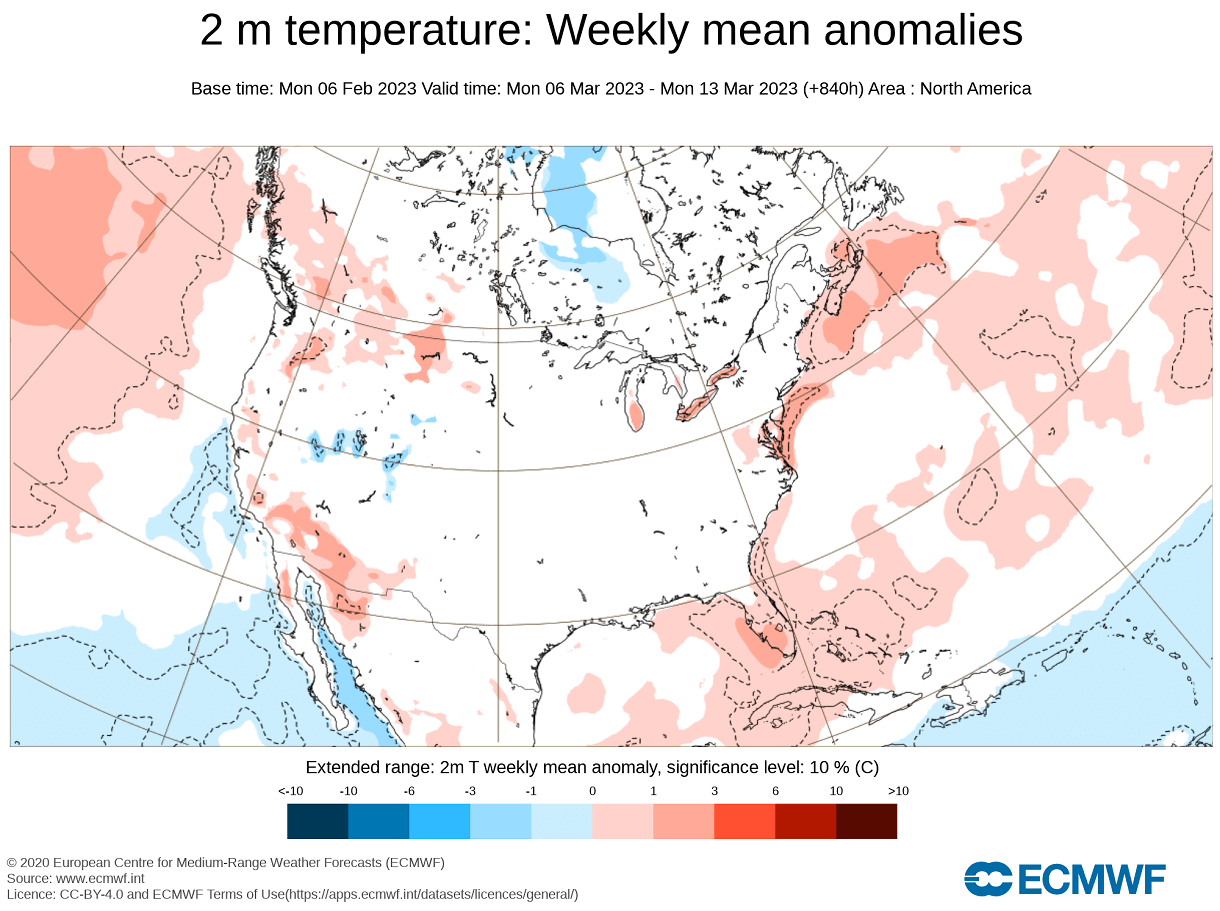
Looking at the ECMWF now, we see the same pressure anomaly pattern as expected, with high pressure over the polar regions in the first half of March. Again, this would prompt a low-pressure response over the eastern United States and Europe.
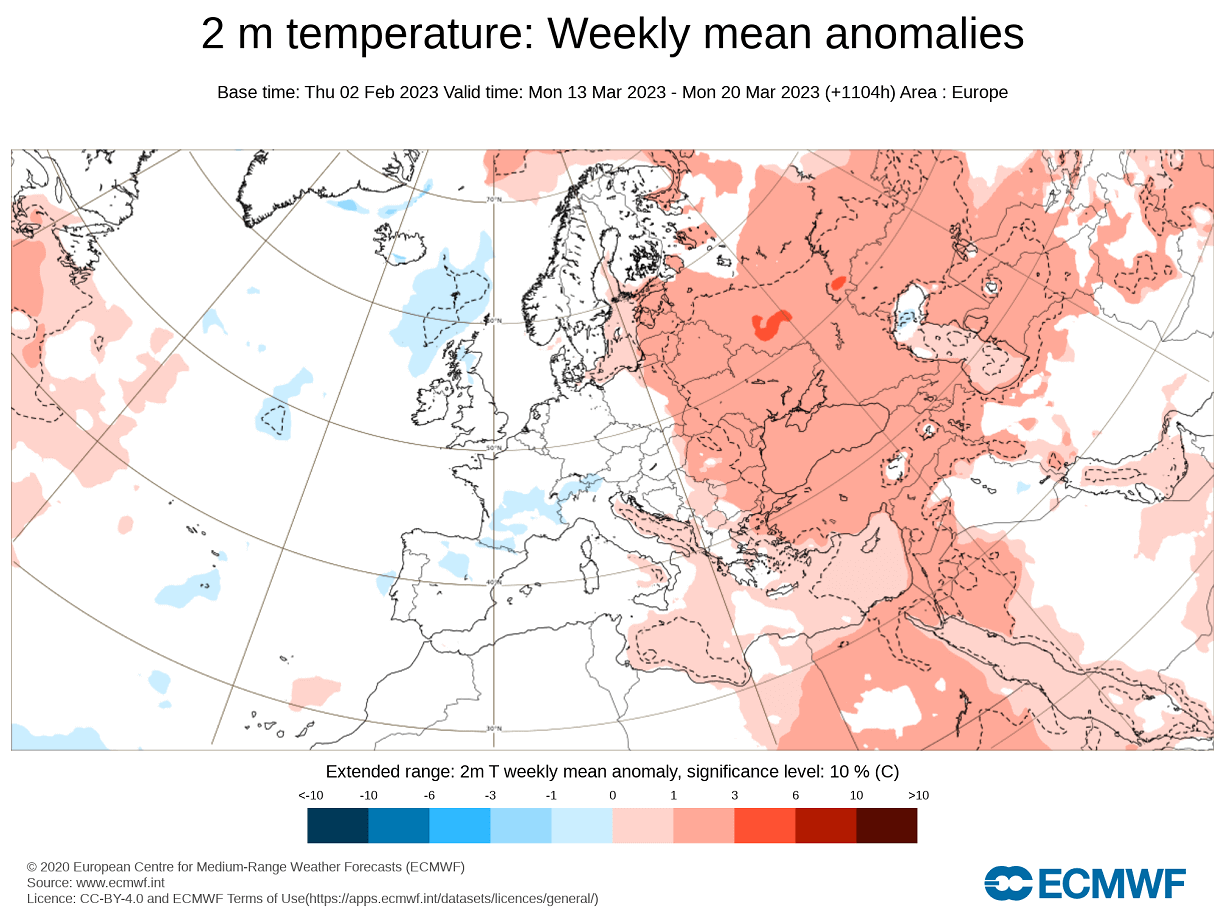
Looking at the temperatures for Europe first, we can see hints of colder anomalies over northwestern and western Europe. This is because, unlike the previous model (GEFS), the ECMWF moves the low pressure further inland, expanding the colder northerly flow further into western and central Europe.
Over North America, we do not see much in terms of cold. But seeing less can also tell you a lot. For example, we do not see any warm anomalies over the eastern United States. Based on the pressure pattern, this area is expected to see colder-than-normal temperatures. But at this range, they get washed out in the average picture.
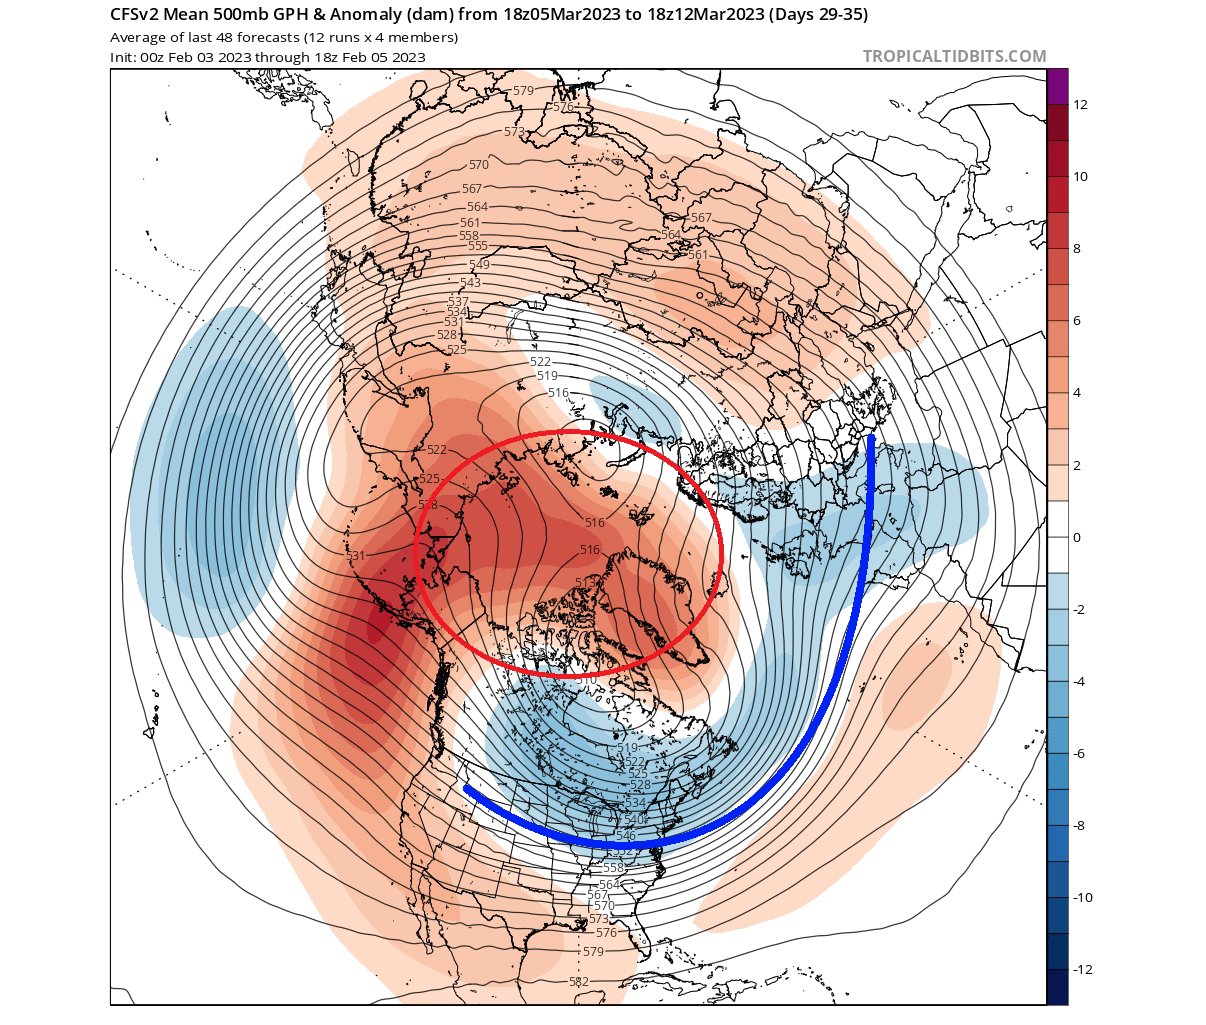
Another extended-range model is the CFS below. It is less reliable than its two counterparts above and is a stretch to use at any range. But it does add another solution to the same event, and it’s in the same ballpark.
The CFS shows a textbox post-SSW pressure anomaly, with a blocking high over the polar regions and lower pressure in the mid-latitudes. In mid-winter, such a pattern can bring heavy cold and snow into the eastern United States. But despite being a bit less intense in early March, this can still be a wintery pattern.
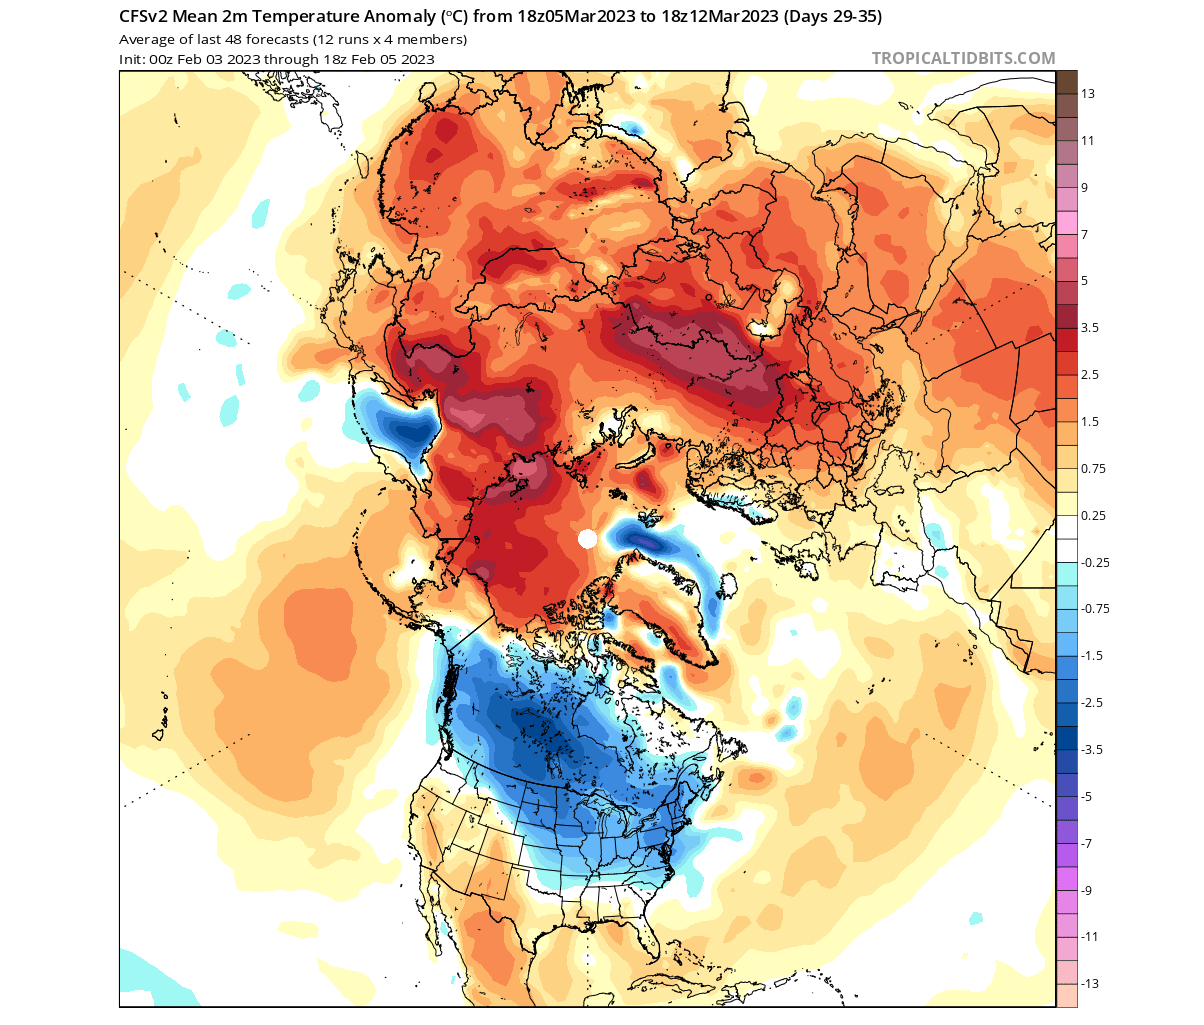
The temperature anomaly from the CFS ensembles shows this cold extension from Canada down over the Midwest and into the eastern United States. Despite being in early March, such a pattern can still bring cold weather and snow if the cold origin regions in Canada are cold enough.
So as you can see, having a strong or weak Polar Vortex can significantly change Winter weather in the United States, Canada, and Europe. For this reason, we closely monitor the weather patterns and all activity surrounding the Polar Vortex.
We will keep you updated on the global weather pattern development, so bookmark our page. Also, if you have seen this article in the Google App (Discover) feed, click the like button (♥) there to see more of our forecasts and our latest articles on weather and nature in general.
Don’t miss: