Weather pattern changes have begun over the Northern Hemisphere, with a blocking high-pressure system building over Greenland. This is a result of the Stratospheric warming event and the collapse of the Polar Vortex circulation. The main effects will be felt across North America and over northern Europe.
The Sudden Stratospheric Warming event (SSW) has left a strong mark on the Polar weather circulation and the atmosphere.
As a result, a significant high-pressure blocking system is building over Greenland and will impact the entire North American region and Europe in the coming weeks.
ATMOSPHERIC CIRCULATION AND WEATHER
The processes that have initiated the upcoming pattern change are underway in different parts of the atmosphere. This is because there are many layers to the atmosphere, and our weather unfolds in the lowest layer of the atmosphere, called the Troposphere.
But above that, we have the Stratosphere, also the home of the ozone layer. Both layers have their own circulation and are connected in many different ways. The main overall circulation is what we call the Polar Vortex.
For this reason, we tend to separate the entire Polar Vortex into an upper (stratospheric) and a lower (tropospheric) part. They both play their role differently, so we monitor them separately. But how they are connected is also very important—image by NOAA-Climate.

The Polar Vortex behaves like a very large cyclone, covering the whole north pole and expanding to the south into the mid-latitudes. It is present through all atmospheric levels, from the ground up, but has different shapes at different altitudes.
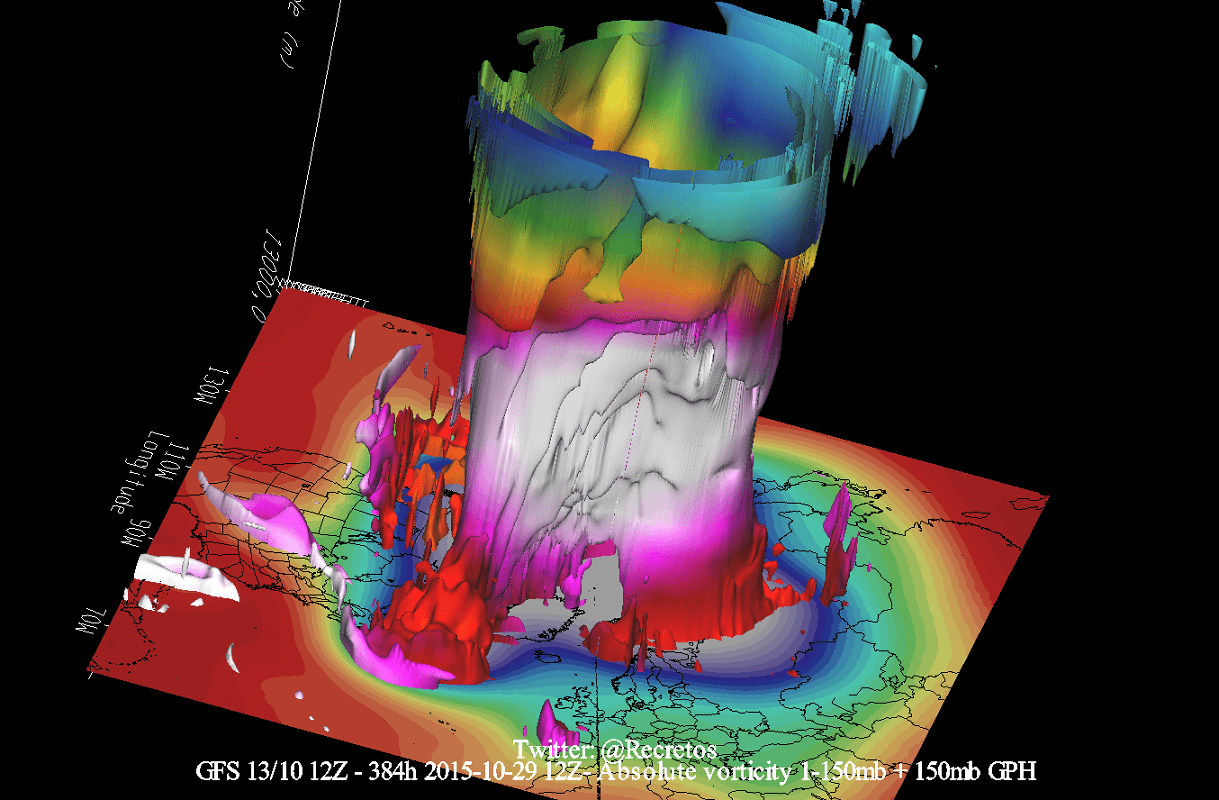
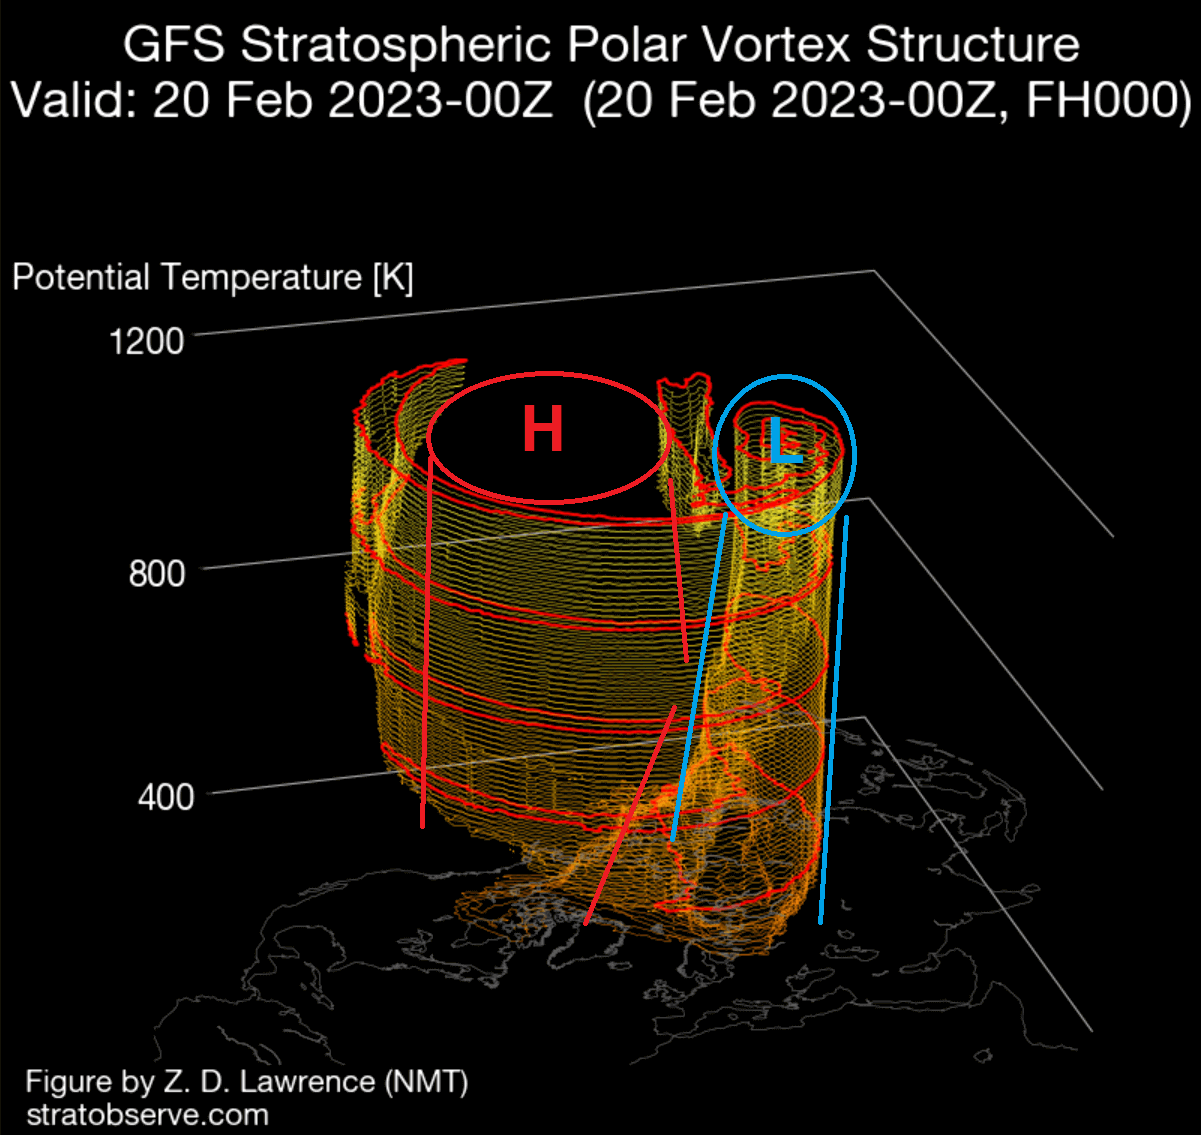
Below, you can see a 3-dimensional image of the Polar Vortex. The vertical axis is greatly enhanced for better visual presentation. In addition, you can see the actual structure of the Polar Vortex, connecting down to the lower levels to the pressure systems.
We monitor any Polar Vortex activity because it can affect weather across the entire Northern Hemisphere. And it can impact the weather differently, depending if it is weak or strong.
A strong Polar Vortex usually means strong polar circulation. This locks the colder air into the Arctic circle, creating milder conditions for most of the United States and Europe.
In contrast, a weak Polar Vortex creates a weak jet stream pattern. As a result, it has a harder time containing the cold air, which can now escape from the polar regions into the United States and Europe—Image by NOAA.
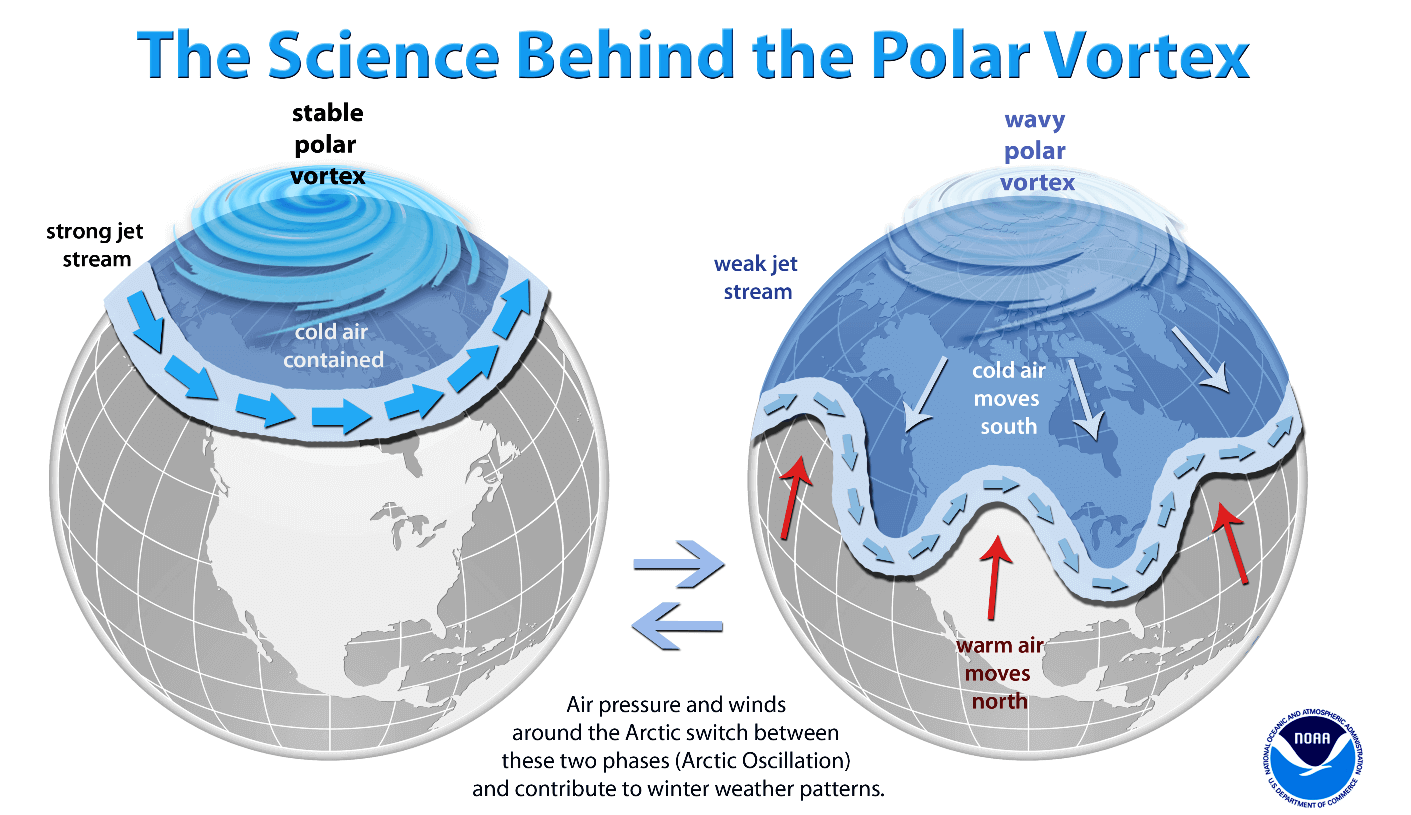
What is currently coming is a textbook example of a weak Polar Vortex event. That means a major disruption of weather patterns and the jet stream.
To put this event into perspective, we produced a high-resolution video below, showing the Polar Vortex spinning over the Northern Hemisphere in the Stratosphere at the 10mb level, around 30km/18miles altitude.
The video shows how the Polar Vortex started out over the North Pole in the Stratosphere. But a strong high-pressure area and a warming wave have weakened the Polar Vortex and pushed it out.
A strong influx of energy from below into the Stratosphere created this major disruption and warming, completely collapsing the upper stratospheric Polar Vortex.
SUDDEN STRATOSPHERIC WARMING EVENT
Looking at the first day of the SSW event below, you can see there was a large warming wave in the top and mid-stratosphere. It spread over the polar regions. Combined with a strong emerging polar “anti-vortex” covering the North Pacific and western Arctic, it has pushed and displaced the Polar Vortex out of the North Pole.
In the next image below, you can see the temperature anomaly for the same mid-stratospheric levels. It better highlights the actual sudden stratospheric warming event. Again, you can see that the temperatures were raised well above normal levels, as shown by the strong anomalies.

Going further down into the lower Stratosphere (19km/12miles), you can see in the analysis below that the warming wave quickly reached further down. As we said before, the lower the warming can reach, the more impactful it can be. So reaching down to these levels shows that this was a strong event.

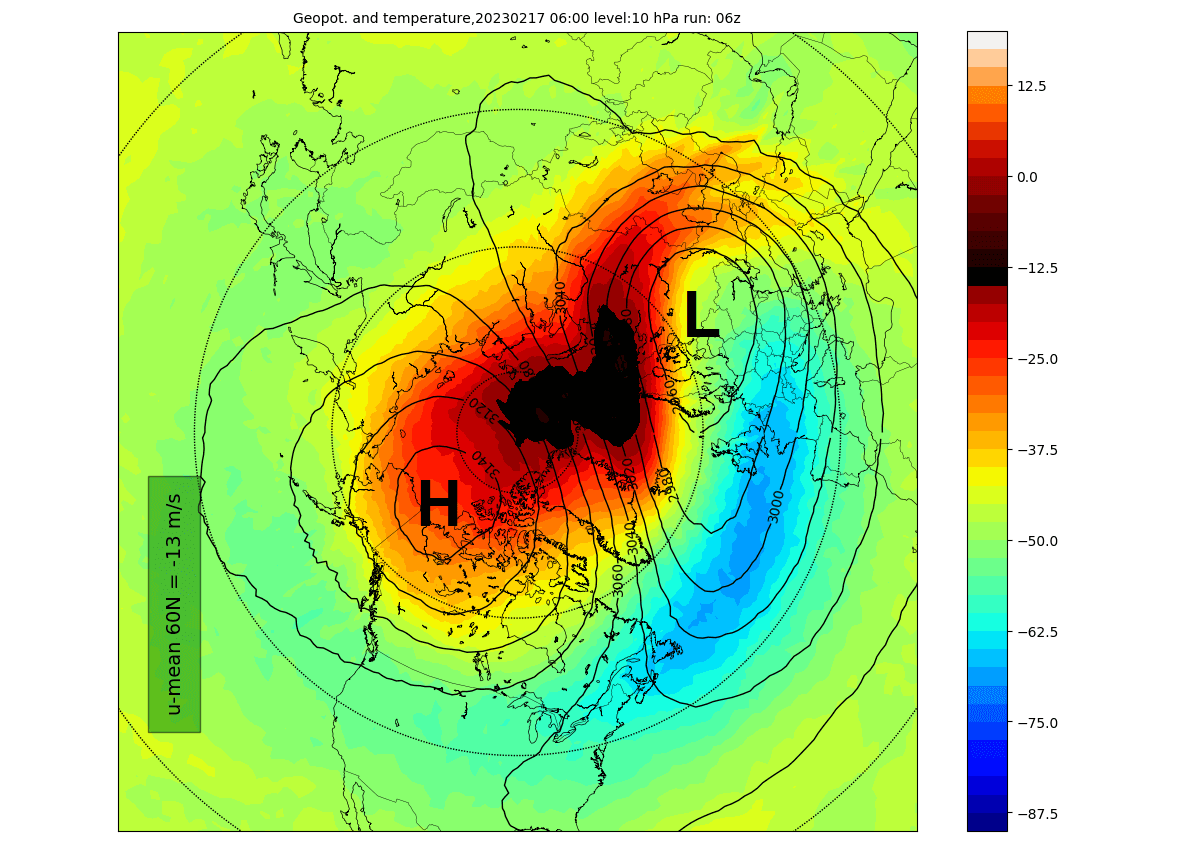
The vertical pressure anomaly structure almost shows an even better and more complete picture of this event.
You can see the compressed Polar Vortex over Siberia. This is because a strong stratospheric high-pressure area (H) has taken over the Polar Regions and severely disrupted the atmospheric circulation in the higher and middle latitudes.
The disruption is on a large scale and is extended over much of the Stratosphere. Even tho the disruption looks like it is spreading over much of the atmosphere, it takes time for actual effects to filter into the lower layers.
Proper weather effects can come several days after an SSW. But first, they must transition down from the high levels of the Stratosphere to the lower levels where our weather is.
STRATOSPHERIC WARMING EFFECTS
We now know that the effects from the Stratosphere have to progress downwards to have an impact. But how does it actually work? For example, how can an SSW change the weather?
You can see a typical SSW process from a study by Dr. Amy Butler and co-authors in the next image below. As an SSW occurs, it raises temperature and pressure in the Stratosphere. Those effects progress downwards over time.

So keeping it simple, the main impact of an SSW event is a high-pressure system at the surface over the Polar regions. A manifestation of a high-pressure system in the lower levels can mean a disruption of weather patterns and strong changes in the jet stream.
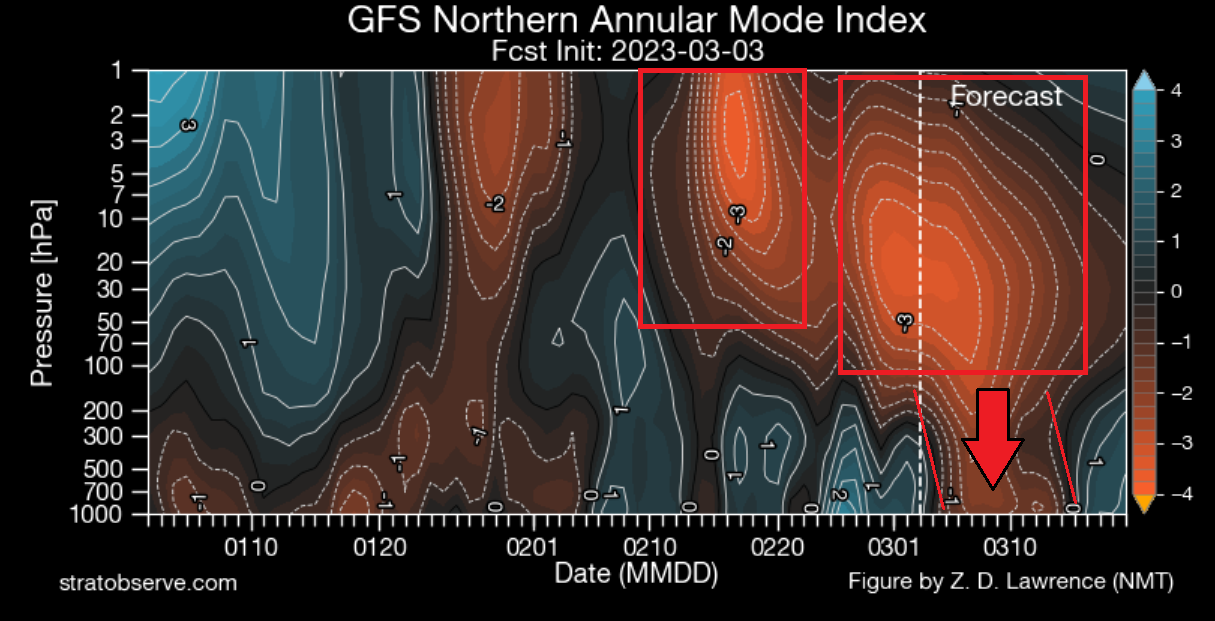
The best way to follow SSW effects development is to look at atmospheric changes over time. Below is a graphic showing the pressure anomalies across the atmosphere over time.
Negative values indicate lower pressure (red anomalies), and positive values indicate higher pressure (blue colors). We have altitude from the ground up to the top of the Stratosphere (~46km/28mi).
In early March, you can see high-pressure anomalies from the Stratosphere connecting down to the lower levels. Again, this is a direct connection with the Stratospheric warming events, and the pressure patterns will respond with a strong blocked pattern, as you will see.
But what is a typical pressure pattern after Stratospheric Warming events (SSWs)?
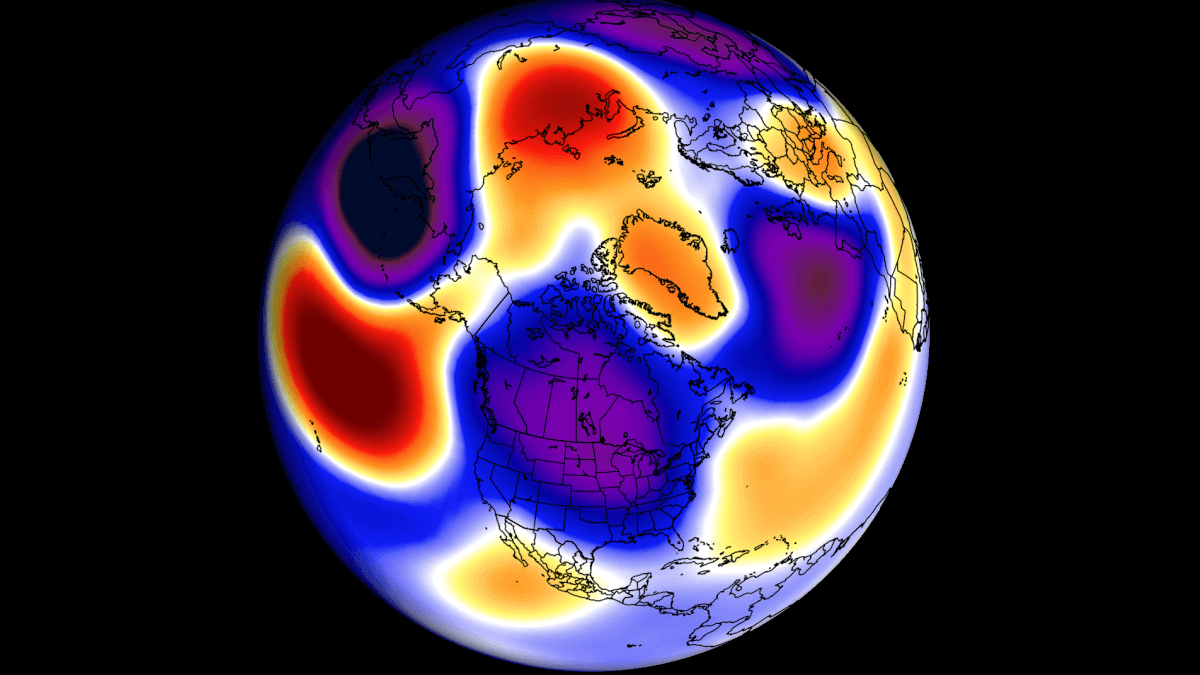
We have a special graphic from historical data. It shows the combined average pressure anomalies 0-30 days after many different Sudden Stratospheric Warming events. So it is an average picture of the first 30 days after many historic SSW events.

You can see the high-pressure anomaly developing over Greenland and the Arctic. In response, the pressure lowers over Europe and the eastern United States. This is a combined picture from different events, so it can vary from one event to another.
But, as you will now see, this Stratospheric Warming event will have a typical response. It will disrupt the weather patterns across the Northern Hemisphere by creating a strong high-pressure blocking system over Greenland.
WEATHER STARTS CHANGING
Combining all the information provided, we know that a high-pressure blocking system around the Greenland area is expected. The word blocking implies that the system is large and persistent.
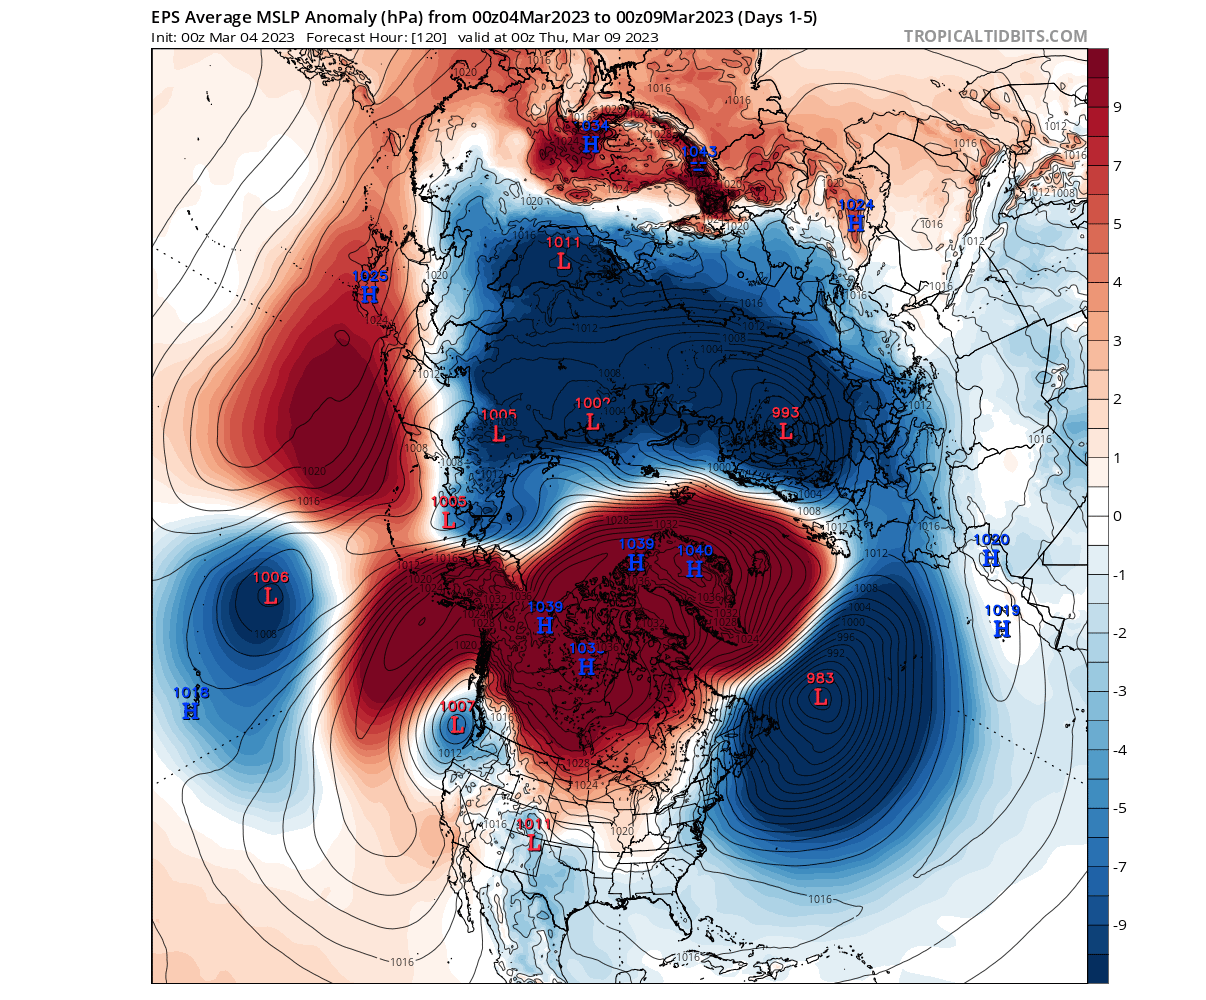
So looking at the average for the next five days, you can see the same pressure pattern as expected after an SSW event. So you can see high pressure in the Greenland area and the displaced low-pressure systems around it.

The image above is for the 5km/3miles altitude. But looking at the surface pressure anomalies, you can see almost an identical pressure pattern as the one above of the typical pressure pattern after a Stratospheric Warming event. High-pressure over Greenland and the low-pressure systems around it.
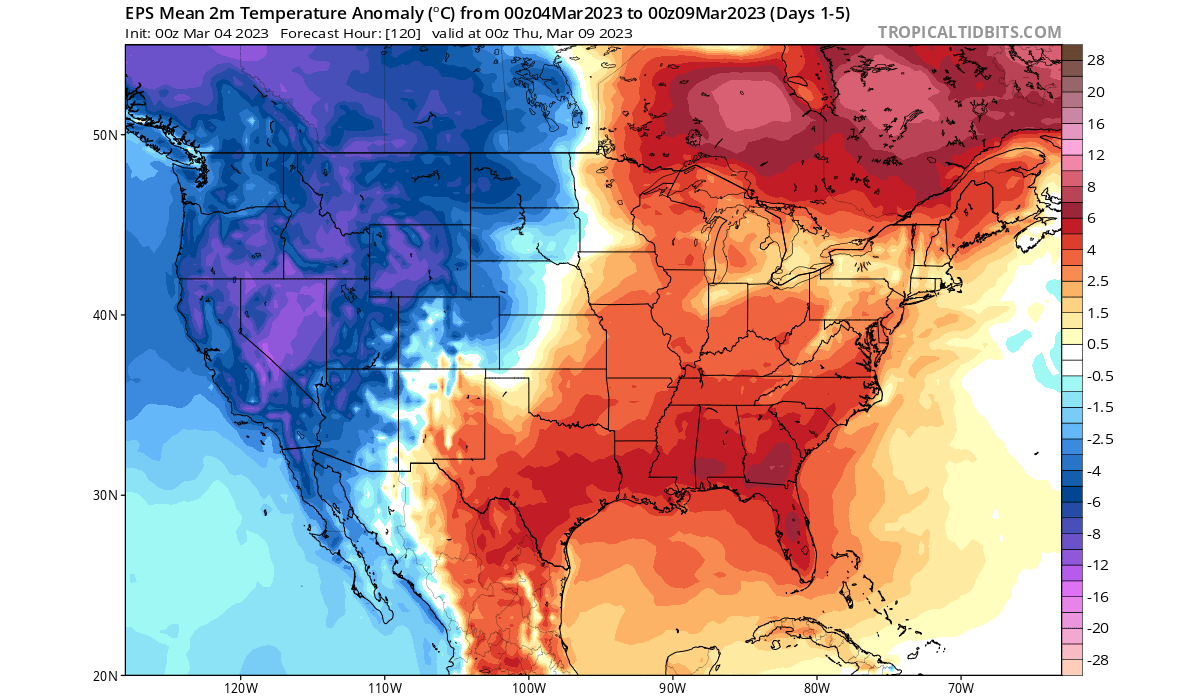
The resulting temperature pattern over North Hemisphere shows a strong warm anomaly building over Greenland. That starts to displace the cold air otherwise present around the Polar circle. You can see a cold anomaly over western Canada, the western half of the United States, and northern Europe.
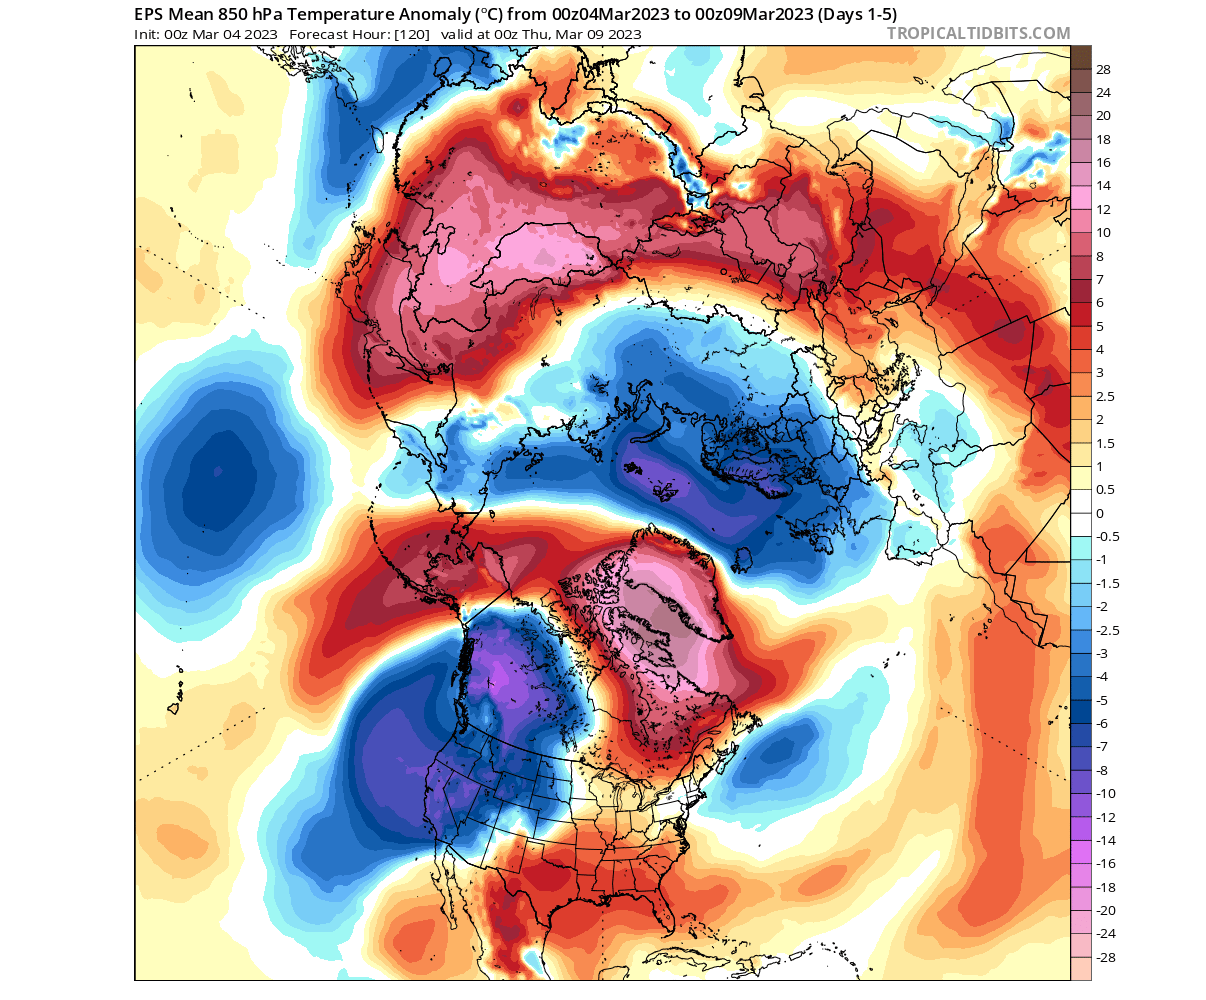
Focusing on North America, the weather pattern you can see in the forecast for the next five days has been around for a while. Cold temperatures over western Canada and the western half of the United States. Over the eastern half of the United States and southeastern Canada, we saw unseasonably warm temperatures.
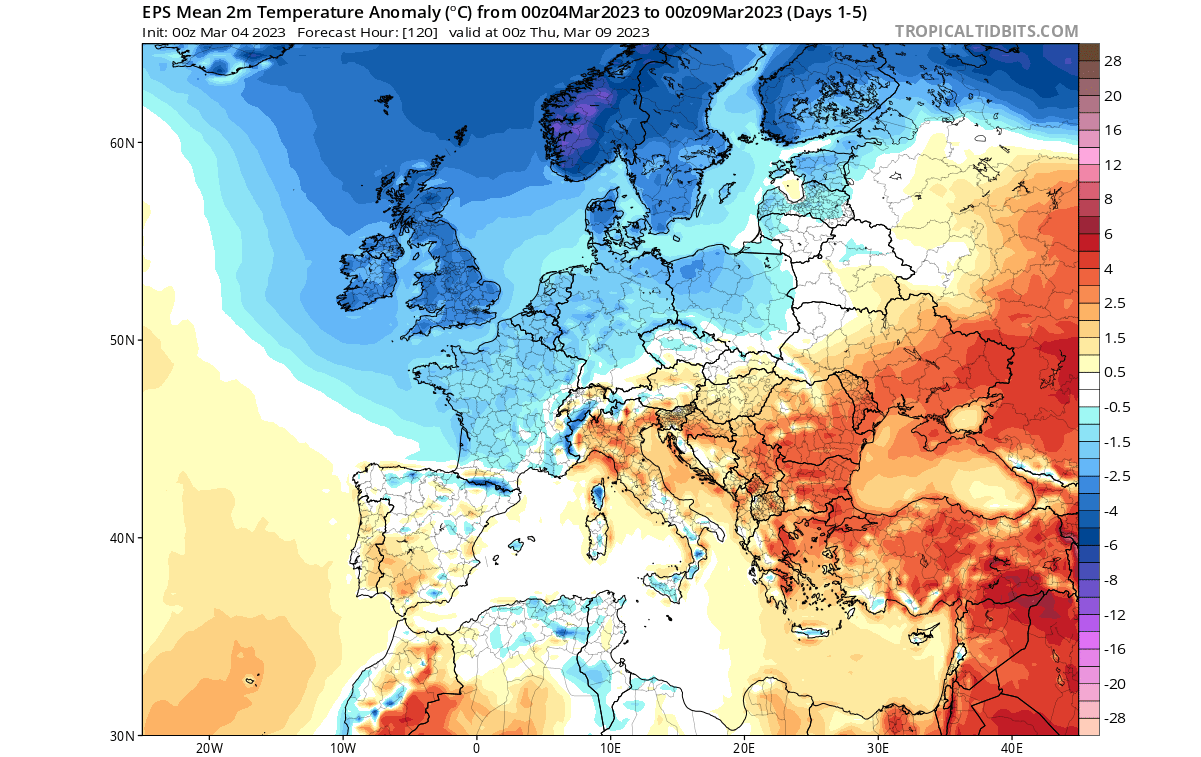
Europe shows a colder signal over the north, as the influence of the Greenland blocking pushes the low-pressure systems into the region. However, the southern half of the continent is forecast to remain mostly around average to warmer.
But as the Greenland blocking appears, it cannot immediately change the weather. Like dropping a stone into a river, it takes some time before the changes in the flow get downstream. But changes are coming.
PRESSURE RISES AND FALLS
We can see the new pressure pattern fully established later next week. The main factor is a strong blocking high over Greenland, with the displaced low-pressure systems from the United States over the North Atlantic into Northern Europe.
Looking at the temperature pattern, you can see the strong warm anomalies over Greenland and northern Canada. This is the warmer-than-normal air being pushed into the regions by the blocking system. But, as warm air moves in, the cold air has to move out, directly across the United States and Northern Europe.
Over Europe, the main cold anomaly is forecast to remain stable over the northern areas. Some cold air expansion is seen towards the central regions but is weaker as the main low-pressure systems are further to the northeast.

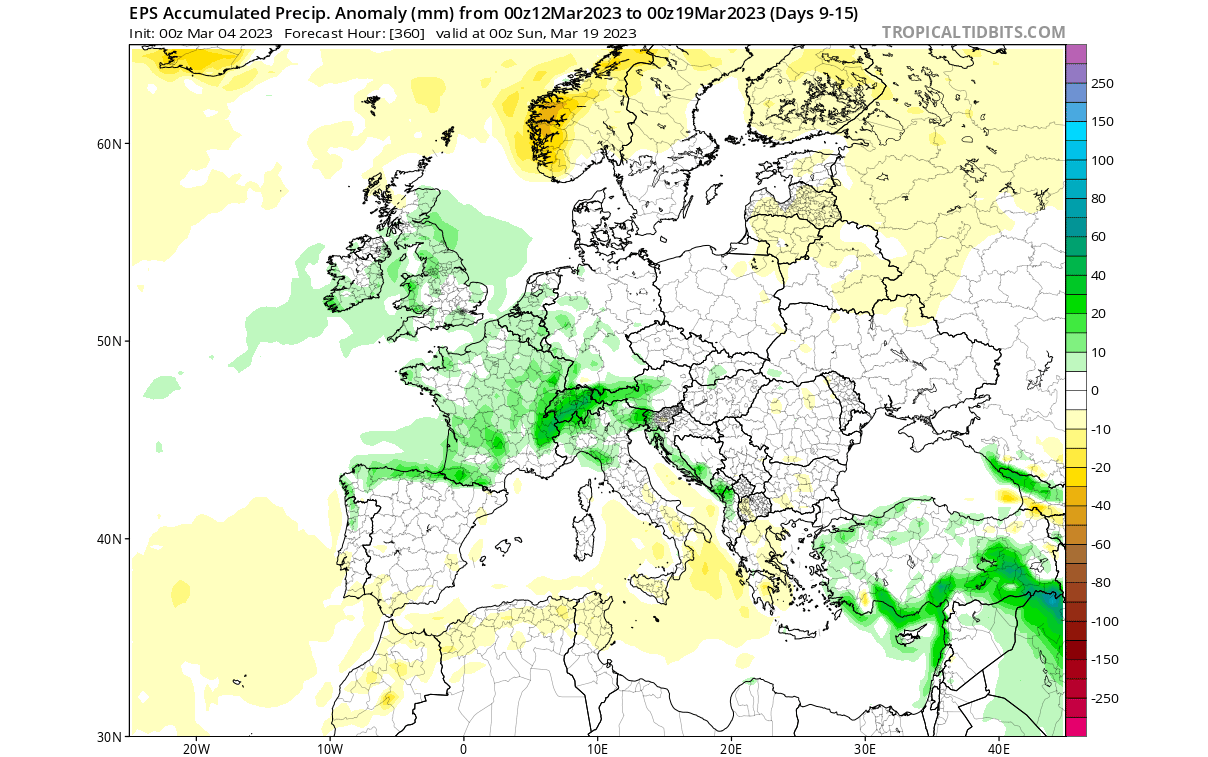
We expect a more westerly wind flow between the cold and warm anomalies. That usually brings moisture from the Atlantic, seen as increased precipitation over the western half of the continent in the image below.
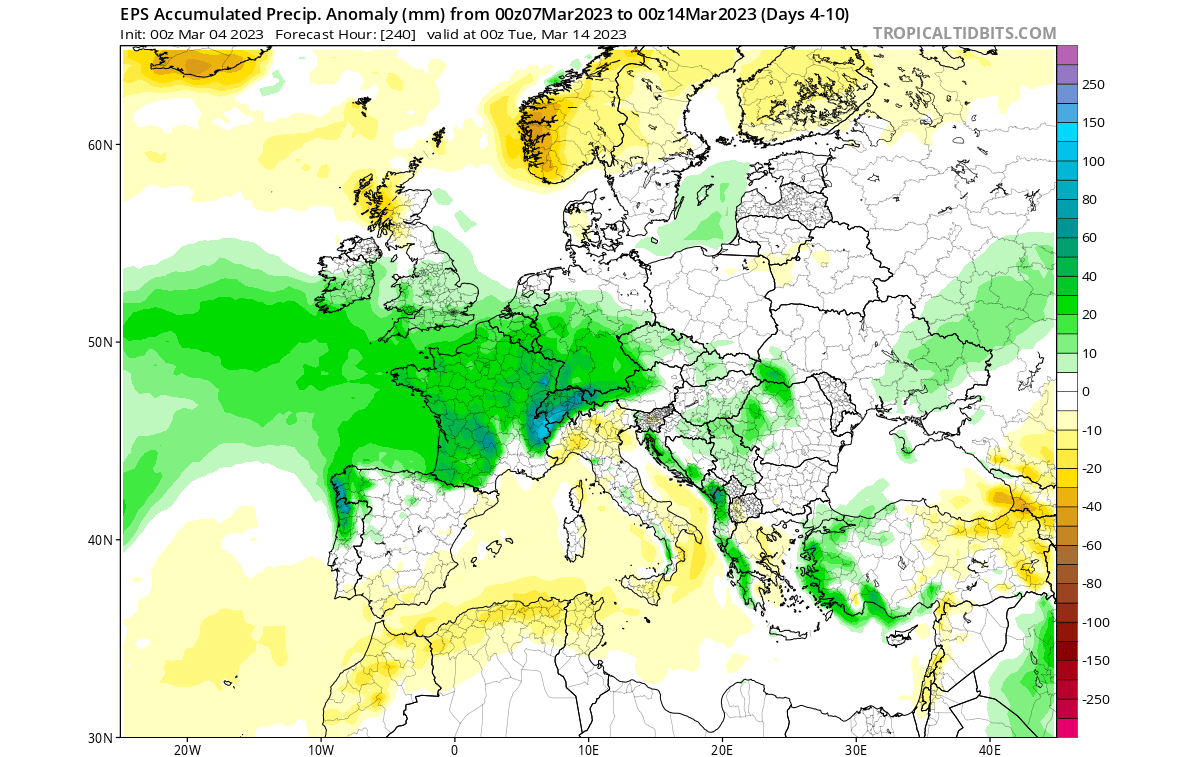
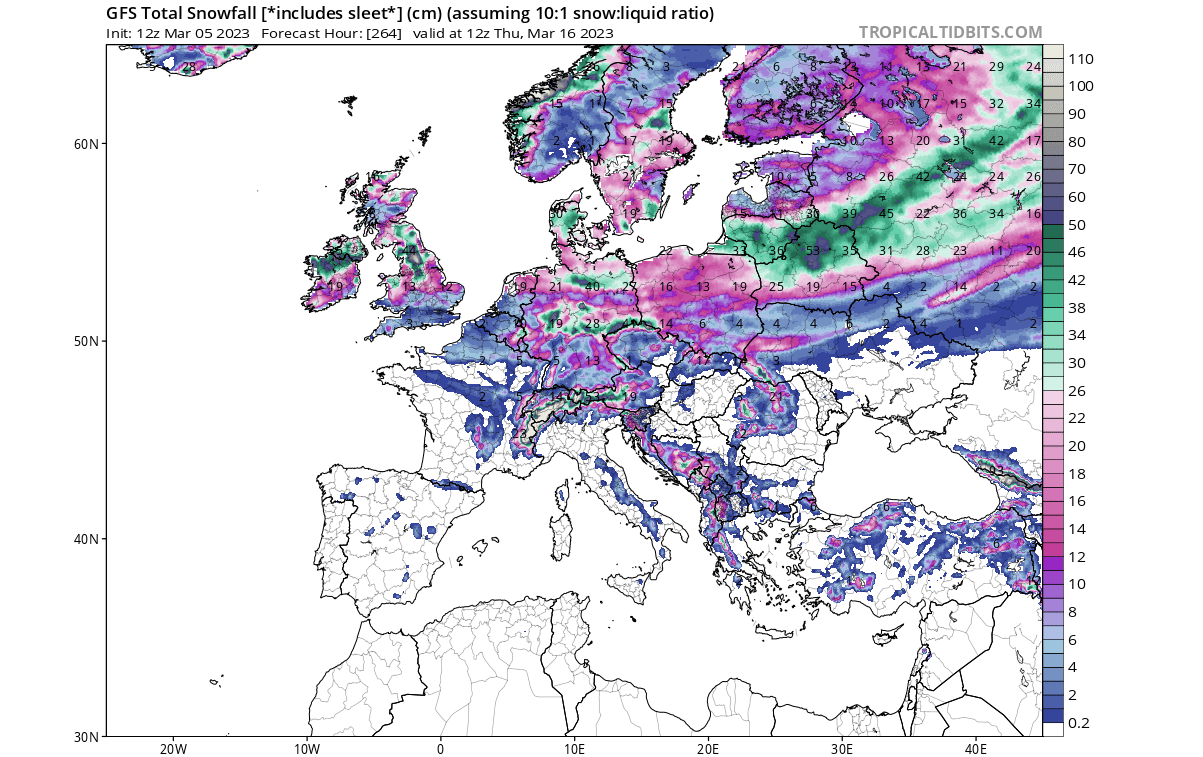
Looking at snowfall in the next ten days over Europe, there is more to come over the continent. A decent snowfall can be seen in the United Kingdom and Northern Ireland. There, the cold air from the north and moisture from the North Atlantic will be available. Exact amounts will vary on each event and location-wise, but winter weather is not over yet across the British Isles.
UNITED STATES PATTERN CHANGE
This period later next week will bring quite a weather change for the central and eastern United States. First, a strong cold outbreak is expected, as the Greenland blocking system helps to push the cold air out of the polar regions.

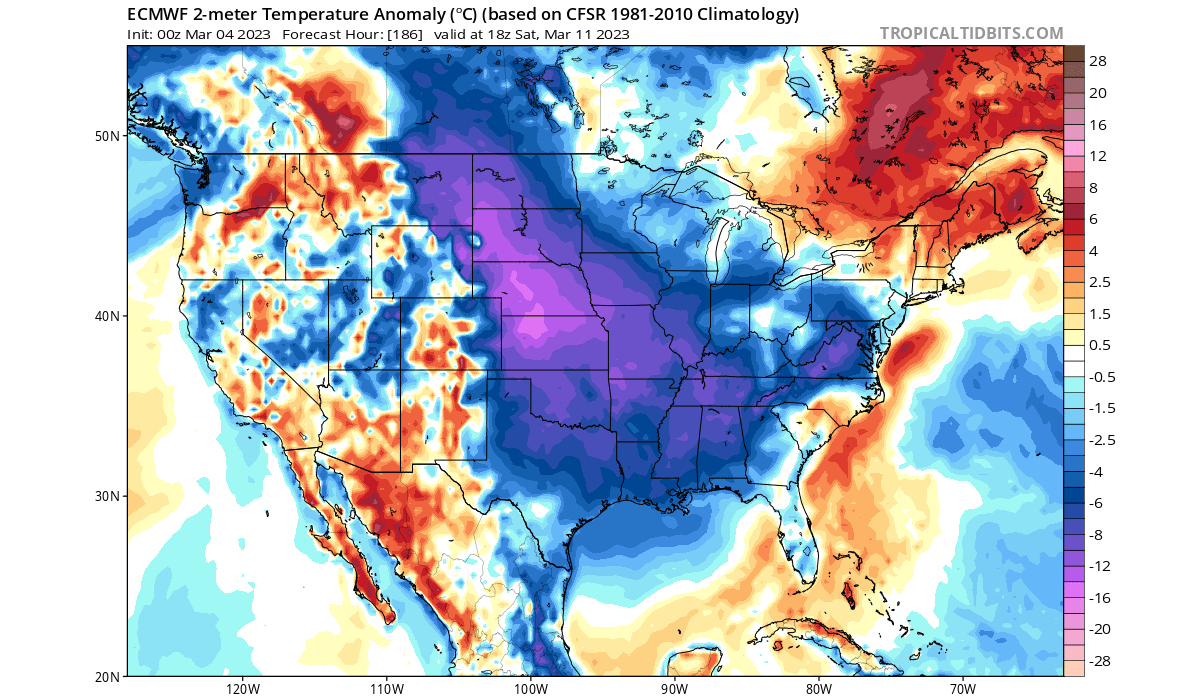
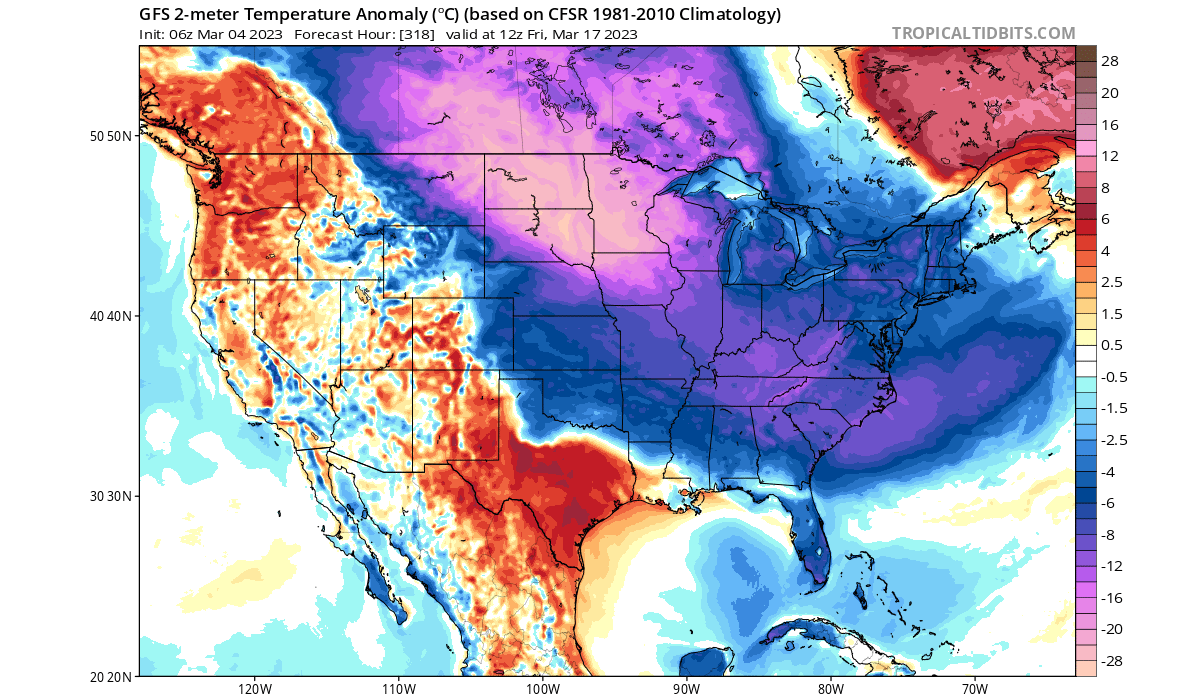
The image above shows the average 5-day surface temperature anomalies, revealing quite a significant cold air outbreak.
Looking more specifically at Saturday below, you can see a strong cold wave extending from southern Canada across the Midwest and into the southern United States. Again, we will cover this event with a separate article and more detail by specific countries.
Looking at precipitation, we can see an area of more precipitation expanding from the Midwest toward the southern United States. The overlap of precipitation and colder temperatures usually provides a good snowfall potential.

This can be seen in the snow depth change forecast below. This shows the 10-day snow depth change from March 4th to March 14th. You can see a strong expansion of snow depth from the Midwest down towards the central alley and The Great Lakes.

This shows a more complete picture, together with the temperature forecast, that we will be dealing with quite a significant late Winter/early Spring cold air outbreak.
The official NOAA temperature outlook for this period shows the strong spread of colder anomalies across much of the United States. The main focus of the cold outbreak will be across the Midwest and spreading down towards the south and east.
Precipitation-wise, we see mostly above-normal precipitation in the official NOAA outlook. This raises the snowfall potential, combined with the colder temperature outlook, similar to our snow depth change forecast above.
The Greenland blocking systems are known for lasting a while. This means that once the pattern is stable, it can last more than two weeks.
THE WEATHER PATTERN CONTINUES
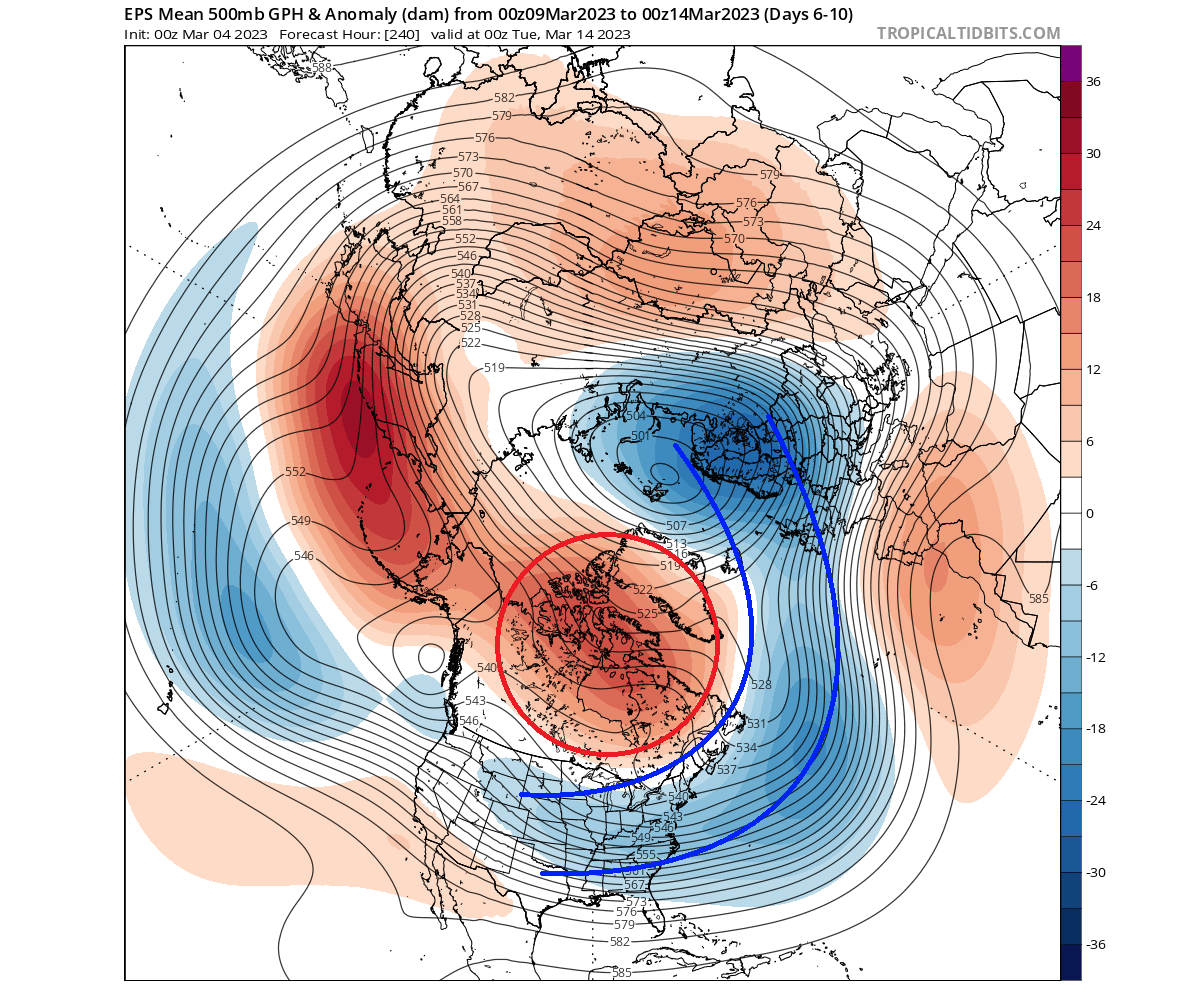
Looking at the geopotential height anomalies again for week 2, you can see that this pattern will continue. Again, a strong blocking high over Greenland and the displaced low-pressure systems over the eastern United States and northern Europe.
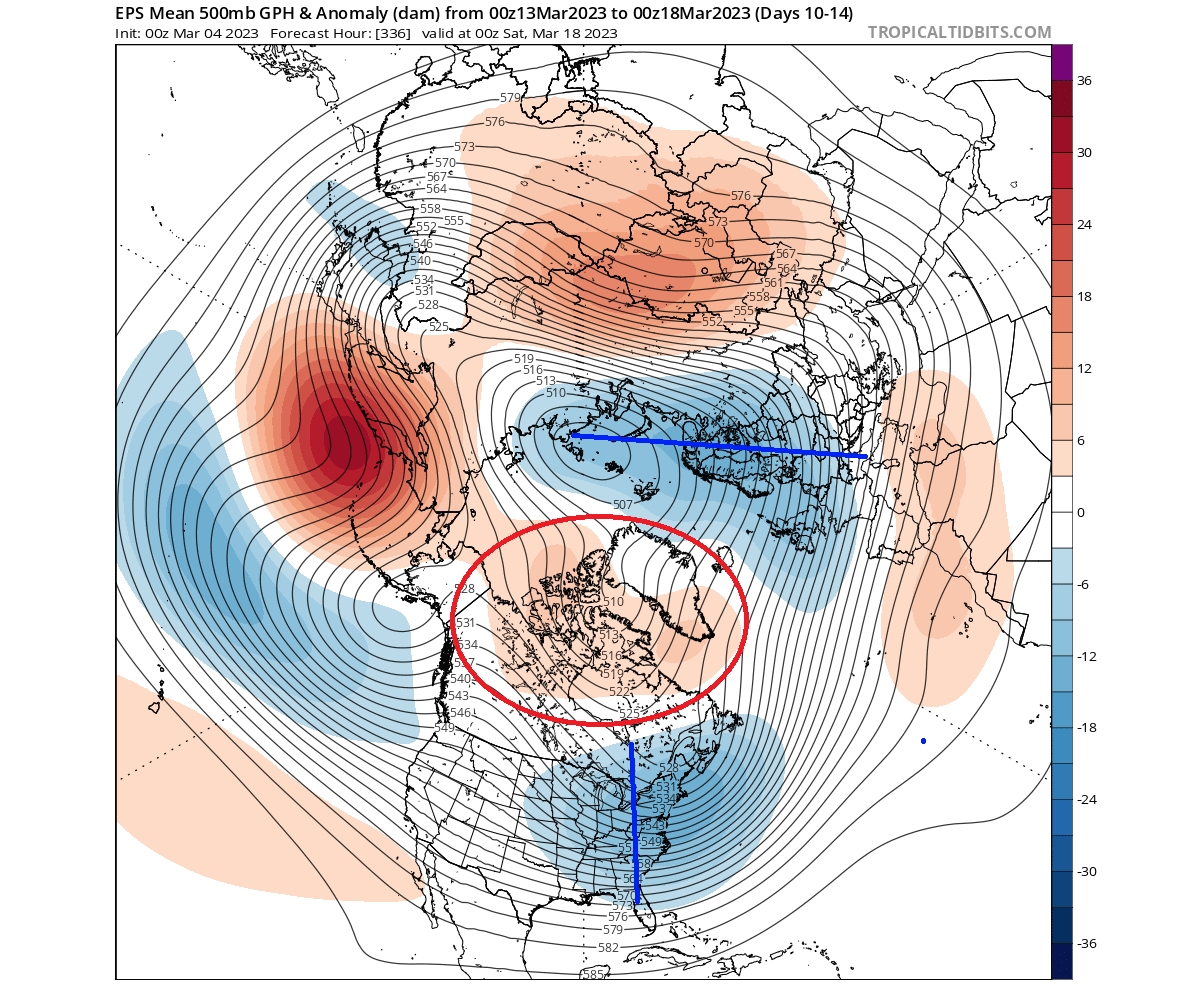
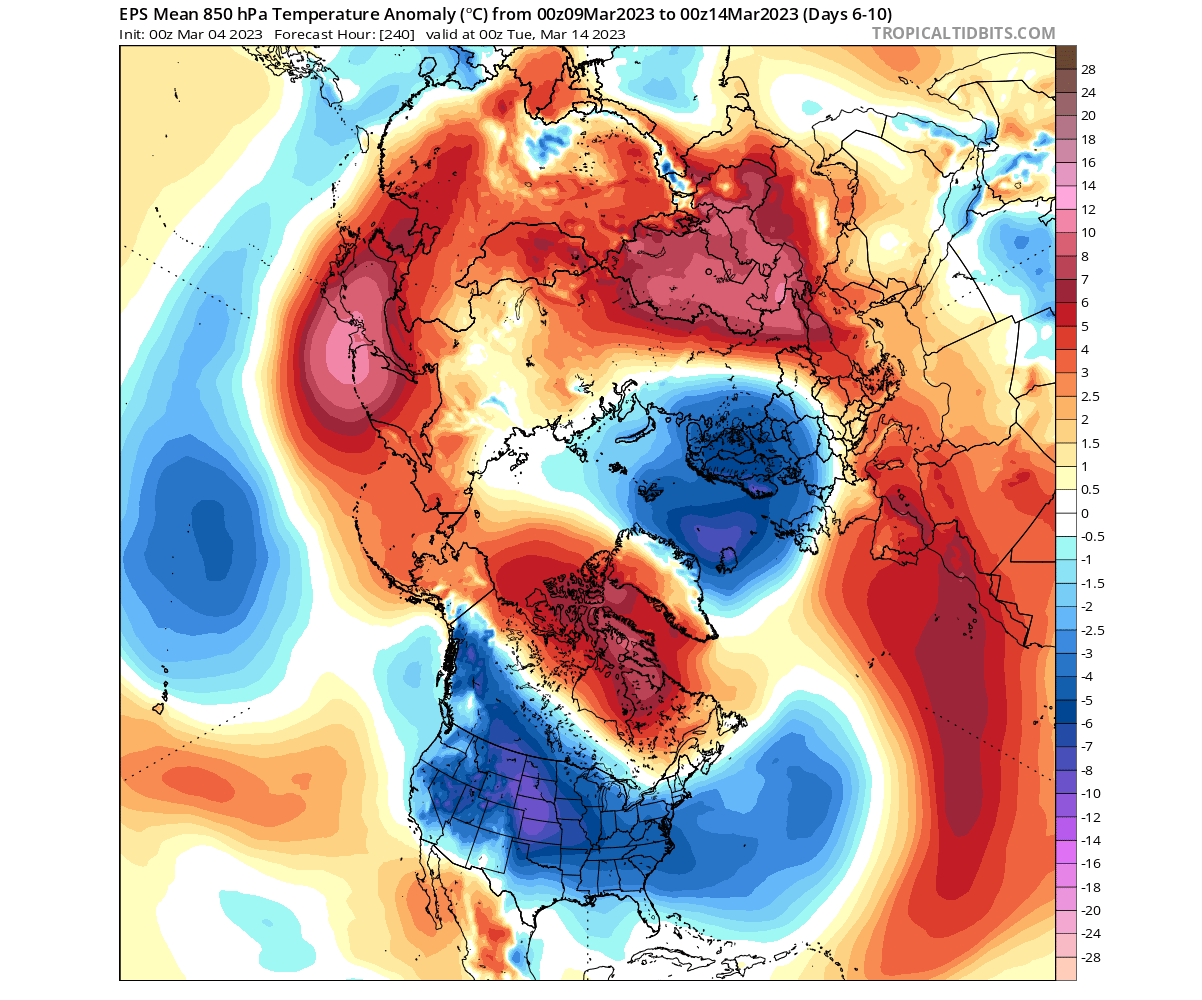
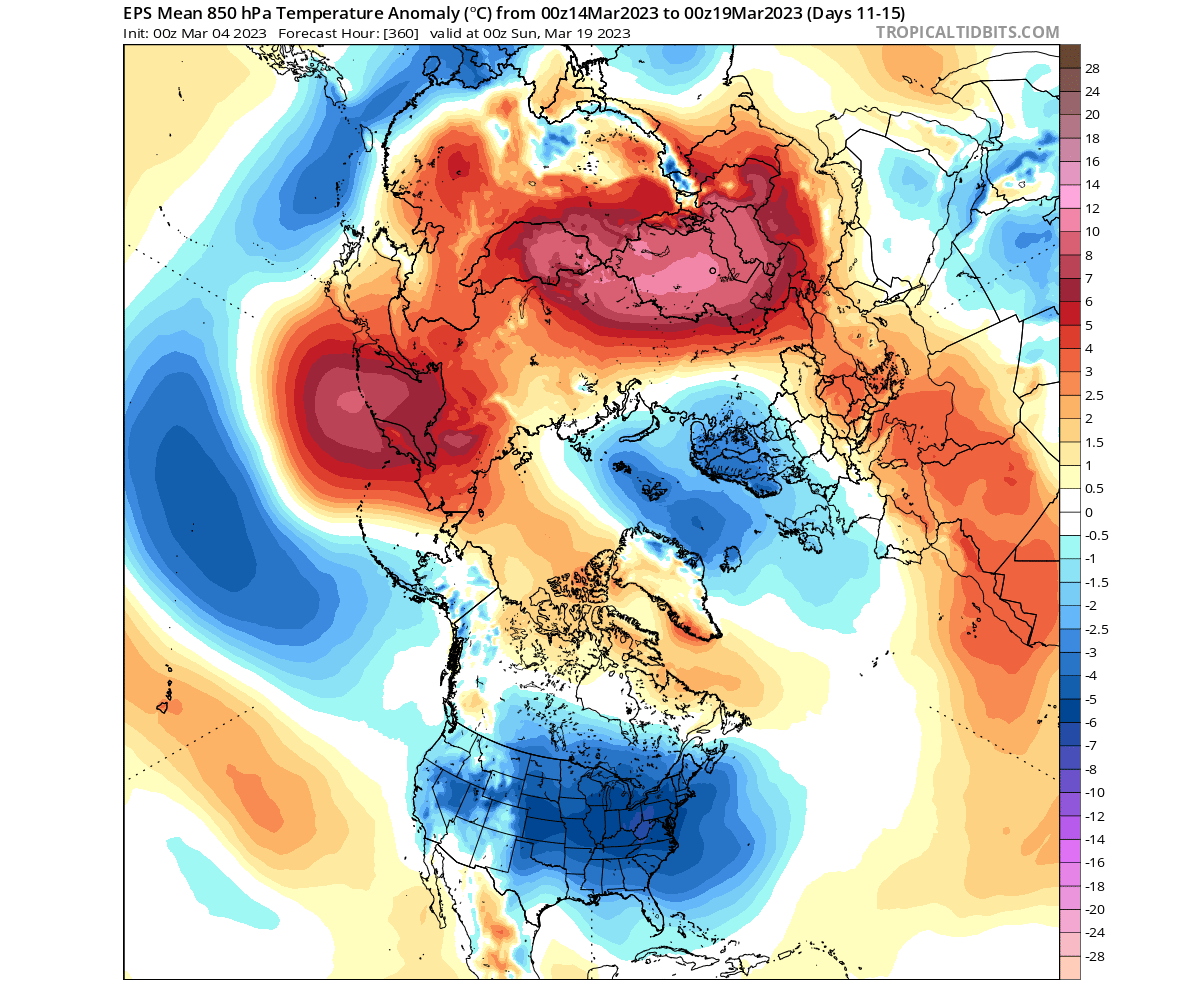
The temperature pattern is not forecast to change much. Warm anomalies will continue around the polar regions, displacing the cold airmass into the United States and northern Europe.
Over Europe, we see the continuation of a similar pattern. Colder air anomalies are focused on the northern regions. The warmer air is forecast to slowly expand further up from the south as the main low-pressure area retracts further to the north.
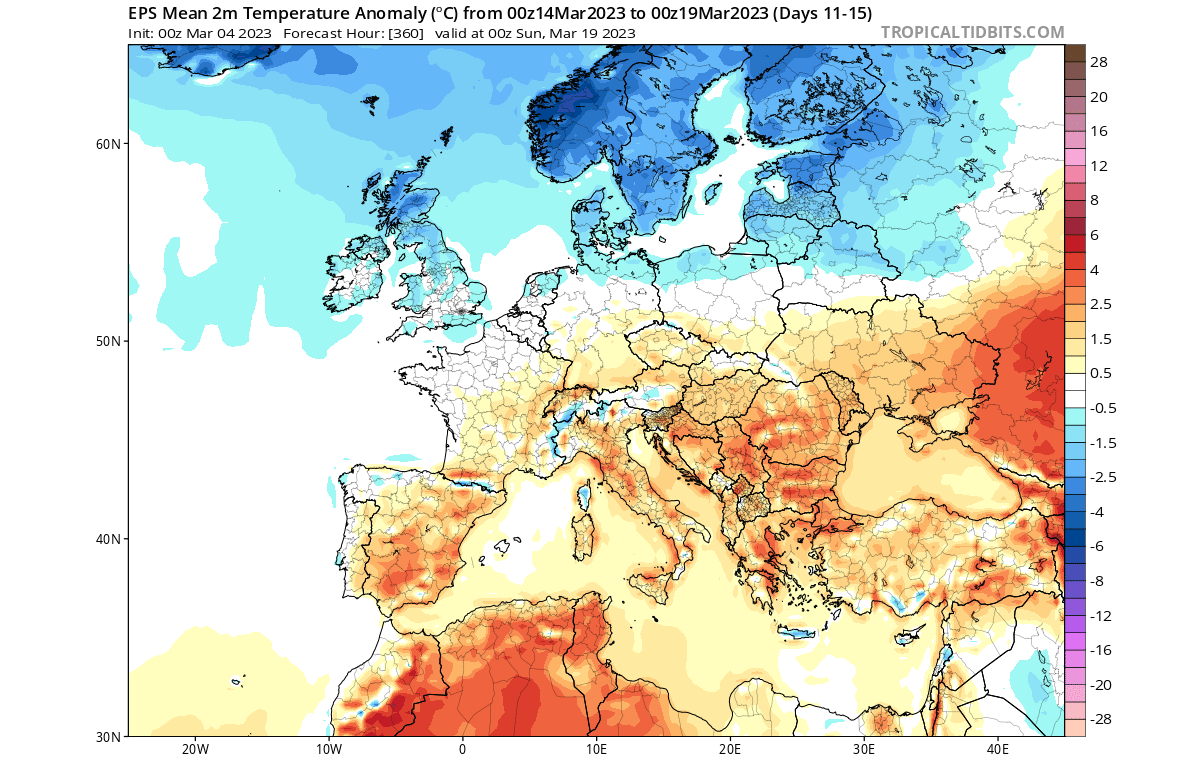
The southerly and westerly flow means more moisture, so the forecast shows more precipitation over central and western Europe and across the British Isles. However, northern Europe sees less precipitation under the colder and drier air.
Looking at North America, we can see the cold air expansion continuing. The main source of the colder airmass looks to be from southwestern Canada across the Midwest corridor towards the south and east.

The forecast above is an ensemble mean for five days. So that is used for the trend and area forecast. Below we have an example solution from a single-run deterministic forecast. You can see the second significant cold air outbreak in two weeks.
Looking at the precipitation below, we can mostly see drier conditions trending in week 2. That is because the colder airmass from the north is usually drier. But more precipitation can be found on the boundary between the cold and warm air, where the southerly flow can provide more moisture.

Looking at the total snowfall for the next two weeks combined, you can see most of the country under snowfall. Larger amounts are found in the higher elevations of the western United States, especially in California. But otherwise, even the lower elevations of western and more northwestern United States will see continued snowfall in the next two weeks.
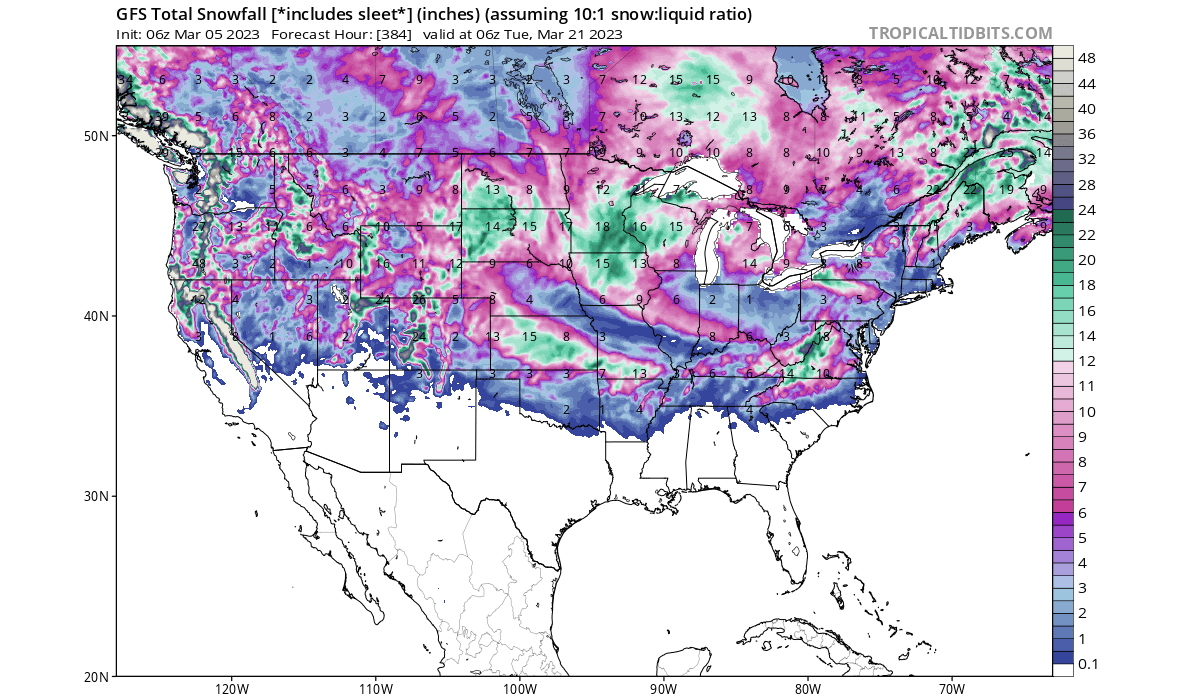
The overall largest core of snowfall is forecast across the Midwest and another batch over the northeastern United States. It is uncertain how far to the south the snowfall boundary will reach. The far southern states are getting warmer fast in March, so it is not easy to get Spring snowfall events down to the deep south.
This is, however, just one single deterministic run, just to show to current idea or the developing trend for the snowfall extent. But, so far, the snowfall season does look to continue for most of the United States, and the winter season returns to the east after a round of unseasonably warm weeks.
OFFICIAL NOAA OUTLOOK
The official NOAA outlook continues the colder-than-normal theme for this period. The core of the cold area is focused slightly more towards the southern and eastern United States as the cold air spreads out.

But precipitation-wise, we do see a drier signal with the second cold air outbreak. This airmass is likely to be drier, resulting in less precipitation for the Midwest.
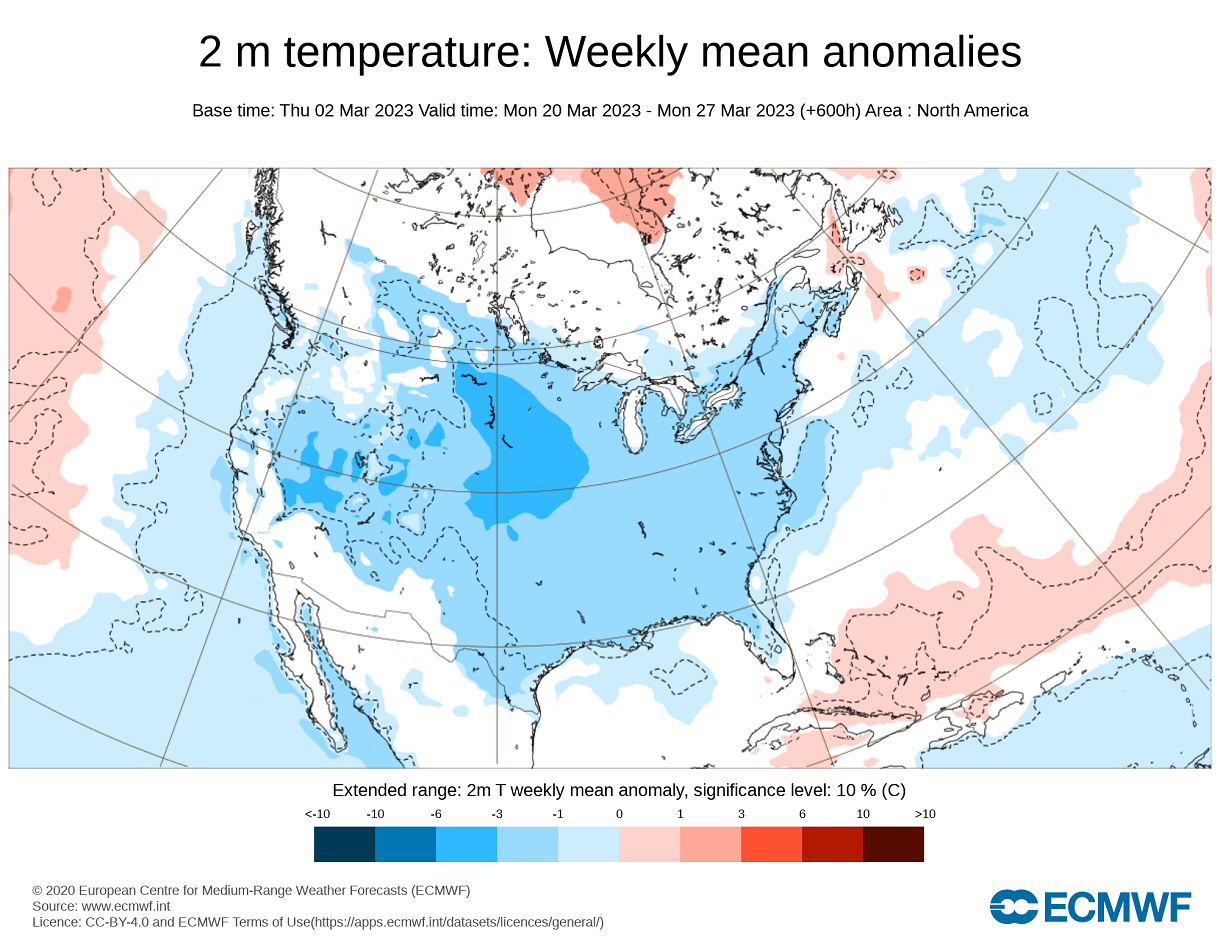
EXTENDED RANGE WEATHER FORECAST
Looking at the ECMWF extended range forecast, the same pattern continues into late March. The high-pressure blocking remains over Greenland and northern Canada, with a low-pressure anomaly below it over the eastern United States and across the Atlantic.

The temperature pattern for Europe does not change much, except for the warmer anomalies expanding over the west and up into the British Isles. The main cold area remains over far northern Europe.

Over North America, we see the continued cold weather pattern over much of the United States. The main cold area is forecast over the Midwest, with the cold air expanding toward the east. Thanks to the Stratospheric Warming event, this month looks like an extension of Winter over the United States.
The official NOAA weather outlook for weeks 3 and 4 also confirms the colder trend continuing. Although the signal is weaker at these ranges, the trend of continued colder temperatures is obvious into late March.
Precipitation-wise, the drier single continues with the core of the colder anomalies over the Midwest. But some areas in the eastern United States could overlap moisture and perhaps cold enough temperatures to provide some early Spring snowfall potential.

So as you can see, having a strong or weak Polar Vortex can significantly change the weather in the United States, Canada, and Europe. For this reason, we closely monitor the weather patterns and all activity surrounding the Polar Vortex.
We will keep you updated on the global weather pattern development, so bookmark our page. Also, if you have seen this article in the Google App (Discover) feed, click the like button (♥) there to see more of our forecasts and our latest articles on weather and nature in general.
Don’t miss: