Strong cold anomalies are being detected in the stratosphere over Southern Hemisphere. The anomalous cooling results from the water vapor coming from the January Hunga Tonga eruption. Cooling on this scale has not been seen in modern satellite records, so this is a significant event.
We will look at what is happening with temperatures in the southern stratosphere, how it all actually happened, and how it might impact our side of the planet in the upcoming Winter 2022/2023.
FROM THE GROUND TO THE STRATOSPHERE
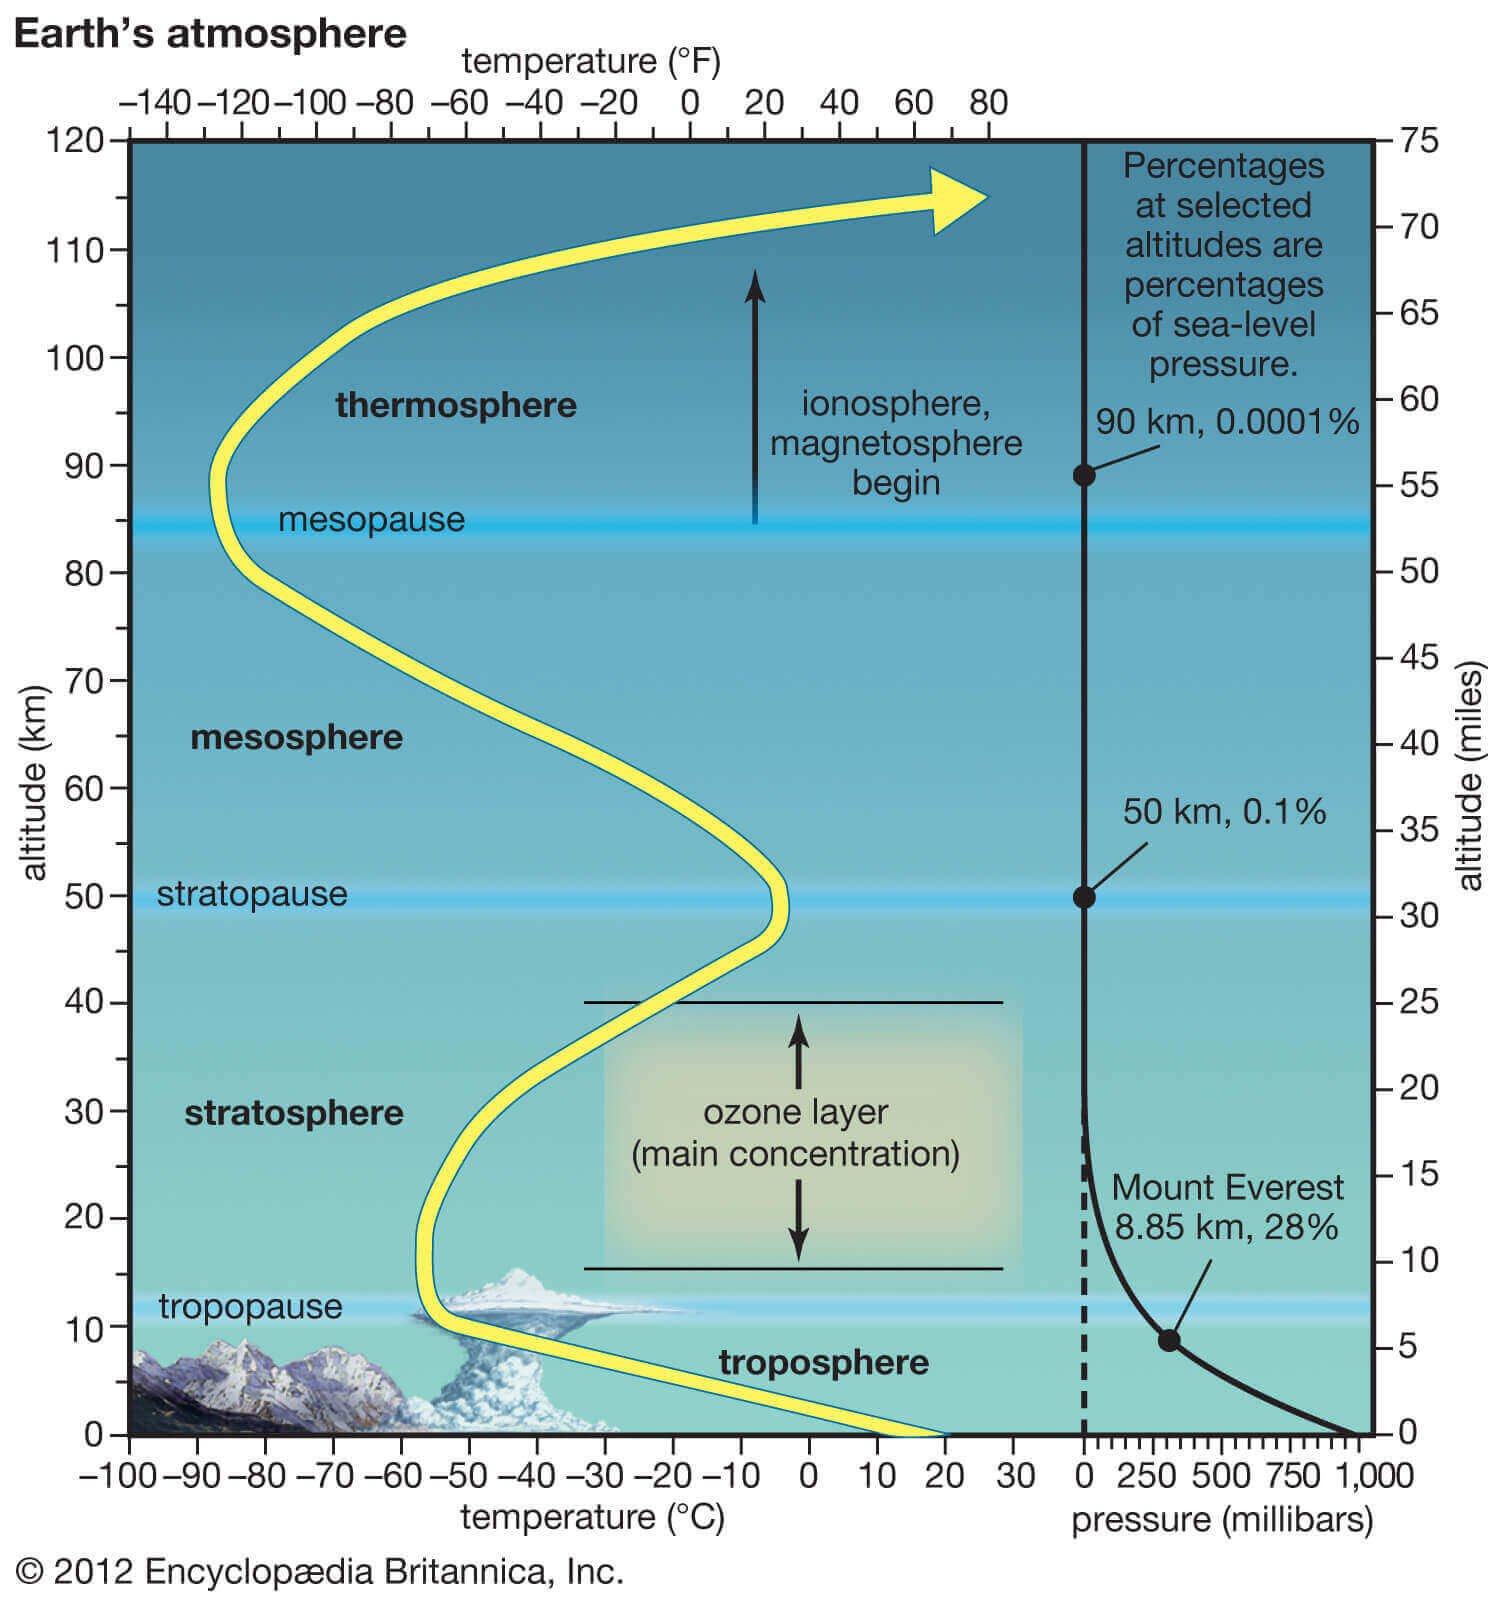
All of the clouds (and our weather) are found in the lowest layer of the atmosphere, called the troposphere. It reaches up to around 8 km (5 miles) altitude over the polar regions and up to around 14-16 km (9-10 miles) over the tropics.
Above it, there is a much deeper layer called the stratosphere. This layer is around 30 km thick and is very dry. This is where the Ozone layer is found. You can see the layers of the atmosphere in the image below, with the troposphere on the bottom and the stratosphere with the ozone layer above it.
These layers are important because while our weather is in the lowest part of the atmosphere, it can be heavily modified by the impacts from above. Especially the stratosphere is known for its effects and changes regarding the Polar Vortex.
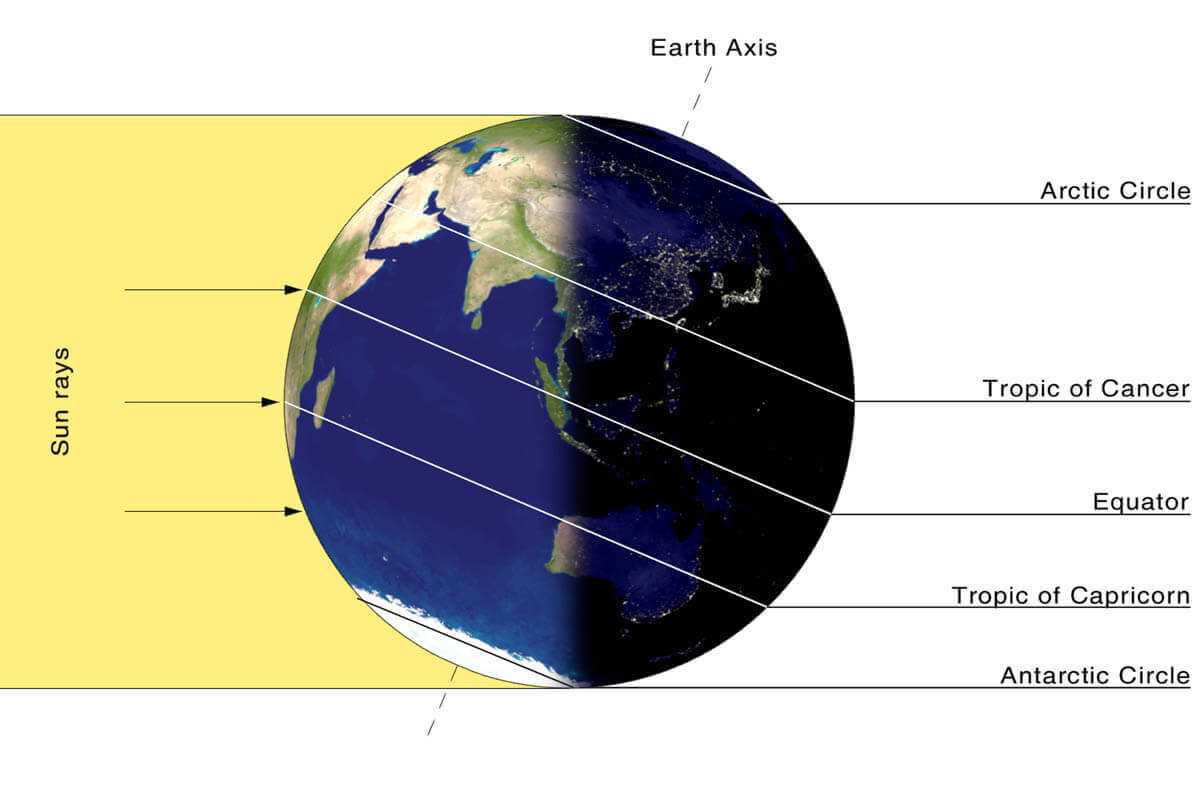
Every year as we head into autumn, the north pole starts to cool down. But the atmosphere further south is still relatively warm as it continues to receive energy from the Sun, while the polar regions receive much less over time. You can see the winter solstice below, as the polar regions receive little to zero solar energy.
As the temperature drops over the polar regions, so does the pressure. In the stratosphere, the process is the same. As the temperature drops over the pole and the temperature difference towards the south increases, a large low-pressure (cyclonic) circulation start to develop across the polar stratosphere.
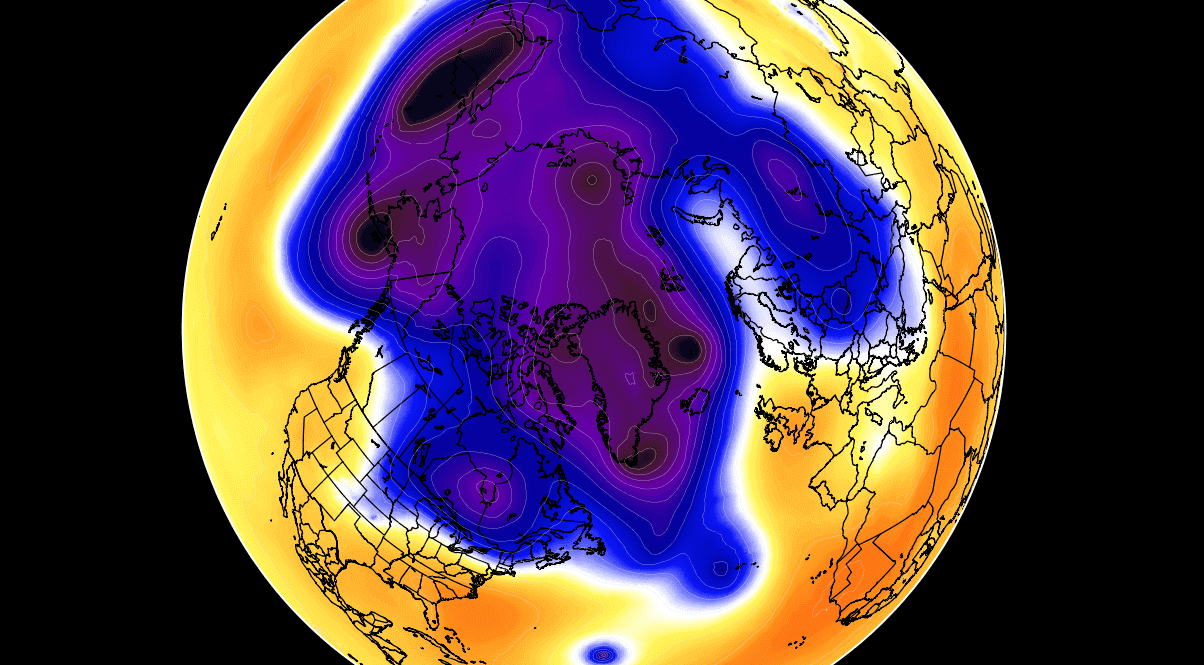
The image below shows a typical example of the Polar Vortex at around 30km/18.5miles altitude (10mb level) in the middle stratosphere during winter.
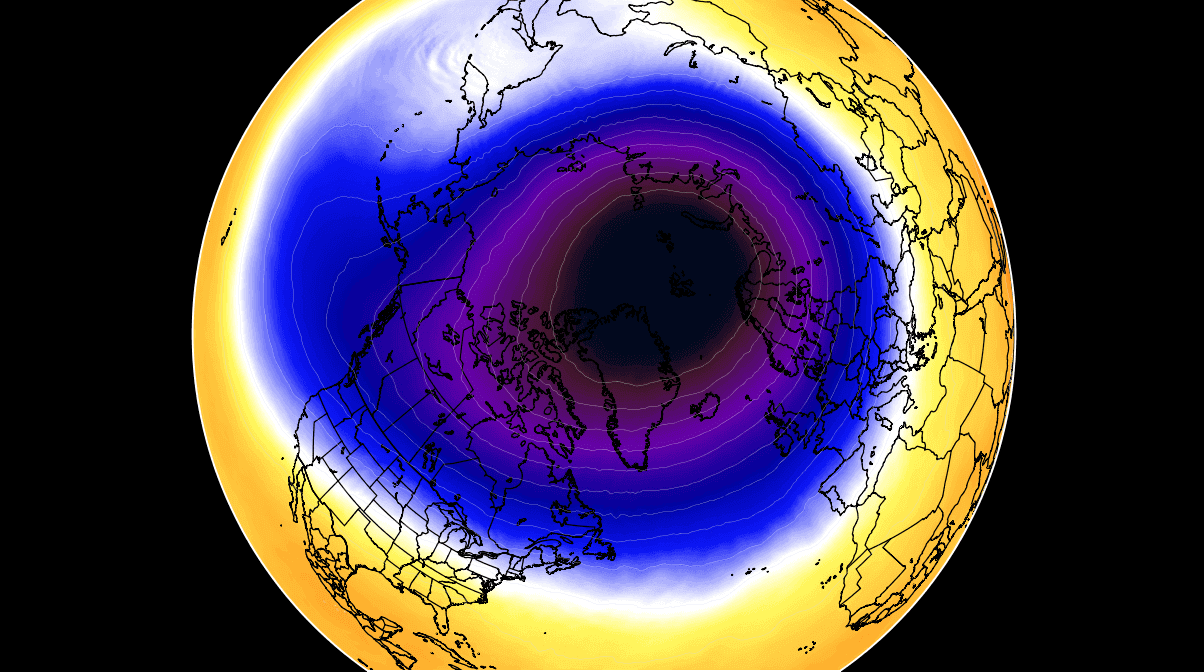
It is basically like a very large cyclone, covering the whole north pole, down to the mid-latitudes. So it is strongly present at all levels, from the ground up, but in different shapes.
But in the next image, we have the polar vortex at a much lower altitude, around 5km/3miles. It reveals the true shape and size of the polar vortex closer to the ground. The closer to the ground we get, the more deformed the polar vortex gets because of the growing influence of the terrain and the many weather fronts and systems.
We are typically focusing more on the Stratospheric Polar Vortex during the winter, as it plays a very important role in weather development throughout the season. It is known for its strong influence down from the stratosphere.
But while we are more concerned with the stratosphere and the Polar Vortex of the Northern Hemisphere, a major cooling event is now unfolding over the Southern Hemisphere.
WATER IN THE ATMOSPHERE
We began with the Polar Vortex and the Stratosphere because that is where the main part of our story is currently unfolding.
Strong volcanic eruptions can send different gasses and materials directly into the stratosphere. Depending on the type of particles and their amount, that can result in different regional and global atmospheric effects.
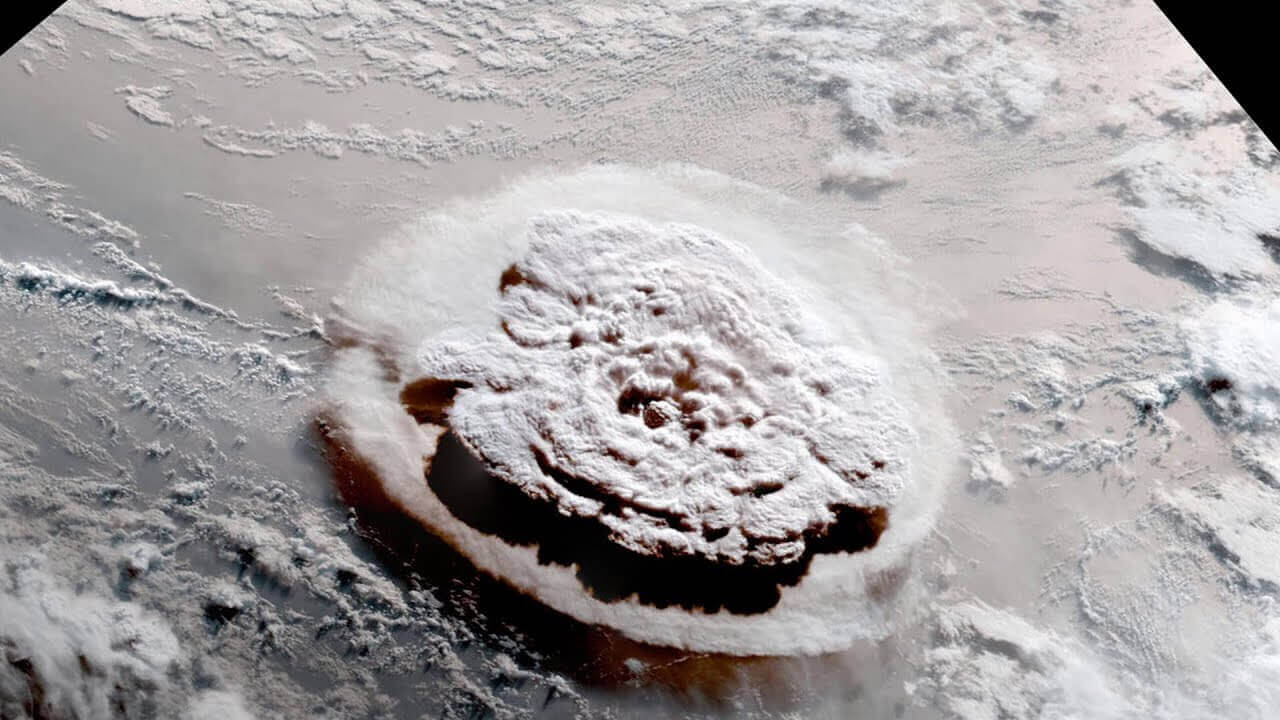
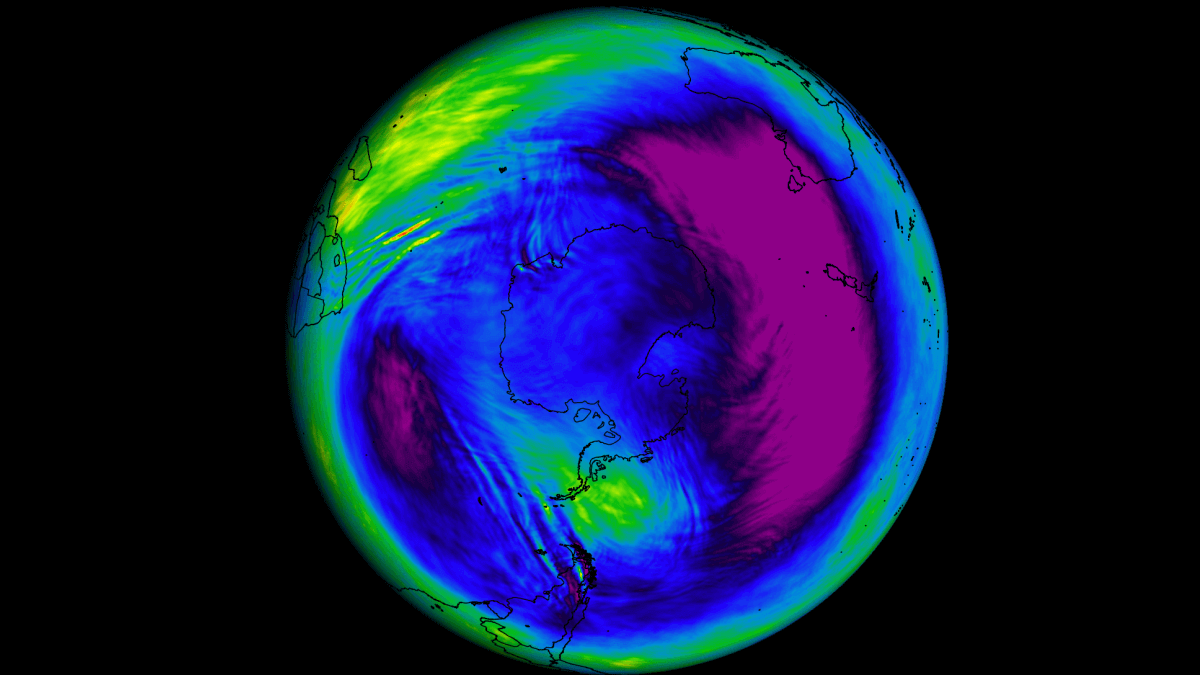
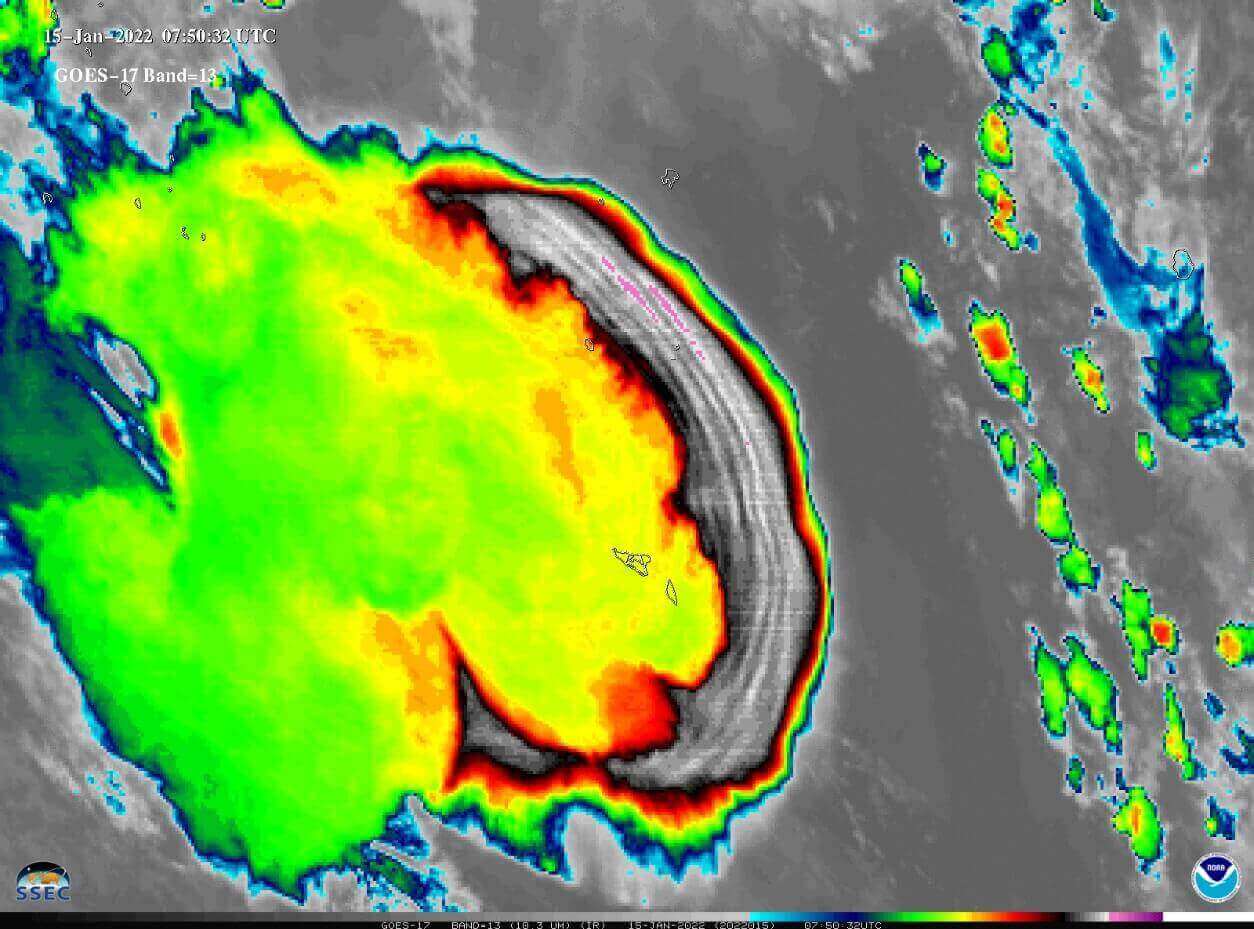
The submarine Hunga Tonga volcano in the South Pacific erupted violently on 15 January 2022. Tonga produced a massive volcanic plume that briefly reached 58 km (36 miles), touching the mesosphere. Below we have infrared satellite imagery of the eruption. We can see the warmer (green-yellow) cloud in the stratosphere and the colder (black-white) cloud in the troposphere.
The eruption injected volcanic gases (sulfur) into the stratosphere and a large amount of water in the form of water vapor. The water volume in the plume was very high because the volcano is “submarine” (below the water level), erupting out of the ocean.
The video below shows the massive eruption sending water and volcanic particles into the stratosphere. This eruption was strong enough to send shockwaves around the entire planet several times over.
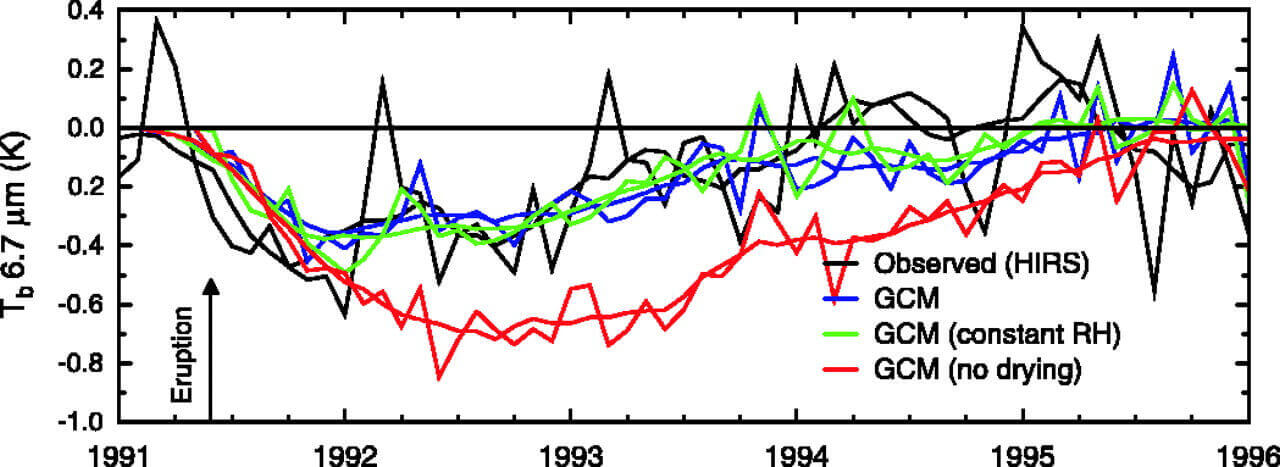
You are probably familiar with sulfur, having a global cooling effect if ejected into the stratosphere in high amounts. One well-known example is the 1991 eruption of Pinatubo, which ejected a large amount of sulfur into the stratosphere, cooling the Earth’s temperatures for the following few years (seen below).
Like sulfur, water vapor has a cooling effect, but not at the surface. Instead, it actually cools the stratosphere because it reflects the incoming solar radiation. It also prevents the heat from escaping, thus actually warming the surface.
So how much water was injected into the stratosphere? Based on observations and measurements, the normal amount of water in the stratosphere is around 1560 Teragrams.
Following the eruption of Hunga Tonga, the total amount of water increased to over 1700 Teragrams, which is a 10% increase in total stratospheric water vapor content. This is a large amount, coming from just one event.

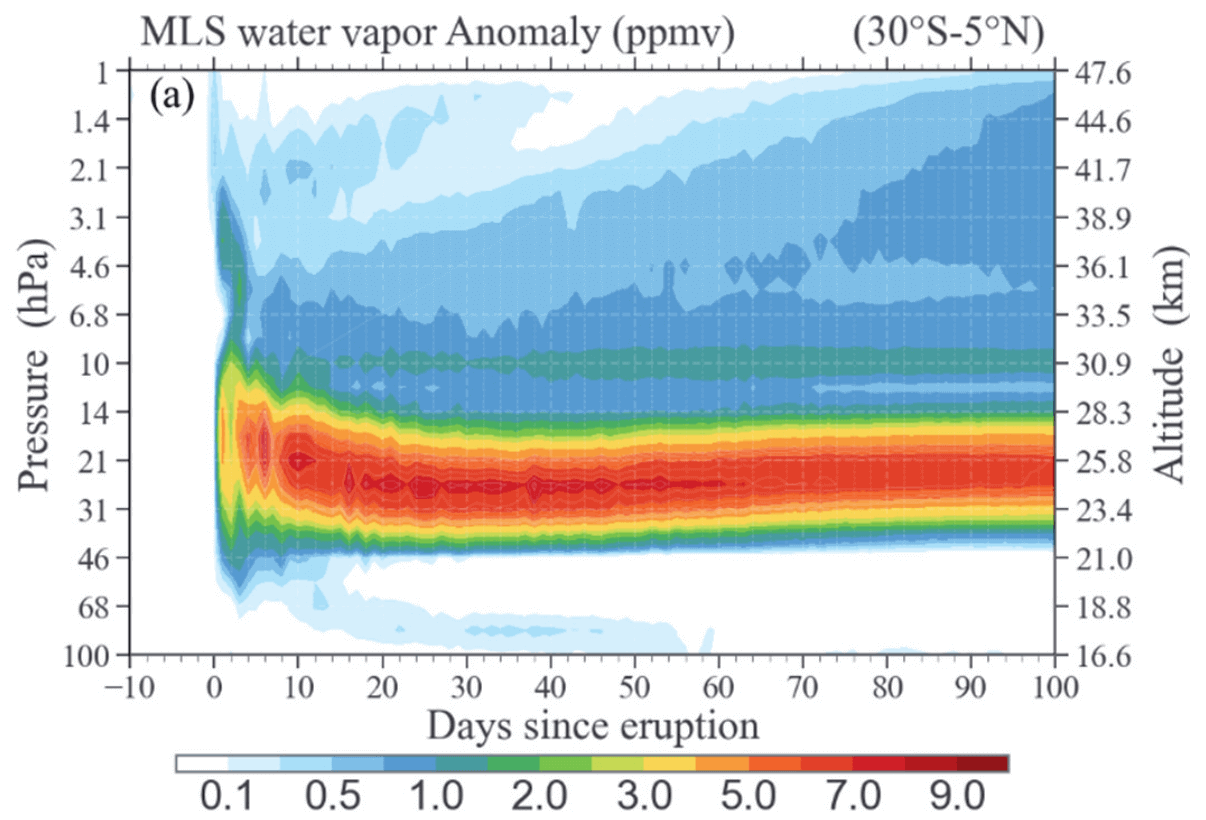
Looking at the vertical analysis, we can see the injected water vapor in the image below. The water vapor was injected into the upper stratosphere, but the main concentration is between 20-30km (12-18 miles).
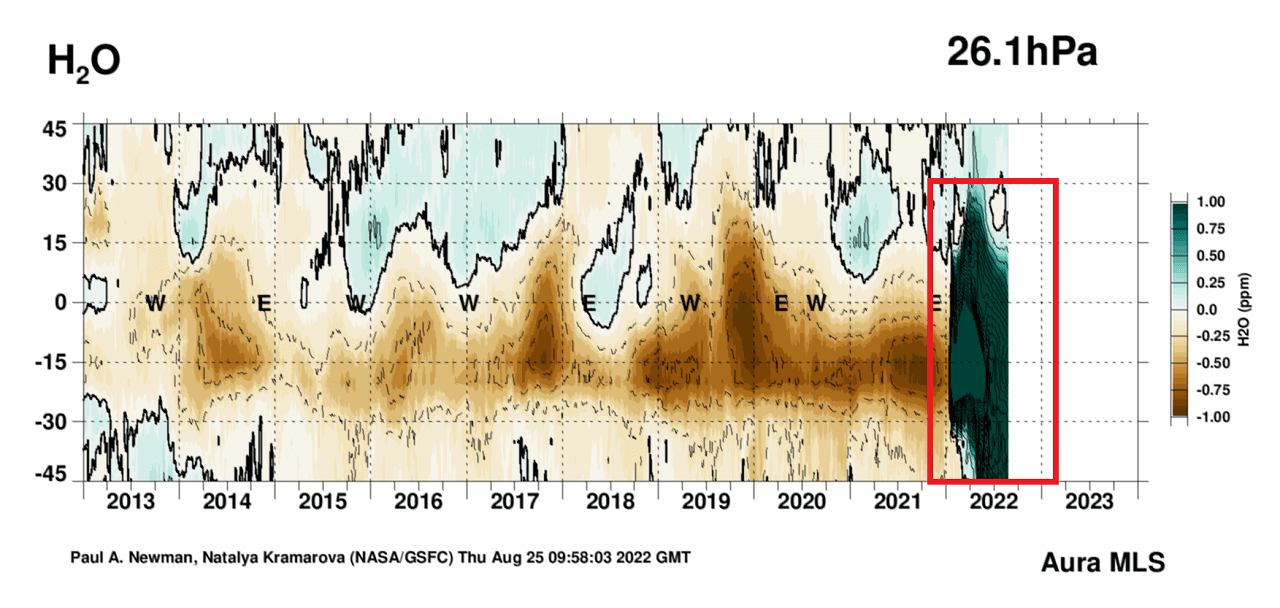
Below we have the NASA analysis of the water vapor anomaly at around 26mb pressure level (25km/15.5mi). Again, you can see the significant increase following the eruption, spreading across the south and north hemisphere.
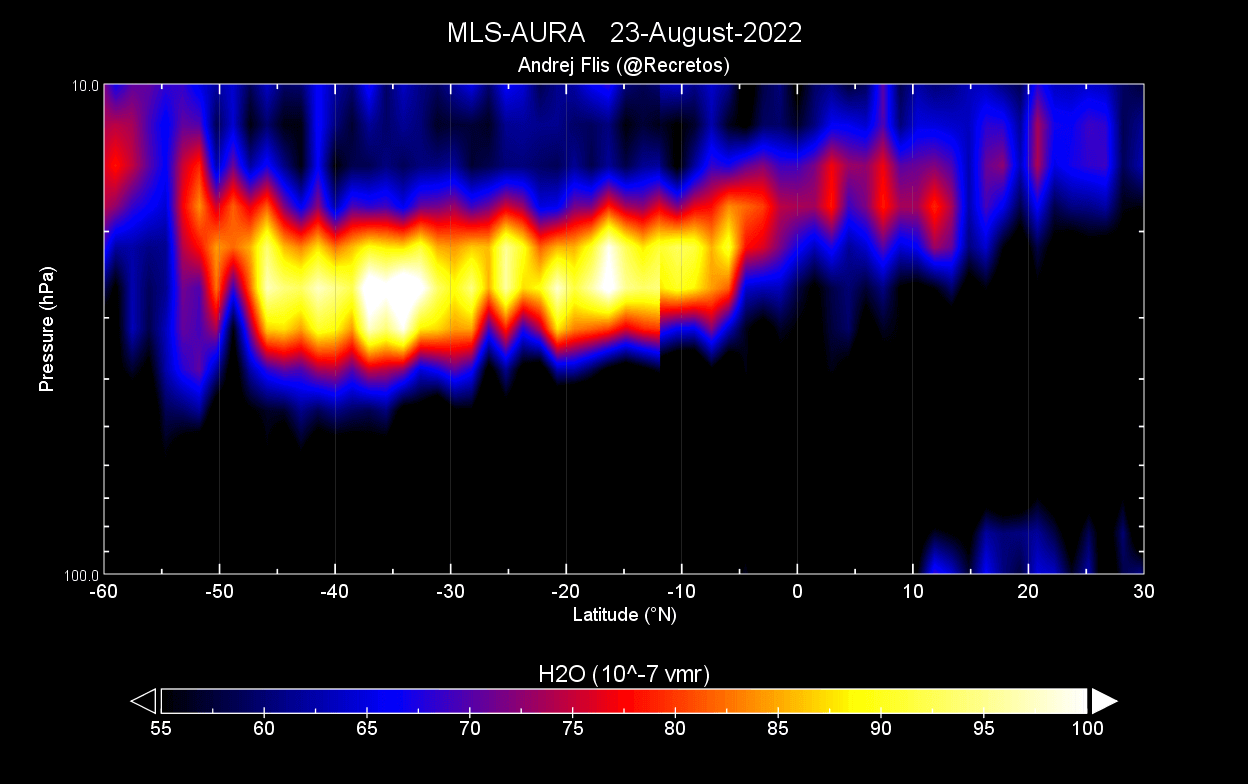
We produced a zonal-mean plot from MLS-AURA data provided by NASA. It shows the water vapor content in the lower to mid-stratosphere. You can see the water vapor cloud reaching deep into the southern hemisphere and also reaching into the northern hemisphere.
So the main takeaway is that a large water vapor “cloud” circles the globe in the stratosphere. As you will find out, it has a strong cooling effect and is likely to impact the global weather in some way over the coming months and years.
STRATOSPHERIC COOLING
As mentioned, water vapor is very potent at cooling the stratosphere. It deflects the incoming solar radiation, keeping the temperatures lower. We will track these changes using the reanalysis data from the NOAA Physical Sciences Laboratory.
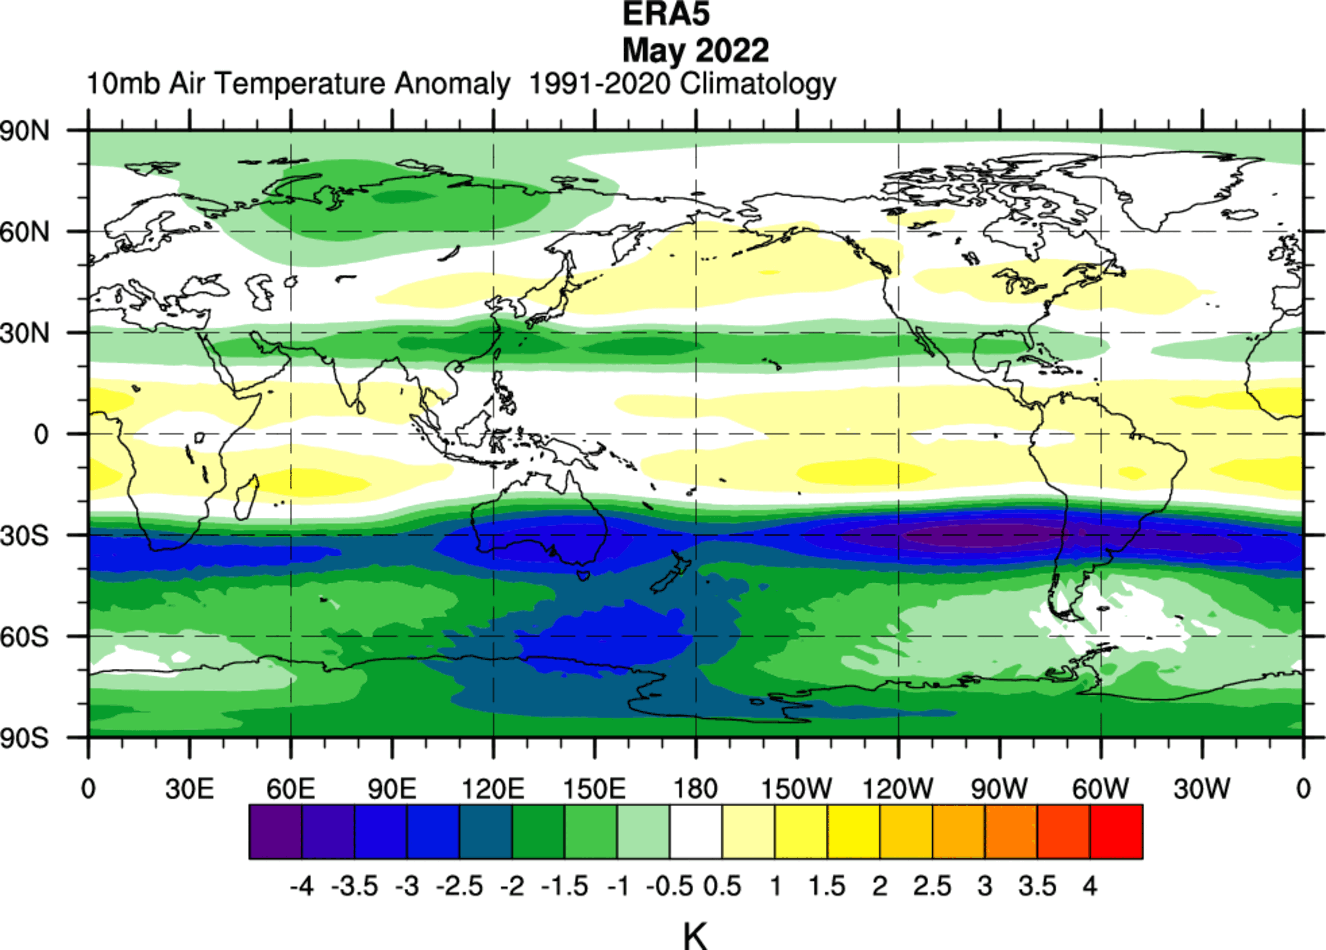
Looking first at May 2022, we can see the mid-stratosphere temperature anomaly below. There was cooling already observed in the southern hemisphere. The strongest belt of cold anomalies was around the 30° south latitude.
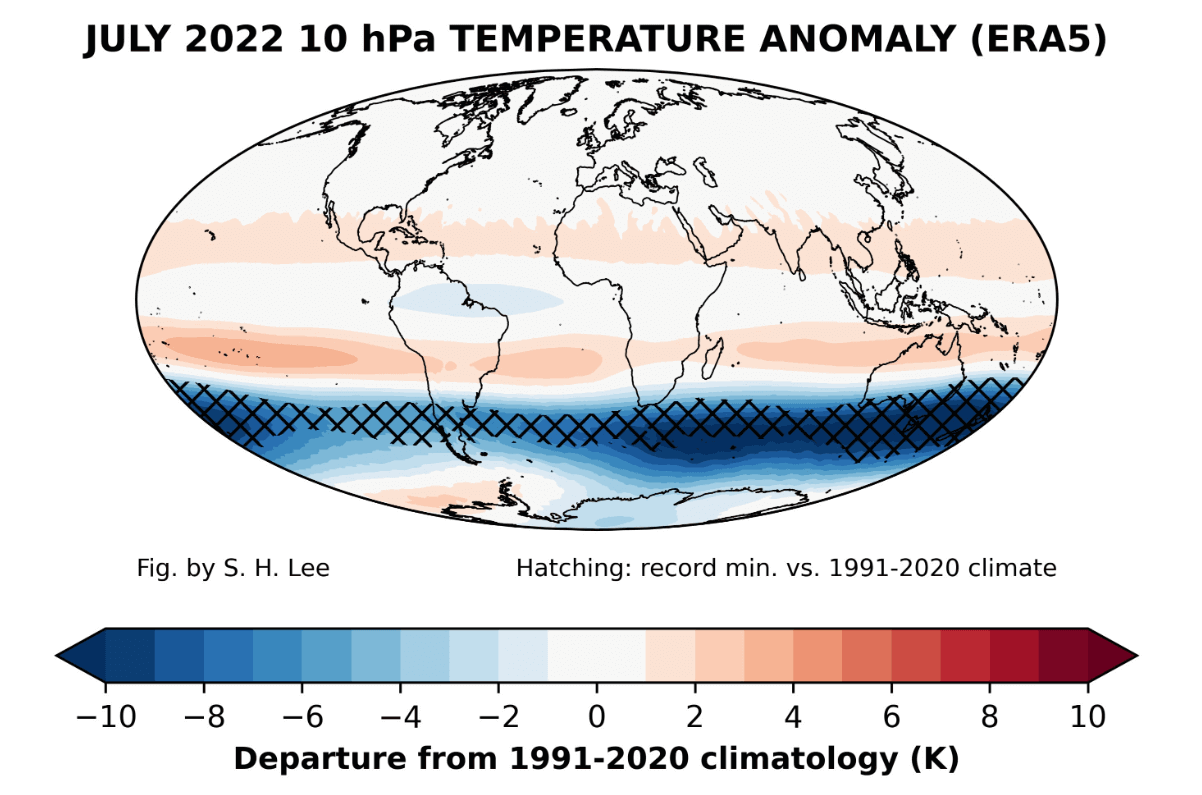
By July, the cooling effect was stronger. Below we can see the cold anomalies moved further towards the south pole, now maximizing in the mid-latitudes. The anomalies in July were substantial, reaching more than 10 degrees below normal.

The image below was made by Simon H. Lee and also shows the July 2022 mid-stratosphere temperature anomaly. The cross markings in the southern hemisphere mark the record minimal temperatures, which span in a belt around the whole southern hemisphere.
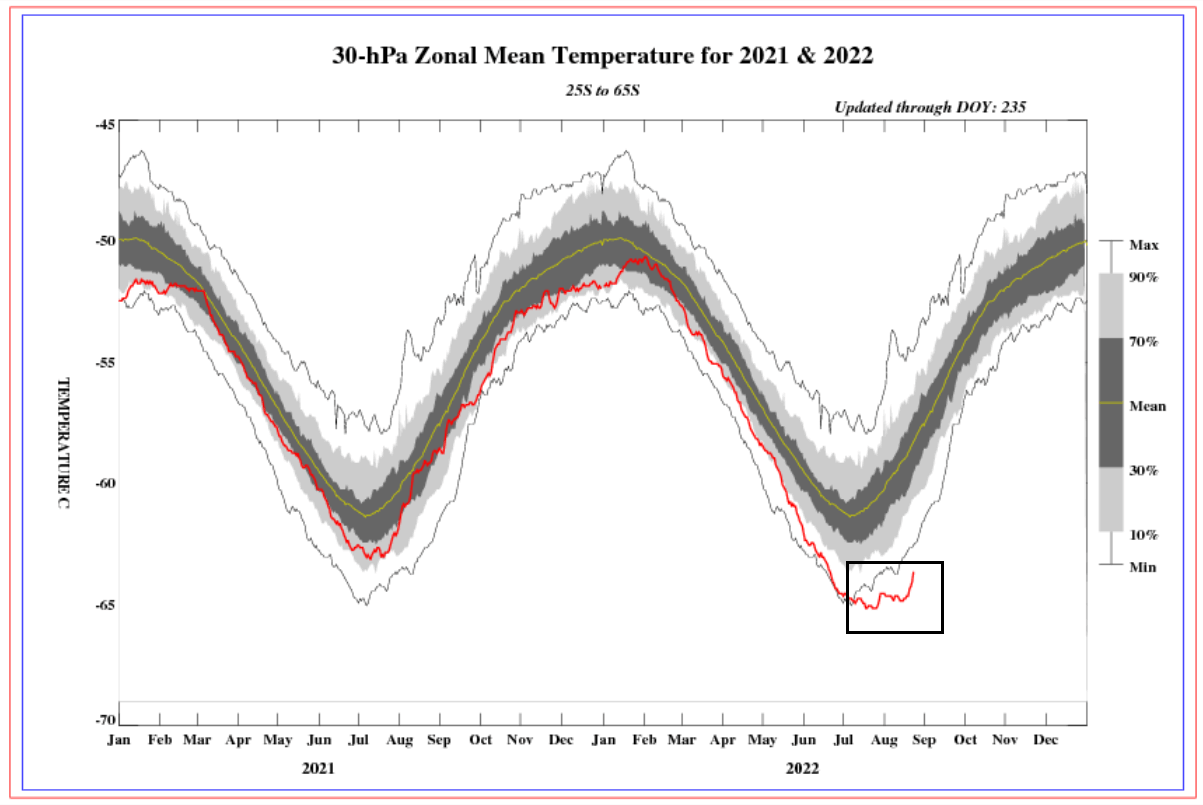
The NOAA mid-stratosphere temperature graph actually shows this unusual cooling. It is marked on the image below, reaching below the previous minimal temperatures in the past 40-year records.
Not only temperatures, as shown in the image below, but the pressure is also lower. You can see a belt of low-pressure anomalies in the same region as the cooling anomalies. This is an overall significant change/anomaly for the southern stratosphere.

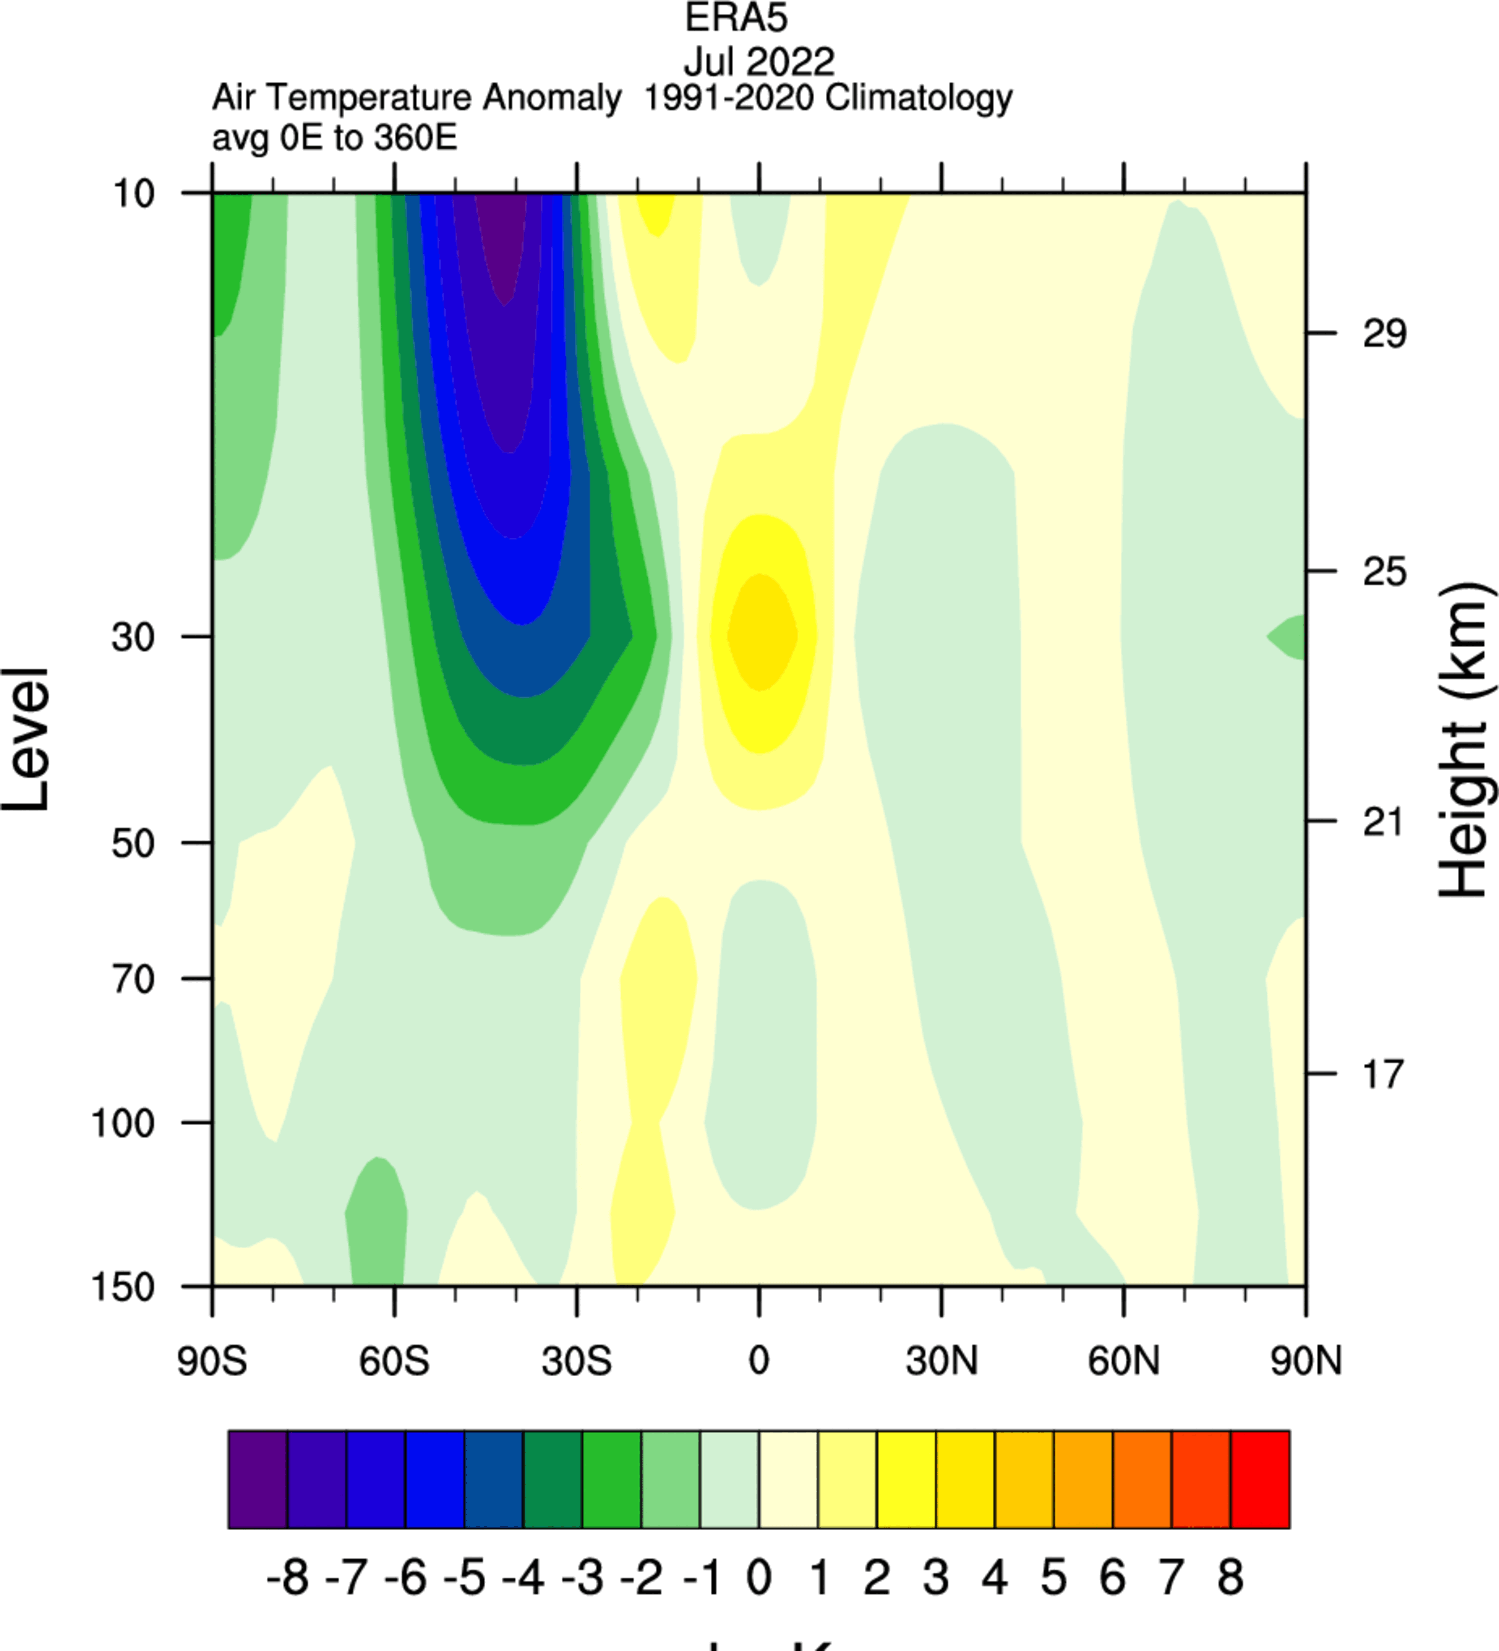
Looking at the vertical analysis, you can see the cold anomalies reaching all the way from the lower to the middle stratosphere. The strongest anomalies are confined between the 30 to 60 degrees south latitude.
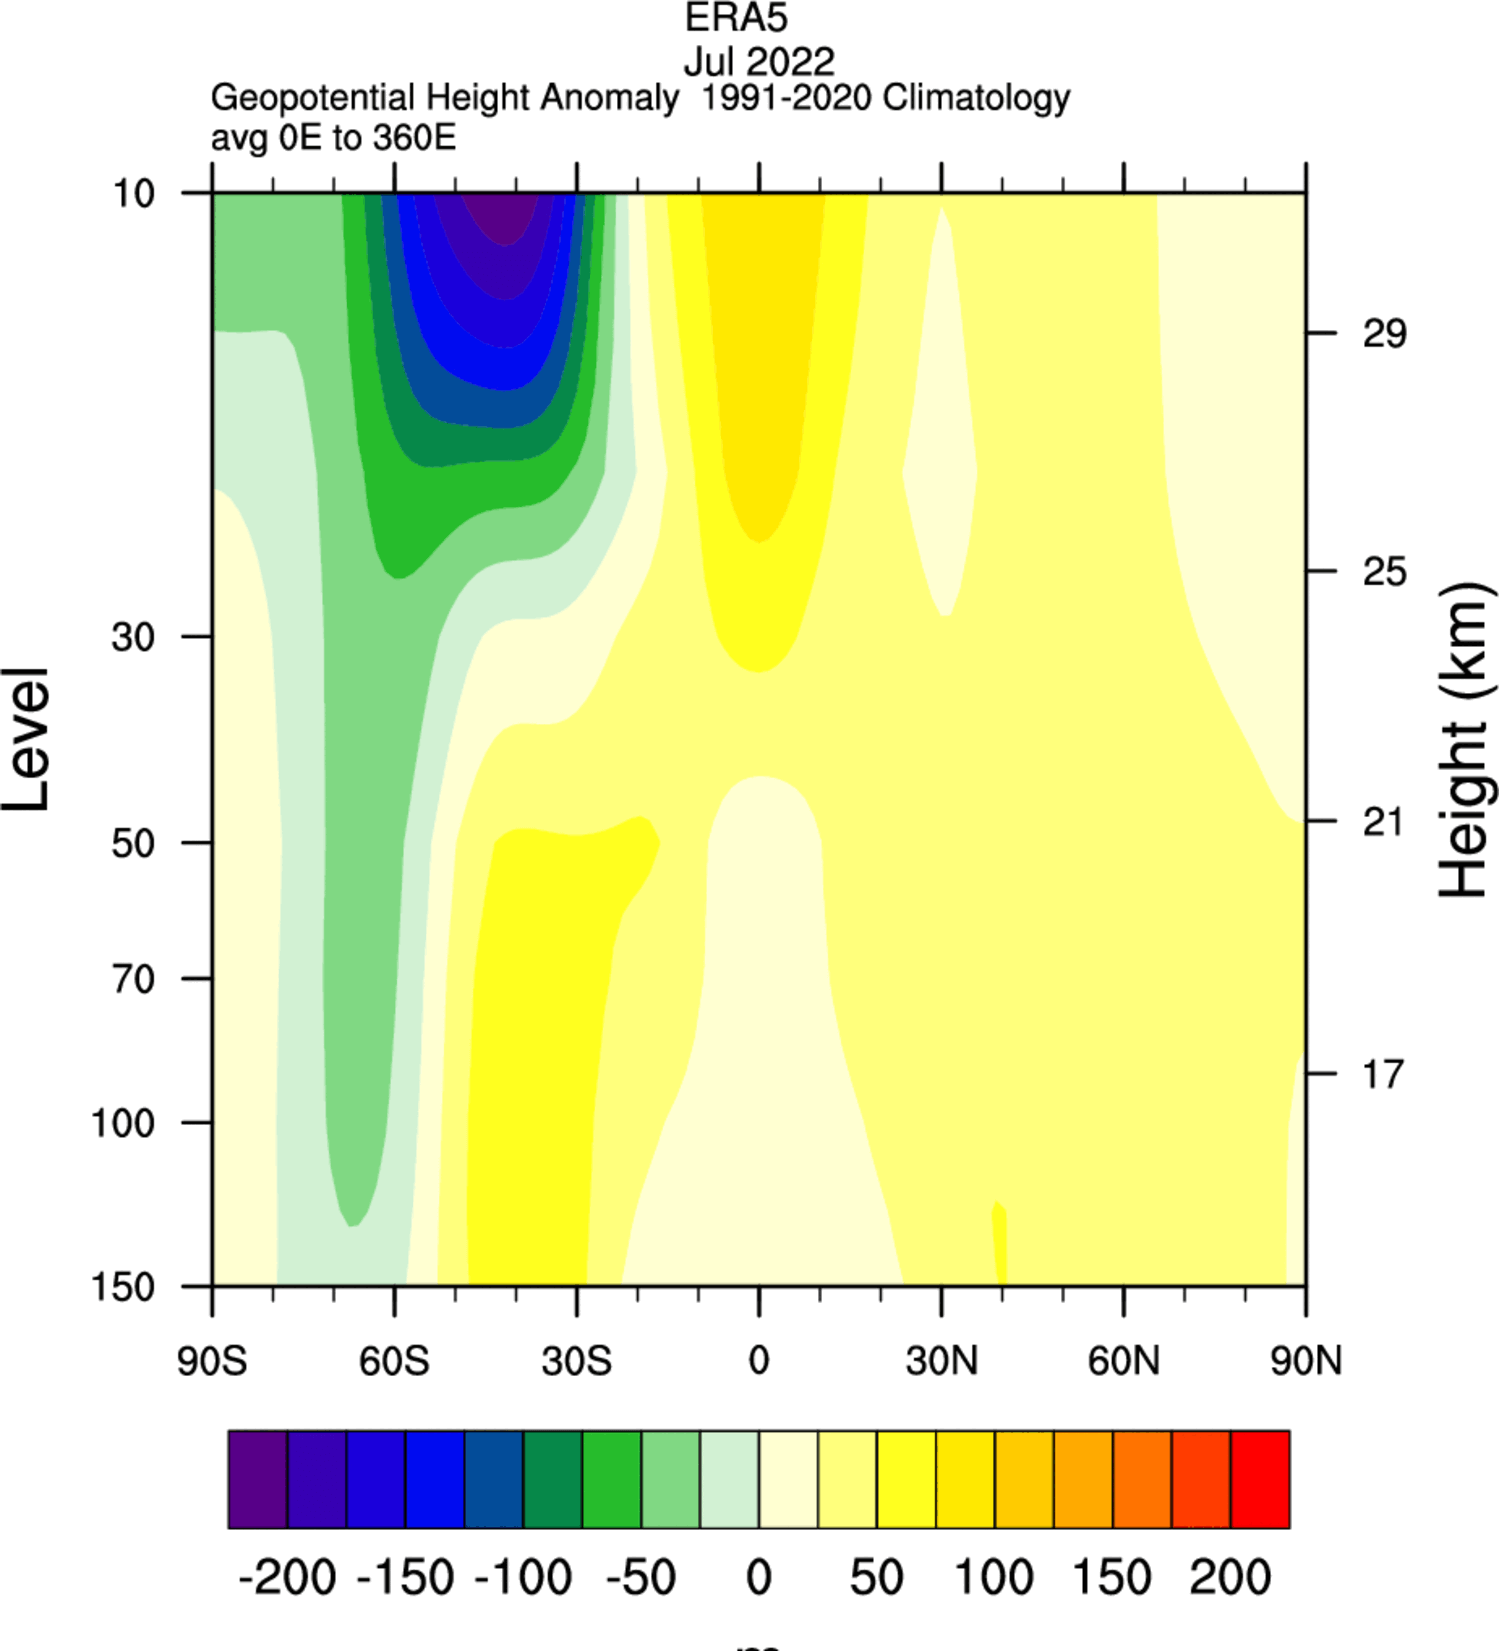
Looking at the same plot for pressure anomalies, you can also see the lower-than-normal pressure anomaly occurring with this cooling event in the vertical. It stands out globally, as the southern hemisphere is in the winter season.
And finally, the latest August analysis shows even stronger cooling. The cold anomalies are expanding further towards the south pole, starting to influence the polar vortex dynamics more directly.
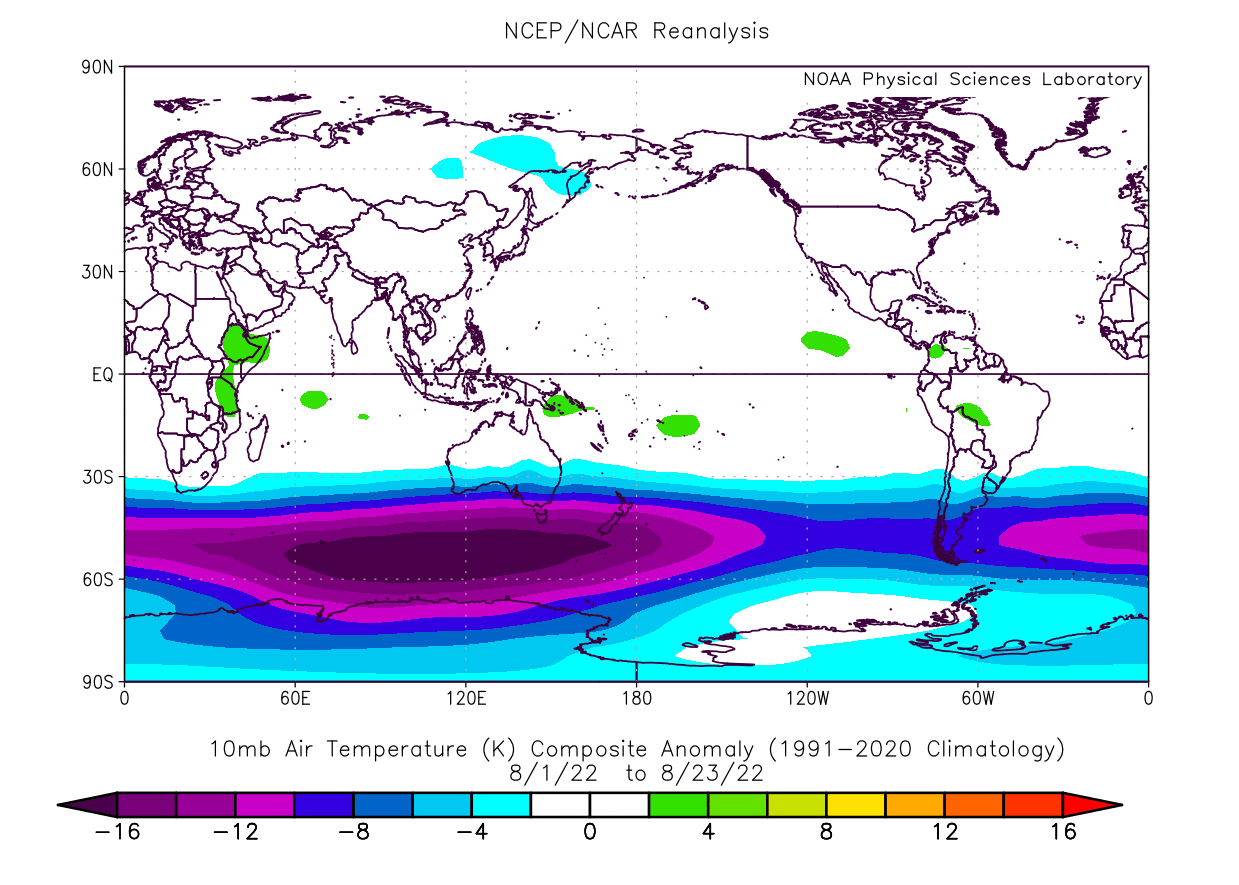
LATEST ANALYSIS AND FORECAST
The latest analysis shows the cooling anomalies connecting all the way into the polar regions. This makes most of the south stratosphere colder than normal. This is a somewhat expected result after such a strong injection of water vapor directly into the stratosphere.
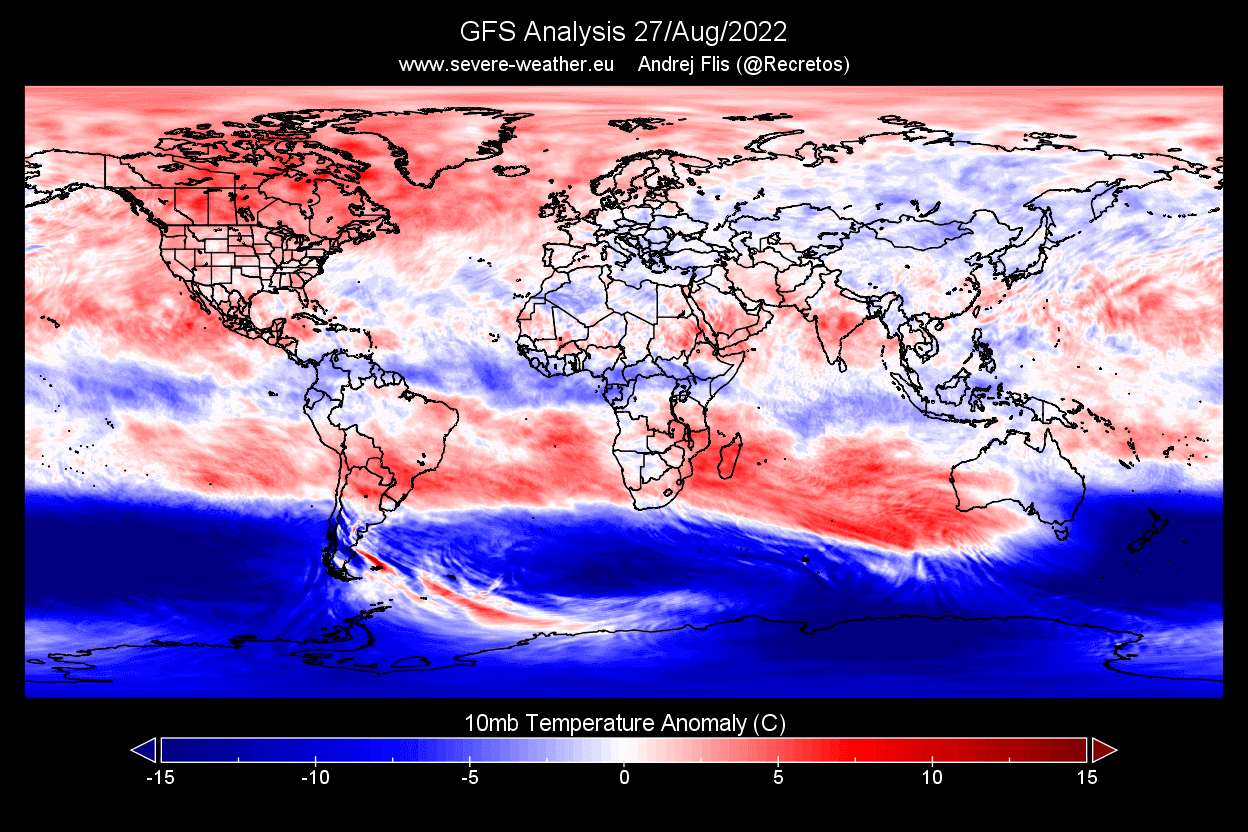
You can also see that on the latest vertical analysis. Most of the southern stratosphere is colder than normal, from the lower parts all the way into the mid and higher stratosphere.

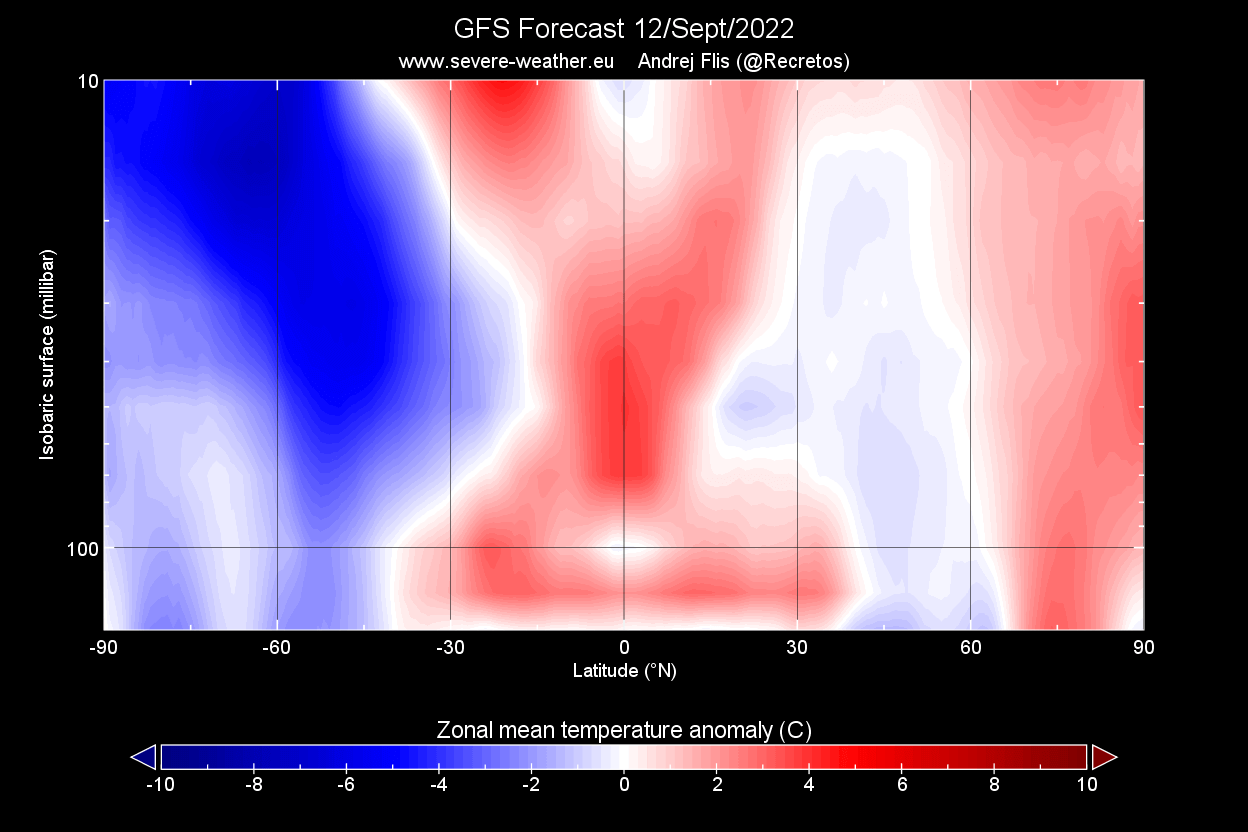
Going into September, the cold anomalies will continue over the southern stratosphere. As the polar vortex starts to weaken and the seasonal heating returns, it will be interesting to monitor the progress and the effects of the remaining water vapor.

Looking at the vertical anomalies for the same September forecast, we can see stable cold anomalies. This is likely to continue for several weeks, as the cooling effect will persist as long as the water vapor concentration is high enough.
SEASONAL WEATHER INFLUENCE
Of course, we all want to know how this will impact the global weather, especially (if at all) in the upcoming Winter 2022/2023.
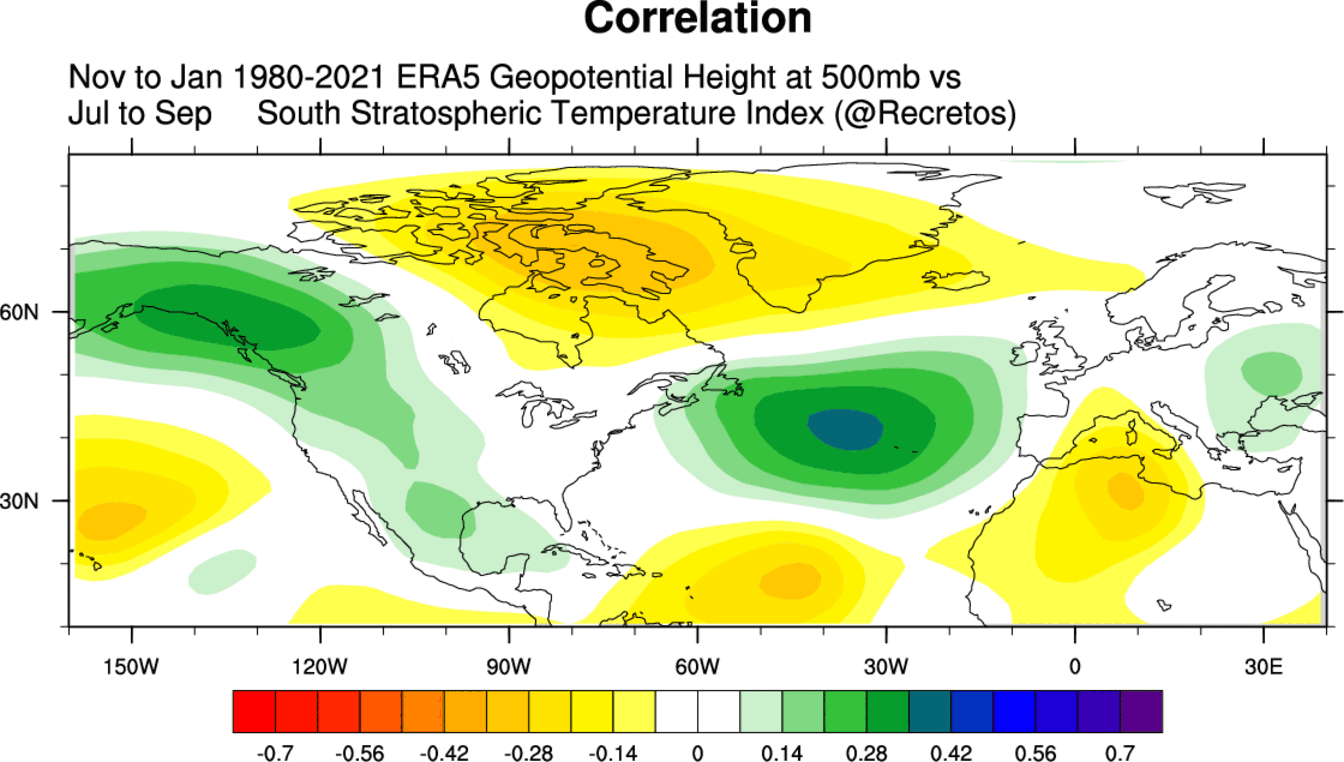
For this purpose, we have produced a simple July-September temperature index covering the stratosphere over the southern hemisphere’s mid-latitudes. You can see it below, having several warm and cold years.
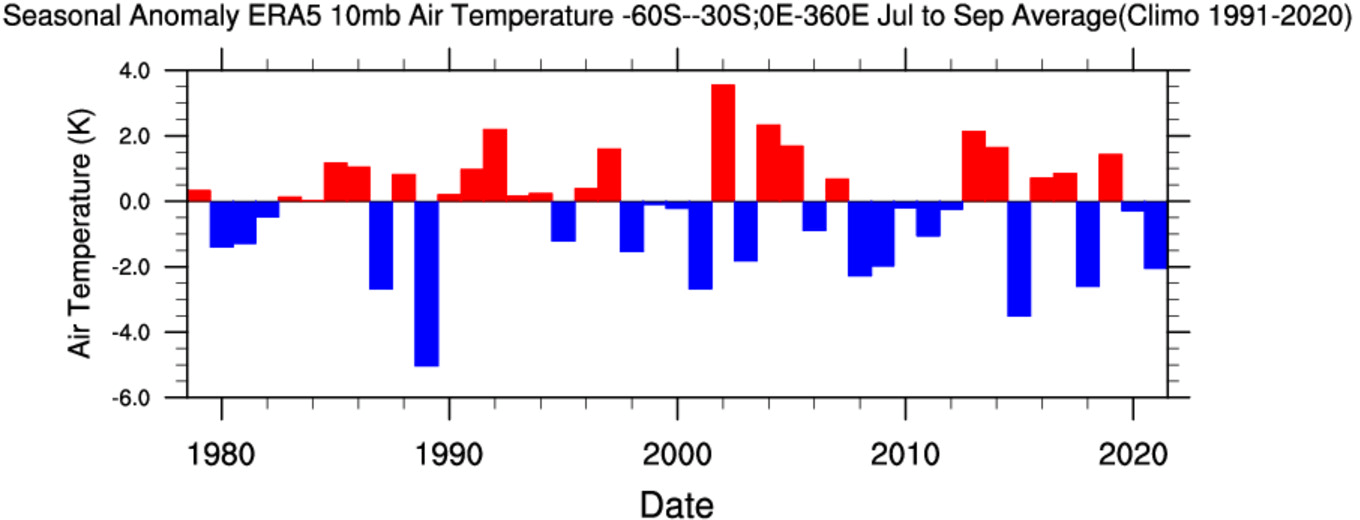
What we can do, is compare this changing index year-to-year with changing temperature and pressure patterns during the winter season in the northern hemisphere. This is called a linear correlation and simply compares the two parameters, revealing any potential connection.
There is one very important thing to add here. A correlation does not mean direct cause and effect, as there can be another background signal that can cause the same pressure anomaly pattern. More research is needed to confirm the stratospheric cooling weather response.
But we can still look at the basic data, trying to find a simple linear linkage between the stratospheric cooling and the winter weather.
We can see that on the image below, where an indicated response to the south stratospheric cooling would be a negative NAO pressure pattern. NAO stands for North Atlantic Oscillation and describes the pressure pattern affecting North America and Europe.
A negative NAO pattern means higher pressure over the north Atlantic and Greenland and lower pressure to the south. The image below shows the temperature pattern of a negative NAO winter season. You can see colder temperatures over the northern and eastern half of the United States and Europe.

If we look at the winter seasons following anomalously cold south stratospheric years, we can see a great example of a negative NAO pattern. High pressure over Greenland and lower pressure over the mid-North Atlantic.
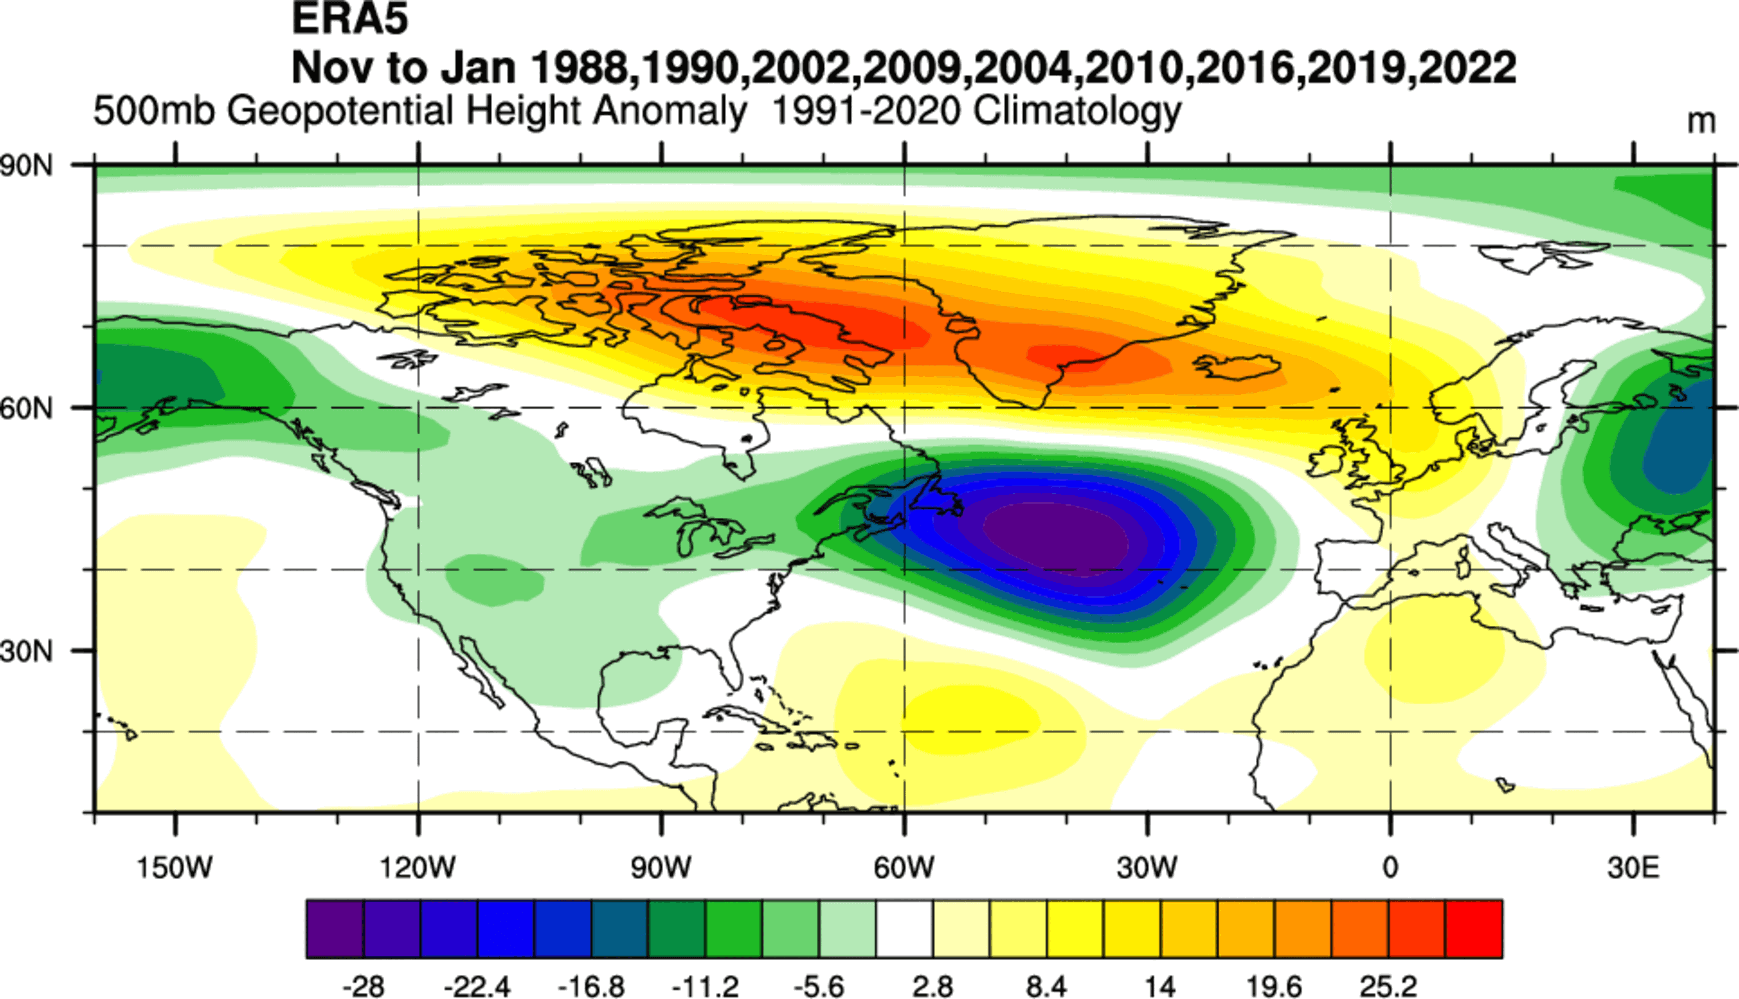
Of course, we have to add that this does not mean the stratospheric cooling was responsible for these patterns. Each year has other much more direct influences. But there is a hint or a statistical pattern between the south stratosphere and the northern Winter season.
WINTER SEASON STRATOSPHERE
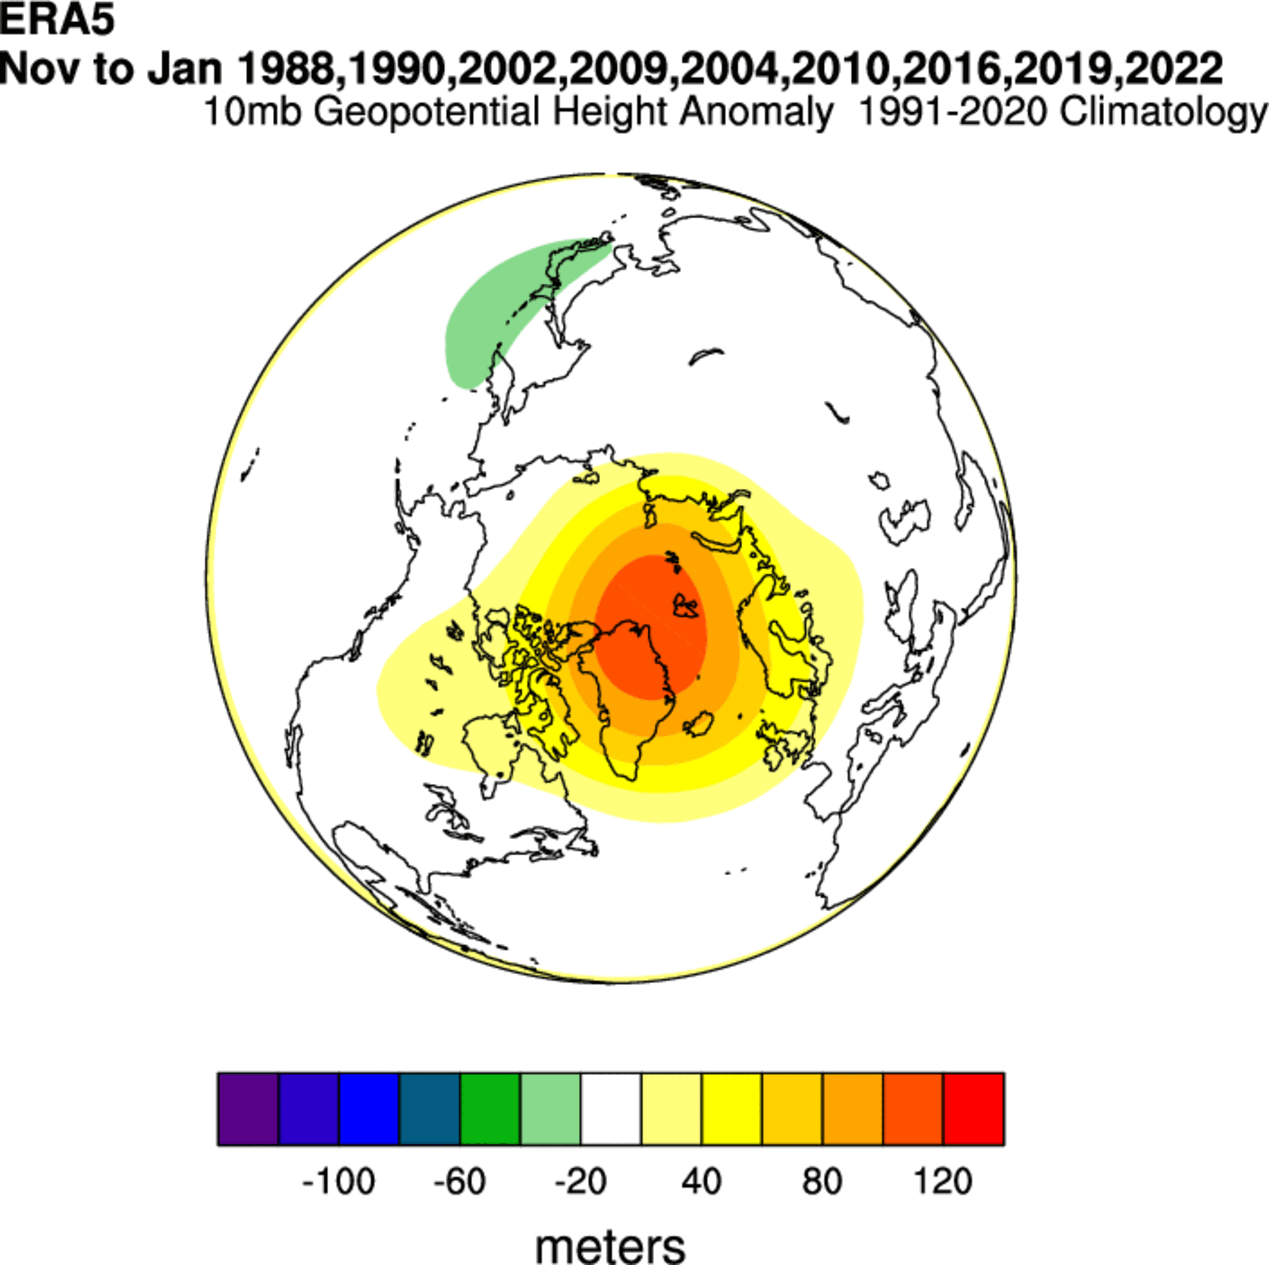
One area of linkage could be the stratosphere itself. If we look at the same years again, we can see that the corresponding pressure pattern in the northern stratosphere shows a weaker polar vortex. Positive pressure anomalies in the stratosphere can indicate a weaker polar circulation.
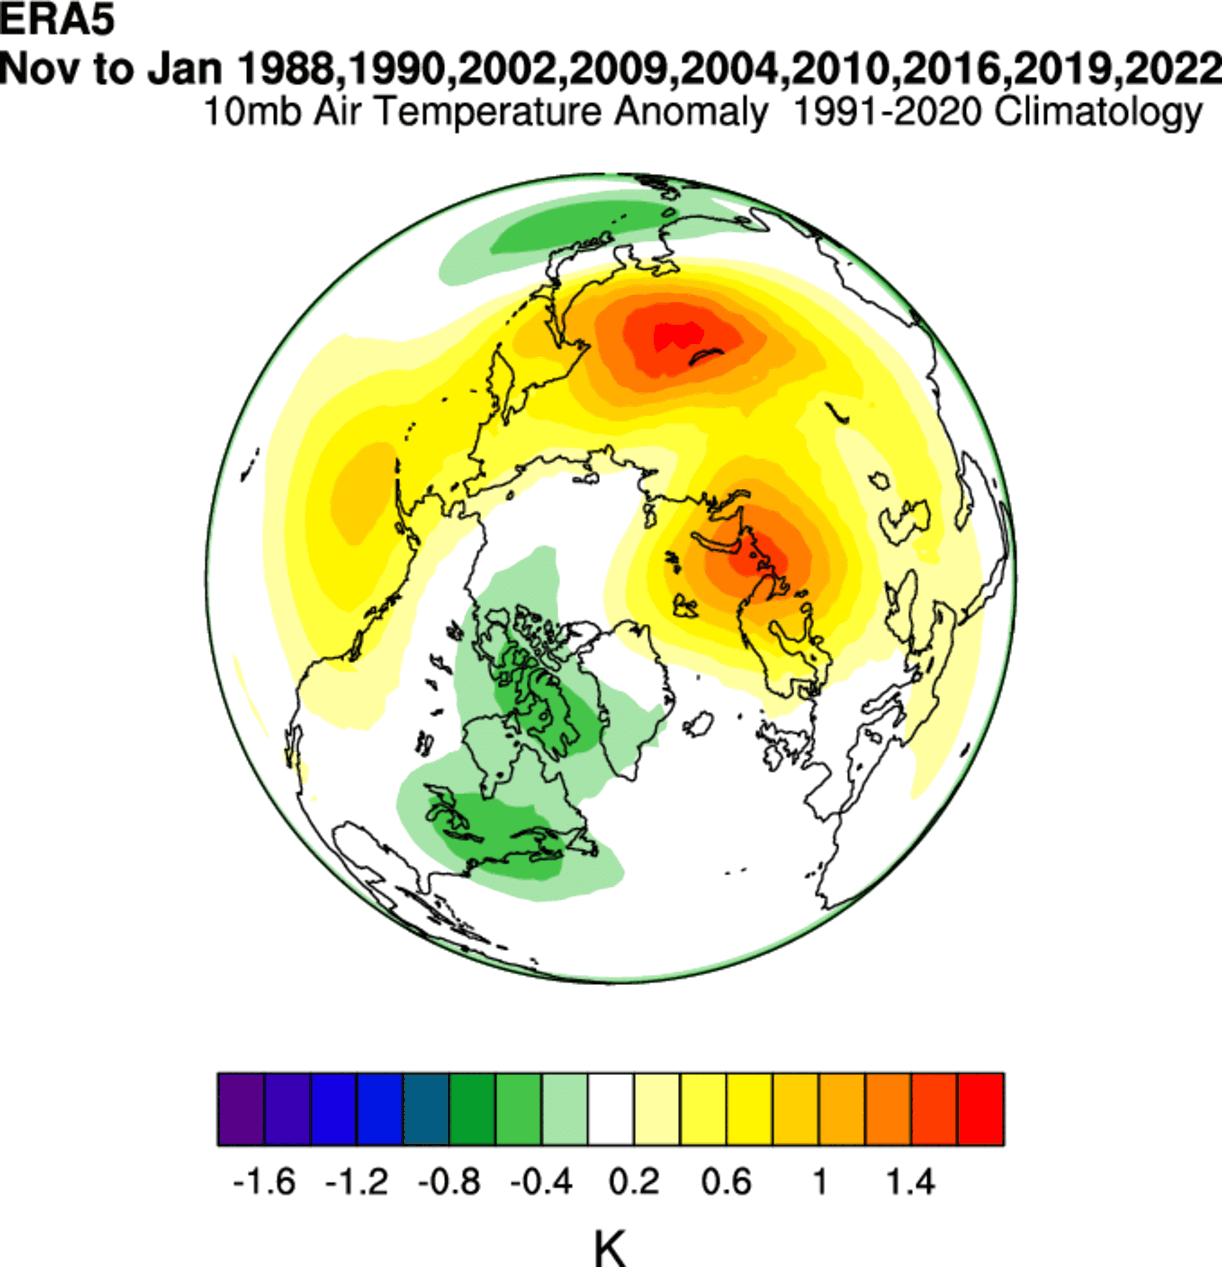
Also, looking at the northern stratospheric winter temperatures, we see warm temperature anomalies in the stratosphere in these winter seasons. This indicates a weaker stratospheric circulation, which can also mean a more disrupted jet stream pattern below.
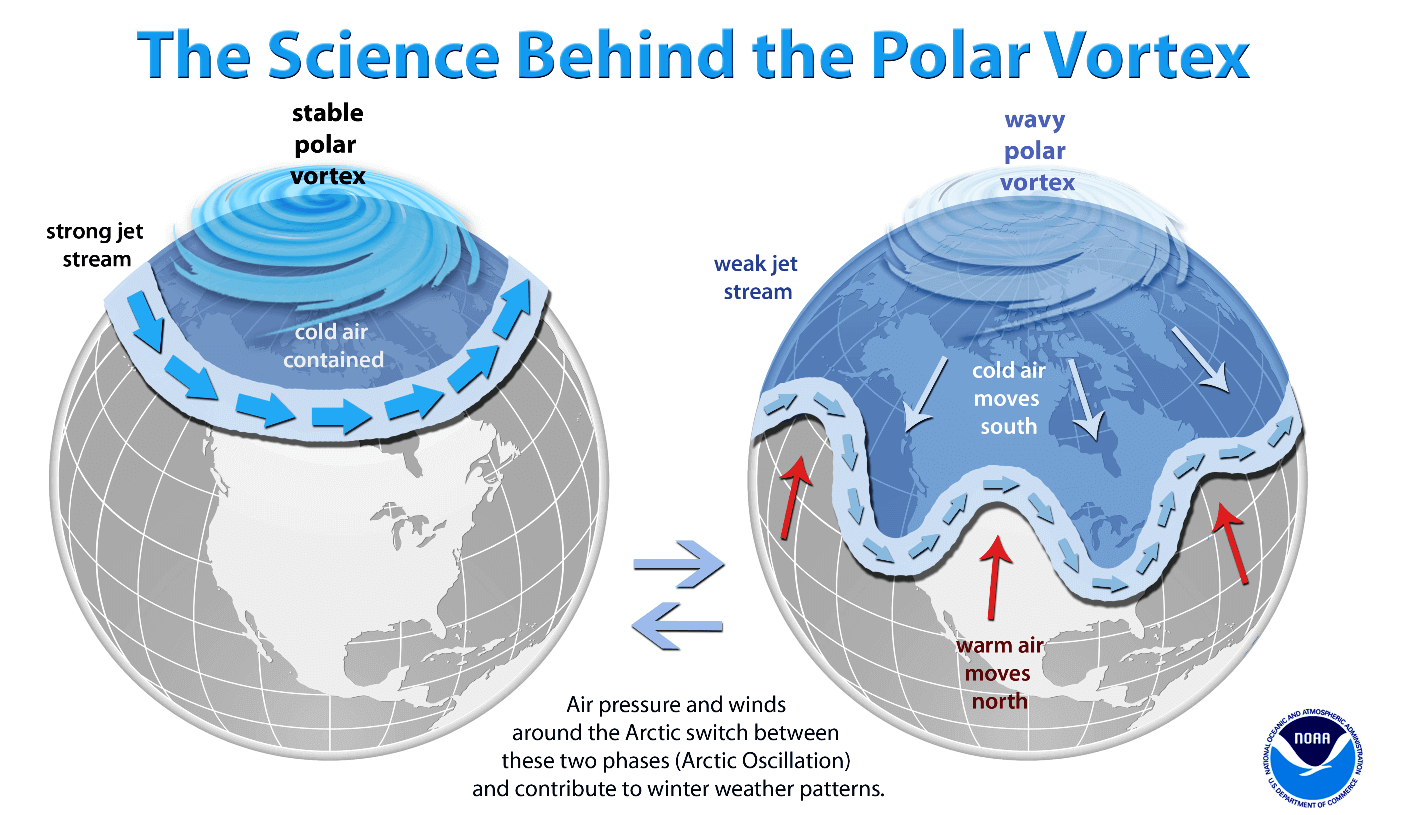
A strong Polar Vortex usually means strong polar circulation. This usually locks the colder air into the Polar regions, creating milder conditions for most of the United States and Europe.
In contrast, a weak Polar Vortex can create a weak jet stream pattern. As a result, it has a harder time containing the cold air, which can now escape from the polar regions into the United States and/or Europe. Image by NOAA.
The weak polar vortex events typically result from stratospheric warming events. These events can collapse the stratospheric polar circulation, heavily modifying the weather patterns below and creating a negative NAO pattern.
We get an interesting picture if we combine all Stratospheric Warming events and look at the weather 0-30 days following the stratospheric warming events.
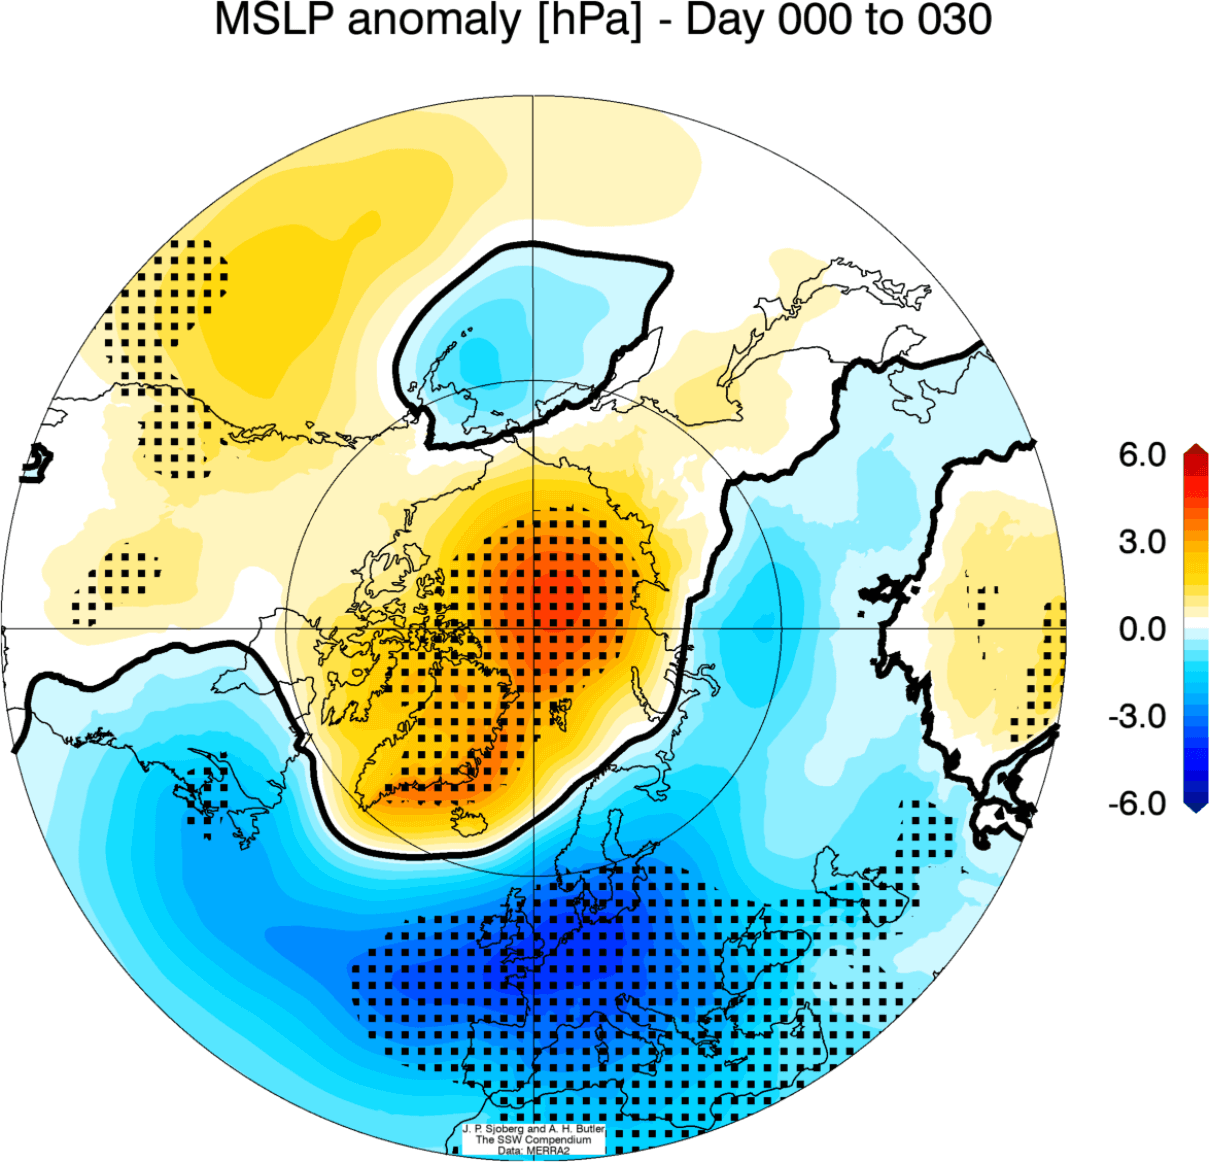
Below is the average pressure anomaly after a stratospheric warming event. It corresponds to a negative NAO pattern. This is a heavily disrupted circulation pattern that helps to create a free path for colder polar air to move out of the polar regions.
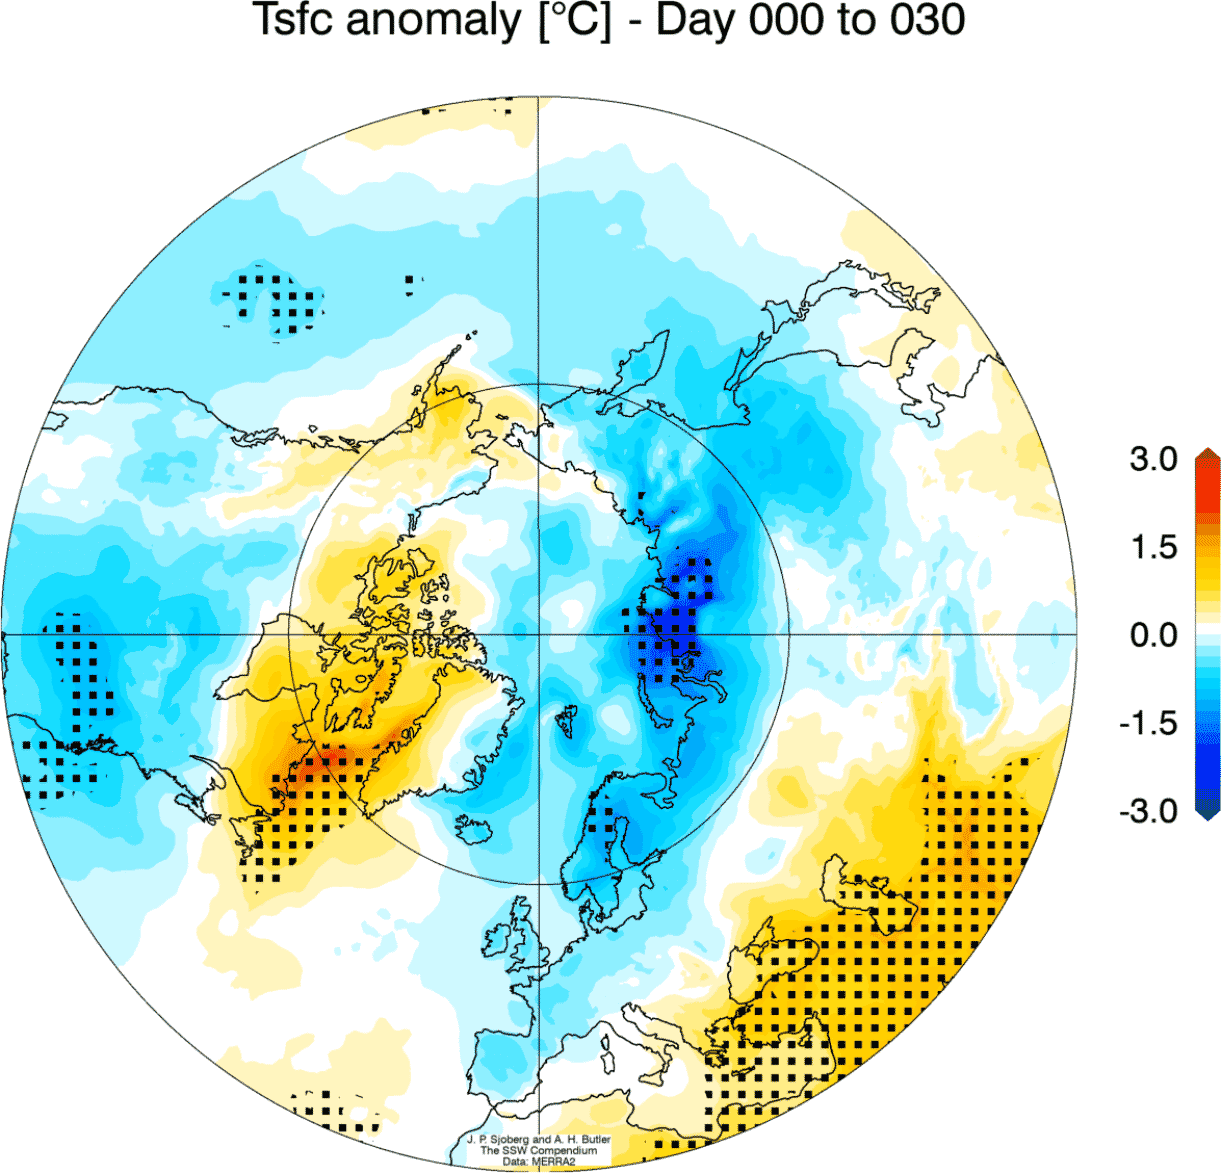
The corresponding average temperature 0-30 days after an SSW event shows that most of the United States are trending colder than normal, as is Europe. Note: this is an average picture of many SSW events. Each individual stratospheric warming event is different and does not automatically mean a strong winter pattern.
Looking at snowfall, we can see above-average snowfall over much of the eastern United States and also Europe. This is an expected response, as typically, after major stratospheric warming, the colder air has an easier path towards the south and into these regions.

SUMMARY
The January eruption of Hunga Tonga in the South Pacific has injected a large amount of water vapor into the stratosphere. That water vapor is now causing significant cooling of the southern stratosphere.
We looked at the historical data and found that there is a weak indication of the south stratospheric cooling, coinciding with later stratospheric warming events over the northern hemisphere. However, much more research is needed, as other background signals can be at play.
Stratospheric warming during the northern hemisphere winter can mean a heavy disruption of circulation. This causes pressure changes and can unleash cold air from the Arctic into the United States and Europe.
It would make sense for the changes in the stratosphere on the southern side of the planet could also impact the northern hemisphere. As the cooling in the southern hemisphere is substantial, the upcoming winter will be a great real-life “lab test” of the potential global weather changes.
We will release regular weekly and monthly updates for the upcoming cold season as fresh forecasts are produced. So make sure to bookmark our page. Also, if you have seen this article in the Google App (Discover) feed, click the like button (♥) there to see more of our forecasts and our latest articles on weather and nature in general.
SEE ALSO: