The latest snowfall predictions for the February-April 2025 period show that the recent burst of the La Niña will impact the weather patterns and snowfall over North America. A high-pressure system in the Pacific will define the weather patterns over the United States, along with a local Polar Vortex core over Canada.
We are now in the transitional period from late winter into early spring in the coming week. And in this period, we can usually expect a wide range of weather dynamics. Especially when it comes to snowfall and cold events.
One of the factors this season will be the influence of the oceanic La Niña event, which had a burst of life in recent weeks. In this article, we will look at snowfall predictions for the February-April period and the forces that help shape them.
LA NINA SPRING OVER NORTH AMERICA
One of the very important large-scale drivers of this winter season is the La Niña event in the tropical Pacific Ocean. It was getting stronger in the past weeks, and is expected to affect the weather patterns over the United States and Canada.
In the image below, you can see the latest ocean temperature anomaly across the Pacific. Notice the colder than normal surface waters in the tropical Pacific regions. That is a La Niña event, spanning far across the central and western equatorial Pacific Ocean, powered by the trade winds.
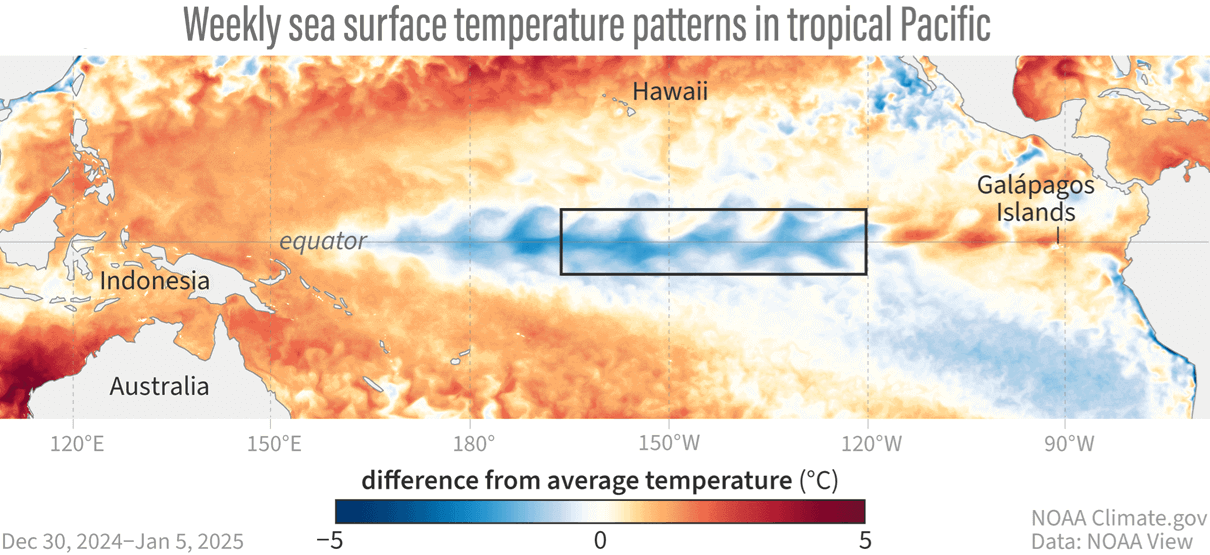
La Niña is a name for cold ocean temperatures in the tropical Pacific Ocean. The actual ocean-atmosphere system is called ENSO (El Niño Southern Oscillation). This region in the tropical Pacific Ocean alternates between cold and warm phases.
Below is a video of the official weekly ocean analysis. As you can see, the negative anomalies have strengthened across the tropical Pacific in the past month, right across the main ENSO region.
In the image below, you can see the average position of the jet stream during La Niña winter seasons. Also, you can see the resulting weather patterns over the United States and Canada as the polar jet stream takes a different path under the influence from the Pacific.

The shifted La Niña jet stream brings colder temperatures and storms into the northern and northwestern United States. But it generally creates warmer and drier weather in the southern and eastern states.
This way, the jet stream can divide the United States into two weather poles. In the northern part of the country, colder and wetter events are more frequent, as the jet stream directions the storm systems and cold weather there.
Because we have a weak La Niña this season, we will look at the snowfall patterns during a weak La Niña event for January-March. You can see above-average snowfall across much of the northern United States and southern Canada. Peak snowfall is usually across the higher elevations of the Pacific Northwest.
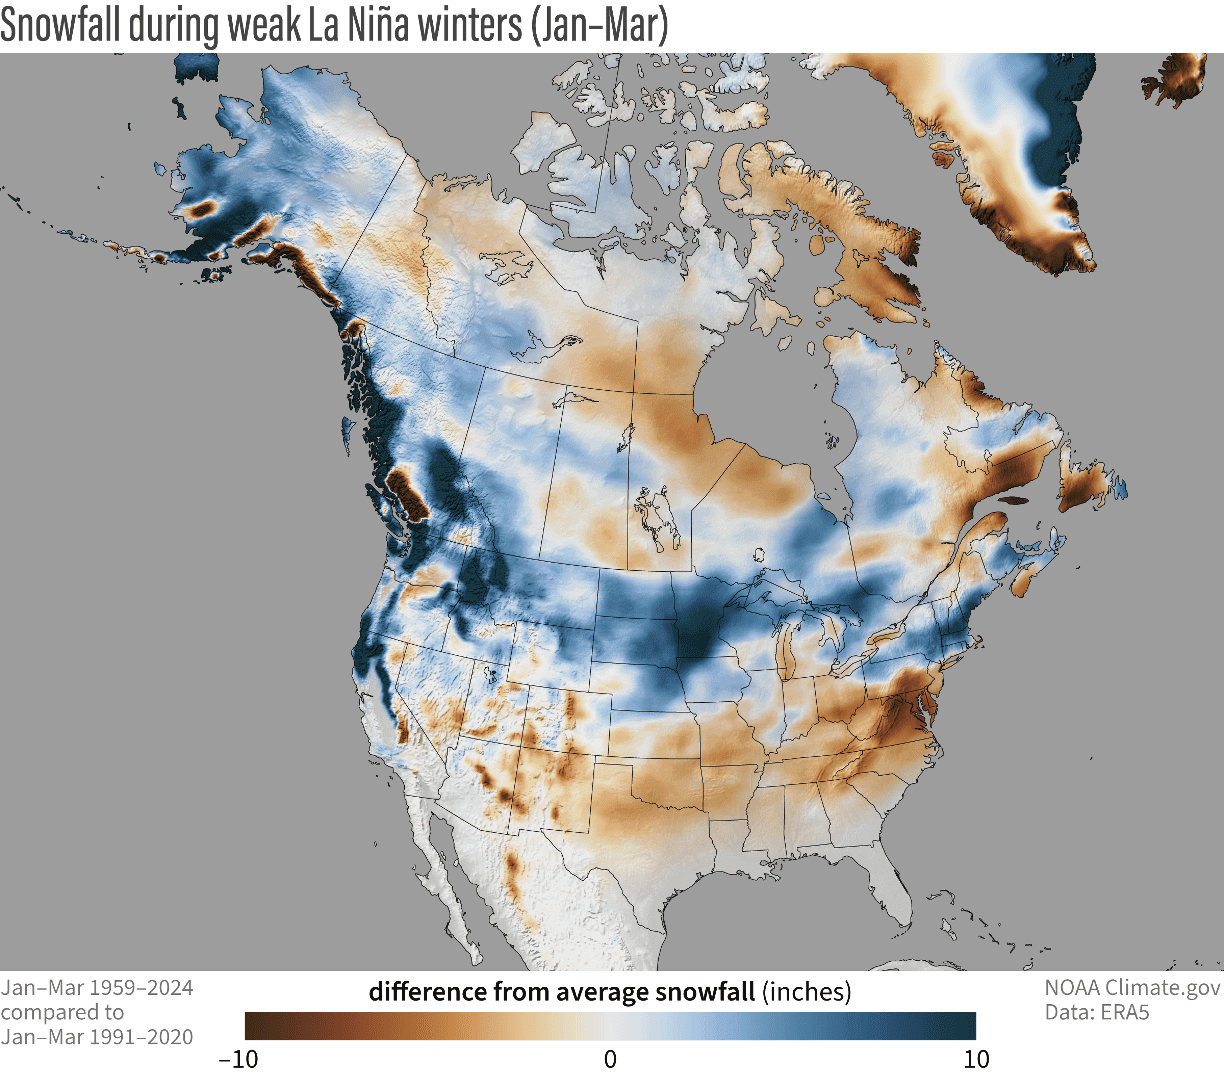
You can see that the north-central U.S., including the Dakotas, Nebraska, and Minnesota, had a snowier winter during weak La Niña years. There is also more snowfall across the northeastern United States but less over the southeastern U.S..
We can first look at the February snowfall predictions, which is also the final month of the meteorological Winter season.
THE WINTER 2025 FINALE
Towards mid-February, the forecast shows a large mass of cold air spreading across the United States and southern Canada. We talked about how the Polar Vortex is behind this cold outbreak, and we will link our article at the bottom. This cold airmass will increase the snowfall potential across a large part of the United States and over Canada.
Looking at the latest 15-day total snowfall forecast from ECMWF, you can see a large area of snowfall coverage. You can see an especially large swath of snowfall from the Midwest up into the northeastern United States and southeastern Canada.
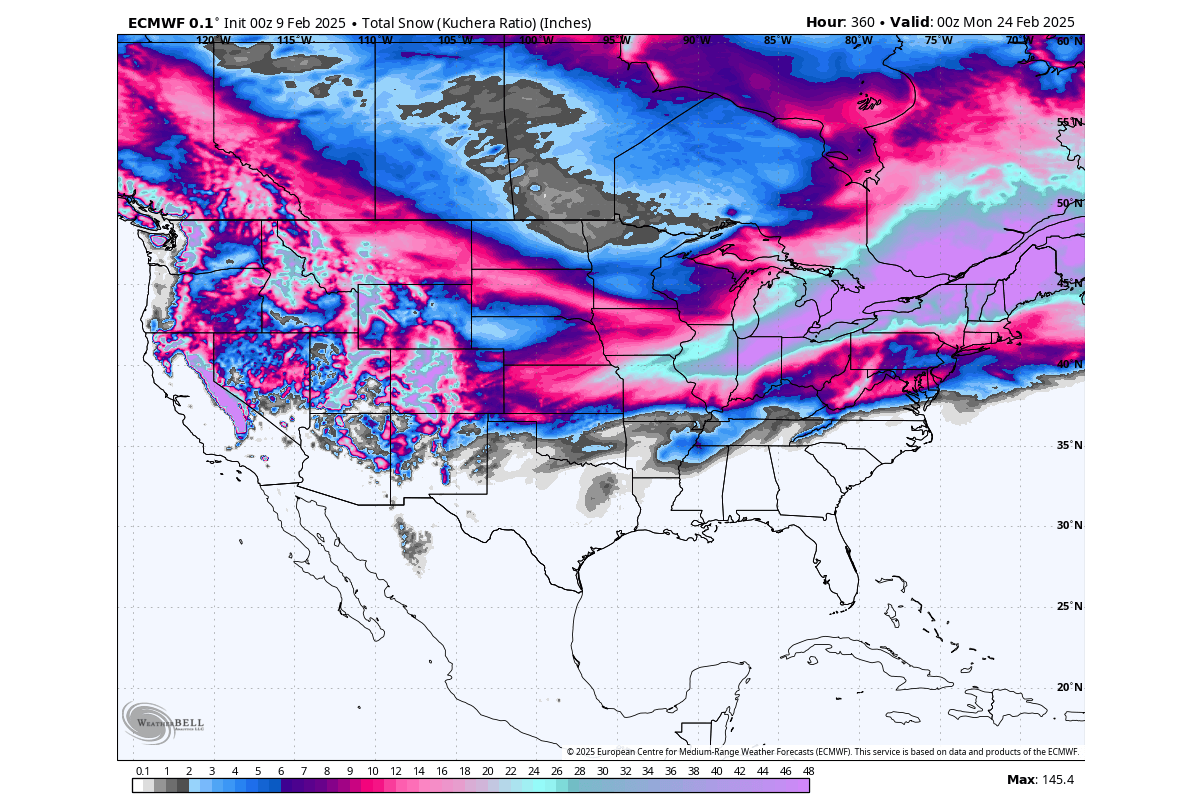
The forecast shows snowfall also reaching far west and far south, covering the central Plains and parts of Texas and Oklahoma. This is shaping up to be quite a significant snowfall event. But this is just one single-run forecast, so we will look at one more model to better understand a possibly different scenario.
The second model is GFS from the U.S. NCEP center. It actually shows a very similar snowfall scenario for the next two weeks. We see a maximum snowfall area developing for the northeastern U.S. and southeastern Canada, with a large area also back towards the western and central United States. This model also shows parts of Texas and Oklahoma getting some snowfall.

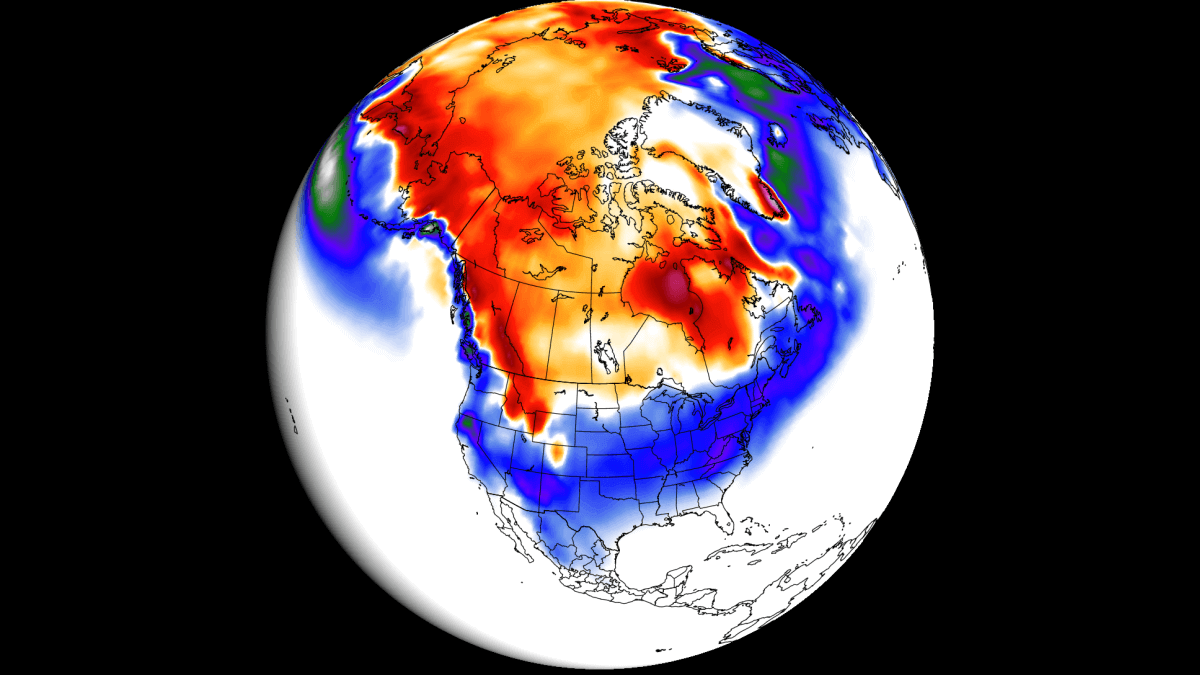
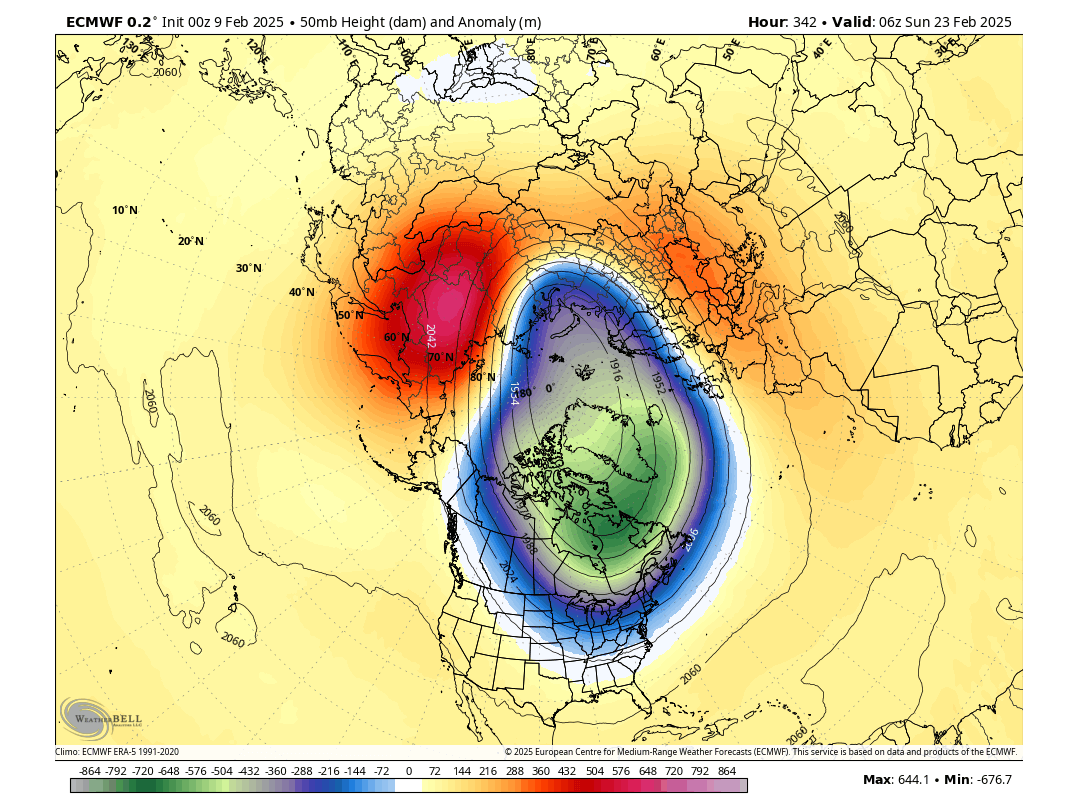
Going deeper into the second half of February, we will see continued influence from the Polar Vortex in the stratosphere. In the image below, you can see the pressure forecast in the lower stratosphere. You can nicely see the Polar Vortex at this level being displaced towards eastern Canada and the eastern United States, influencing the weather patterns below.
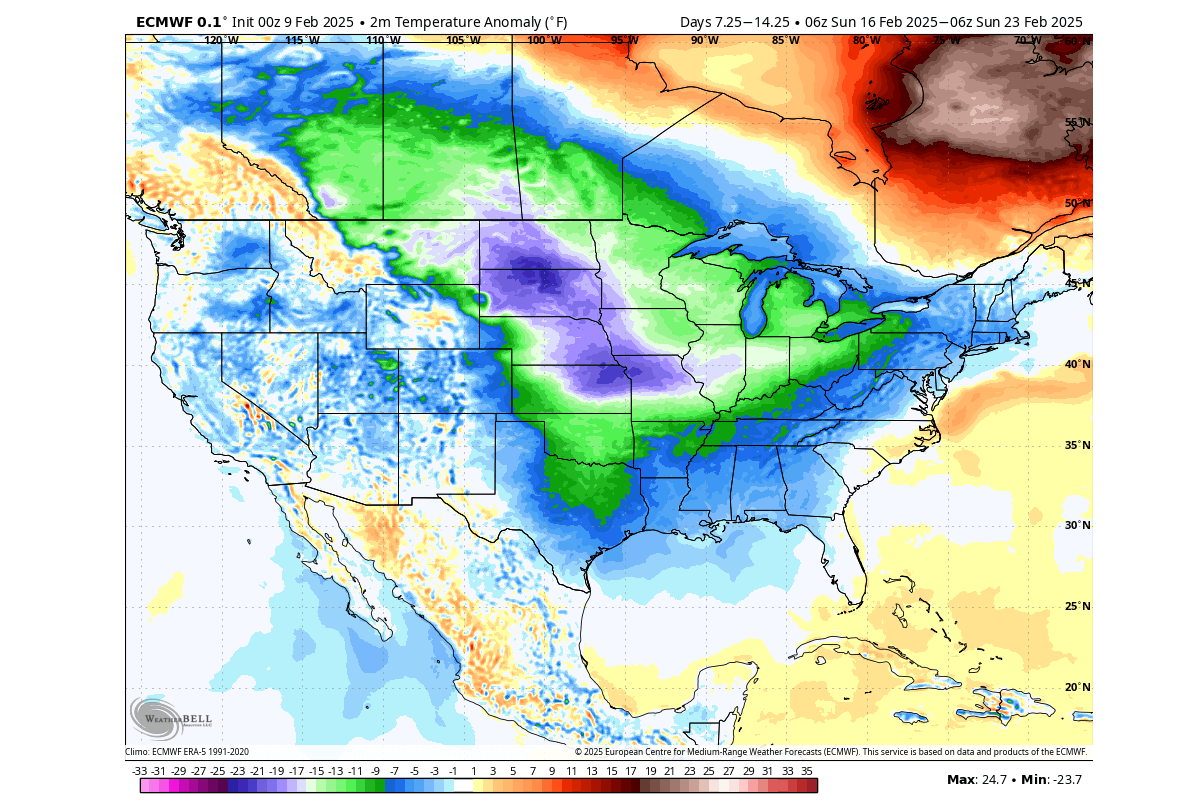
Below is the temperature forecast trend for the last week of February. You can see colder air over the eastern half of the United States and some cold anomalies over the northwestern U.S. Whole of Canada and the southwestern U.S. will be warmer than normal. At the same time, a northerly flow of the Polar Vortex is forecast to cool down the eastern United States.

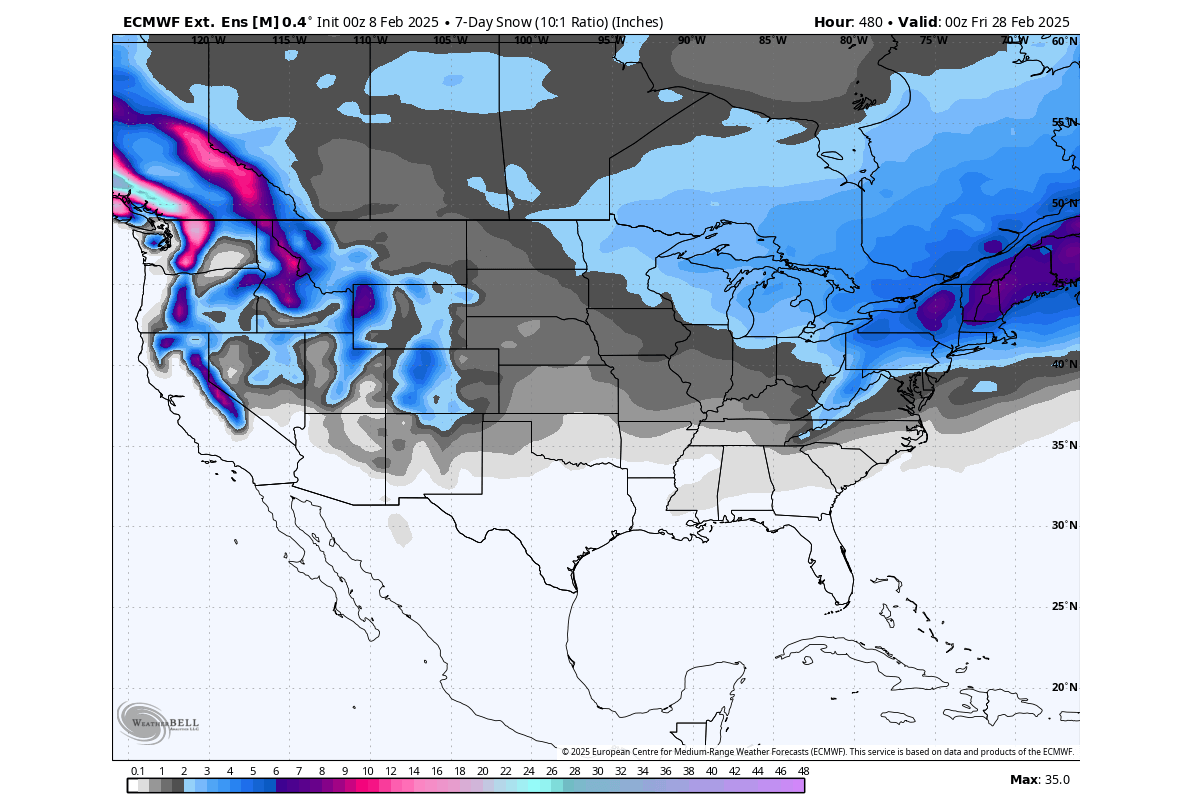
This, of course, affects the snowfall potential. The ensemble snowfall forecast shows the main potential in the final week remaining over the northwestern U.S., the Midwest, and the northeastern United States. We must add that this is just a preliminary trend for now.
But with the first day of March, the meteorological Spring begins, and we very often see the snowfall season continuing into March.
NORTH AMERICA EARLY SPRING SNOWFALL
The pressure forecast trend below for mid-March indicates a typical La Niña high-pressure system in the North Pacific. A Polar Vortex core sits over Canada, enabling colder air to pool up over western Canada, with a northerly flow ready to push the colder air down into the United States.

But in Spring, the southern ridge starts to get stronger, so together with La Niña and the Polar Vortex over Canada, we usually see an early onset of warmer temperatures over the southern United States and up the East Coast.
We can see this in the temperature forecast for mid-March below. The forecast hints at colder-than-normal surface temperatures over the western and northeastern United States, Midwest, and western Canada.

Despite being forecast warmer than normal, the central parts of the United States still tend to get occasional colder weather and snow in early Spring. But mostly warmer than normal temperatures are forecast over the far southern United States and across the lower half of the East Coast.
In total, these patterns affect the snowfall potential in early Spring. We do not have a proper snowfall anomaly forecast from the ensembles above. But we do have the monthly forecast from the long-range model.
Looking at the March seasonal snowfall forecast, the long-range model shows more snowfall over the northern United States and Canada. But while this is the monthly average, we did see in the ensemble forecast above that current mid-March trends call for a snowfall potential increase over the western U.S. and the Midwest and Northeast.

In contrast to the ECMWF, we often use the UKMO model. This way, we can compare results, and if both models show a similar forecast, that raises confidence in the accuracy of the forecast.
UKMO shows a strong snowfall anomaly over the northwestern United States, with more snowfall over the upper Midwest and the far northeastern United States. It shows less snowfall across the Plains and the eastern United States.

These long-range forecasts were released some time ago, and the new data is not yet available. So since then, the snowfall potential has increased in the other medium-range forecasts across the parts of central and eastern United States for mid-month.
APRIL 2025 LONG-RANGE SNOWFALL
One more month already in the long-range model predictions is April 2025. We can look at some early trends and indications if the snowfall season will have an early end or if we could see a bit longer snow season over the U.S.
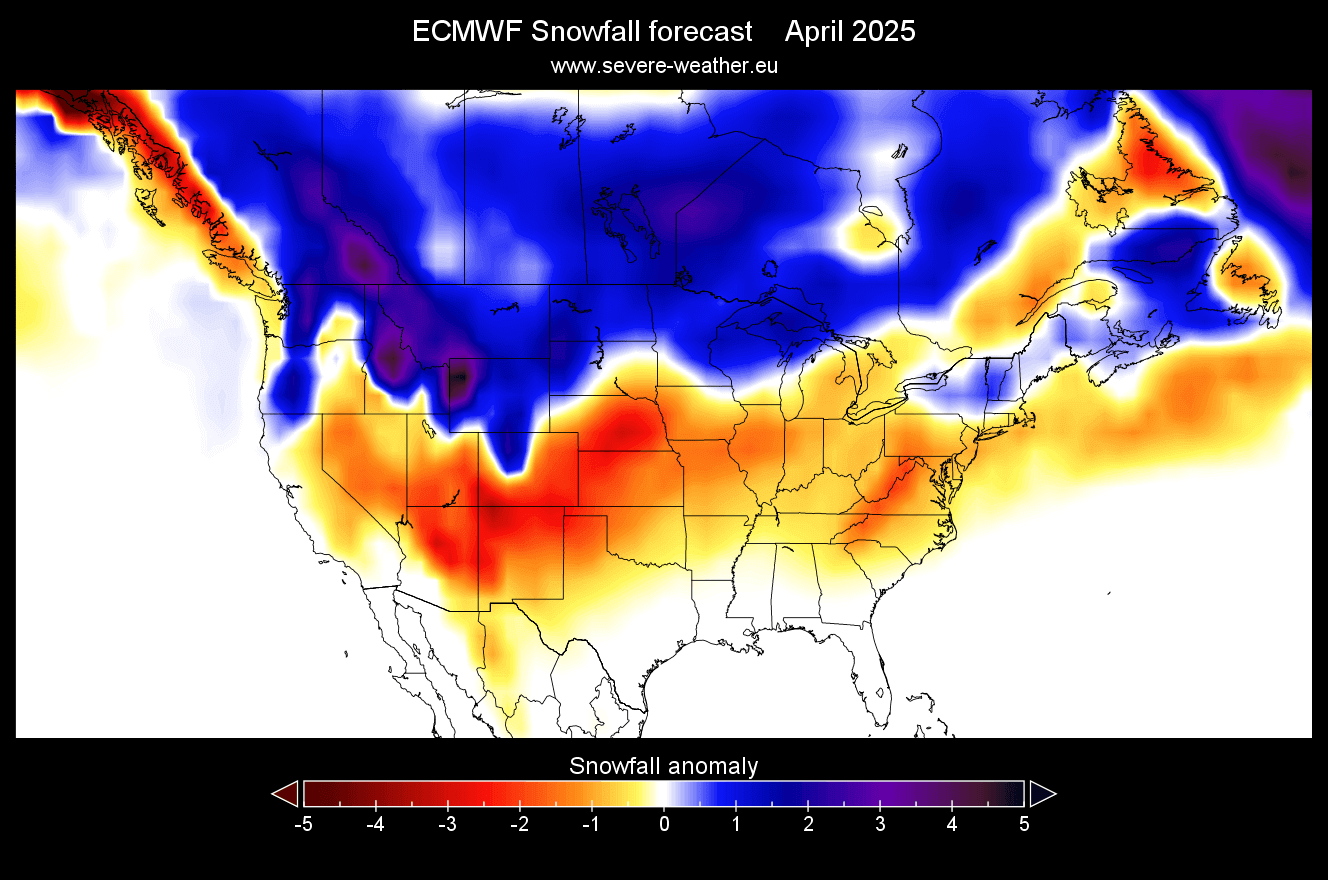
The ECMWF long-range prediction for April actually shows more snowfall than normal over the northern parts of the United States, the upper Midwest, and the northeast. This is likely the impact of the La Niña, which tends to increase the Spring snowfall potential over the northern parts of the United States.
We also have the UKMO snowfall data for April, and it shows a large area of above-normal snowfall over the northern and northwestern United States, upper Midwest and southern Canada. But compared to the previous model, we see less snowfall over the northeastern and central United States.

Less snowfall than normal is also forecast for the southern half of the United States, but snow events are not as common in the southern half of the United States as we get deeper into Spring.
OFFICIAL WEATHER OUTLOOK
Below is the official February-April temperature outlook for the United States from CPC. It shows the temperature probability, with colder to equal chances in the northern United States. The southern half of the country and the east are forecast with a higher probability of warmer than normal weather, similar to the models above, apart from the northeastern U.S.

You can also see an area of equal probability covering the central United States. That indicates the likely path of cold air during cold fronts originating from the northwestern United States and western Canada. This gives the best snowfall chance to the northern United States, the Midwest, parts of the central United States, and the northeast.
The official precipitation forecast is also quite similar to the model forecast. We see an equal-to-higher probability for more precipitation in the eastern United States across the Ohio Valley and the Pacific Northwest. This also shows the snowfall potential, as you need moisture and precipitation for snow, not just cold air.

The Pacific Northwest, Midwest with the northeastern United States and parts of the central U.S. have the best chance of late-winter early-spring snowfall event. On the other hand, the southwestern United States is forecast to have a drier-than-normal season in the next three months.
We will keep you updated on the developing weather trends in the coming seasons, so bookmark our page. Also, if you have seen this article in the Google App (Discover) feed, click the like button (♥) there to see more of our forecasts and our latest articles on weather and nature in general.
The main forecast images in this article are from weatherbell maps using a commercial license.
Don’t miss:
Intense twin winter storms graze across the central and eastern United States this week