Meteorological Winter 2024/2025 has already begun, so we will look at the latest forecast data for the whole Winter season over Europe. December will bring near-normal temperatures to central and western parts, while long-range data shows better potential for mostly February.
The global weather system has many large-scale and small-scale driving factors. The main factor this year will be a weak La Niña event in the Pacific, but it is not a direct influencing factor for Europe.
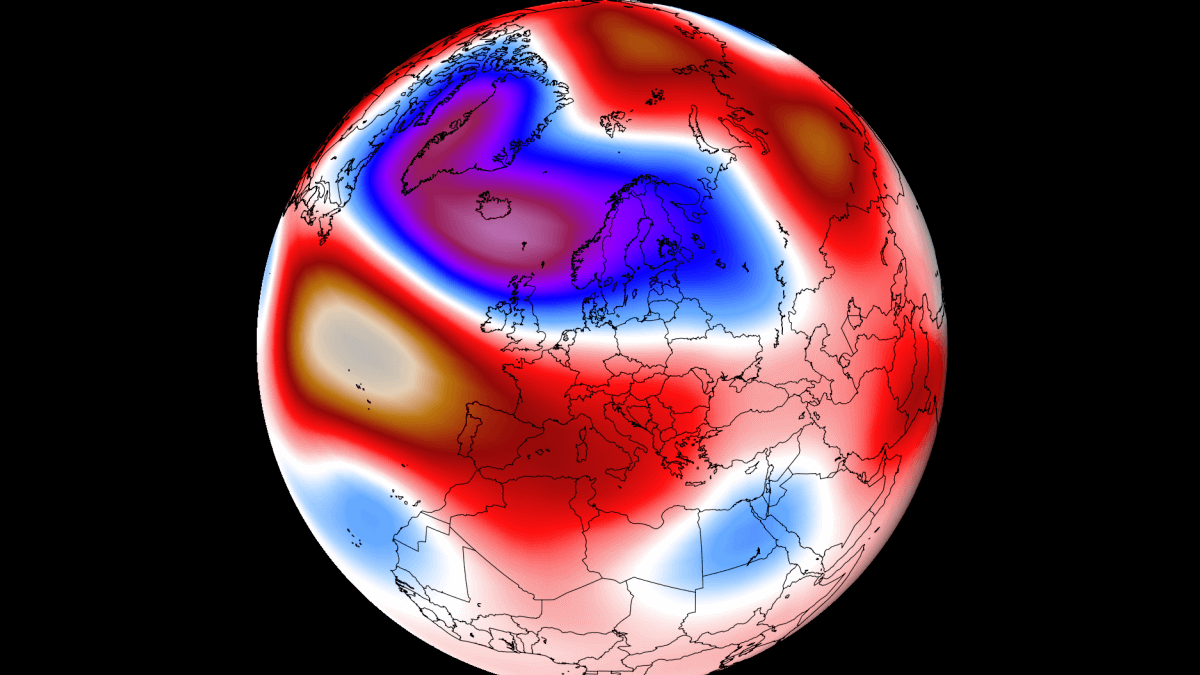
Below is an example of the general idea of the Winter pressure pattern. A low-pressure area over North Atlantic and northern Europe, with a high-pressure system over western, central, and southern Europe. This is just a multi-model seasonal average, and we will look closer at the solutions individually.
LA NINA AND EUROPE
La Niña is a cold phase of the large and powerful oceanic ENSO oscillation. It is a region of the tropical Pacific Ocean that shifts between cold and warm phases.
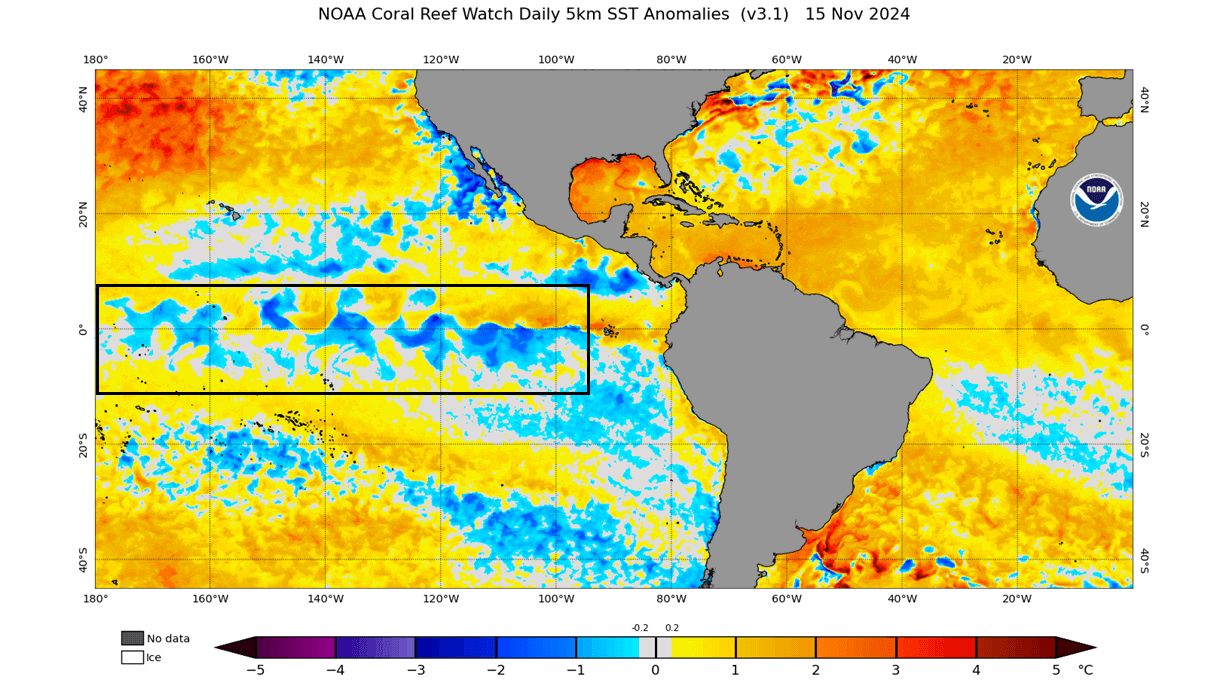
Below is the mid-November ocean anomaly analysis. It shows colder-than-normal surface waters in the central and eastern ENSO regions associated with a developing La Niña. These cold anomalies have a “wave-like” shape because of the strong easterly trade winds that push the waters westward.
Below is an analysis/forecast image from NMME, where you can see the ocean temperature drop starting early in spring. Negative anomalies and cooling are forecast to continue into the Winter of 2024/2025, but the forecast average shows a weak La Niña event this season.

The image above shows that even in early spring, the ocean anomaly was still above normal but began cooling rapidly. We produced a high-resolution video (below) from NASA data that shows this transition of ocean anomalies in the tropical Pacific.
La Niña usually creates a high-pressure system over the North Pacific. That promotes the development of a low-pressure region over Alaska and western Canada and shifts the jet stream downwards in between the two pressure systems. That impact the pressure anomalies further downstream over the Atlantic and eventually Europe.
The image below shows the average pressure pattern during the La Niña winters in the past 40 years. You can see a strong high-pressure system in the North Pacific and a low-pressure area over Canada and the northern United States. Europe also shows lower pressure than normal across the central and southern parts.
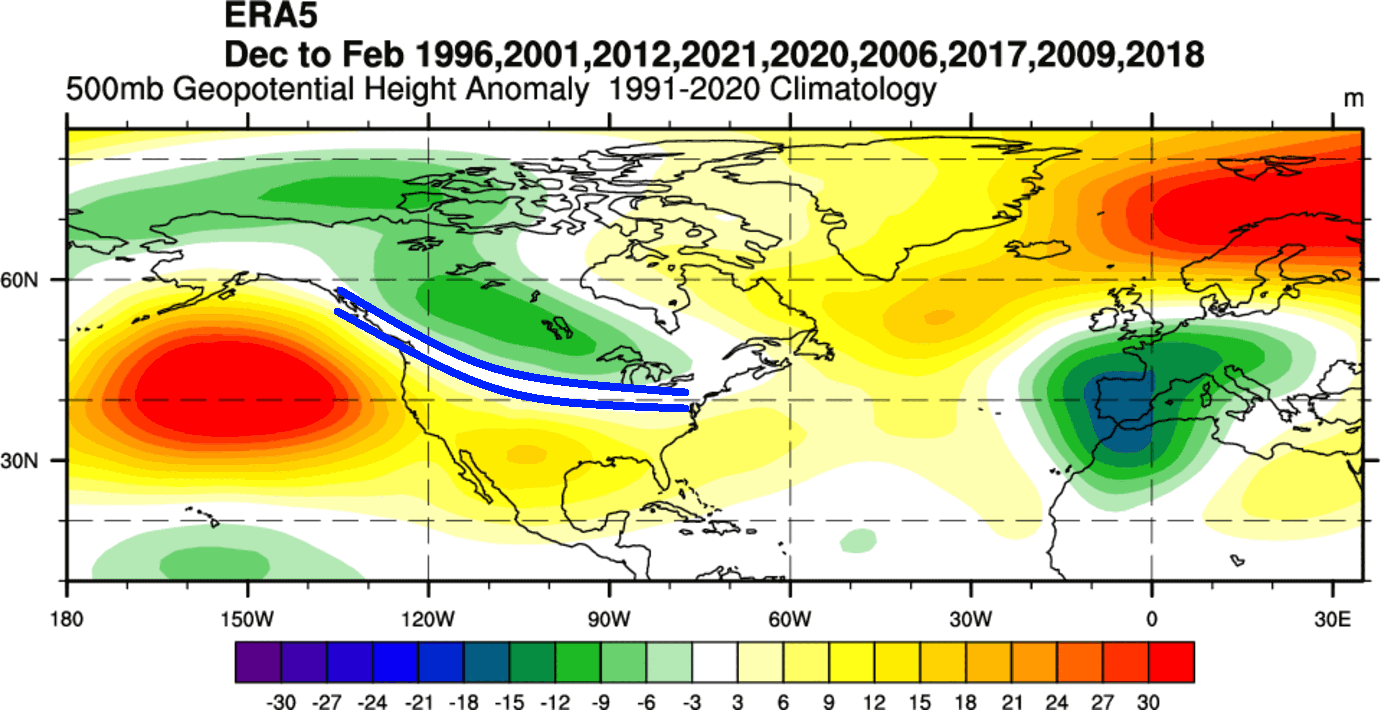
A strong high-pressure system in the North Pacific starts the development of a low-pressure region over Alaska and western Canada. That curves the jet stream downwards between the two pressure systems, marked by the blue lines.
The connection between the ENSO regions and Europe is much more complex and noisy, as the source ENSO region is further away and has the North Atlantic influence in between. Still, we can look at some signals that can be found in the data, but it is not a clean signal, just a simple correlation.
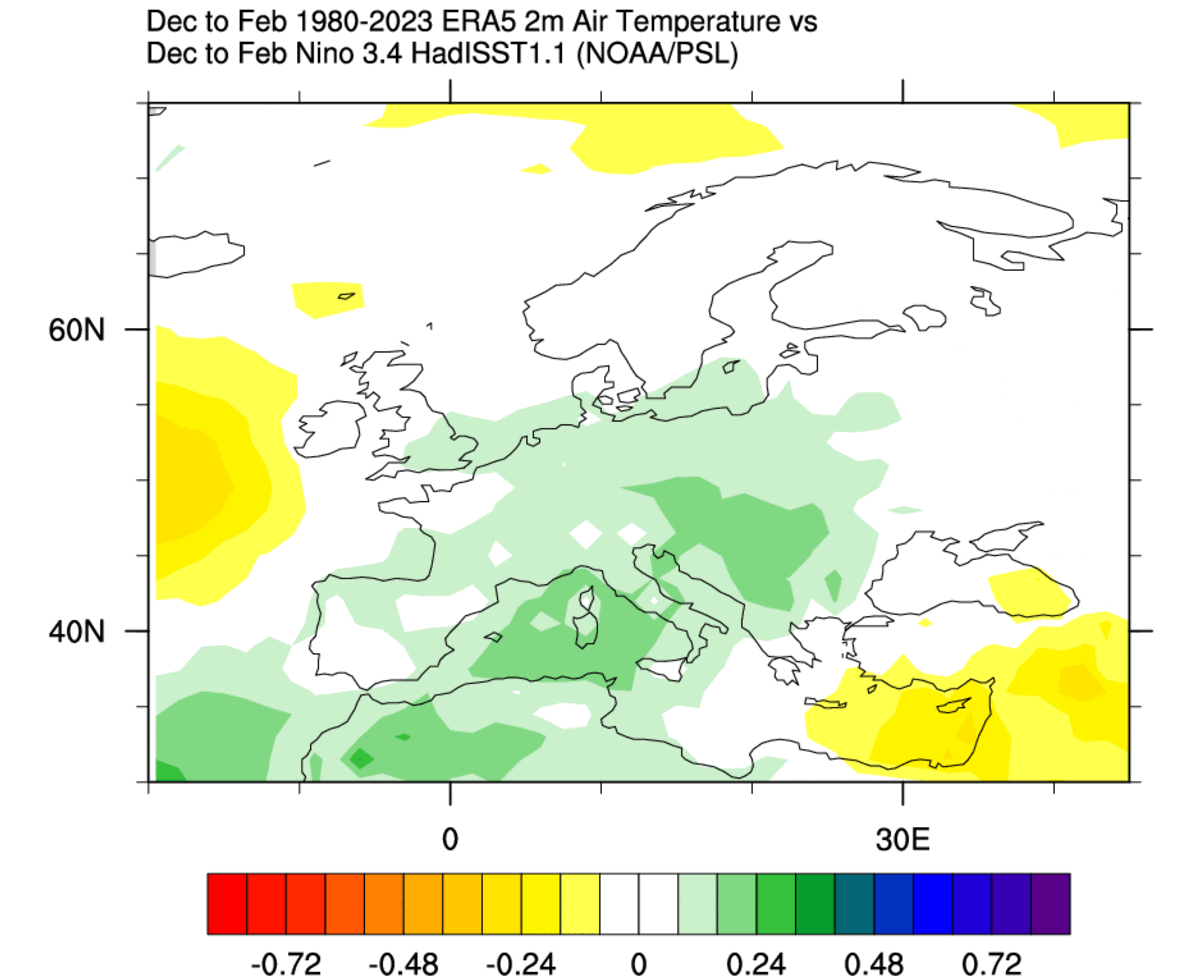
Looking at winter temperatures, there is a weak La Niña signal for lower temperatures than normal across much of central and western Europe due to the low-pressure area over these regions and the high-pressure area to the west.
Looking at precipitation, we have much more noise in the signal, as expected. But generally, there is less precipitation across mainland Europe during a La Niña winter and more precipitation over the south and parts of the north.
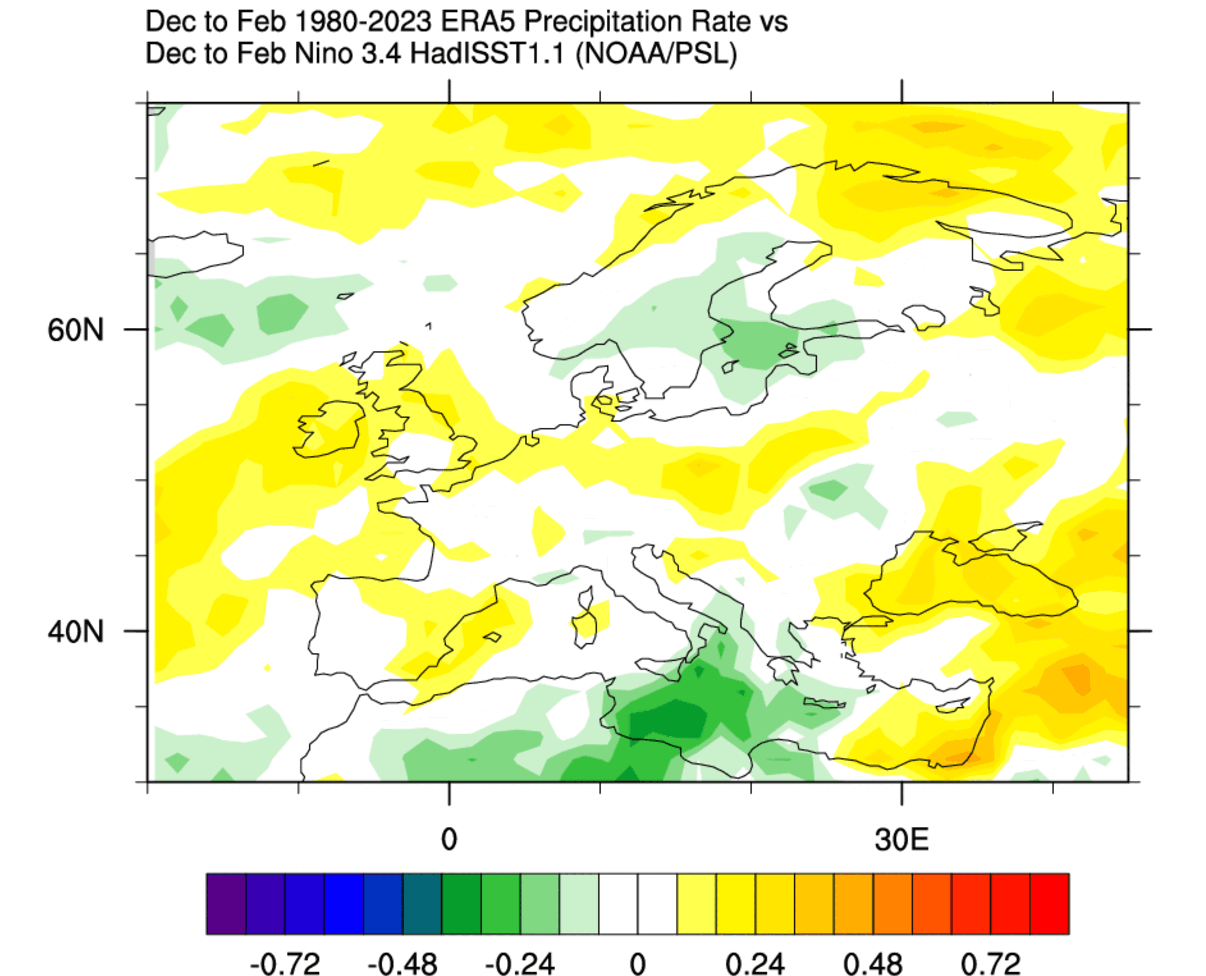
This is just a correlation with the ENSO index. And we know that no two such events are completely the same. It does show that these ocean anomalies can have a profound influence on weather patterns, and the 2024/25 weather season will likely be no exception.
METEOROLOGICAL WINTER STARTS
Meteorological winter starts on December 1st and lasts until the last day of February. It covers the 3-month period that is statistically the coldest quarter of the year, so all official winter stats are taken in this period.
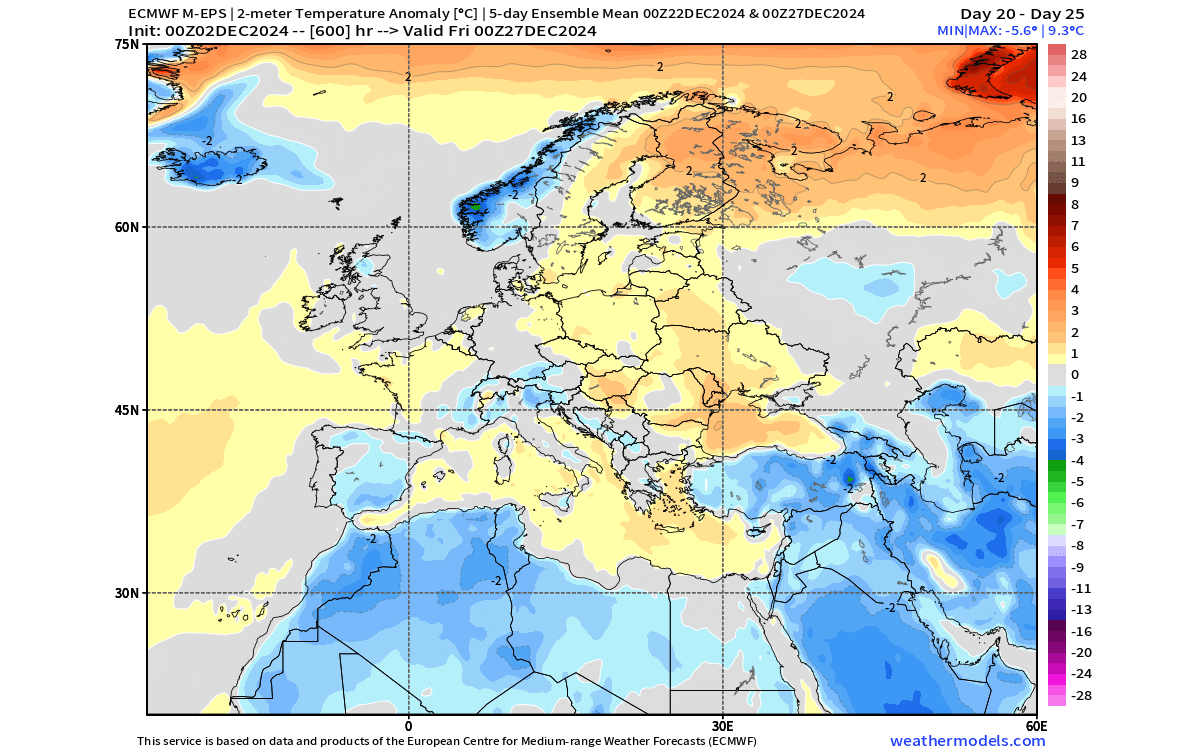
Below is the pressure anomaly for the first part of December. It shows a low-pressure area over central and southwestern Europe, prompted by a rising ridge in the Atlantic. This brings a northerly flow into western and central Europe and warmer air towards the east. Images by: weathermodels.com
That can be seen in the temperature anomalies for the same period. You can see the cold air flow into northwestern, western and central Europe, reaching all the way into northern Africa. Warmer than normal air will rise over the east.
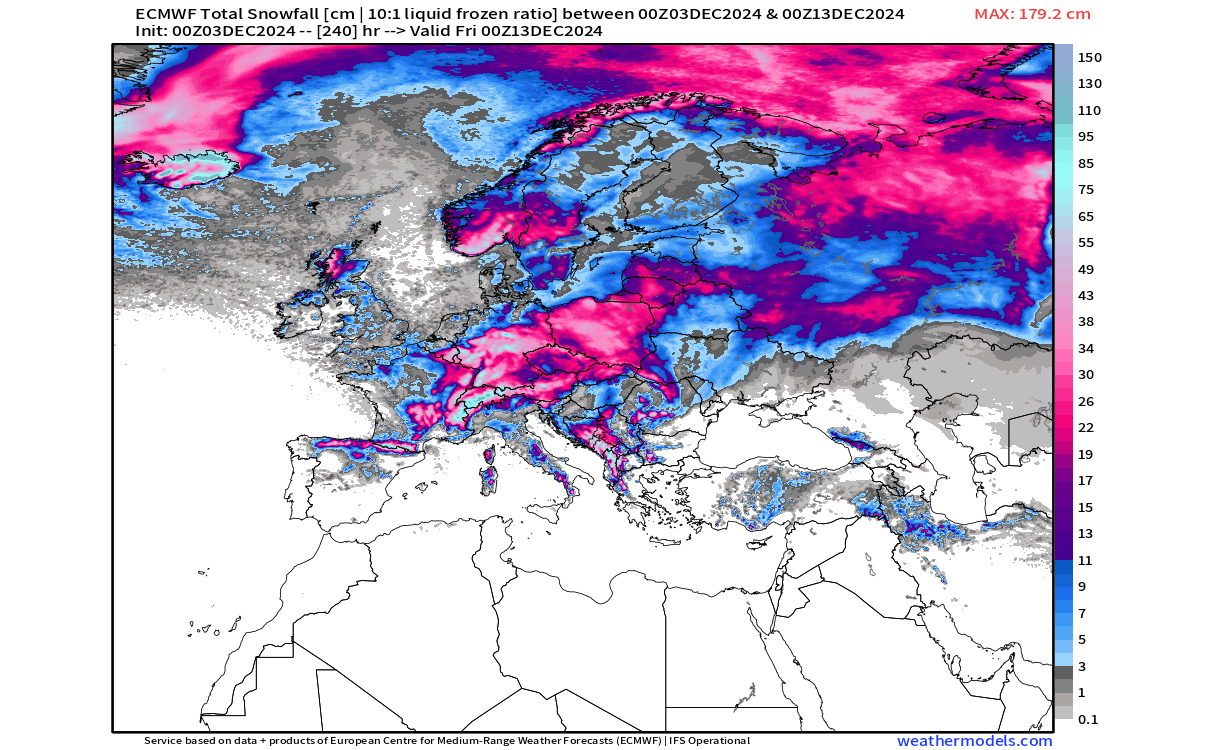
The total snowfall forecast for this period shows decent amounts of snowfall over Europe due to this cold air drop. Just note that this is not the total snow on the ground, but just snowfall calculated from precipitation.
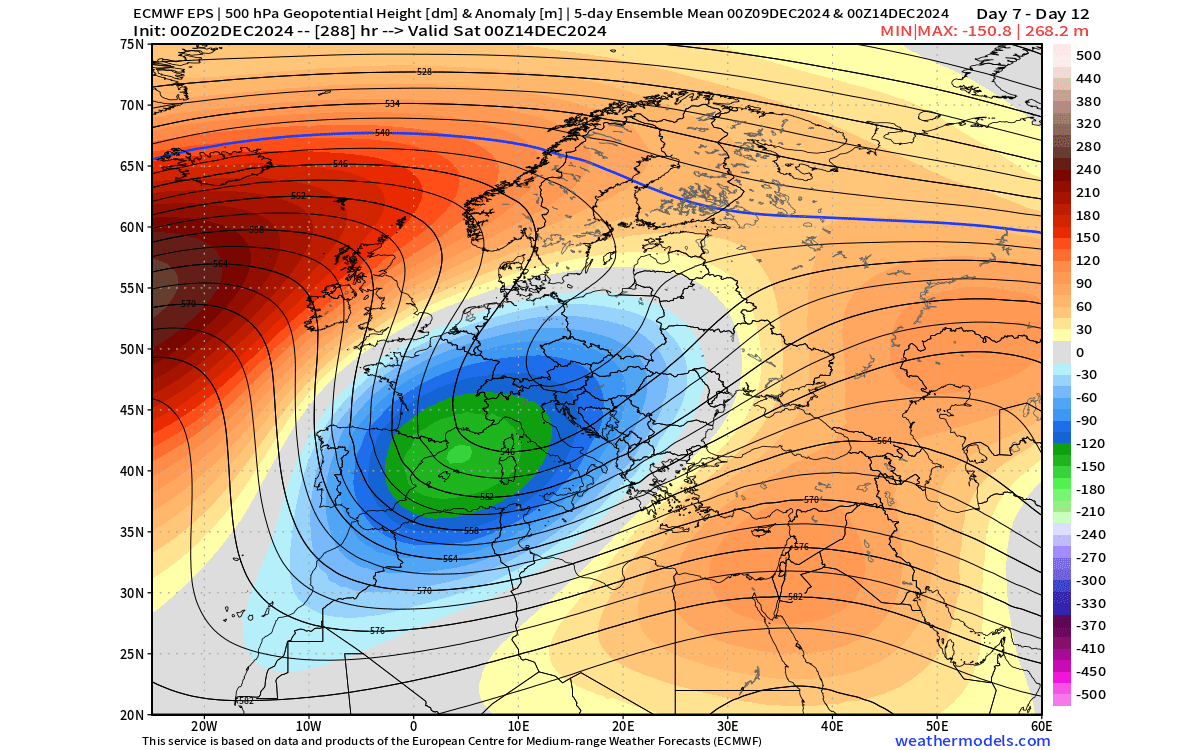
Looking deeper into the second half of December, it is currently forecast to move the main low-pressure area further back over the northwest. That enables a more westerly flow into mainland Europe, with a ridge building over the east.

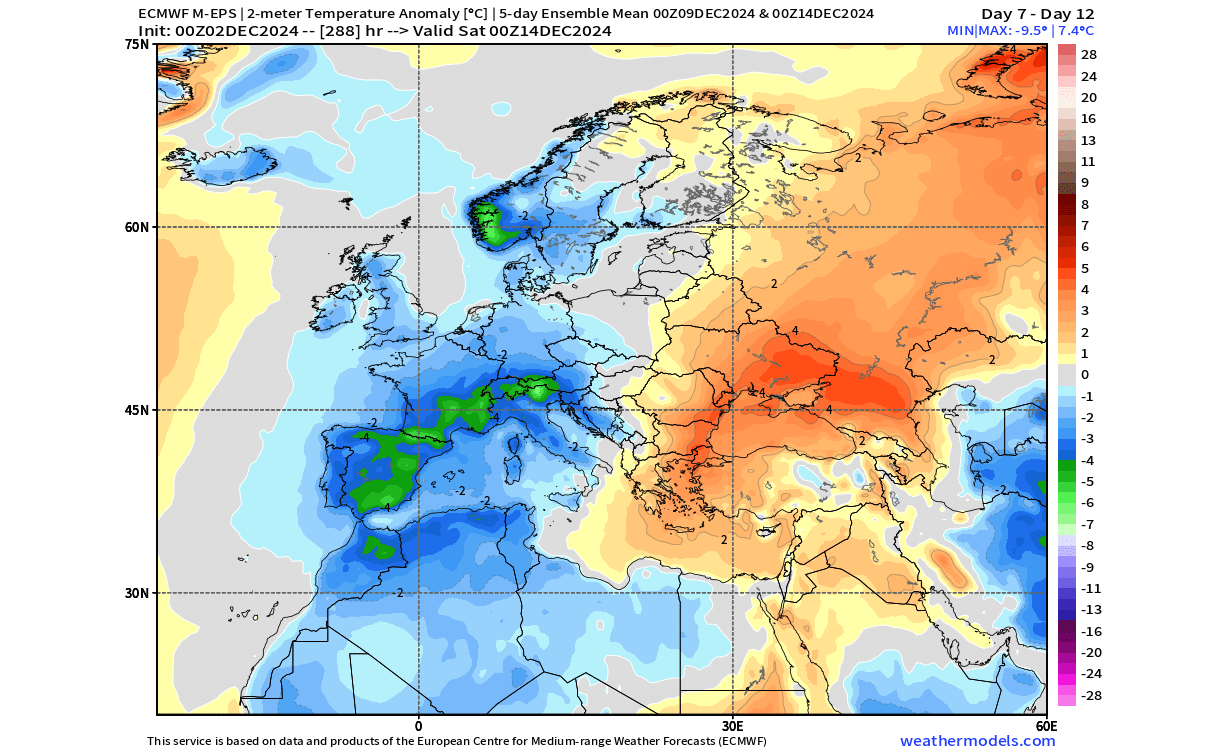
That scenario can be seen on the temperature map below, which shows a neutral to cold temperature trend over parts of southwestern and central Europe. Warmer anomalies are reaching in from the Atlantic and over the east under the high-pressure area.
We don’t yet see a proper cold outbreak in this period around the holidays. While the westerly to northwesterly flow from the Atlantic can sometimes be mild to cool, it does not allow a strong cold air transport from the north.
WINTER 2024/2025 EUROPE FORECAST
For the Winter forecast, we will look at two seasonal models: the ECMWF and the CFS model from the U.S. NCEP center. All the forecasts are an average picture over three months (January-February-March) and show the general prevailing weather patterns.
Even if the models were 100% accurate, it does not mean such weather conditions would last for three months straight. It only suggests how the weather patterns might look most of the time.
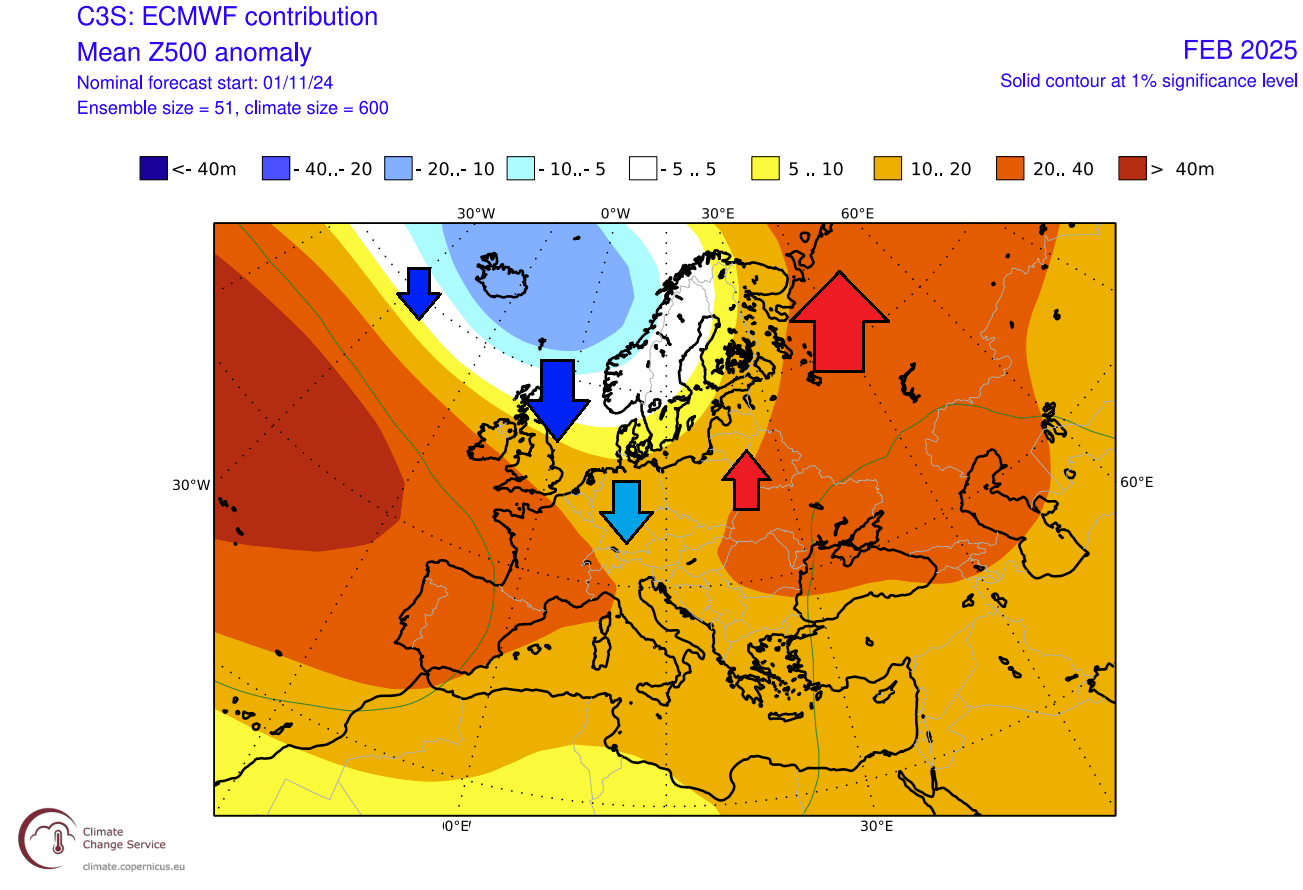
The latest winter pressure pattern forecast from ECMWF shows a low-pressure system over the far northwest. This pulls the jet stream far back north, allowing the high-pressure zone to develop over much of the continent. However, this is a 3-month average and hides many variations inside it.

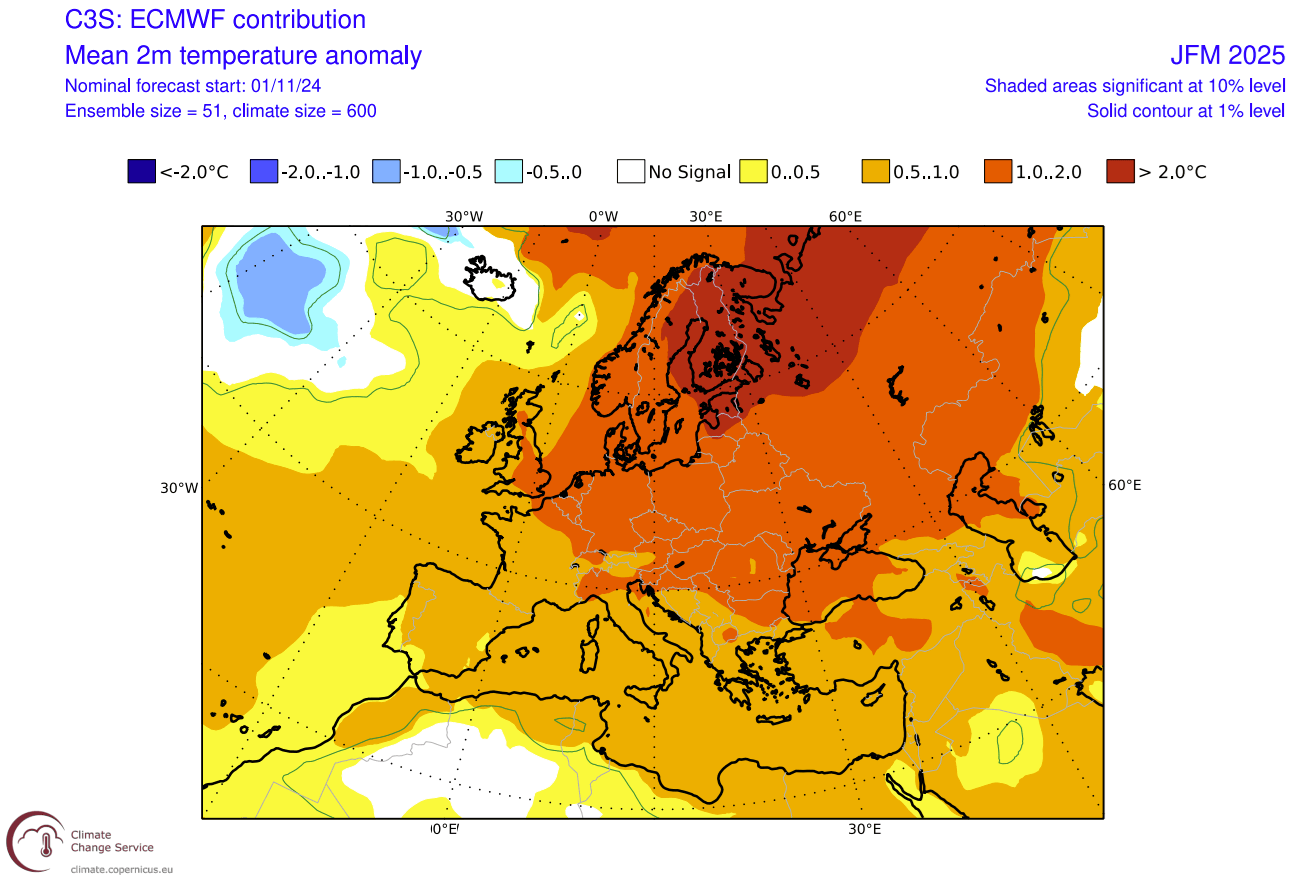
The winter temperature forecast shows mostly warmer-than-normal temperatures over Europe. Warm anomalies are weaker over the west and southwest due to the westerly flow from the Atlantic, which is generally mild to cool. Stronger warm anomalies are forecast over east-central parts and towards the northeast.
The latest precipitation anomaly forecast shows more precipitation over northern Europe. That is because the forecast pulls the jet stream and pressure systems further up north, which brings more precipitation to the region.

Southwestern Europe is forecast with less precipitation than normal, while the rest of the mainland looks to have a normal amount of precipitation in this period. Parts of the Mediterranean Sea also show more rainfall, probably due to upper-low scenarios over the warm waters.
The above images are a 3-month average and can hide some details. That is why we also looked at the monthly data. We found that the forecast for February looks promising, as it shows a pressure pattern that supports a northerly flow.
Below is a single-month forecast for February 2025, showing a neutral area over western and northwestern Europe. This is a potential cold air corridor, while warmer than normal air rises over the east and into Scandinavia.

We do not see actual cold air anomalies indicated in the forecast, but this is month 3 of the forecast data, so it can be averaged out. What matters is the trend it shows and the overall pressure pattern, which supports this scenario.
WINTER 2024/2025 CFS FORECAST
As you can never trust a single forecast model, we also use the CFS long-range forecasting system. It was developed by the National Center for Environmental Prediction, based in Maryland, U.S.
This forecast shows a similar pressure pattern forecast as the ECMWF. It hints at a low-pressure zone over the northwest and out into the Atlantic. With a high-pressure area over the southwest that acts like a “pump”, creating a westerly flow into Europe.

This is a 3-month average, so the weather pattern won’t look like this for 3 months straight. But it shows a general idea, with plenty of monthly and weekly variations.
Looking at the temperature forecast, the CFS forecasts above-normal temperatures across much of Europe. Just like ECMWF, that is because the westerly flow brings milder Atlantic air over the west, but it turns into a warmer southerly flow toward the east.

The precipitation forecast is also similar to ECMWF. You can see the increased precipitation under the jet stream to the north. More precipitation also covers down into north-central Europe and the southeast, while less precipitation is forecast for southwesterly and south-central parts.

With the cold air over the north, this shows snowfall potential over the Midwest and the eastern United States, with cold air transports form the north.
Looking at the monthly data in the CFS forecast, we also found a better winter potential in the month of February, just like in the ECMWF data. But the pressure pattern in this model is different. It shows a high-pressure area rising over the northwest instead of a low-pressure system like in the ECMWF.
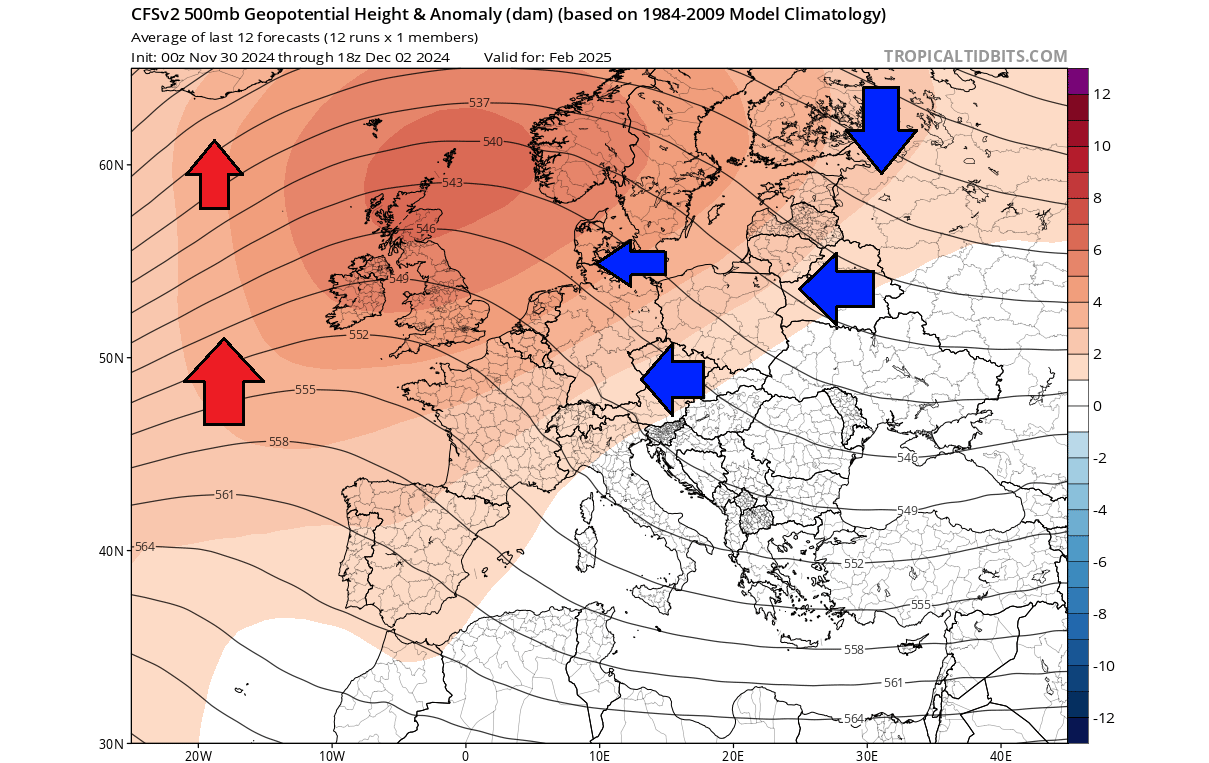
Because a high-pressure system spins clockwise, that means a northerly to northeasterly flow on its front side and a southerly flow on its rear side. That enables a cold air corridor from the northeast directly into eastern, central, and parts of southern Europe.
This can be seen in the temperature forecast for February in this model. A warm anomaly rises over the Atlantic into southwestern and northwestern Europe. But a cold air corridor is hinted, bringing colder (but drier) air from the northeast deeper down into the continent.
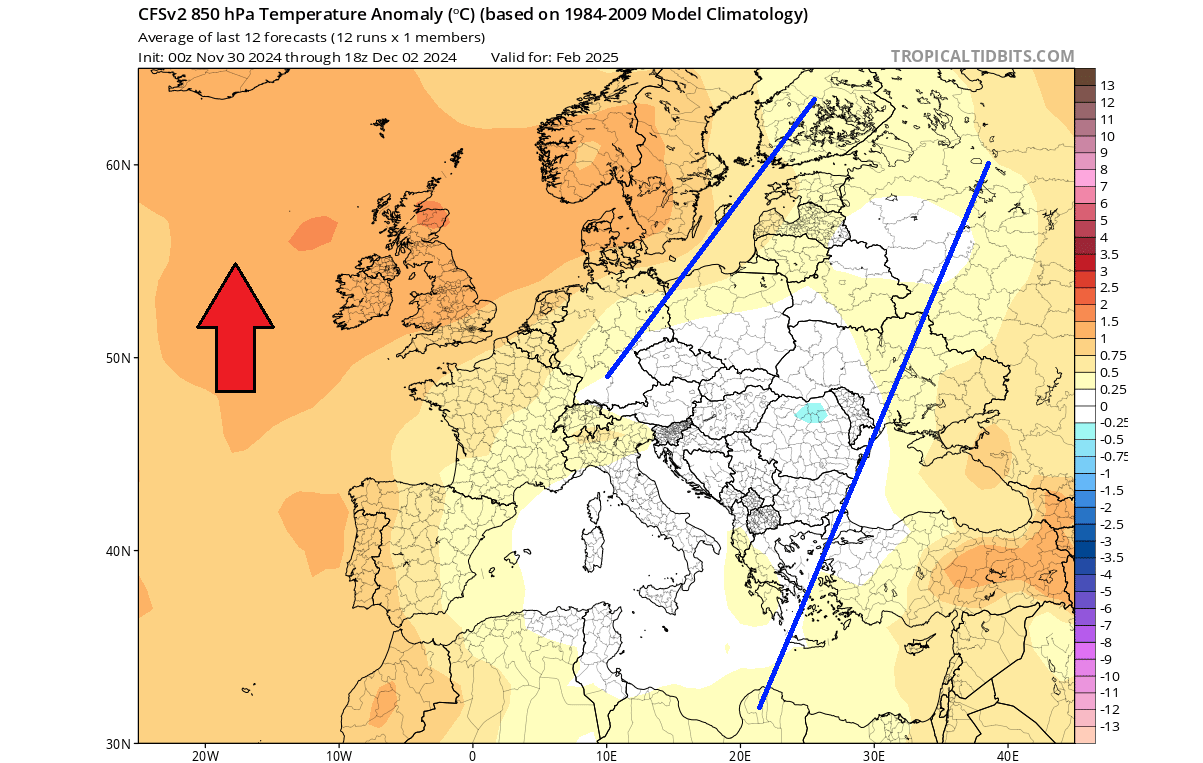
Such an event would bring colder temperatures more widespread than the image might suggest. This is just a monthly average. So, both the ECMWF and the CFS show something going on in February but with a different scenario in each model.
We will keep you updated on the developing weather trends in the coming seasons, so make sure to bookmark our page. Also, if you have seen this article in the Google App (Discover) feed, click the like button (♥) there to see more of our forecasts and our latest articles on weather and nature in general.
Don’t miss: