The final round of Winter 2024/2025 snowfall predictions paints a rather surprising picture. Despite what the earlier forecasts showed, we now see that December will have a higher snowfall amount than initially predicted across the United States. And going ahead, a cold air reserve over southern Canada keeps the snowfall potential active for the United States into Spring.
We will look at the month of December first, as it is already underway and is mostly within the range of the normal medium and extended-range forecasts.
Then, we will look at the snowfall predictions month-by-month for the United States and Canada, using the two leading global long-range forecasting systems. The latest forecast now also includes the data for April, so we can now also look into early Spring snowfall.
COLD LA NINA EVENT
One of the factors behind the weather patterns for the coming months is also a cold La Niña event. This is a cold phase of the large and powerful oceanic ENSO oscillation. It is a region of the tropical Pacific Ocean that shifts between cold and warm phases.
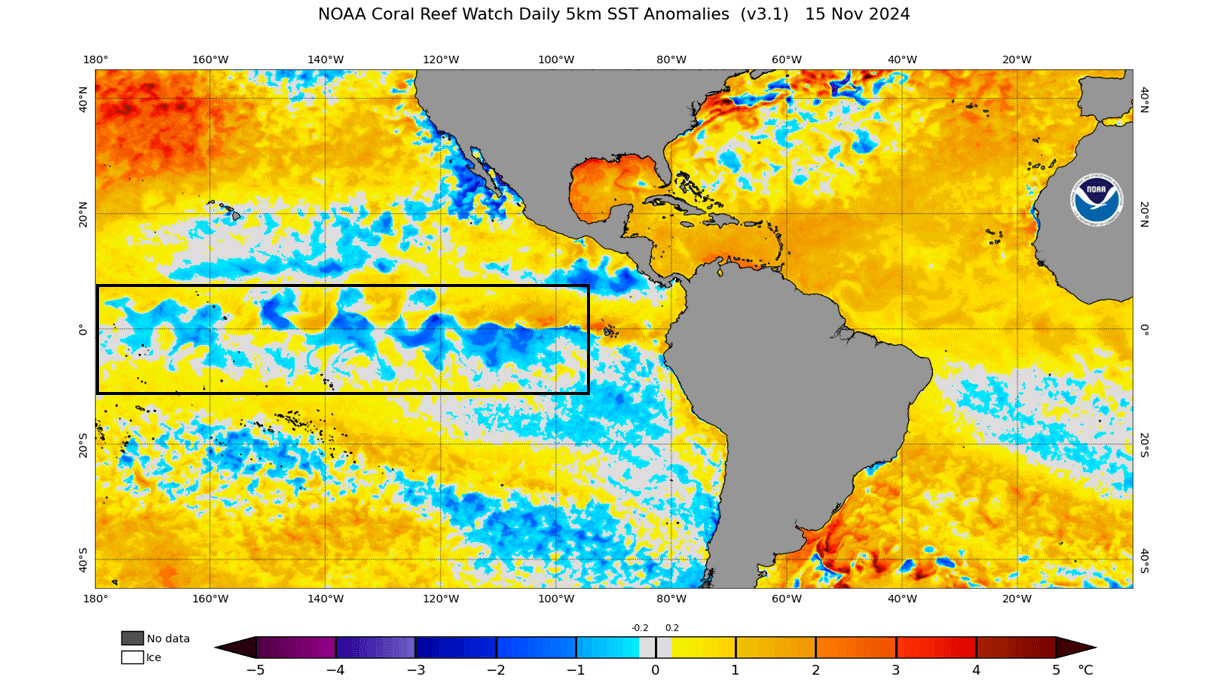
Below is the latest ocean anomaly analysis. It shows colder-than-normal surface waters in the central and eastern ENSO regions. These cold anomalies have a “wave-like” shape because of the strong easterly trade winds that push the waters towards the west, creating swirls on the ocean surface.
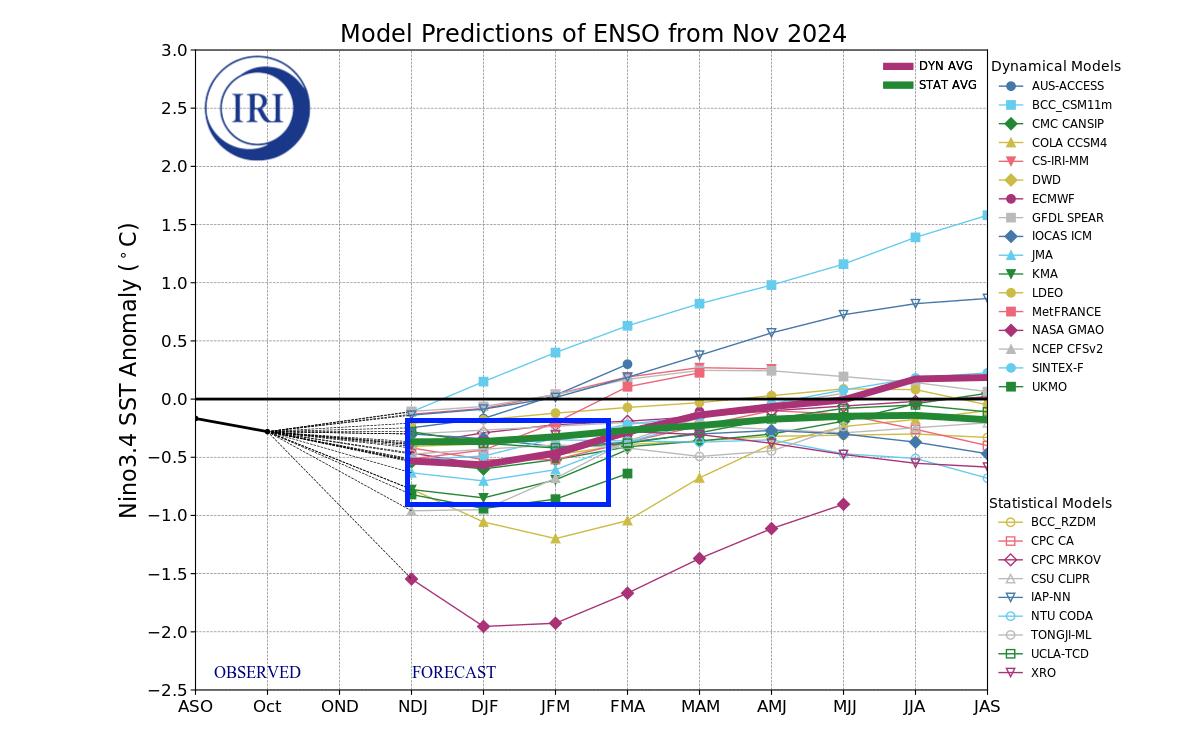
Below is an analysis/forecast image from IRI, where you can see the ocean temperature forecast from multiple modeling solutions. Negative anomalies and cooling will continue into the Winter of 2024/2025. The forecast average is within the La Niña threshold but shows a very weak event this season.
The image above also shows a slow cooling trend that began in Spring. We produced a high-resolution video (below) from NASA data that shows this transition of ocean anomalies in the tropical Pacific.
La Niña usually creates a high-pressure system over the North Pacific. That promotes the development of a low-pressure region over Alaska and western Canada and shifts the jet stream downwards in between the two pressure systems.
The image below shows the shift of the jet stream into the northern United States. It shows the average position of the jet stream during La Niña winters and the resulting Winter weather patterns over the United States and Canada.
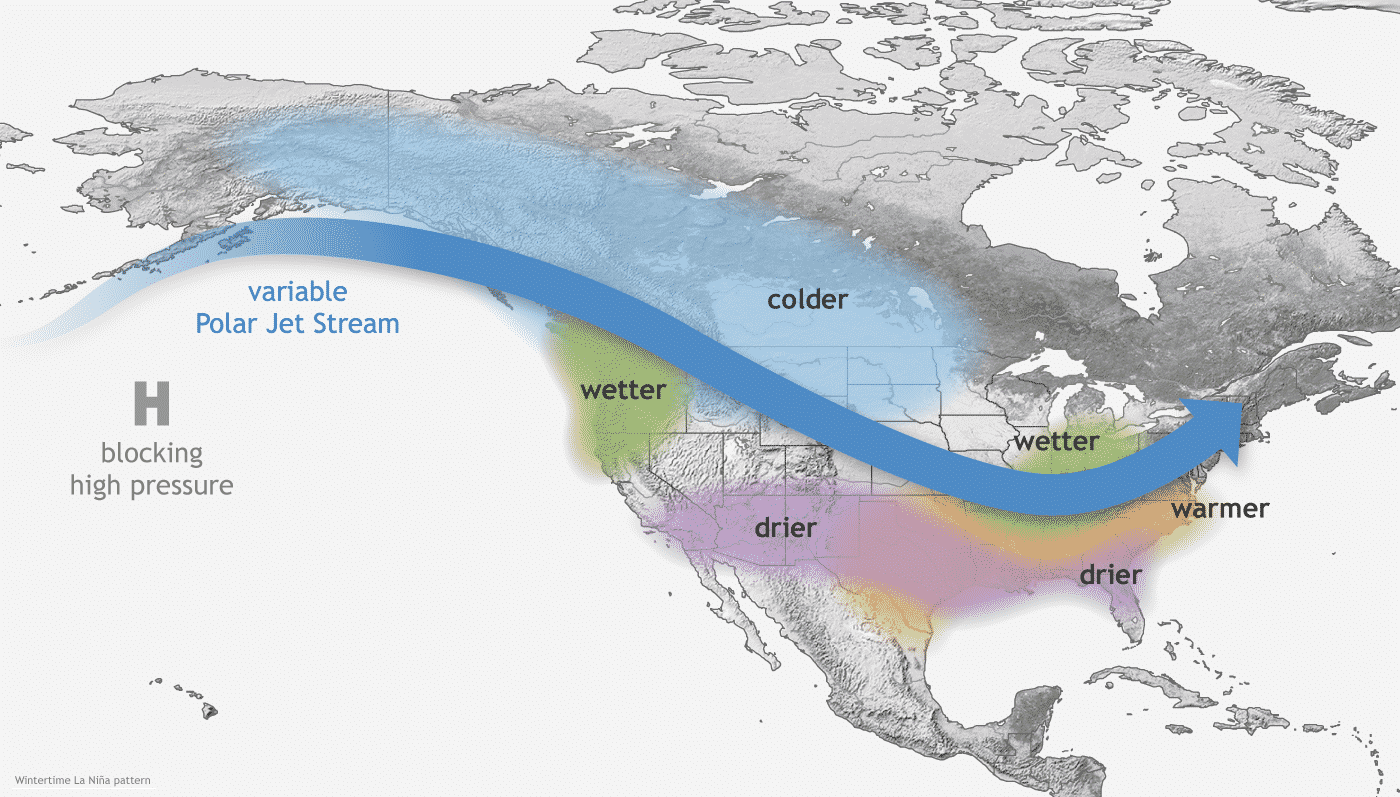
The displaced jet stream brings colder temperatures and winter storms from the polar regions down into the northern and northwestern United States. Warmer and drier winter weather prevails over the southern states.
Colder air is more easily accessible to the northern United States and southern Canada in a La Niña winter. So that increases the snowfall potential, and can also extend its reach into central and eastern parts of the U.S.
Because a weak La Niña event has developed for this season, we will also look at the snowfall patterns for a weak event.
Peak snowfall is usually across the higher elevations of the Pacific Northwest. You can see that the north-central U.S., including the Dakotas, Nebraska, and Minnesota, had an even snowier winter during weak La Niña years. There is more snowfall across the northeastern United States but less over the southeastern U.S..
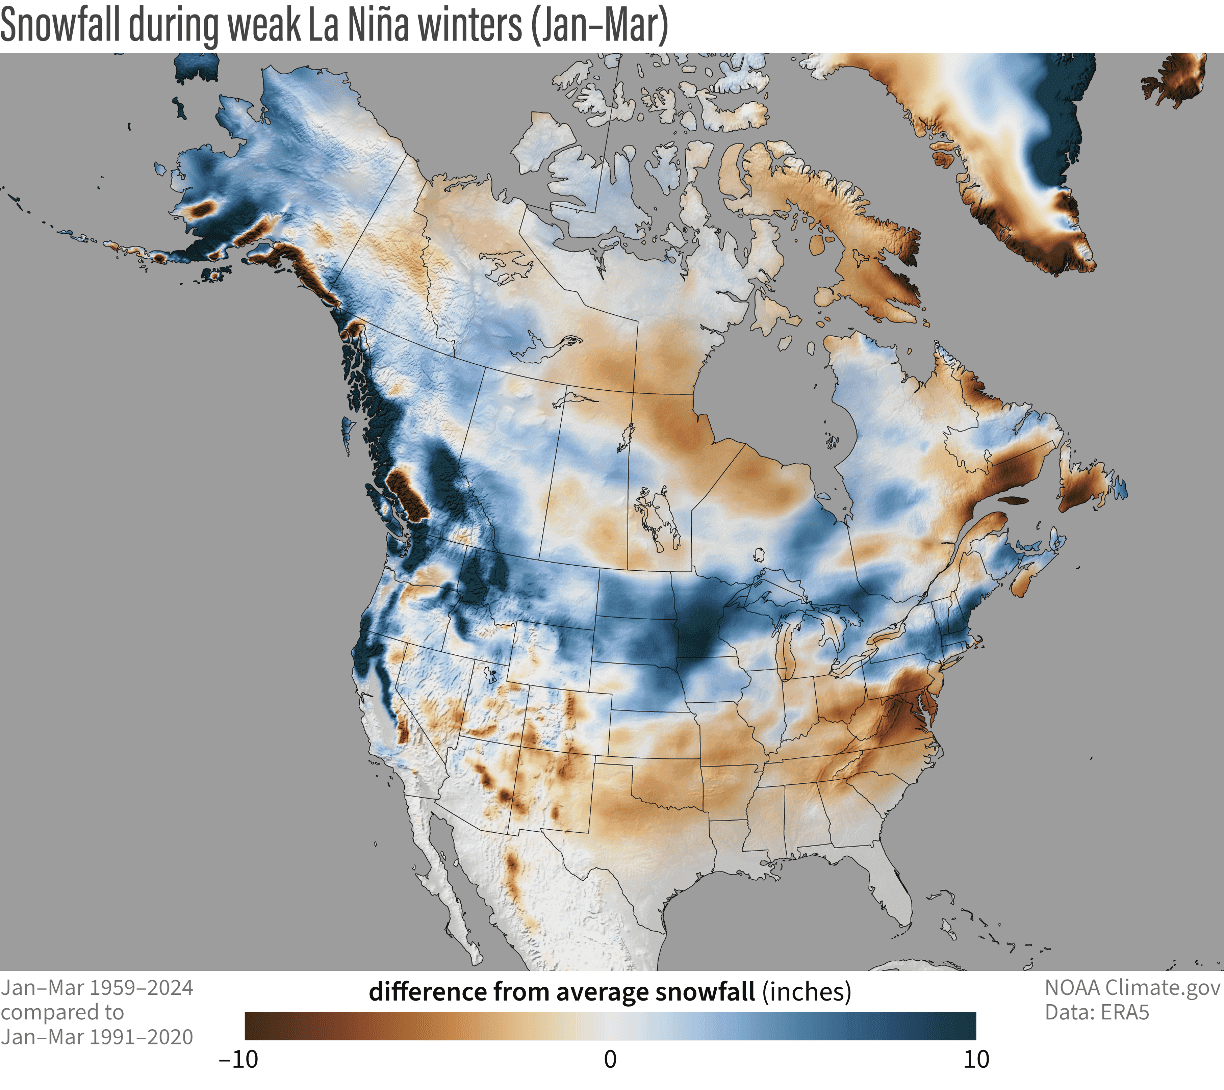
The southern United States usually experiences less snowfall in such winters because the jet stream is more confined to the northern United States and southern Canada.
SNOWFALL SEASON BEGINS
Meteorological winter began on December 1st and officially lasts until the last day of February. It covers the 3-month period that is statistically the coldest quarter of the year, so all official winter stats cover this period.
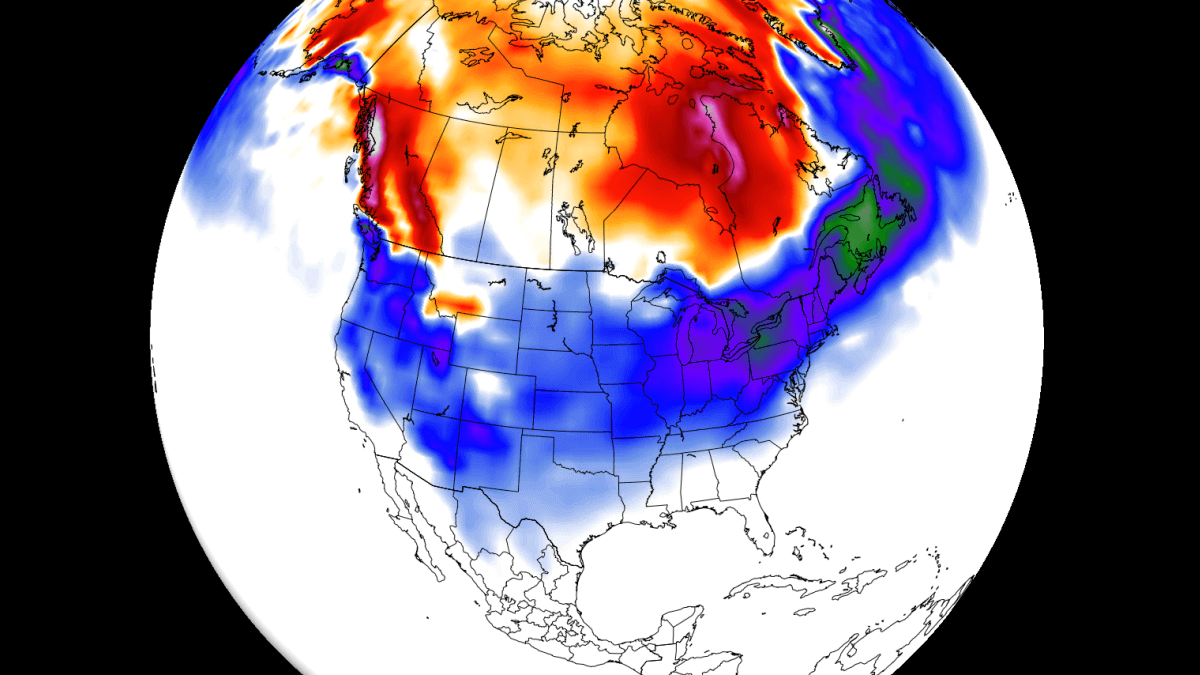
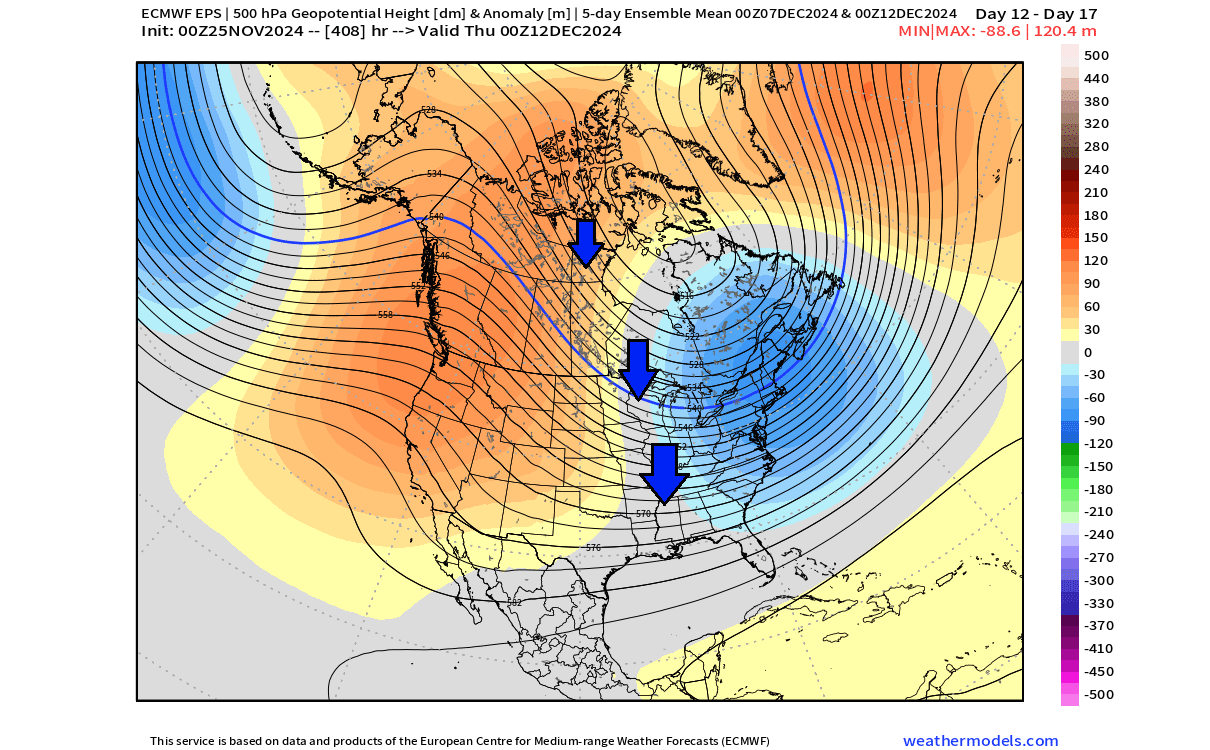
Below is the pressure anomaly for the first half of December. It shows a broad low-pressure area over the eastern United States and southeastern Canada. A low-pressure system spins counter-clockwise, creating a northerly flow and an active cold air transport line directly from the polar regions into the U.S., called the cross-polar flow. Images by:weathermodels.com
The temperature forecast below is an average for the next 30 days, covering the whole of December. You can see the cold air anomaly over the eastern half of the United States and far southeastern Canada. The northerly flow on the back side of a low-pressure system fuels this cold air anomaly and, in certain events, can also cover the central and northern plains.
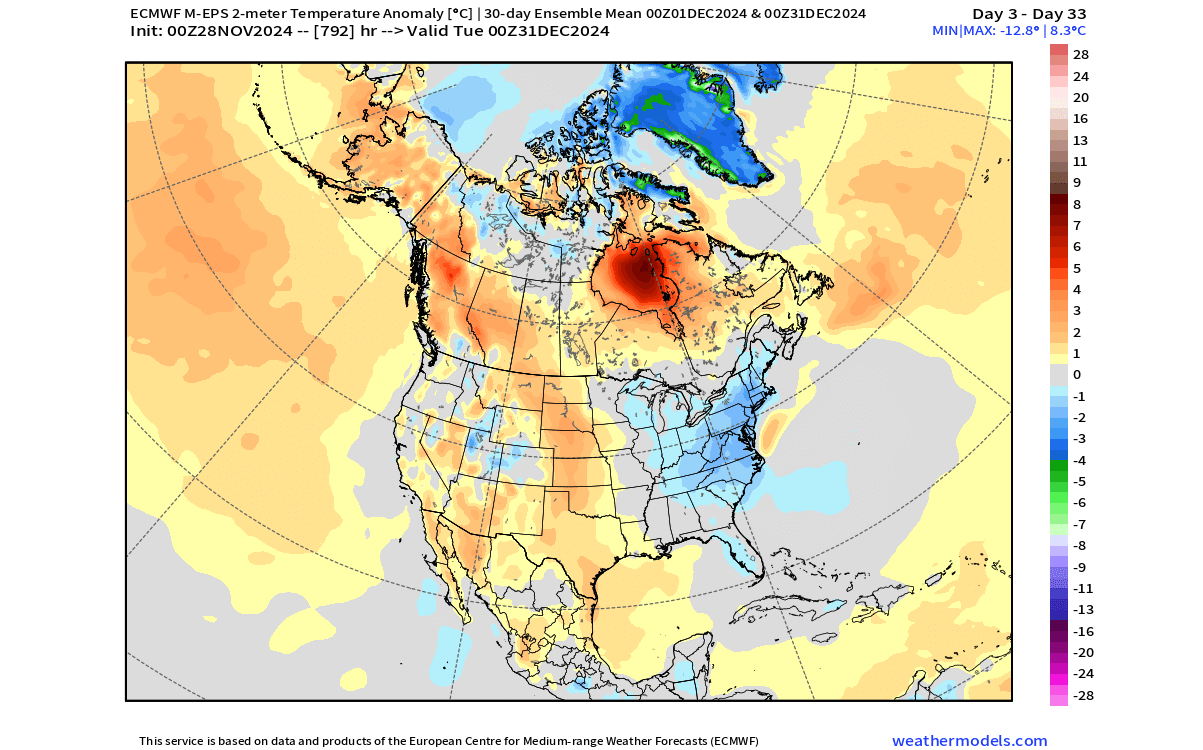
Eastern Canada is forecast to have above-average temperatures in this range. That is because as a low-pressure system spins counter-clockwise, it brings a southern (warmer) flow on its eastern side.
A warmer anomaly is forecast over the western and parts of the central U.S. because a high-pressure system is expected to expand there around mid-month.
Below is the snowfall forecast, but keep in mind that this is a rough ensemble forecast. It covers the whole of December and shows the total snowfall in this period, not snow on the ground. Thanks to the northerly flow, all of Canada and a large part of the United States will experience snowfall at some point in the next month.

Because this is an ensemble forecast, it poorly represents the second half of December. So, the total snowfall is slightly biased by the cold period in the first half of the month. And, of course, the forecast signal gets weaker in the second half of the month.
So, we know that the snowfall season will start off with proper weather across many states of the Lower 48. But what about the rest of the Winter 2024/2025 season?
WINTER SNOWFALL PREDICTIONS
The format of this snowfall forecast is simple. We look at two well-established seasonal weather forecasting systems, the ECMWF and the UKMO. The data used to produce these images is the latest available, from mid and late November.
Because we have already covered December, we will focus on the seasonal average snowfall for the January-February-March period, and we will also do a monthly breakdown. There are a lot of details in the monthly forecast that the whole seasonal average cannot show.
These forecasts show the snowfall anomaly. This means it shows the areas forecast to receive more (or less) snowfall than normal. For example, if an area is forecast to receive less snowfall than normal, it doesn’t mean it will receive no snow. It just means less snowfall than usual is expected.
ECMWF SNOWFALL FORECAST
The seasonal average for North America shows that most of the central and southern half of the United States should experience below-average snowfall. But more snowfall is forecast over the northern United States and southern Canada. This means that the jet stream is stable over the northern United States with a cold pool over western Canada.

In such a pattern, it’s not hard to get occasional drops of cold air and snowfall deeper into the south-central and eastern United States. But one or two events per month are not enough to really change the whole 3-monthly average, while we can tell that there are some cold events within the average.
Compared to the forecast from last month, there is more snowfall in the forecast for parts of the northern United States and a lesser snow deficit over the southern and eastern United States. The image below shows the difference between the current and previous seasonal forecasts.

January snowfall forecast shows most of the United States with below normal snowfall, especially around the Great Lakes. This is not a typical La Niña snowfall pattern anymore, as the forecasts have shown in previous months.

This forecast data was calculated in early November and released in mid-month. Since then, we have seen a stark increase in snowfall amounts for at least the first half of December across the United States. So, the forecast issued in mid-December will likely show a different picture.
The February snowfall forecast shows more snowfall over the northwestern and northern United States and southern Canada. This again shows a clear sign of a cold air reserve over southern and western Canada and the jet stream over the northern U.S.
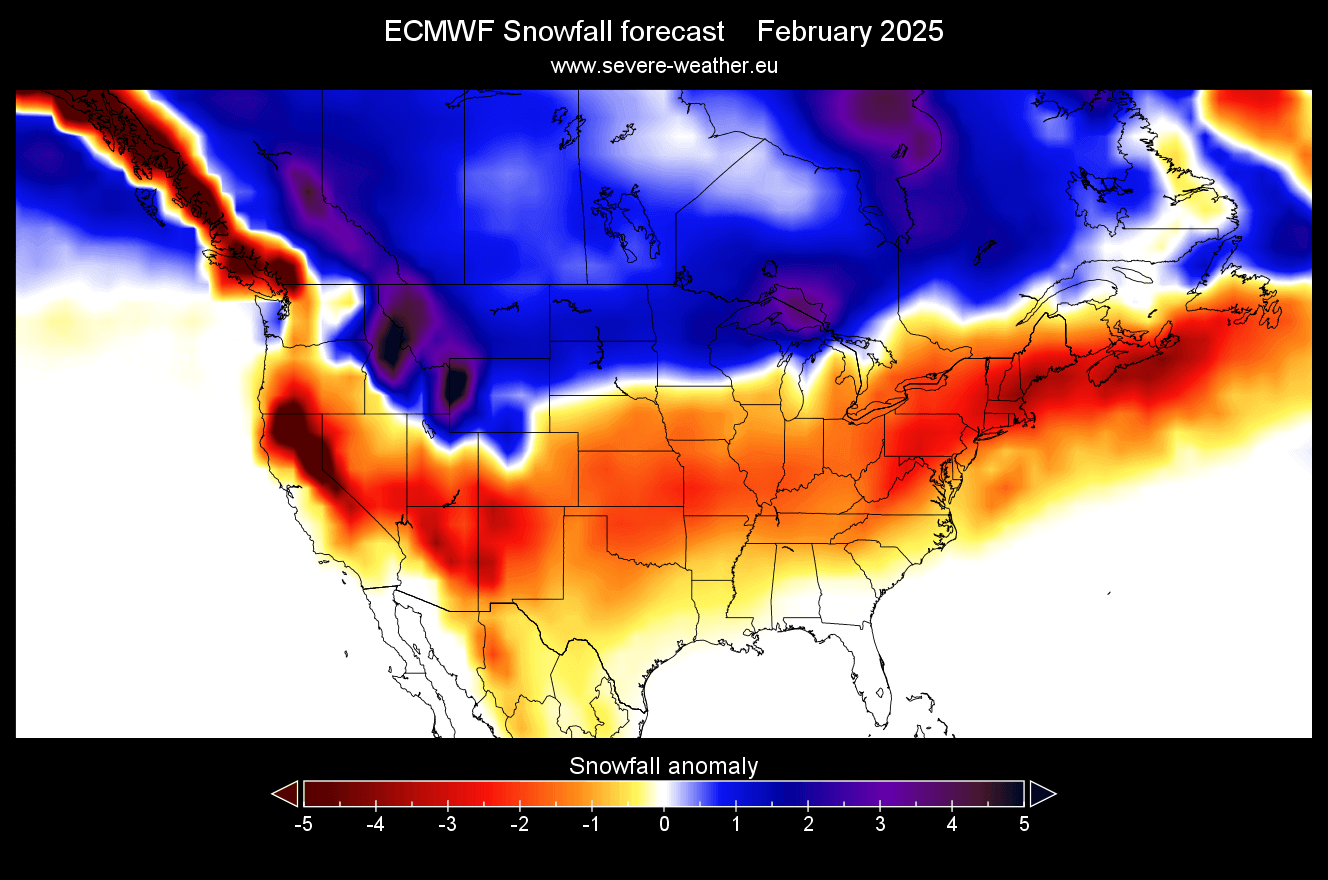
While the forecast for the rest of the United States still indicates less snowfall than normal, we do now know that such a setup can create at least one potentially strong cold and snow event deeper down into the United States.
Looking at the updated March snowfall forecast, you can see increased snowfall mostly across the far northern United States and the whole of southern Canada. The southern half of the U.S. shows to have a weaker early Spring snowfall season.
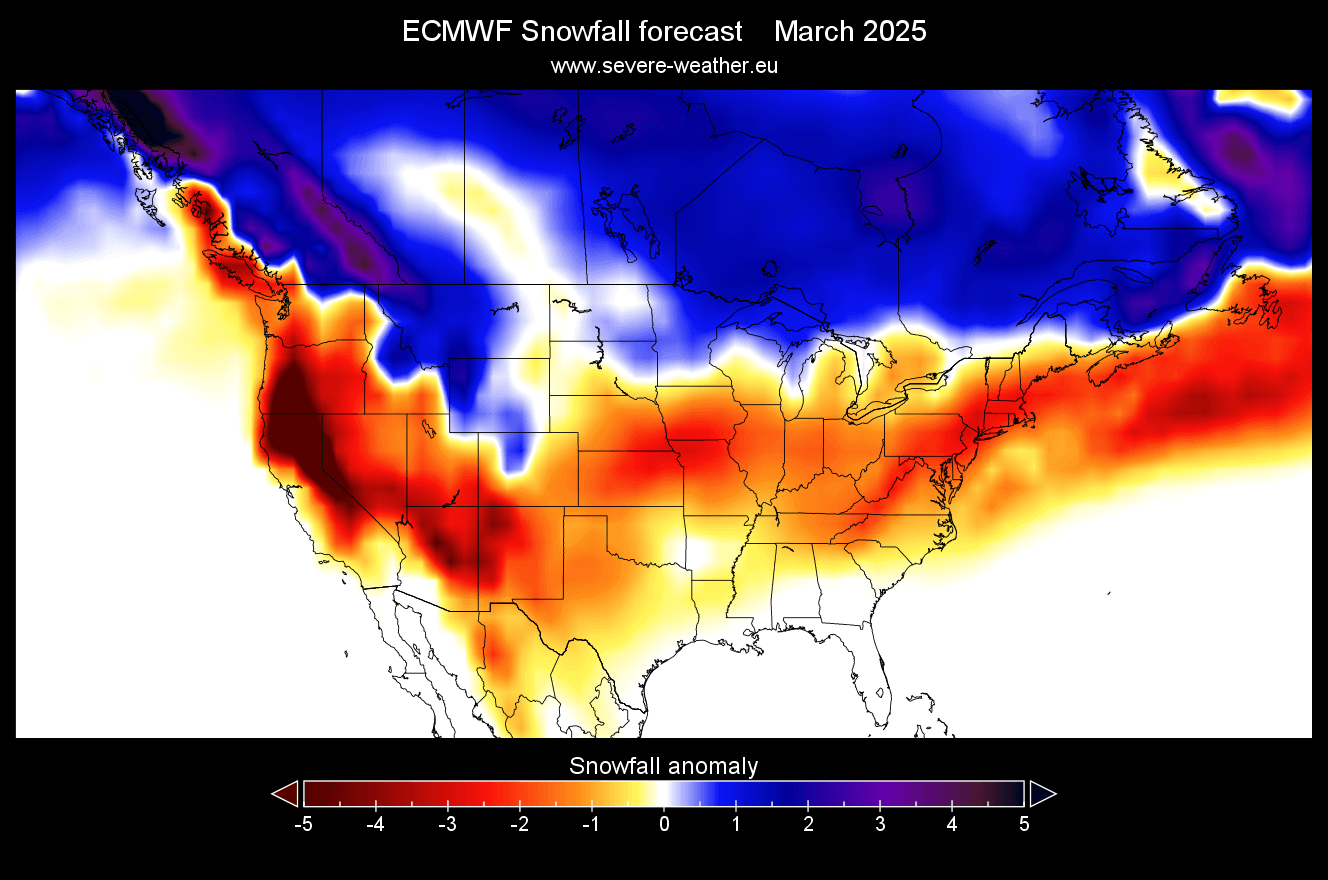
But, when you have the whole of southern Canada and the northern United States under colder anomalies and more snowfall, that indicates something. We can interpret that as a large area of colder temperatures is present over that region.
And just one low-pressure system over eastern Canada or the U.S. can pull much of that cold mass down into the central, southern, and eastern U.S., along with the increased snowfall potential. Those are the events that we cannot really see on the whole monthly average forecast.
The latest forecast data also included the month of April, so we can look at the first mid-spring snowfall trends. As you can see, the snowfall forecast is still higher than normal over much of the northern and northeastern United States and southern Canada.
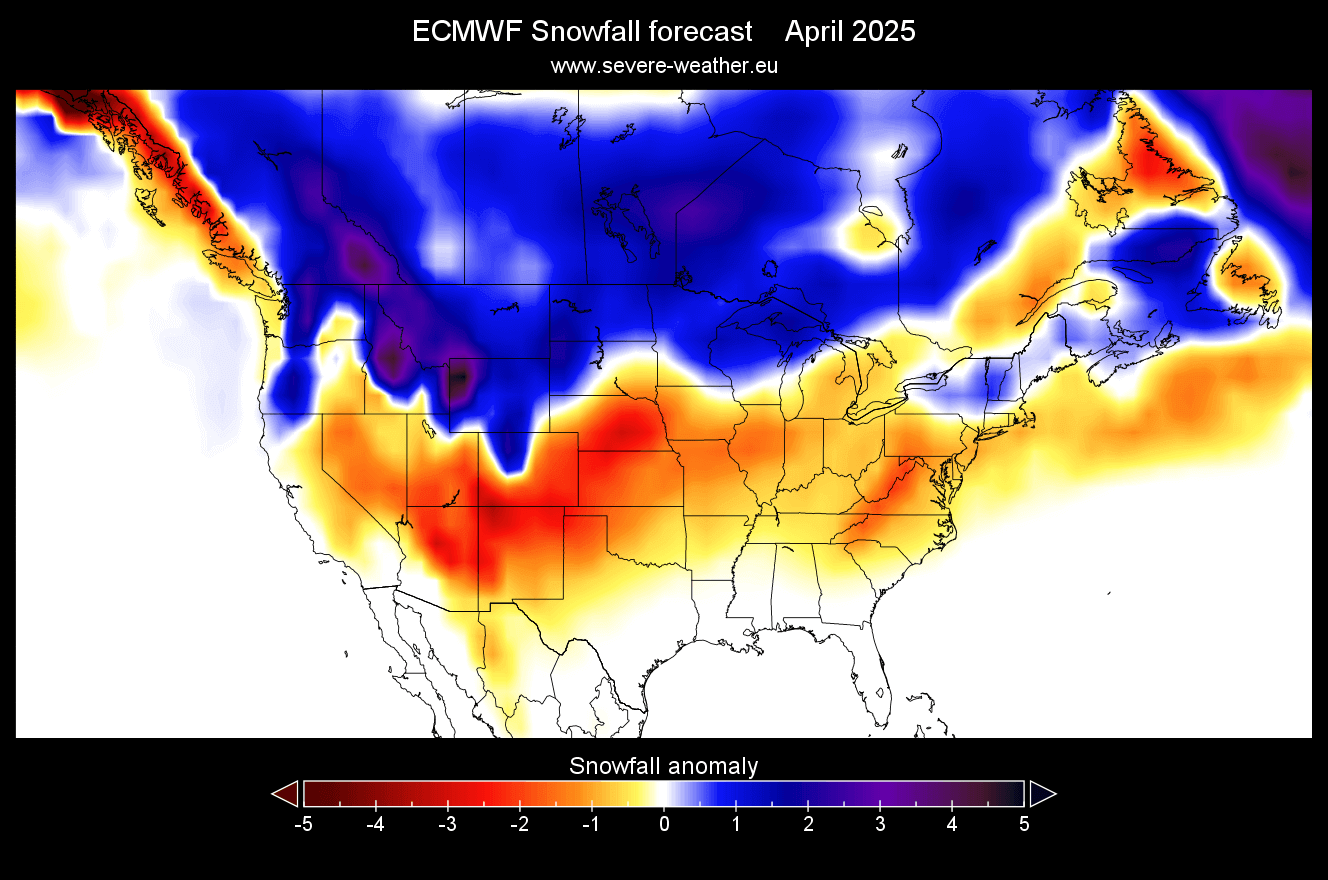
This indicates that the cold air reserve can last well into Spring over southern Canada, creating a potential source of cold air outbreaks in the U.S. deep into Spring.
NORTH AMERICA UKMO SNOWFALL FORECAST
We use the UKMO long-range forecasting system along the ECMWF to estimate how “dependable” each forecast is. If both forecasts show a very similar image, it gives a higher confidence in the overall accuracy.
The average seasonal forecast for North America shows more snowfall potential across the far northern United States and southern Canada. Less snowfall is forecast over much of the southern and eastern United States and far southeastern Canada, similar to the previous forecast.

Compared to the forecast data issued in October, we can see that the latest forecast actually shows more snowfall over much of the western United States and eastern Canada. Places like the eastern U.S. show less snowfall in the latest forecast. This is not the total snowfall increase but just compared to the previous run.

January snowfall forecast starts off with a large snowfall deficit over the eastern and northeastern United States, and western United States. The only place with above-normal snowfall is southern Canada. This indicates that the main cold reserve is not far across the northern border of the U.S.

The February snowfall forecast shows a lesser snowfall deficit over the eastern United States, showing a snowfall increase versus January. The above-average snowfall area has expanded into the northern United States, with reduced deficits over a larger area compared to January.

The updated March snowfall forecast shows good early Spring snowfall over southern Canada, the northern United States, the upper Midwest, and the northeastern U.S. The southern half of the United States shows less snowfall than normal for early Spring.

The first April snowfall forecast is actually surprising, as it shows a strong snowfall anomaly for the northern United States and southern Canada. While the rest of the U.S. shows less mid-spring snow, this indicates that the cold air reserve will last deep into spring, fueling Spring cold air outbreaks in the central and eastern U.S.

But with both these forecasts, the ECM and the UKMO model, the data was calculated in early November. It likely didn’t properly “see” the early December cold period and its effects. For that reason, we will look at one model that does not have an actual snow forecast but was just calculated and released, so it has a fresh look.
A FRESH FORECAST
The data comes from the Canadian CanSIPS forecasting system. It is usually released at the end of each month, so it is currently the very latest long-range data available. But unfortunately it does not have a snowfall map available.
Still, looking at the pressure forecast below, it shows a low-pressure area over Canada. This is the typical pattern that enables a northerly flow into western Canada and deeper down into the northern and eastern United States.

This is a 3-month average for the January-March, so the weather pattern won’t look like this for 3 months straight. But it does indicate a favorable pattern for some good cold events in the central and eastern United States.
Looking at the temperature forecast, this model shows colder temperatures across the northern United States and southern Canada, expanding across the Midwestern U.S. and into the northeastern U.S.

When there is such a large mass of cold air over Canada, that usually means an easier initiation of cold outbreaks also over the northern, central, and eastern United States. The cold air is waiting in the north and it just needs a low-pressure system to move over the Great Lakes to create a northerly flow.
Looking at the precipitation forecast, you can see drier-than-normal conditions over the southern United States, typical for a La Niña season. The forecast shows Normal precipitation for the northern parts of the U.S.

With the cold air over the north, this shows snowfall potential over the Midwest and the eastern United States, with cold air transports form the north. If we consider how deep down the cold air anomaly is forecast, this also gives snowfall potential across the central and eastern United States.
Of course, this does not mean constant snow events. It just implies that the snowfall deficit shown by the first two models is likely too strong.
WINTER 2024/2025 OFFICIAL FORECAST
NOAA issues official Winter 2024/2025 outlooks, and we can use those outlooks to also find hints of snowfall patterns and snow potential.
Below is the latest official Winter 2024/2025 temperature forecast for the United States, issued in November. It shows the temperature probability, with colder chances in the northern United States. The southwestern part of the country and the east coast have a higher probability of warmer than normal weather.

But take note of the area of “equal” temperatures extending down low into the Midwest. That can be interpreted as a potential route of winter cold air outbreaks from the north into the east-central United States. The likely culprit behind these events is a cross-polar flow.
The official precipitation forecast shows an expected La Niña pattern. We see an equal-to-high probability of more precipitation (and snowfall) over the northern half of the United States. The southern United States is forecast to have a drier-than-normal winter season.

This forecast shows the highest snowfall potential over the northern half of the United States. But with special “cross-polar flow” events, snowfall can extend deeper into south-central and eastern parts of the United States.
We will keep you updated on other developing weather trends, so bookmark our page. Also, if you have seen this article in the Google App (Discover) feed, click the like button (♥) there to see more of our forecasts and our latest articles on weather and nature in general.
Don’t miss: