Major changes are coming in 2022 across the atmosphere and the oceans, creating different weather patterns into the second half of the year, and especially in the cold season later in the year. The changes will start slowly, but the main shift will start to occur during the 2022 warm season.
But what exactly is changing this year, and what weather patterns resulted from such changes in the past?
We will go on a weather journey through 2022, starting with a seasonal weather pattern forecast for late winter and early parts of the Spring. From there we will go into the atmosphere and the oceans, to observe what is changing already, and what is yet to come. You will see how and why these global changes occur, and what is going to be different in 2022, compared to the last few years.
ENSO IN THE PACIFIC
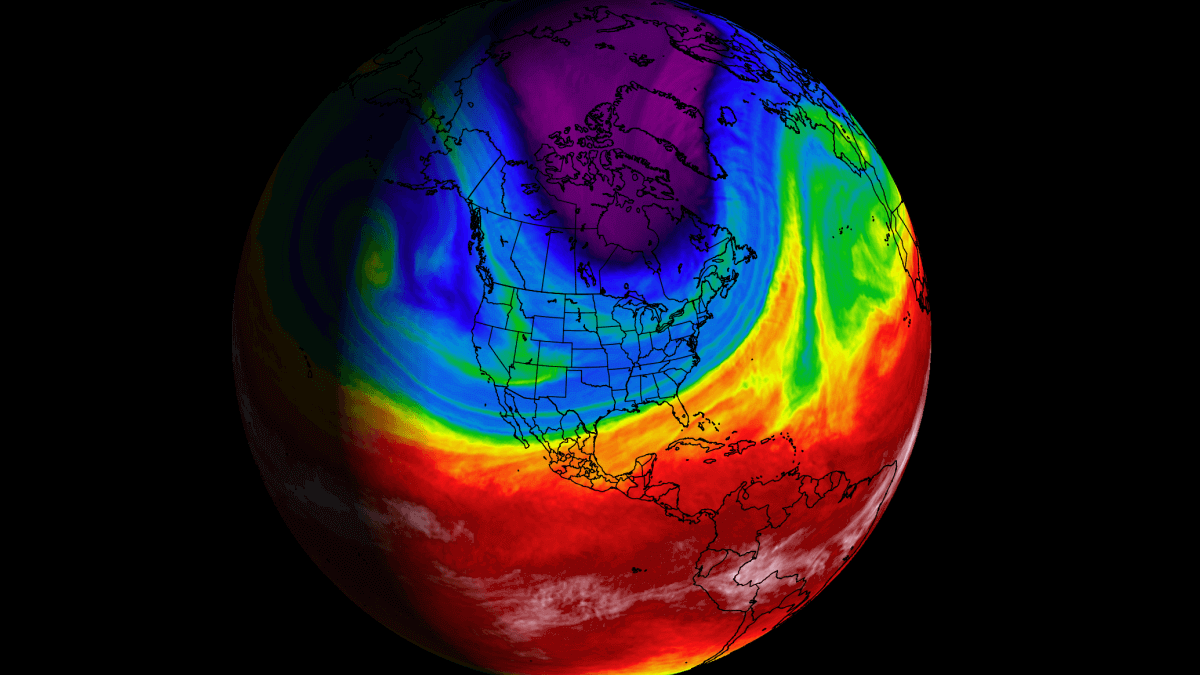
We are starting off with the current weather conditions, brought on from the 2021 cold season. Winter is still ongoing and driven largely by a cold ENSO phase.
ENSO is short for “El Niño Southern Oscillation”. This is a large oceanic region in the tropical Pacific, that is regularly changing between warm and cold phases. It has a major impact on the tropical convection patterns (storms), pressure patterns, and thus on the interaction between the ocean and the atmosphere.
We can observe large-scale pressure changes in the tropics as ENSO shifts between warm and cold phases. With some delay, these changes directly affect the circulation over the rest of the world.
The image below shows the ENSO regions in the tropical Pacific. Main analysis (and forecast) is done for a combination of regions 3 and 4, seen on the image as the Nino 3.4 region. Region 3 covers the eastern tropical Pacific, while region 4 covers the central and most of the western tropical Pacific.

Each ENSO phase has a different effect on the pressure and weather in the tropics. Over time, this translates to the overall global circulation, impacting the weather worldwide differently. A specific phase (cold/warm) usually develops between late summer and fall and typically lasts into next Spring. Some stronger events can last even up to two years.
The cold ENSO phase is called La Nina and the warm phase is called El Nino. Their names literally translate to “the girl” (La Nina), and “the boy” (El Nino), indicating an opposite dynamic between the two phases.
But besides the ocean temperatures, one of the more important differences is also in the pressure pattern. During an El Nino, the pressure over the tropical Pacific is lower, with more rainfall and storms and westerly winds.
But during a La Nina, the pressure over the equatorial Pacific is high, creating stable conditions and less precipitation. This directly translates into the global circulation, affecting the jet stream on both Hemispheres over time.
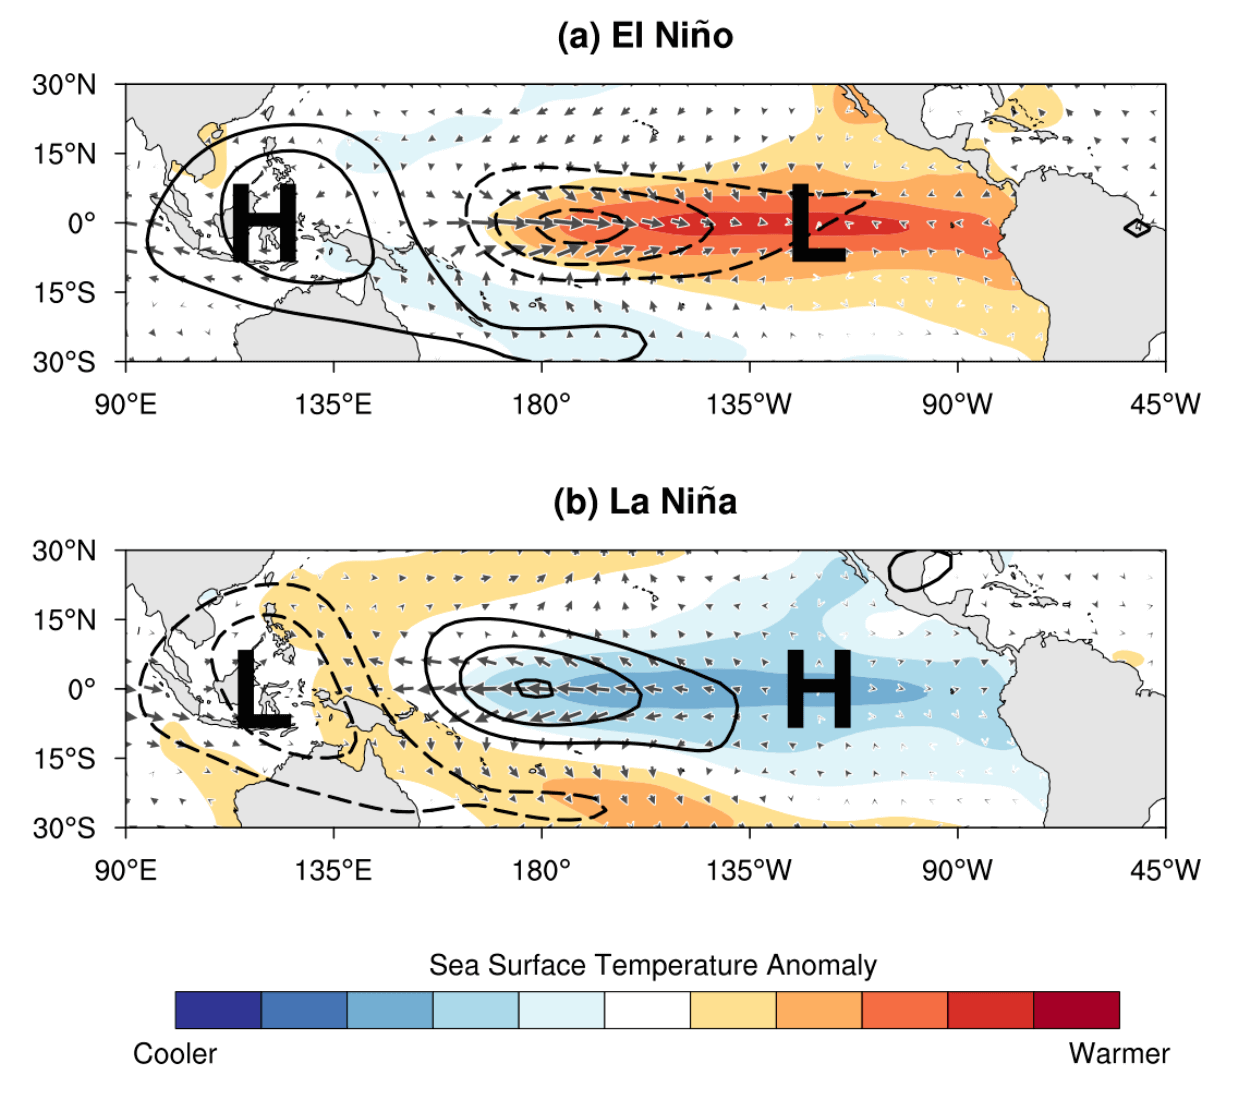
The image below from NOAA Climate shows the typical circulation during a cold ENSO phase that we are currently in. Air is descending in the eastern Pacific, causing stable and dry weather, while lower pressure and rising air cause frequent thunderstorms and a lot of rainfall over the western Pacific.

This way, ENSO has a major impact on the tropical rainfall and pressure patterns and impacts the ocean-atmosphere feedback system. We usually observe a global shift in pressure patterns during the emergence of an ENSO phase but it is usually most influential during the peak of the phase and its decay.
Below we have the latest global ocean temperature anomaly from NOAA. We can clearly see the strong cold anomalies in the tropical Pacific Ocean. That is the currently active La Nina phase. The strongest cold anomalies are reaching below 3°C colder than the long-term average. Overall, the current event is marked as a moderately-strong La Nina.

The high-resolution video animation below shows the ocean temperature anomalies from Summer to late Fall. You can see new cooling starting in July, as the cold “waveforms” develop across the equatorial Pacific. They form as the surface water is being pushed west by the trade winds, bringing deeper colder water to the surface.
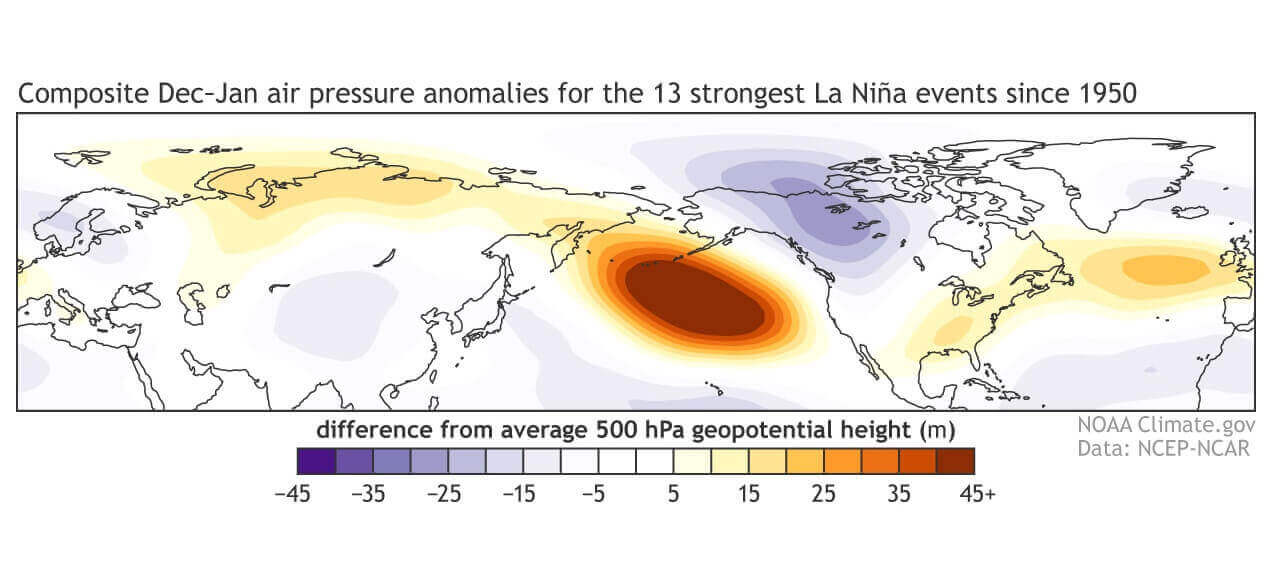
Below we have an image that shows the average winter pressure pattern from multiple La Nina winters. The main feature is a strong high-pressure system in the North Pacific and low pressure over Canada. That is the typical signature of the cold ENSO phase. Over the North Atlantic and Europe, the pattern is not as strong as the ENSO influence is mitigated by local pressure patterns.
We now know what this La Nina is, and how it usually impacts the weather. That is why we will look at its weather influence in the first part of 2022, going from Winter Into Spring, when this cold ocean anomaly will finally start to disappear.
EARLY 2022 SEASONAL WEATHER FORECAST
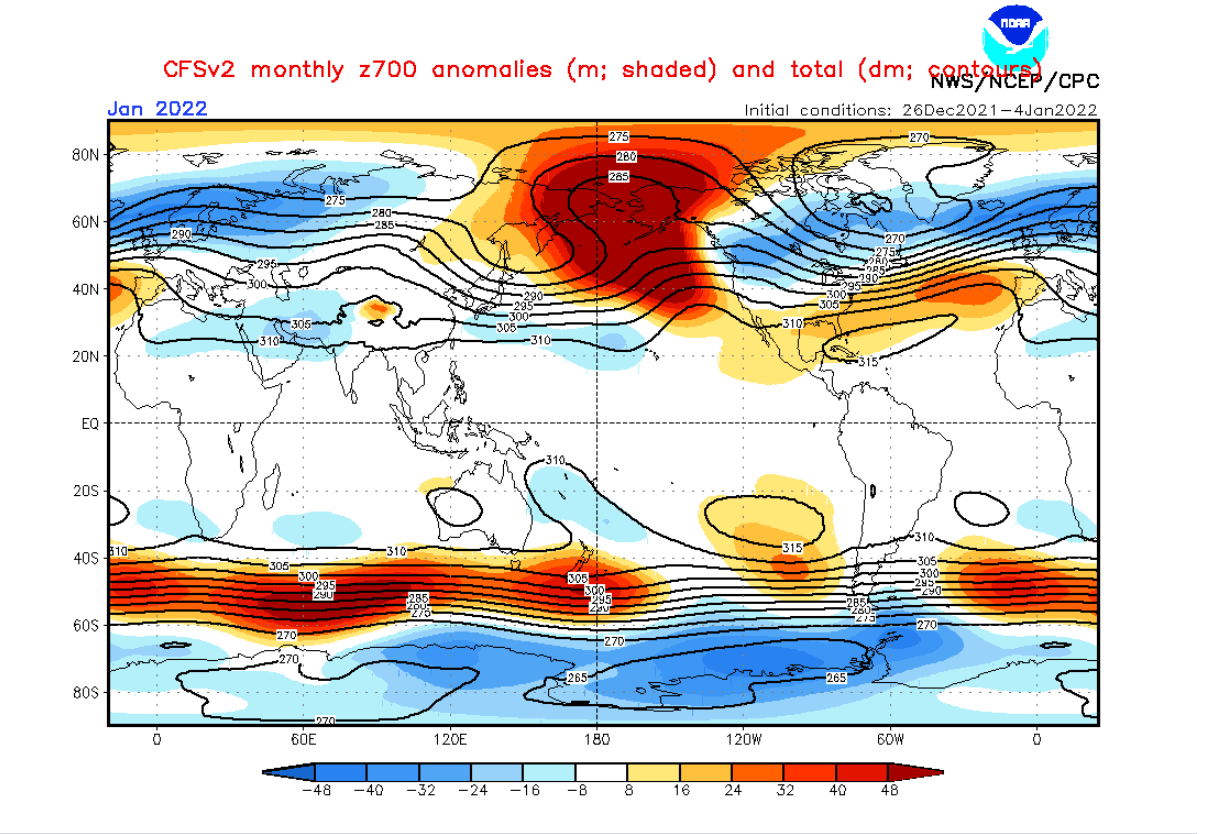
The January pressure pattern forecast below shows a strong signature of the La Nina. A dominant high-pressure system in the North Pacific, with a low-pressure zone over Canada and the northern United States.
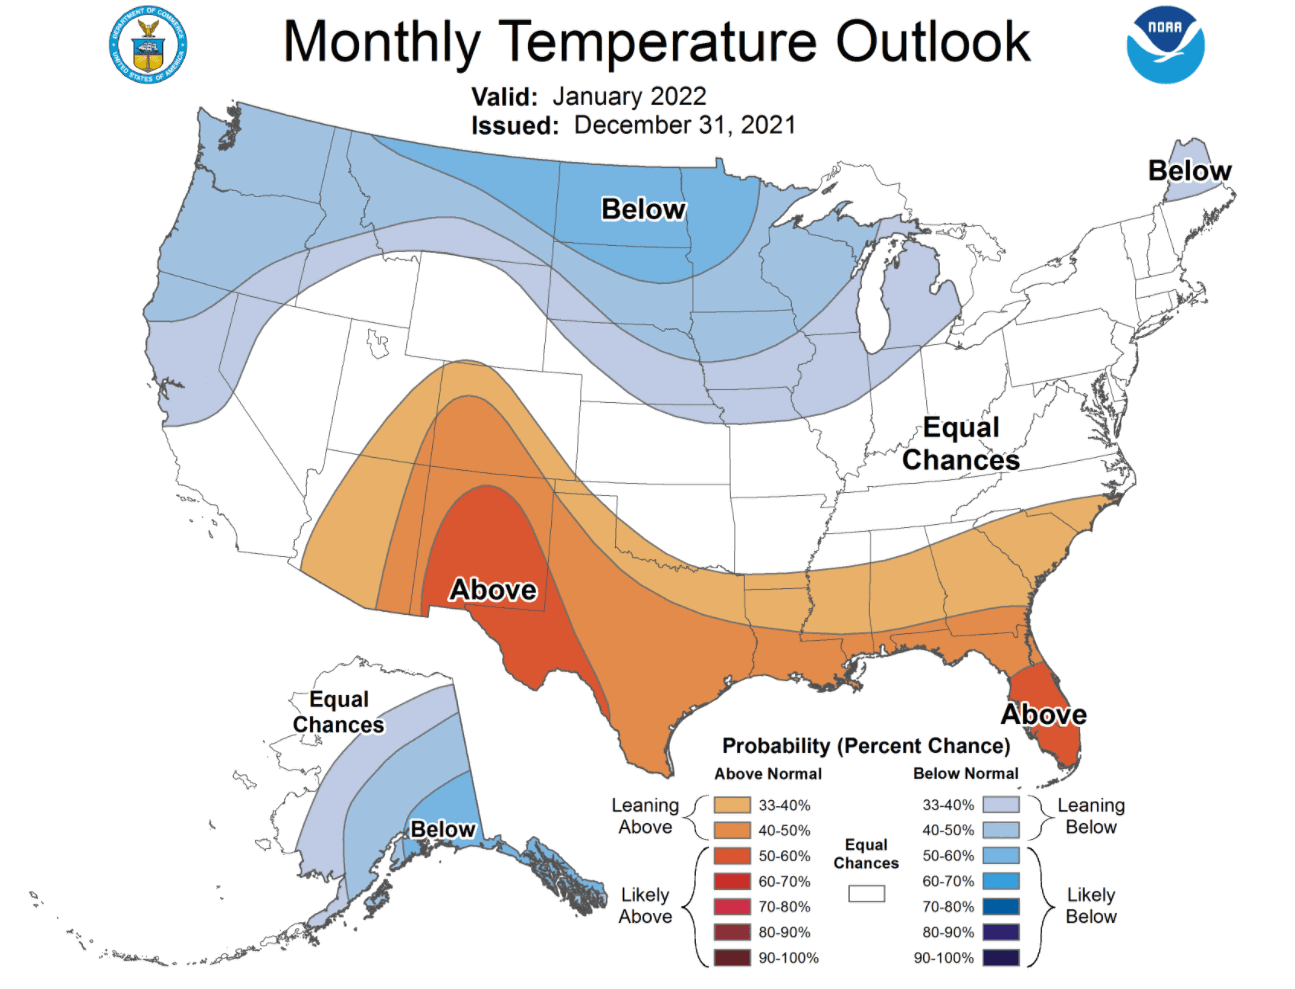
Looking at the official January temperature outlook from NOAA, we see the colder weather over much of the northern United States. Colder air is expected to also spread frequently from the northwestern United States and the Midwest into central and eastern parts of the country.
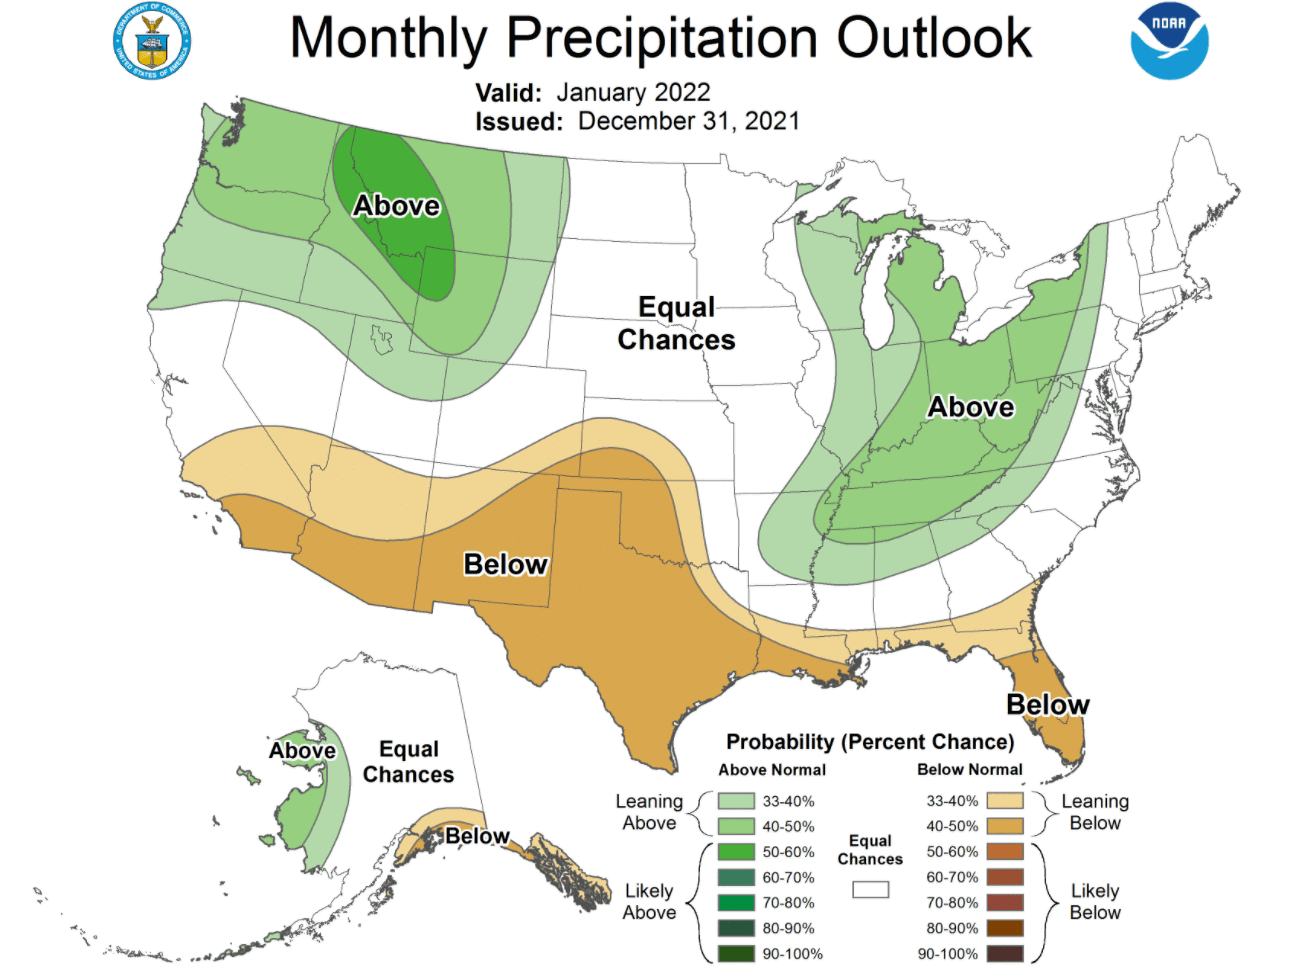
The precipitation pattern follows the colder air, as a supply of moisture is available. Colder air and moisture also mean snowfall, especially for parts of the northern and eastern United States.
FROM WINTER TO SPRING
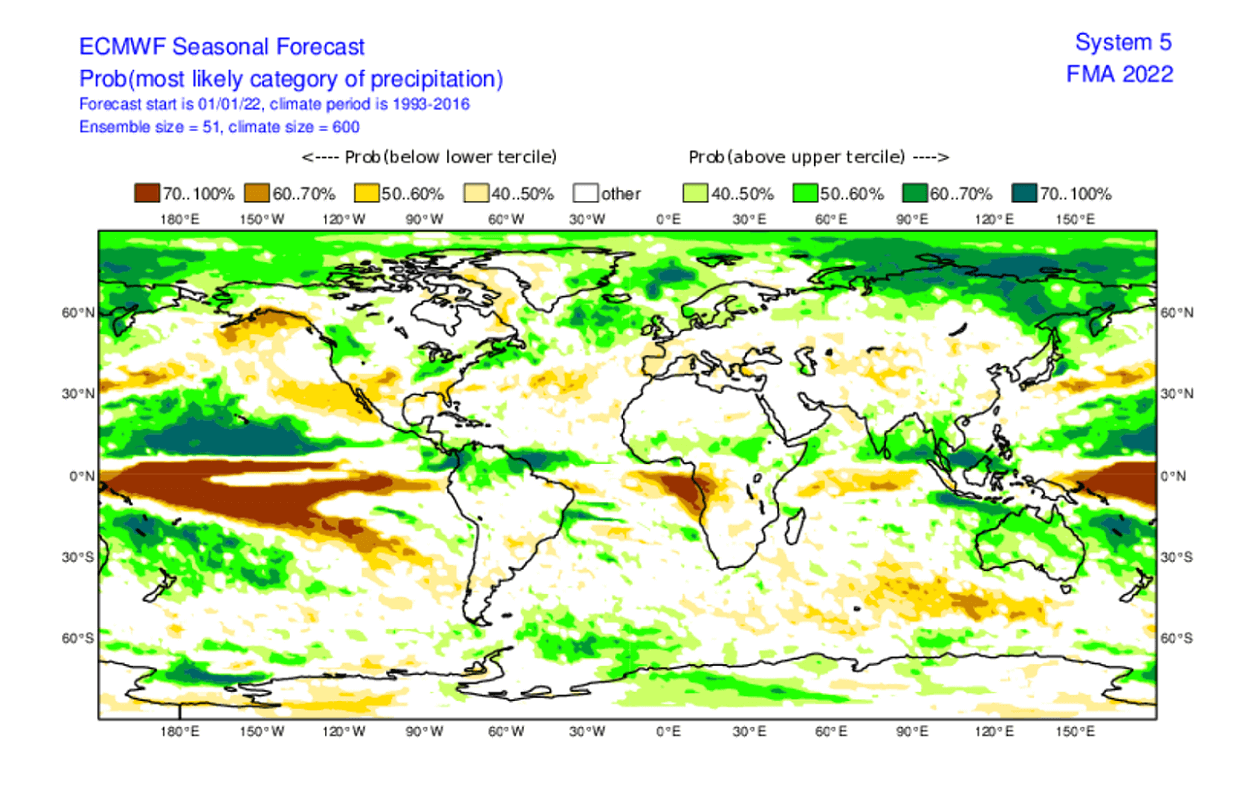
Going forward, we will be looking at the latest forecast data for the Winter-Spring transition period. The forecast was issued earlier this month by EMCWF and covers the February-March-April (FMA) period.
As we can see below on the pressure pattern forecast, the strong high-pressure system in the North Pacific is still present. That is the fingerprint of the La Nina and is likely to stay present well into the early Spring season. Notice the much lower pressure over Canada and Greenland, curving the jet stream into the northwestern United States and into the North Atlantic.

Lower pressure over Greenland helps to keep the jet stream more to the north, allowing a high-pressure area to expand over much of Europe.
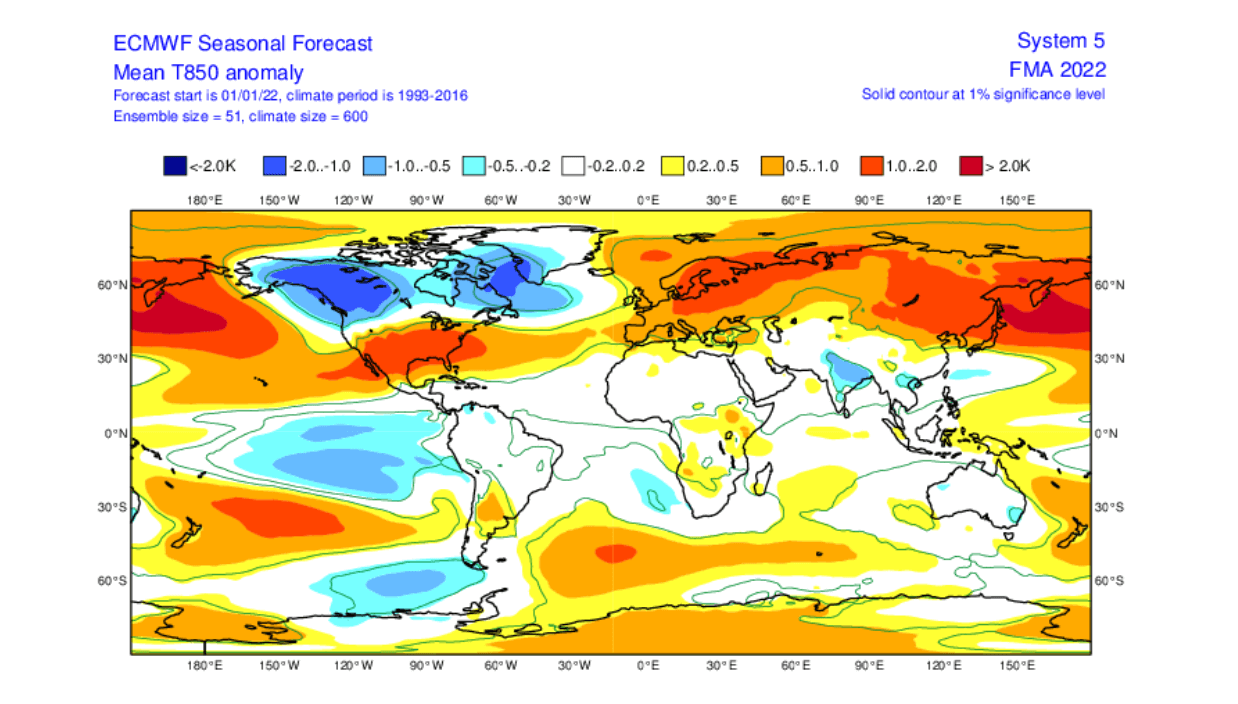
That is reflected in the global airmass temperatures, as we see a strong cold pool in western Canada. That has formed last month and is set to stay into the early Spring season. You can notice the warmer temperatures over much of Europe, which would suggest a pattern change to a more westerly flow in early 2022.
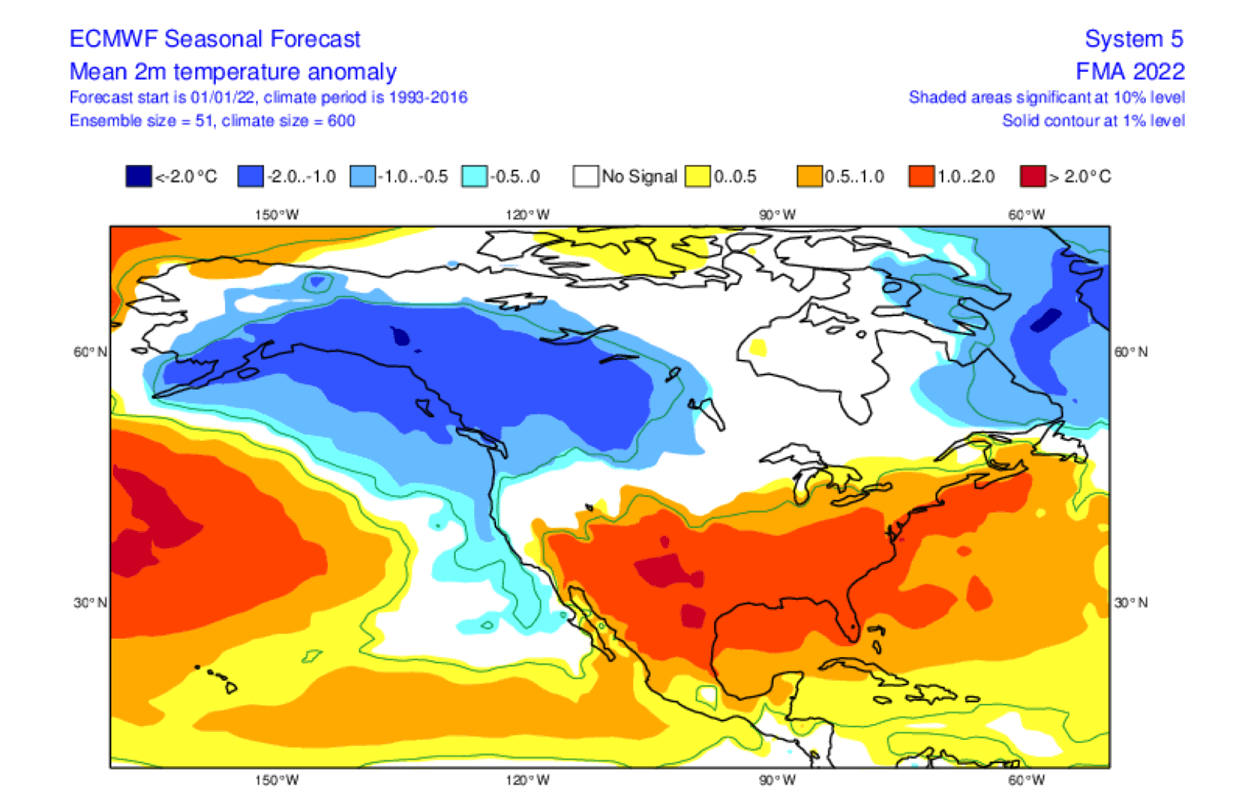
Taking a closer look at Europe, the surface temperatures are mostly above normal over the north and northeast. There is however a weaker warm anomaly over western Europe, suggesting that colder air intrusions can continue into western and parts of central Europe.
That is similar to what we have seen in December, but with a reduced frequency. These forecasts only show the prevailing or average picture over the course of 3 months, which can contain a lot of sub-seasonal dynamics.

Over North America, we see the large cold pool over western Canada and Alaska. That comes from the north flow around the strong blocking high in the North Pacific. In such a pattern, cold air can quickly spread into the midwest and the central/eastern United States, as we have seen this winter already, despite warmer than normal conditions being forecast in the seasonal average.
Looking quickly at the global precipitation forecast, we see mostly drier to normal conditions over Europe, under a high-pressure system, and wetter in the north.
Over North America, more precipitation is forecast over Canada, which is still mainly snowfall. More precipitation is also forecast over the northwestern and northeastern parts of the United States. The southern United States is forecast to have normal to drier conditions, expected for a La Nina season.
Both the actual weather and the forecast show a clear sign that La Nina is having a strong presence in the atmosphere. It will exert its influence on the late winter and early spring season in the United States and also over the entire Northern Hemisphere to some extent.
But as we go into Spring, we get to the first major severe part of the year in the United States. The Tornado Season.
ENSO AND UNITED STATES TORNADO SEASON
As history shows, La Nina can have an important influence on the Spring tornado season in the United States. And usually not in a good way. It is also partially responsible for the winter-time tornado outbreaks across the United States.
Going straight to the point, we have a very interesting image below from NOAA Climate. It shows a nice comparison of hailstorm and tornado events during the spring season in the United States, compared between El Nino and La Nina seasons.
It is interesting to see, that in a La Nina spring season, there is a substantially higher frequency of hailstorms and especially tornadoes in the southern and southeastern parts of the United States. It nicely shows the main outlines of the central and eastern parts of the Tornado Alley.

Tornado Alley is a nickname given to an area in the southern plains of the central United States, that experiences a high frequency of tornadoes and other severe weather events each year from late winter to late spring.
But why are there more tornadoes and other severe weather in the southern United States during a La Nina?
The main reason is the weather patterns that we have seen earlier above, forced by a La Nina event. It promotes a high-pressure system in the North Pacific, that usually corresponds to the pressure drop over western Canada and the northwestern United States.
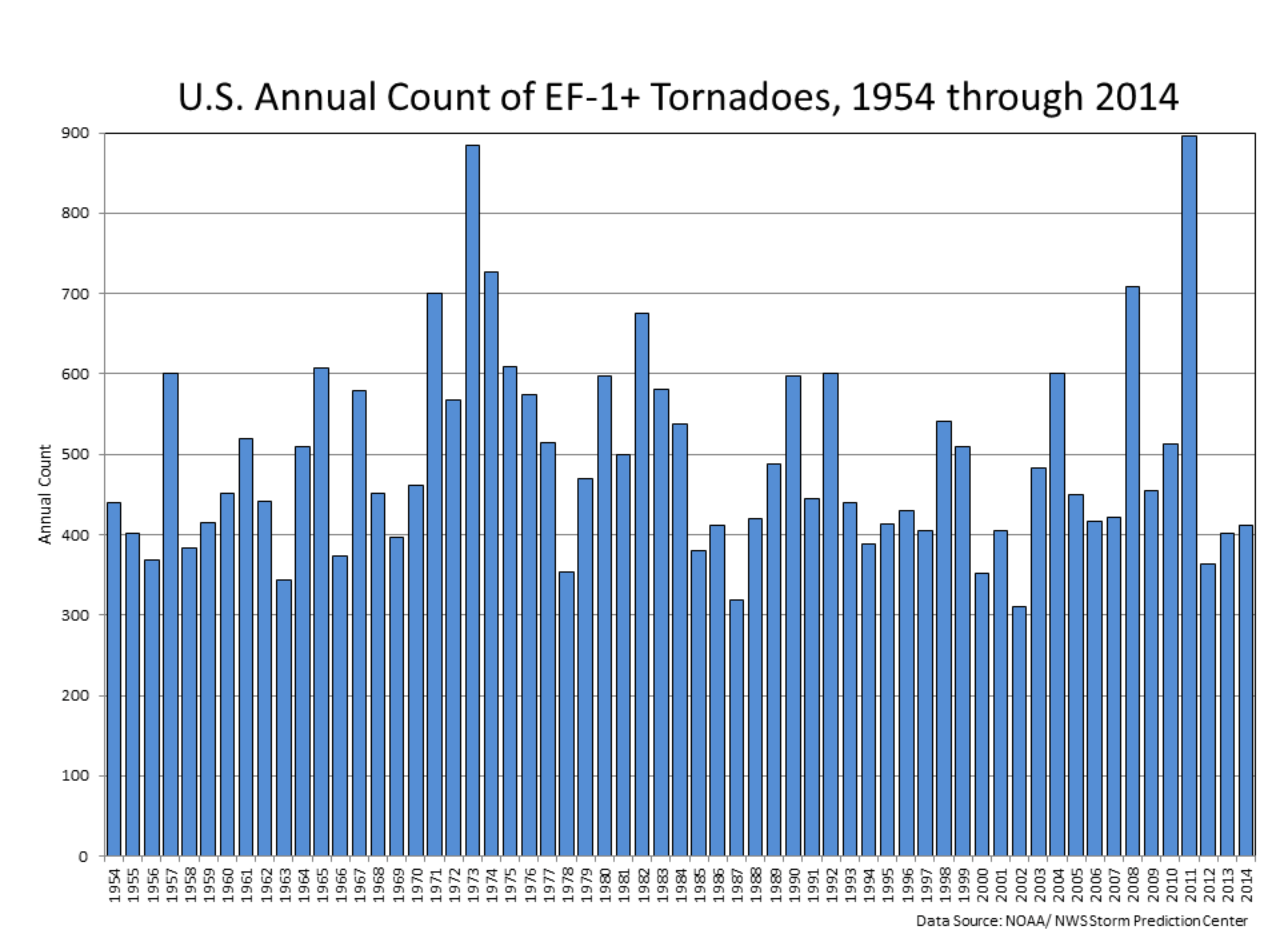
Below is a graph that shows annual tornado numbers in the United States from 1954 to 2014, which is quite a good sample size. Looking over the years, we can see that from the top 5 most active tornado years, 4 were actually La Nina seasons. At least during the main spring part, when there are most tornadoes and the ENSO still has its role in the global circulation.
But that can change quickly, and as you will now see, it will happen over the Spring season of 2022. Major changes are coming for the ENSO region, that can even resonate into the next year.
OCEAN CHANGES IN 2022
Below we have a close-up image of the ENSO regions. You can nicely see the developing cold “waveforms”, as the pressure patterns are creating strong easterly surface trade winds. They drive the wind-driven ocean surface cooling. Peak cold anomalies are now focused more towards the eastern regions.

The image below shows the temperature anomaly in the ENSO 3.4 region and reveals a stronger cooling since early October due to stronger trade winds. Peak anomalies were reached in late October, with another drop-off in December and now in January. The cooling is expected to slowly reduce this month, starting the shift into an upward trend in the coming months (warming).

The reason for the warming can actually be seen already, as it is lurking below the ocean surface in the equatorial Pacific.
Looking at the latest high-resolution depth analysis under the ENSO regions, we still see colder than normal temperatures below the surface in the east.

But a strong warm pool is coming in from the west at around 100-250m depth. This is known as an oceanic Kelvin Wave, and will slowly push out the cold anomalies, as we head towards late winter.
One way to look at the whole ENSO region temperature strength is by looking at the ocean heat content. This takes the water at depth into consideration as well, not just the surface temperatures.
Below we can see the ocean heat content. The cold anomalies have returned last Summer and also peaked in mid-October. Lately, the subsurface cold anomalies have weakened, indicating that the La Nina is likely at (or past) its peak, with the warm Kelvin Wave now spreading below the surface.

EL NINO IN 2022
You now know well what ENSO and its warm and cold phases are. So we are going to focus on its evolution over the warm season, and see what the most recent forecasts show for its 2022 development.
Below we have the ocean temperature forecast for the early 2022 Summer season, from the ECMWF. It now shows warm anomalies emerging across the equatorial Pacific Ocean (black box). This is the likely result of the current warm Kelvin wave at depth, making its appearance on the ocean surface.

This warming is in the eastern NINO3 region, for which we have a long-range forecast below from ECMWF. It shows the La Nina reaching peak cooling in January. The forecast makes a quick return to a neutral phase in Spring, with a transition into warm conditions by Summer.

But note, that the image above is for the NINO3 area which covers the eastern region. For an official warm phase to be declared, warm anomalies have to exceed +0.5 degrees in the Nino 3.4 region. And also, warm anomalies must persist on a multi-seasonal time scale.
The image below is a consolidated forecast from multiple North American seasonal models. It also shows the La Nina reaching the coldest phase this early winter season. Going into Spring, we see a return to the neutral phase (between 0.5 and -0.5), with an increased chance of an El Nino developing later in 2022.

The most recent ECMWF extended seasonal forecast actually shows the developing warm phase (El Nino), starting in late Summer 2022. ECMWF produces these extended seasonal forecasts every few months. The next extended seasonal forecast release is coming in February 2022, which will give a much better picture of what to expect for the next Fall/Winter season.

But at the same time, during the warm season, a much larger change will occur high above the equator in the tropical stratosphere. There we have a wind anomaly, so perfectly periodic, that it is often called the heartbeat of the atmosphere. So let’s go into the atmosphere, and look at the major changes coming in 2022.
THE HEARTBEAT OF THE ATMOSPHERE
Just like in the oceans, we again have a region that alternates between a positive and a negative phase. But instead of the temperatures, we are now dealing with wind, or rather its direction. This is called the Quasi-Biennial Oscillation, or just simply QBO.
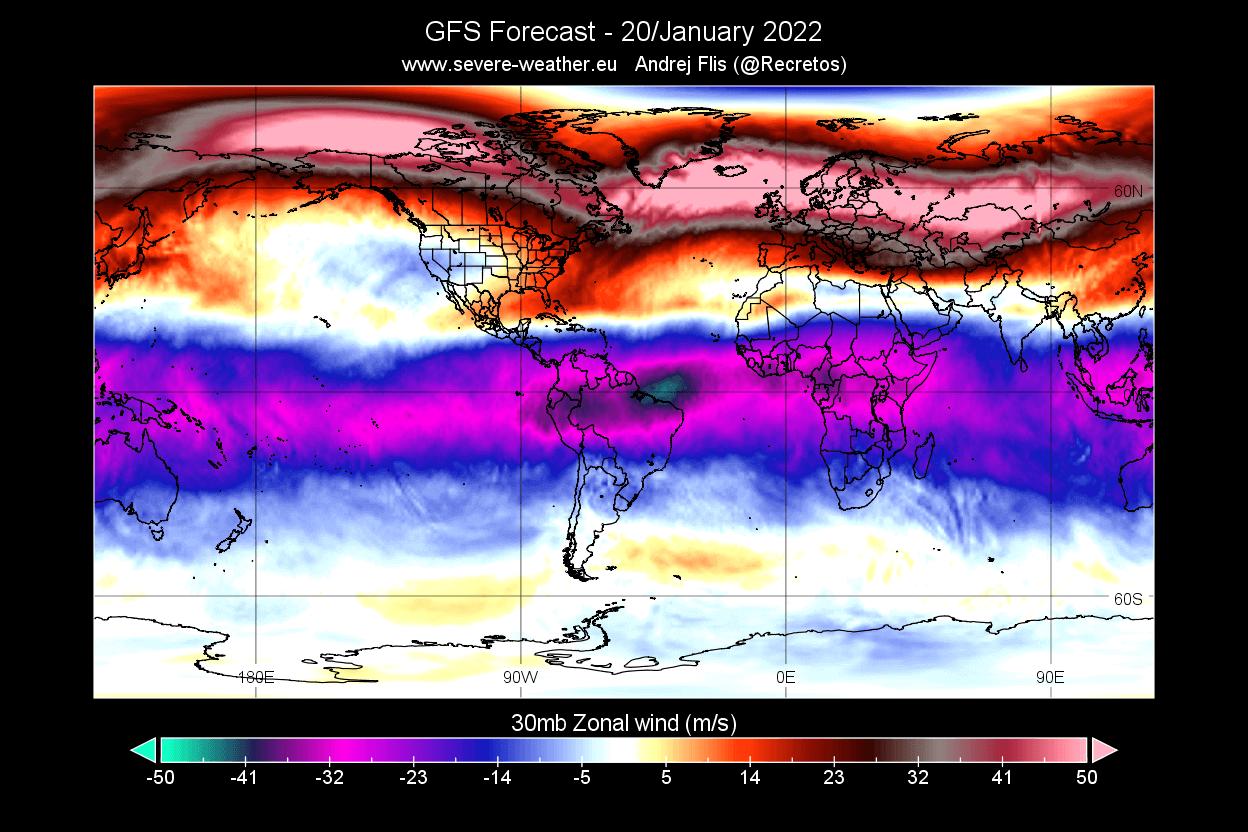
First, we need to look at the winds over the entire planet. We produced a unique image below, which is quite simple to read. It shows the global west-to-east (zonal) winds, from the south pole (-90°), over the Equator (0°) to the north pole (90°).
Positive values indicate westerly winds, while negative values indicate easterly winds. The graphic shows the winds from the surface up to around 60-65km/37-40mi altitude in the Mesosphere. We have marked a few areas of interest, that really stand out.

- BROWN box: This marks the strong easterly winds in the Southern Hemisphere. There is currently no polar vortex there, but a high pressure system is present, creating a strong wind reversal.
- BLUE box: Here we have our own stratospheric jet stream over the north pole, driven by the Polar Vortex. It is quite strong and covers pretty much the whole stratosphere.
- BLACK box: This is the “regular” jet stream as we know it, in the troposphere, at around 8-10km/5-6mi altitude. We can see that it is quite stronger than the one over the southern hemisphere. That is mainly because we are in the cold season right now in the north, so there is more energy involved with the weather systems that drive the jet stream.
- RED box: This is the main area of negative values (easterly winds) in the equatorial stratosphere. It is more important then it might look at first sight. This is the Quasi-Biennial Oscillation (QBO) above the Equator, a regular shift in wind direction from west to east.
The Quasi-Biennial Oscillation(QBO), is a regular variation of the winds high above the equator. Strong winds in the stratosphere travel in a belt around the planet at the equator. And around every 17 months, these winds completely change direction. This means that every year or so winds high above the equator change from west to east.
A wind forecast below for the 30mb level (~24km/15mi), shows this easterly wind stream above the tropical regions. It is currently in negative values, which reveals that easterly winds are prevalent. This means that the QBO is in the east mode. We can see a large belt of these negative (easterly) winds around the globe.
The regular cycle of the QBO can be seen in a quite simple image. Below we see the zonal (west-east) winds in the stratosphere above the equator over time. It is obvious right away that this is a very regular shift from west winds (positive values) to the easterly winds (negative values). Each phase is descending slowly over time, being replaced by a different phase over time.

This shift from west to east winds is so regular, that it gave QBO the nickname “heartbeat of the atmosphere“. Each phase slowly descends down over time, from the middle stratosphere around 10mb (~30km/18.5mi) down to the top of the troposphere around 100mb (~17-18km/11mi). As one phase is active, a new one already starts to descend slowly in the higher levels.
Below we have a special graph, that shows the zonal wind anomalies for the past 40 years at around 24km/15mi altitude. It nicely shows just how regularly this wind shifting really is. It truly is like watching an actual heart pulse, just that it is of the atmosphere.

Looking more closely at the past 3 years, we can see how each phase descended over time. A west phase was active in 2019, and a weak negative in 2020. It was followed by a positive QBO phase during last winter. Currently, a negative QBO phase is active, with a new positive already starting to appear at the very top. The image below is from NASA analysis.

A radiosonde analysis from Singapore also shows the wind direction above the tropics. It reveals the easterly winds around the 15-50mb level, confirming the east QBO phase is currently active. But notice on the image below, that on the 10mb level, a new westerly wind phase has appeared, ready to move down again during 2022.

Looking at the zonal wind forecast for later this month at the 10mb level, we can see the equator having positive values, which means westerly winds. That is a stark contrast to the 30Mb level, that was shown above, which currently has a full-blown east QBO in progress. These westerlies higher up at 10mb are just an early indicator of what is to come.

We produced an image from the latest seasonal weather forecast data. Below is the forecast for the QBO, showing global zonal winds over the equator. Notice the west QBO starting to descend down around Spring. As we reach Summer, we are fully in a west (positive) QBO phase and a new negative starting above for 2023.
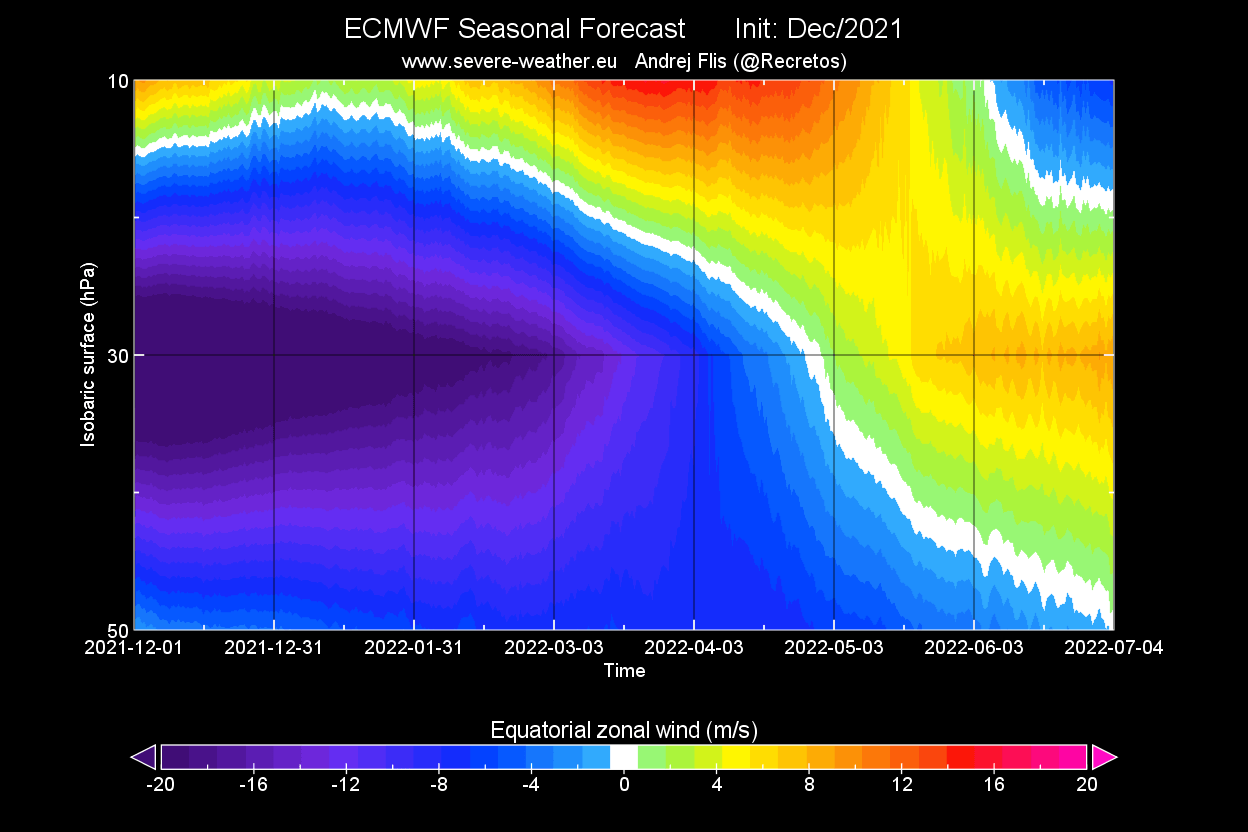
This is an important change that can/will affect the global weather down the line in 2022. It is also another major difference with 2021, which featured an east (negative) QBO in its cold season, that is still ongoing.
The QBO is an important part of weather development in winter, as it can affect the North Atlantic jet stream. The speed of the winds in the Atlantic jet stream can weaken or strengthen with the direction change of the QBO. The jet stream is an important atmospheric feature that shapes our weather.
Depending on the QBO, the risk of winter conditions across the Northern Hemisphere can differ, by each of the phases:
- When the QBO is easterly, there is an increased chance of a weak jet stream, sudden stratospheric warming events, and colder winters in Northern and Central Europe and the United States.
- When the QBO is westerly, the chance of a strong jet, a mild winter, winter storms, and heavy rainfall increases.
There is more than one reason why QBO can influence our Winter weather. One very important aspect is of course the Polar Vortex, which is why we mentioned QBO in this article in the first place. The image below shows the connection between the east QBO and the Polar Vortex in the December-January winter period.

It might seem complicated, but the main takeaway is that the QBO helps with the overall tropical forcing, including the ENSO. That is why a QBO does not mean a fixed weather situation, as a west QBO response for example can be different during a La Nina or an El Nino.
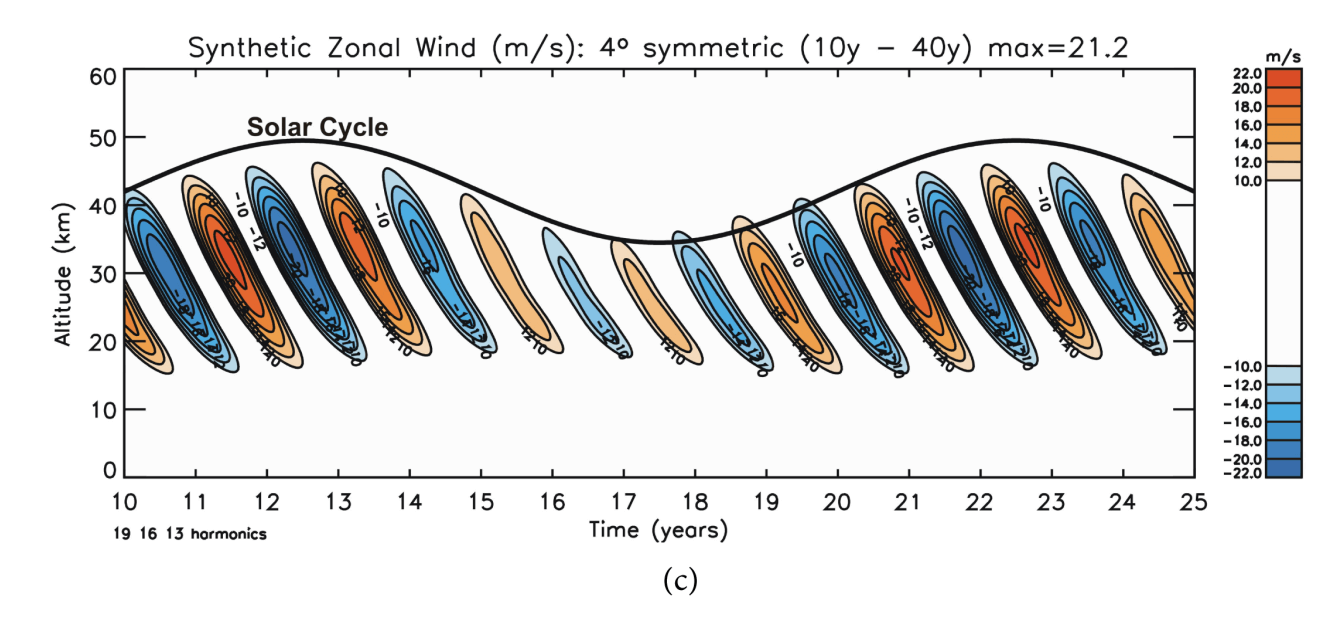
But, being over the Equator, the QBO is directly connected to the higher levels of the atmosphere, and the solar activity. On the image below, we have a simulation from a recent study. It shows the simulated QBO phases, descending over time, as we showed you above. But it is nicely seen how it can change with the Solar Cycle.
SOLAR CYCLE 2022
The solar cycle lasts 11 years. It is actually a cycle of the Sun’s magnetic field, where the Sun goes through a magnetic pole reversal, flipping north and south magnetic poles. That causes all kinds of activity and anomalies in the Sun’s magnetic field, which can be easily observable on the Sun’s surface as an increase in sunspot numbers.
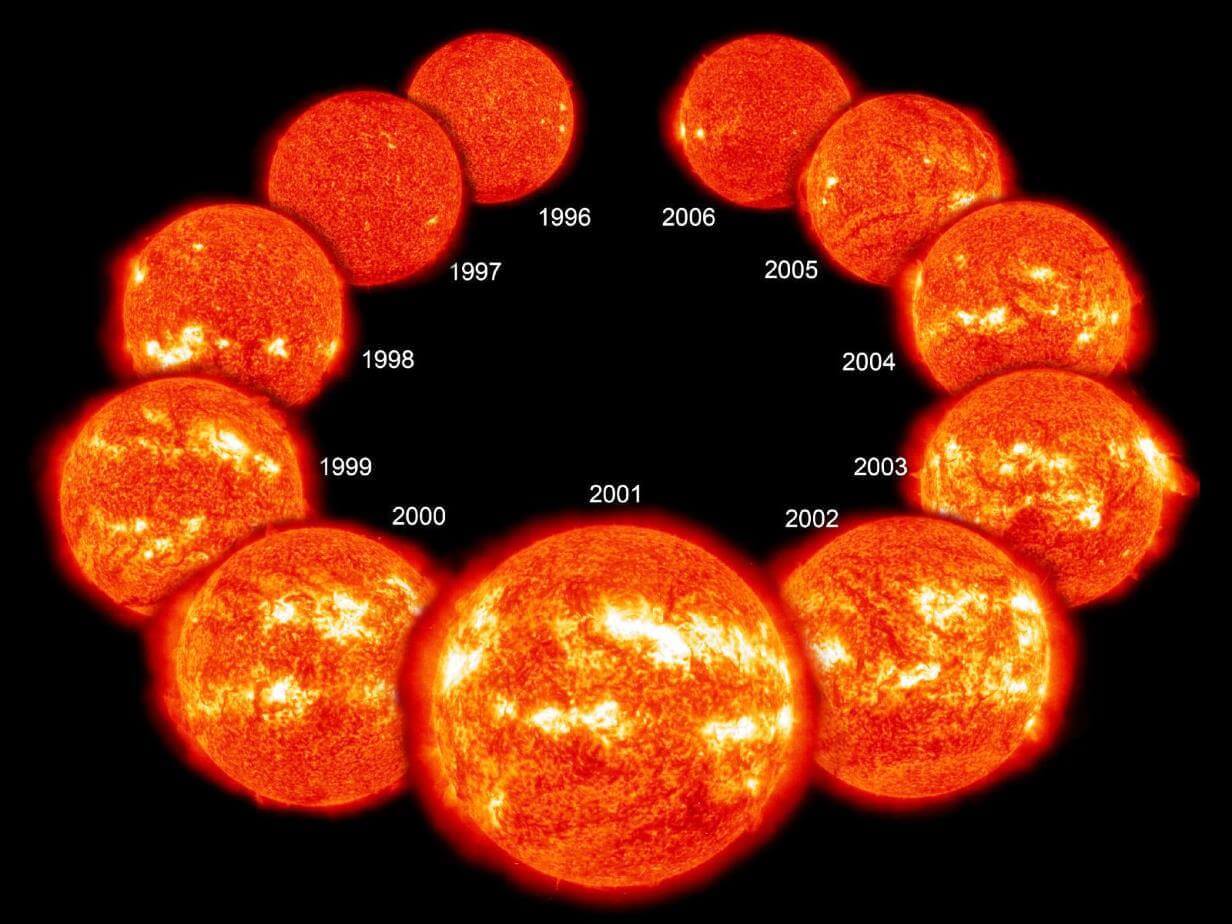
We can see an example of a full solar cycle on the image below, as the sun goes from a minimum to maximum activity, and back to a minimum.
Below we can see the solar cycles through the last decades, and the current solar minimum. The solar cycle is observed by the total sunspot numbers (SSN). We reached a final minimum of the solar cycle 24 in 2020, and we began a new solar cycle 25 at that point. Notice how the recent solar cycles are generally weaker compared to the earlier ones.

Looking closer at the last few years, we can see even better how last year, in 2021, the solar activity picked up again, now continuing into 2022. At this point, we will not be able to talk about a solar cycle minimum anymore, but a decent path towards a new maximum.

There was a lot of talk about the sun entering a new grand minimum. A grand minimum means an unusually long phase of low solar activity, and global weather changes as a result like it happened during the Maunder Minimum. Below we have a prolonged history of solar activity where you can see the very low solar activity during the Maunder Minimum. That period was better known as the “little ice age”, as global temperatures dropped in response.
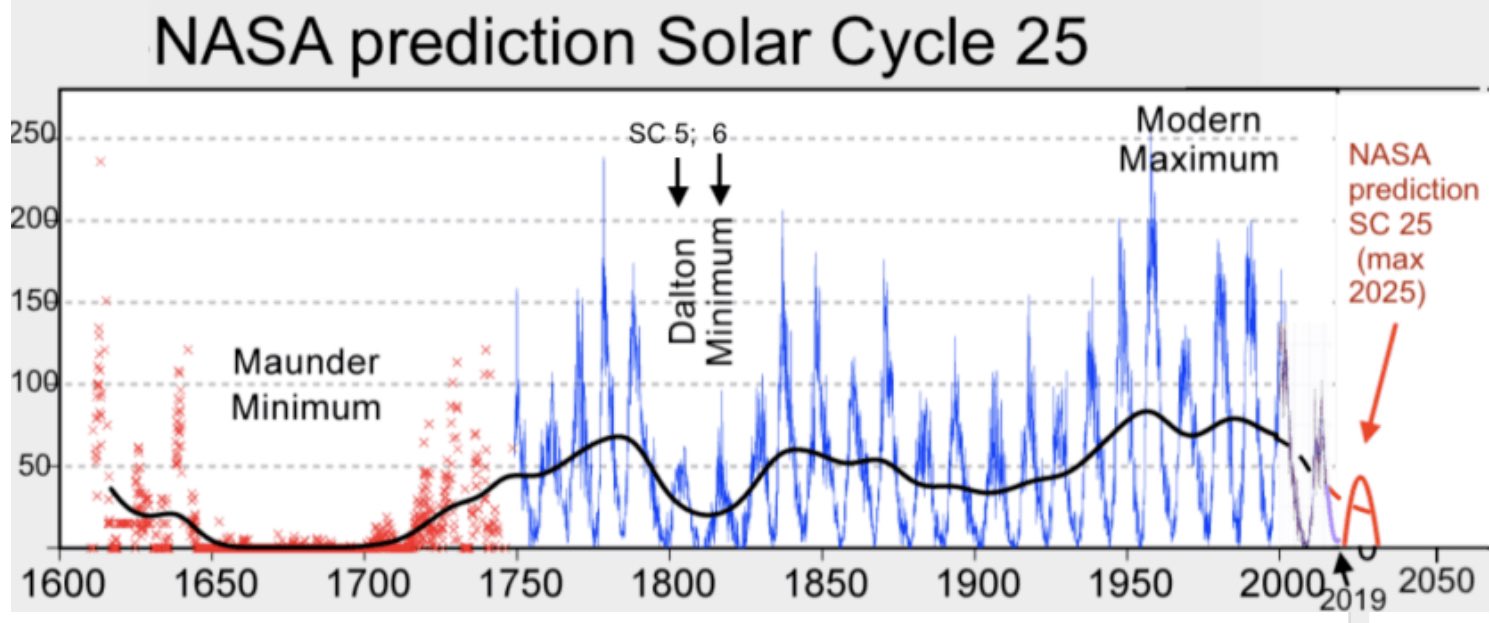
Of course, a new grand minimum does not start in one year, tho we are seeing each new solar cycle being weaker than the previous one. This can be an indication that we are heading towards a new grand minimum, but it can also be a Dalton minimum type, like seen on the image above in the early 1800s.
A Dalton minimum was not as low and long-lasting as a Maunder Minimum but also had a global weather response, particularly in a global temperature drop. Altho a smaller one compared to the “little ice age” of the Maunder Minimum.
But, these temperature drops usually happen because of the overall reduced output of the sun on a prolonged multi-year scale. For daily weather, a single solar cycle does not have a direct influence. But as we have seen above, it is linked to the QBO, and the QBO is linked with the stratosphere and the polar vortex, so there is a linkage to the weather in some way.
Still, the QBO and the solar activity and don’t run the weather on their own. Considering that the QBO is in the tropics, there is a strong linkage to the ENSO, that we have mentioned already above. ENSO also has its own influence on the winter weather patterns, which we will look at next.
WEATHER OF THE EL NINO
Generally, ENSO exhibits an important influence on the Jet stream in the Pacific Ocean, and consequently also downstream and upstream around the Northern Hemisphere.
During the El Nino winter season, we have a strong and persistent low-pressure area in the North Pacific. That pushes the polar jet stream further to the north, bringing warmer than normal conditions to the northern United States and western Canada. The southerly Pacific jet stream is amplified, bringing storms with lots of precipitation and cooler weather to the southern United States.

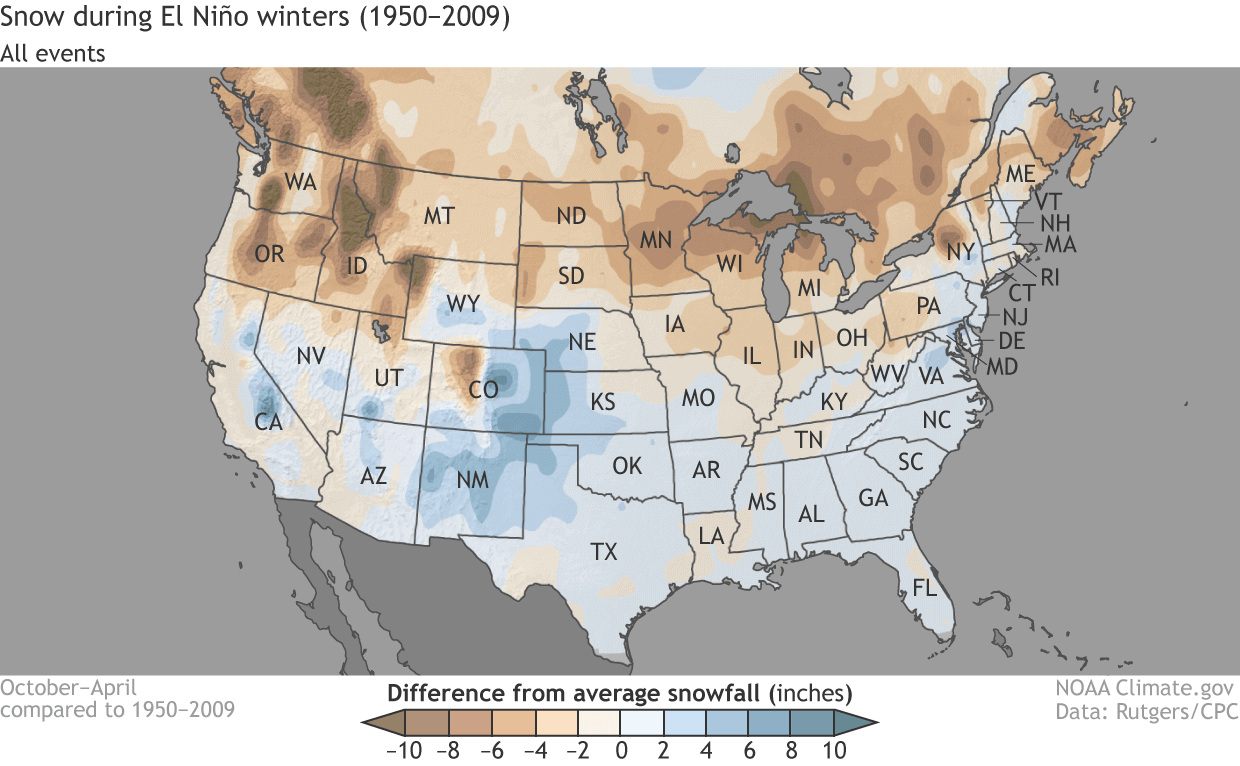
Looking at the average snowfall for an El Nino winter, we can see that there is less snowfall in the northern United States during the El Nino seasons. The conditions are mostly warmer than normal and drier than normal in the north. But there is more snowfall in the west-central United States and in the parts of the eastern United States, where cooler weather can be found.
After the jet stream passes over Canada and the United States, it moves into the North Atlantic, There it can take many different paths towards Europe.
A lot depends on the existing pressure systems in the North Atlantic. This is where ENSO generally perhaps loses its direct influence over Europe, as regional systems in the Atlantic are a major interference to any direct influence.
But it usually still plays an important role, as it changes the position of the entering jet stream from the west. The outcoming jet stream can then merge with the systems in the North Atlantic, helping to create a whole new weather pattern for Europe.
Typically, the main problem is that the final outcome is far more unpredictable in this zone than over North America, which feels a much more direct and predictable influence.
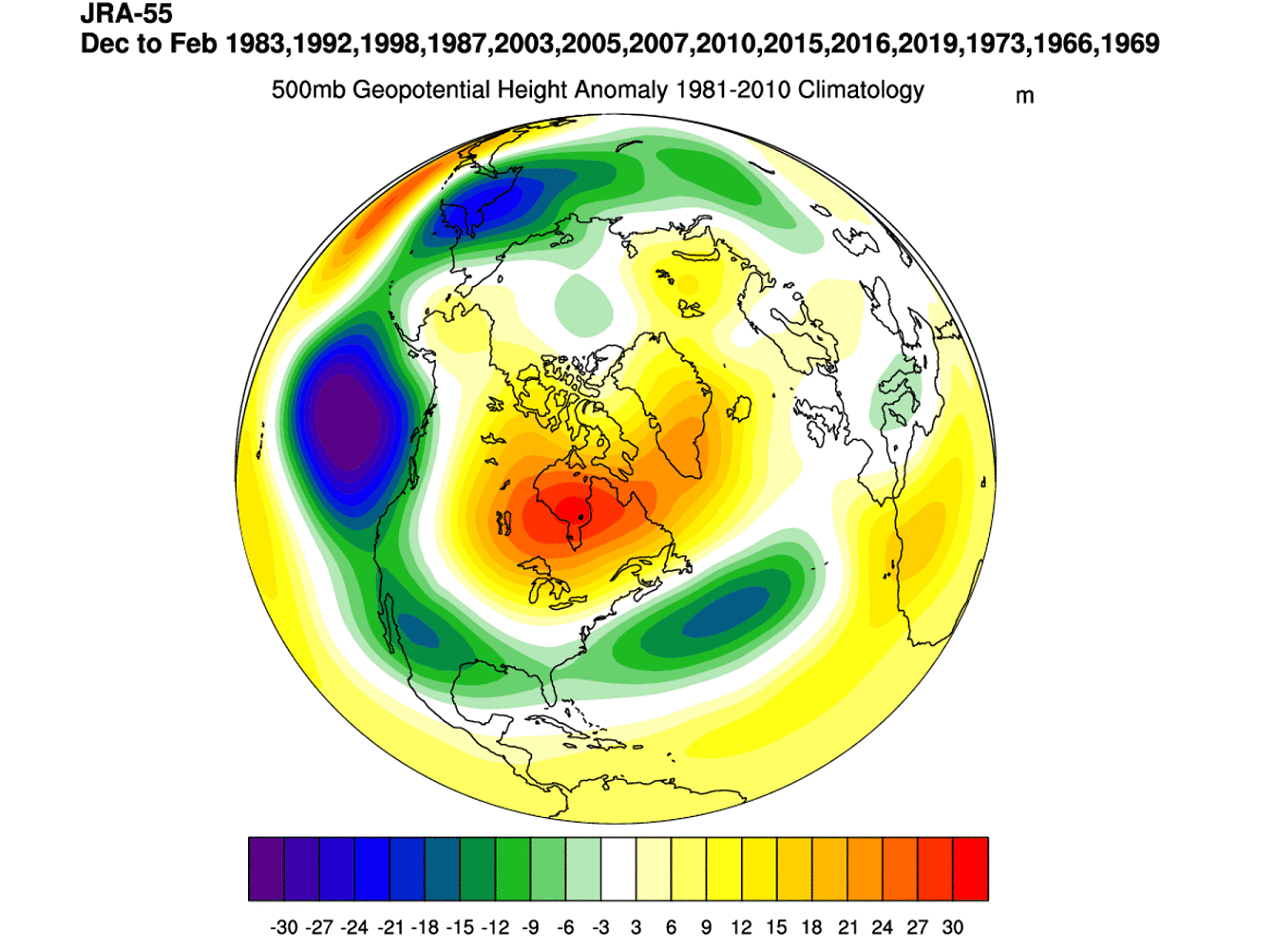
Below we can see the average pressure pattern from all the El Nino winters in the past 56 years. We see the typical low-pressure area in the North Pacific and also over the southern United States. As a contrast we have a high-pressure area over eastern Canada and Greenland, going for a negative North Atlantic Oscillation pattern.
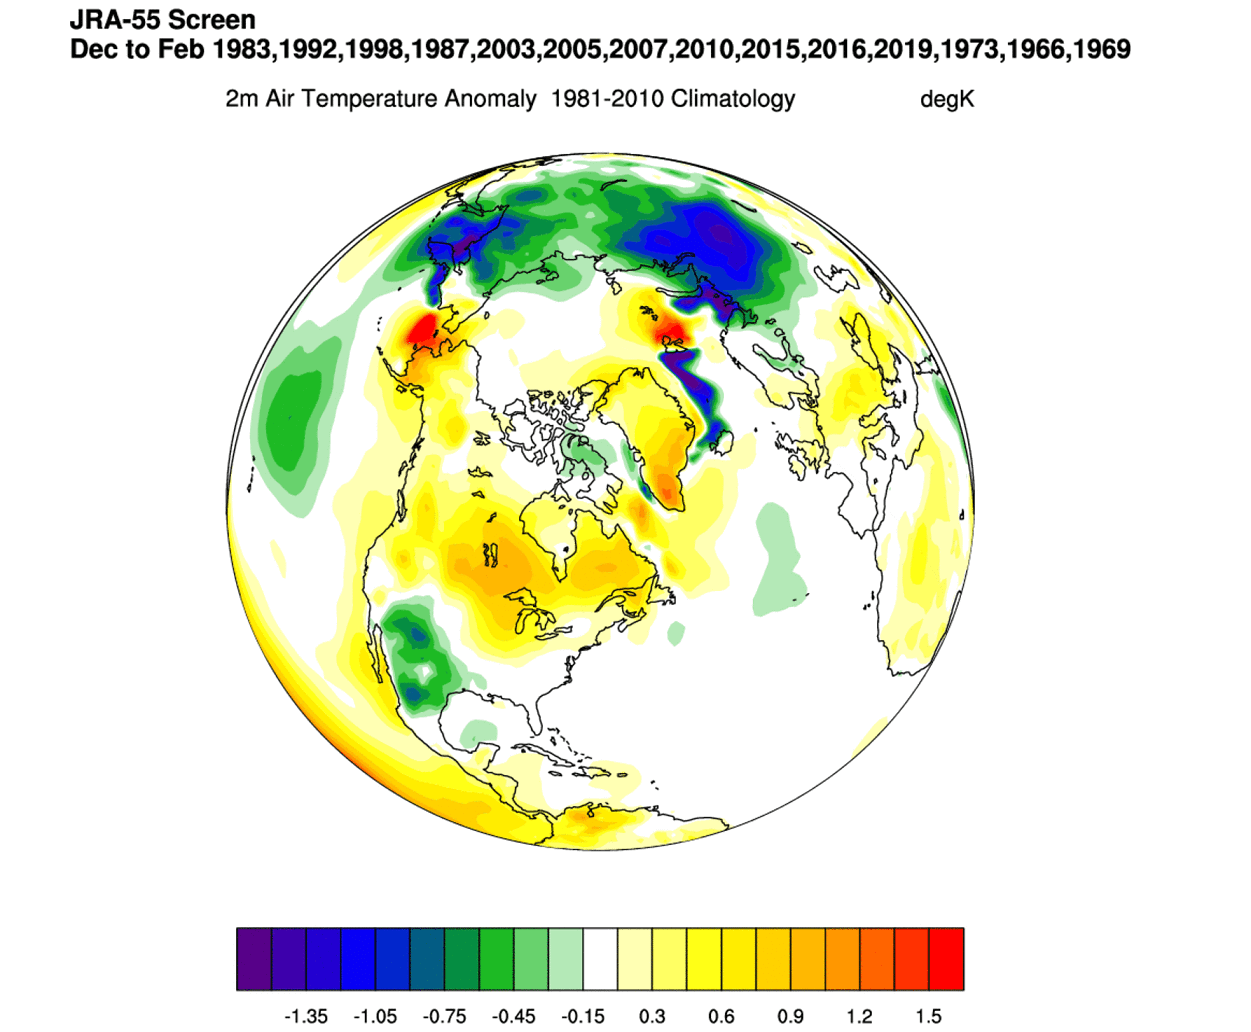
The temperature pattern from the same years shows the warmer than normal temperatures in Canada and the northern United States. Cooler conditions are prevalent in the southern United States, under the amplified Pacific Jet Stream.
But no two years ever have exactly the same weather, and there are a lot of other factors that also play a role. We have already learned about the QBO and the Solar Cycle is a combination of other influences.
So if we now summarize, we have the changing ocean anomalies, going from a cold ENSO to a warm one, an El Nino. Then we also have a major change in the tropical stratosphere wind phases, going from east to west, also modified by the increasing solar cycle activity.
Everything comes together in winter when the Polar Vortex returns and nicely connects all these factors together. It can be found from the ground up into the high levels of the stratosphere. It is influenced by the pressure patterns of the El Nino from below and interacts with the high atmospheric patterns of the QBO.
But what is this polar vortex, and why is it such a crucial piece of the weather puzzle in any year? Our journey will end with the final key piece of 2022, which is the Polar Vortex, which reigns in the cold season.
NORTH HEMISPHERE POLAR VORTEX
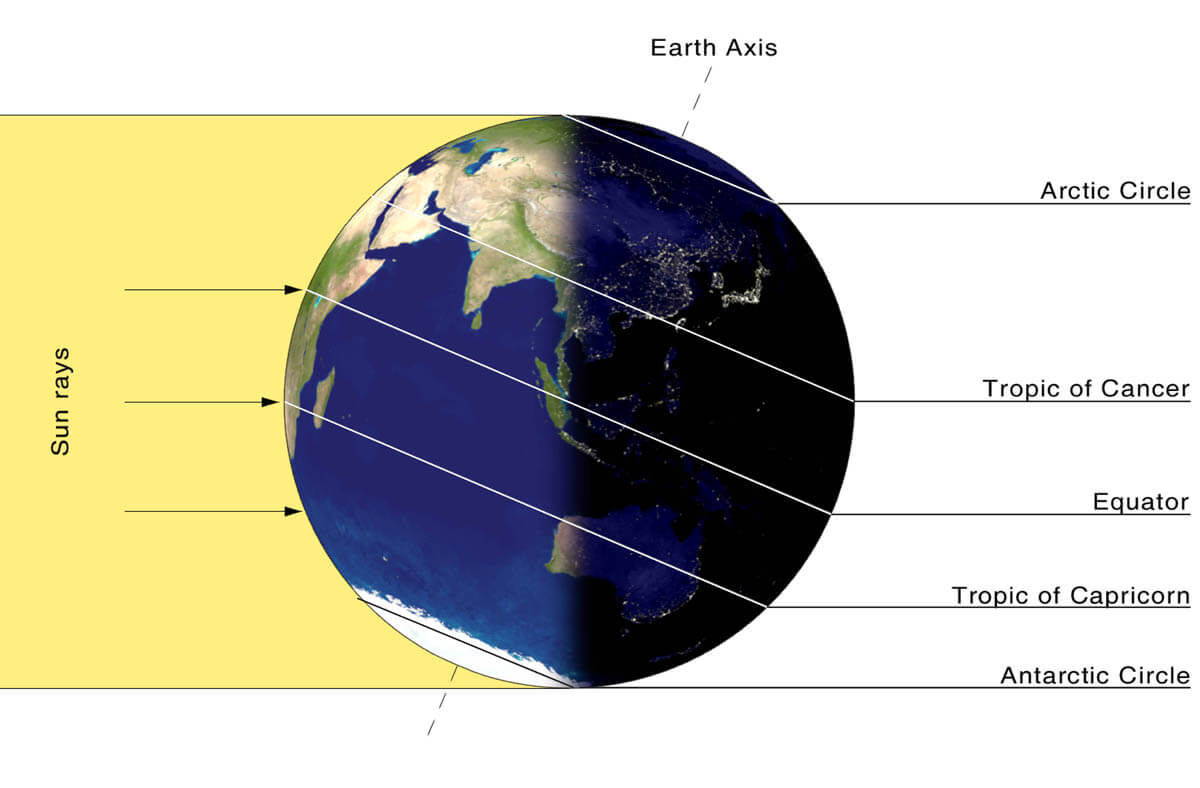
Every year as we head into autumn, the polar regions start to receive much less sunlight and sun energy. This means that the north pole starts to cool down. But as the polar regions are cooling, the atmosphere further south is still relatively warm as it continues to receive energy from the Sun. You can see the winter solstice on the image below when the northern regions receive the lowest amount of solar energy, compared to regions further to the south.
But, as the temperature begins to drop over the polar regions, so does the pressure. With colder temperatures over the pole, the temperature difference towards the south increases. This also causes a pressure difference as a large low-pressure (cyclonic) circulation starts to develop across the Northern Hemisphere from the surface layers, far up into the stratosphere. This circulation is known as the Polar Vortex.
While the stratospheric polar vortex is spinning high above our weather, it is still directly connected to the lower part and can shape our daily weather in one way or another, as one large hemispheric circulation.
The image below shows a typical example of the stratospheric Polar Vortex at around 30km/18.5miles altitude (10Mb level) around the middle stratosphere during the winter season.
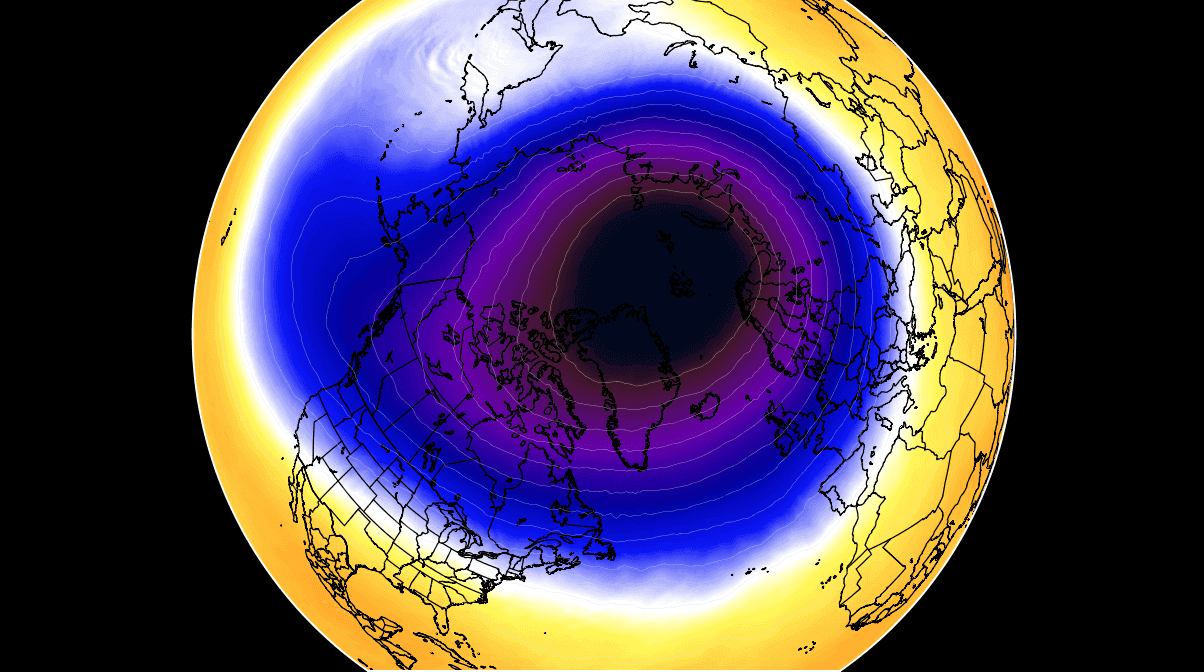
It is basically like a very large low-pressure system, covering the whole north pole, down to the mid-latitudes. It is strongly present at all levels, from the ground up, but can have quite a different shape and power at different altitudes.
The next image below will show you the polar vortex at a much lower altitude, around 5km/3miles. It reveals the true shape and size of the polar vortex closer to the ground (cold colors). The closer to the surface we get, the more deformed the polar vortex becomes. That is because of the increased terrain/ground influence and the dynamics from many weather fronts and systems.
Be aware of its cold “arms” extending from the polar vortex into the lower latitudes. That can bring along much colder air and snowfall. These arms also pack a lot of energy and can create strong winter storms, either Noreasters in the United States or a powerful wind storm in the North Atlantic.

We are currently focusing mostly on the Stratospheric Polar Vortex, as it plays a very important role in the weather development throughout the season. It is known for its strong influence down from the stratosphere, in either direction, for a cold or warm winter.
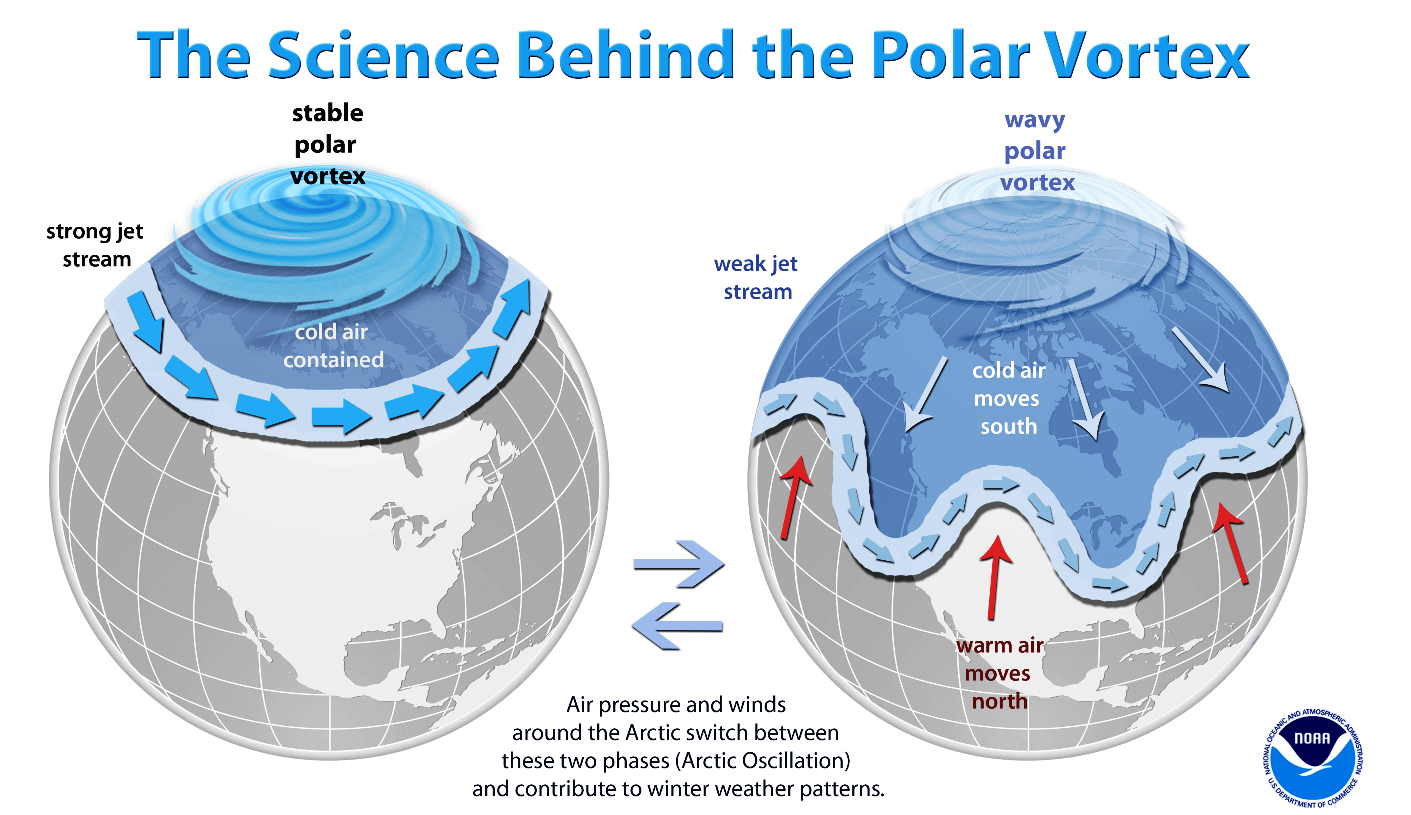
A strong polar vortex usually means stronger polar circulation even in the lower levels of the atmosphere. This often locks the colder air into the Polar regions, creating milder winter for most of the United States and Europe. On the other hand, a Polar Vortex breakdown is just as intense as it sounds. Higher pressure pushes down from the stratosphere into the Polar Circle, weakening the circulation. That can push the colder air out of the polar regions, into the United States and/or Europe. Image by NOAA.
Typically, a polar vortex circulation collapses due to a rise in temperature in pressure in the stratosphere. That is called a Sudden Stratospheric Warming (SSW) event. And as the name suggests, it is a sudden rise in temperatures in the stratosphere.
But there can also be smaller warming waves in the stratosphere, that do not collapse the polar vortex. Instead, they can sometimes displace or disrupt the polar vortex enough to weaken its influence on the surface levels. That can allow other drivers to take over more strongly, creating a different weather pattern.
WINTER STRATOSPHERIC WARMING EVENT
A major polar vortex disruption/collapse is officially named as Sudden Stratospheric Warming event (SSW). It is a sudden rise of temperatures in the polar stratosphere during the cold season, as the name suggests. Warming of the stratosphere means that the polar vortex is weakened, and can also collapse under the rising pressure during a prolonged warming event.
The source of the warming usually comes with the energy from the lower layers, as strong weather systems can actually deflect a lot of energy upwards into the stratosphere, disrupting its dynamics.
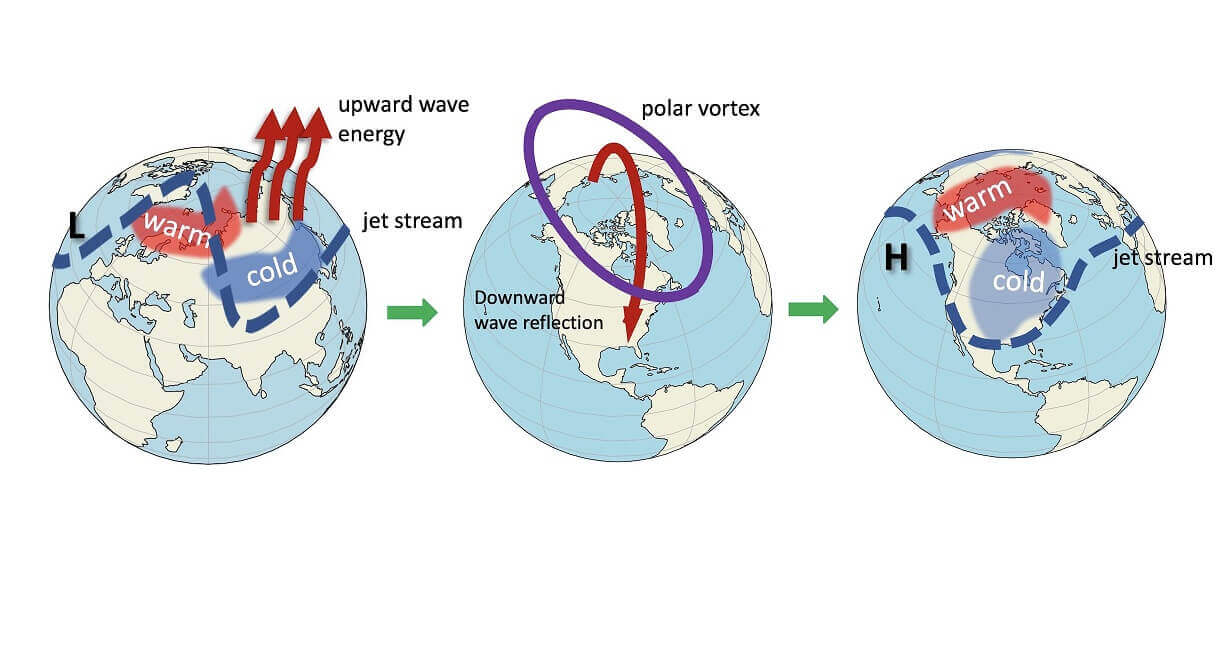
On the image below you can see the vertical wave propagation example. First, we have strong weather systems that deflect a lot of energy upwards into the stratosphere. Later, that energy can disrupt the polar vortex, creating a warming event and collapsing the polar vortex circulation. The collapsed polar vortex sends the energy back down, changing the surface weather patterns by altering the jet stream location.
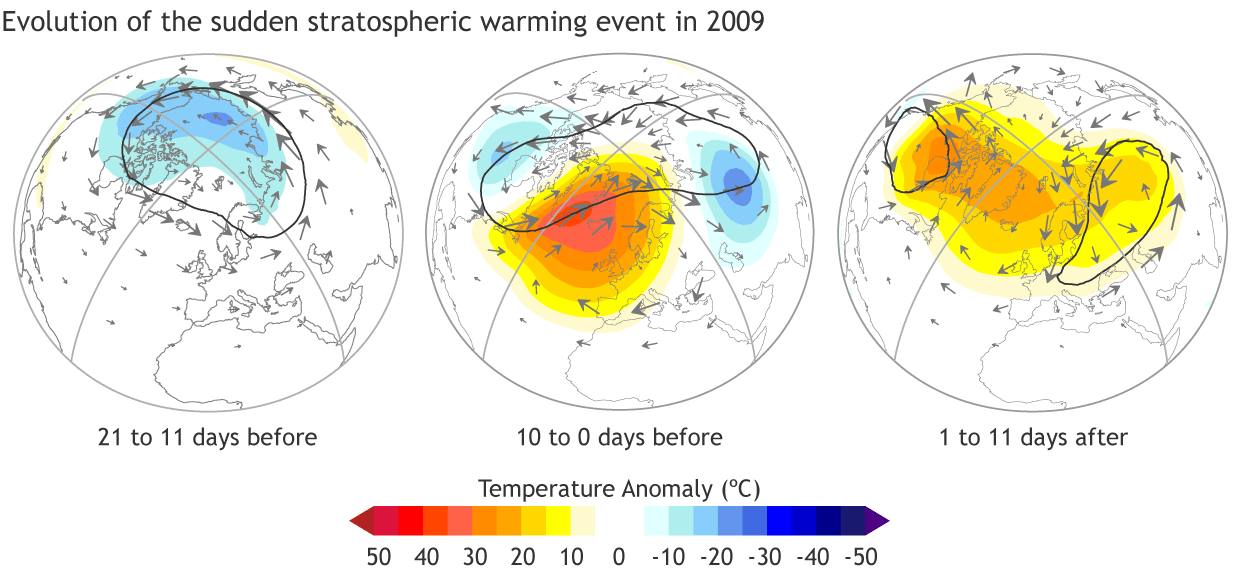
Such disruption creates a chain reaction, that can shift the jet stream by building a high-pressure area over the Arctic circle. That can later release the cold arctic air into Europe and the United States. Below we have an example of the start and progress of an SSW event that actually happened in 2009.
Prior to the SSW event, the polar vortex was colder than normal and had good circulation. Then a high-pressure area began building from the North Atlantic. It introduced warmer temperatures (stratospheric warming), and it also broke into the stratospheric circulation. It completely broke the polar vortex apart, sending a wave of higher pressure down to the surface.
If we combine all Stratospheric Warming events in the past decades and look at the weather 0-30 days after these events, we get an interesting, but perhaps an expected weather picture.
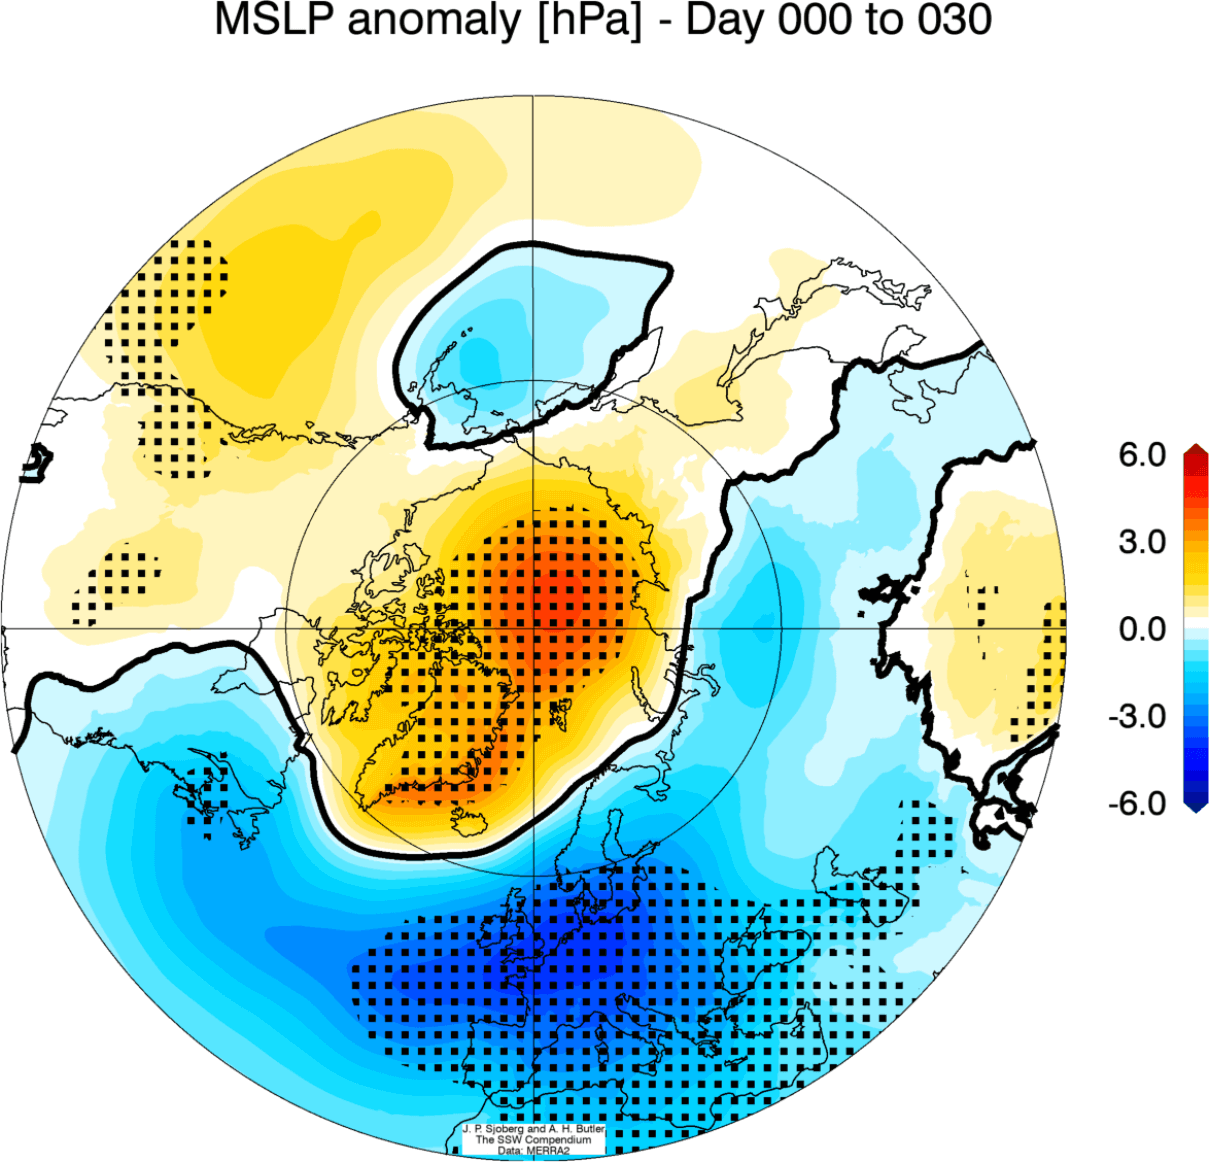
We can see the average pressure anomalies below 0-30 days after an SSW event. It shows the pressure rising over the polar regions, following an SSW event. Pressure tends to drop over Europe and the western Atlantic. This is a heavily disrupted circulation, that helps to create a free path for colder polar air to move out of the polar regions.
Below we have the corresponding average temperature 0-30 days after an SSW event. Most of the United States has a colder signal, including Europe and Siberia. Note: this is an average picture of many SSW events. Each individual warming event is different and does not automatically mean a strong winter pattern by itself. Eastern Canada has warmer than normal weather, as it is influenced by the expanding high-pressure system.

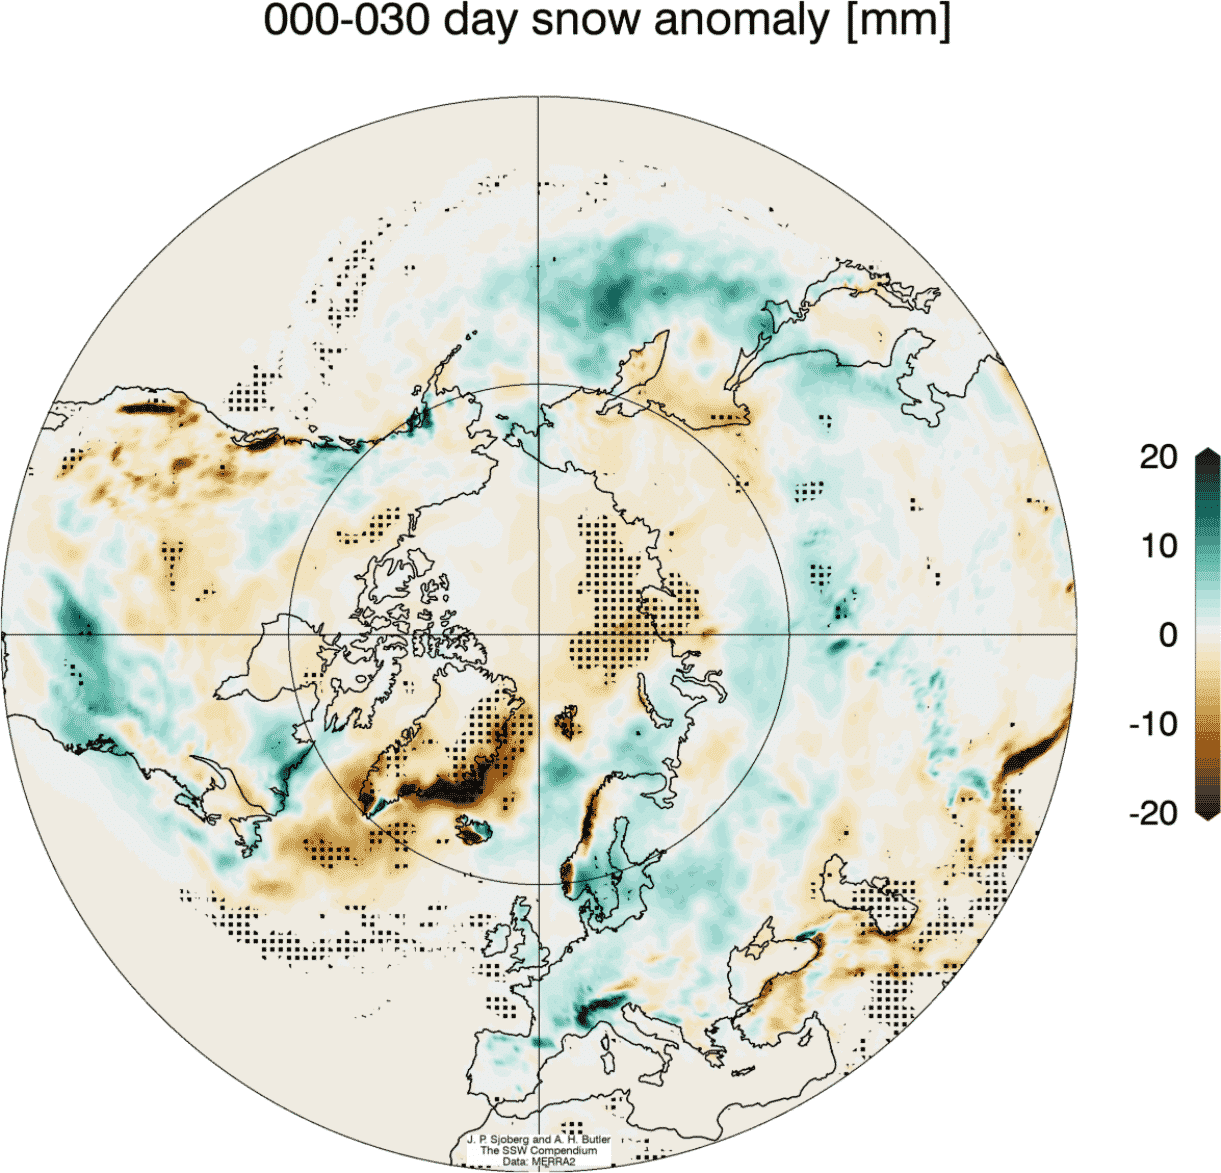
Looking at the snow anomalies below, we can see the above-average snowfall over much of the eastern United States and also Europe. This is an expected response after major warming events, as the colder air has an easier path towards the south and into these regions, provided that enough moisture is available.
Research shows, that from all the ENSO phases, the El Nino has the highest historical chance of producing an SSW event. That is due to the unique weather pattern it helps to set up, which can deflect a lot of energy upwards. Of course, the El Nino is no guarantee that an SSW will occur, but it is more likely to produce one, based on historical data.
We will release regular weekly and monthly weather updates for the ongoing winter season and as fresh forecasts and data are available, so make sure to bookmark our page. Also, if you have seen this article in the Google App (Discover) feed, click the like button (♥) there to see more of our forecasts and the latest articles on weather and nature in general.
SEE ALSO: