The transition into Summer 2026 is being defined by rapid, significant changes in the oceans and the atmosphere. Latest oceanic analysis and forecast data confirms that the El Niño is developing faster and stronger than initially projected, with subsurface anomalies now suggesting this event is on a direct trajectory toward Super El Niño status by the second half of the year.
This global weather shift is being driven by a powerful oceanic Kelvin wave that has intensified in recent weeks, effectively ending the multi-year La Niña influence. As this warm anomaly surfaces, it will trigger a shift of the global jet stream, with the latest long-range models now showing a stronger El Niño signature in the Summer 2026 pressure patterns than was visible in earlier updates.
In this updated Summer 2026 Forecast, we analyze the latest data from the ECMWF and UKMO systems to reveal a shifting seasonal pattern. We look at the potential for controlled temperatures in the Eastern United States, the rising drought risk in Central Europe, and how this surging Pacific anomaly will act as a natural shield during the 2026 Atlantic Hurricane season.
ENSO Cycle: The Transition from La Niña to a Strong El Niño Phase
We love sharing knowledge and explaining complex weather phenomena in simple terms. For this reason, we often include a short paragraph of basic information at the start of an article, so even a new reader can get all the information needed to understand the global weather development.
All data points to ENSO as the main driver of the weather patterns this Summer. This is short for “El Niño Southern Oscillation”, a region of the equatorial Pacific Ocean that alternates between warm and cold phases every 1-3 years.
These ocean phases don’t just impact the global weather directly. They also act as the “indicator light”, indicating major changes in the global weather system as this ocean area changes from a cold to a warm phase.
The image below shows the ENSO regions across the tropical Pacific. The main area covers the central part, shown in the image as the Niño 3.4 region. In this region, we determine the ENSO phases by looking at the sea-surface temperature anomalies (warmer/colder).
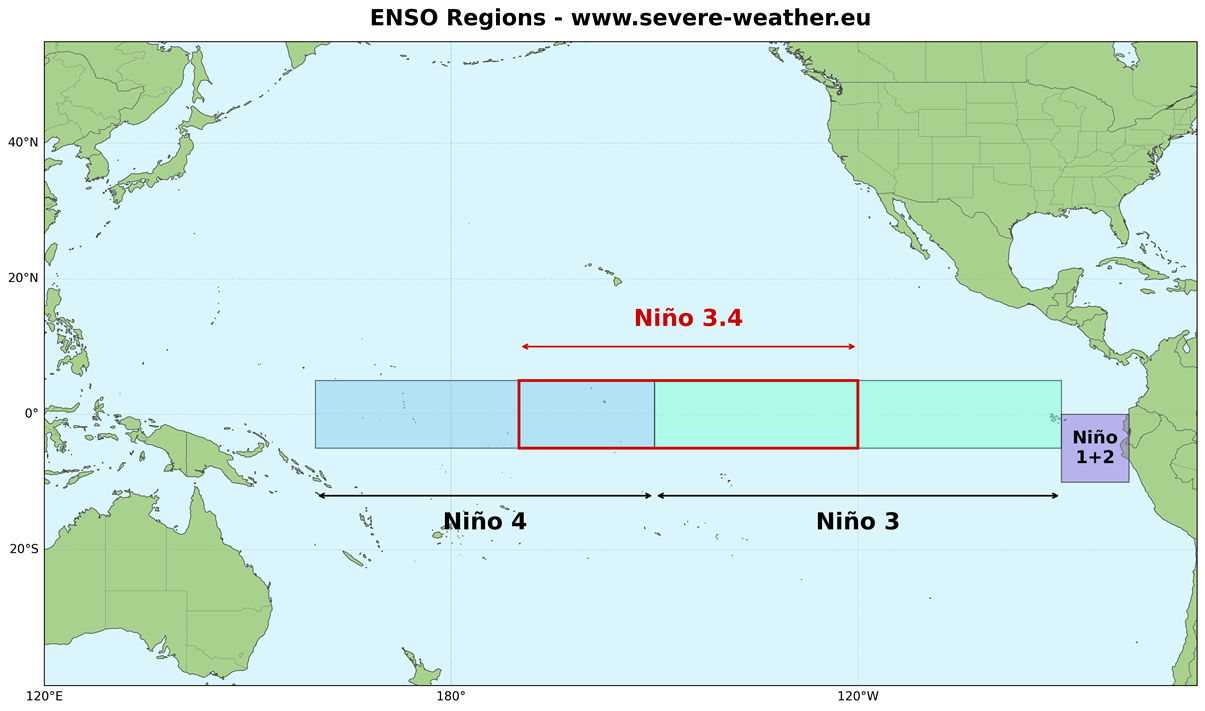
The cold ENSO phase is called La Niña, and the warm phase is called El Niño. Each ENSO phase has a different influence on the complex ocean-atmosphere feedback system. These changes gradually translate into the global circulation, altering weather patterns worldwide.
A specific phase usually develops between summer and early fall and typically lasts until next summer. But some events can start sooner, and can last even up to two years, called “double La Niña”, or can be really strong, like a “Super El Niño”.
In the image below, you can see a direct comparison between ocean temperature anomalies for each of the two ENSO phases. Both phases show real data from their 10 strongest events, revealing the clear ocean signature of each phase and the sheer size of these anomalies.
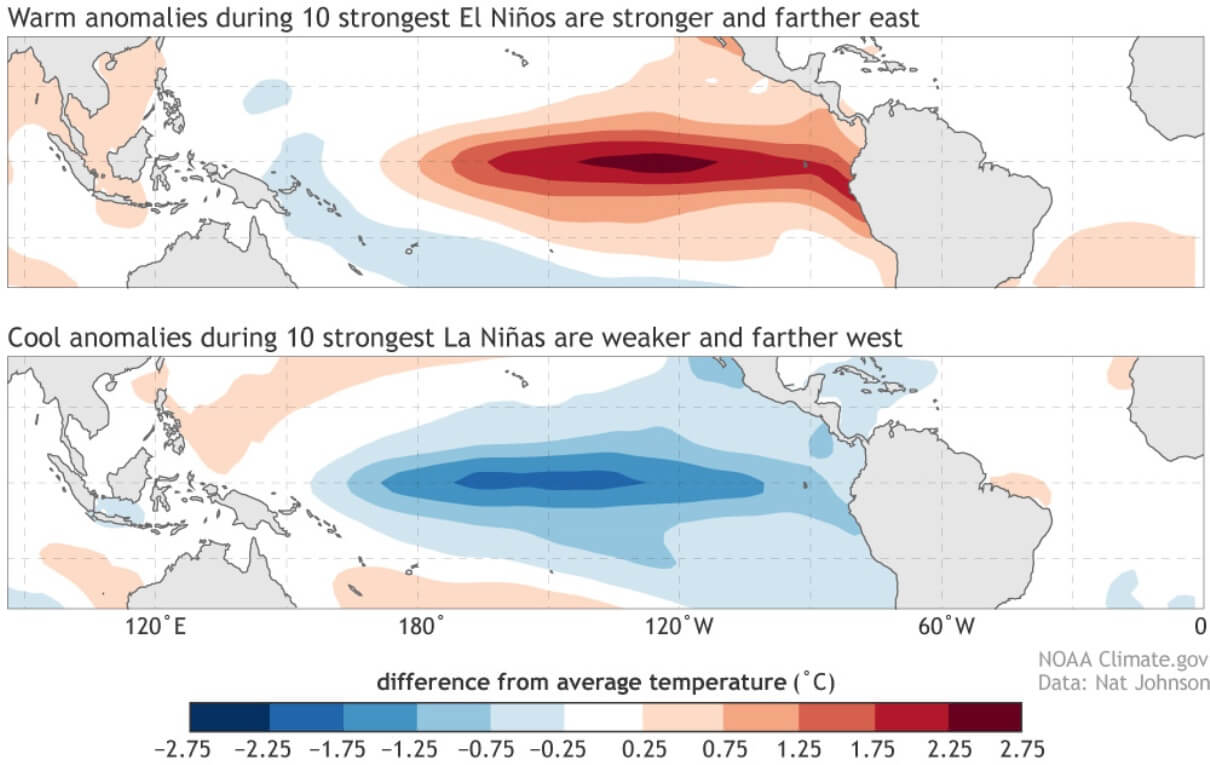
Besides ocean temperature, each phase also brings different pressure and rainfall impacts on the tropics, which, down the line, result in a very different impact on the global weather circulation.
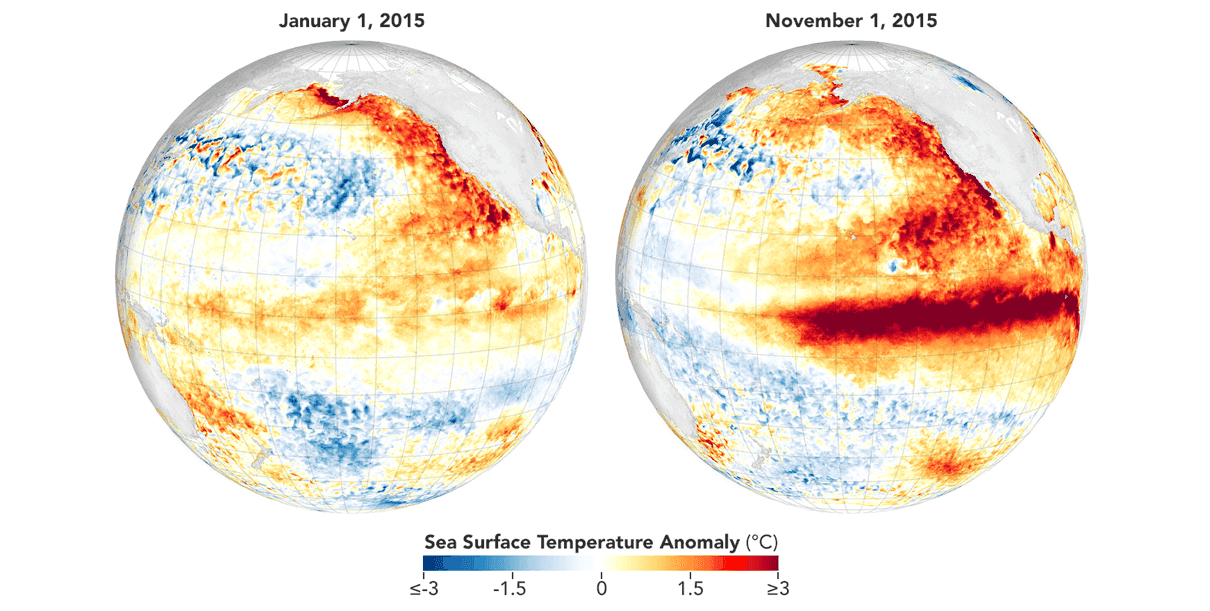
As mentioned, and as we will show below, we are heading into a new El Niño event that appears strong enough to reach “Super El Niño” levels. Below is an example analysis from NOAA that shows the evolution during the last Super El Niño event in 2015, and how wide and strong the ocean anomalies were.
This is much better seen in the video below, which shows the last months of ocean temperature changes in the Pacific region. You can see a healthy La Niña event and how rapidly it started to dissolve, with the warm anomalies now taking over as we head into the next big natural climate phase for 2026/2027 or beyond.
The latest analysis data also shows an even faster shift in recent weeks and days, as the oceans are ready to fully release the next major El Niño event.
Invisible Warming: Tracking the Rapid Emergence of the 2026 El Niño from Below
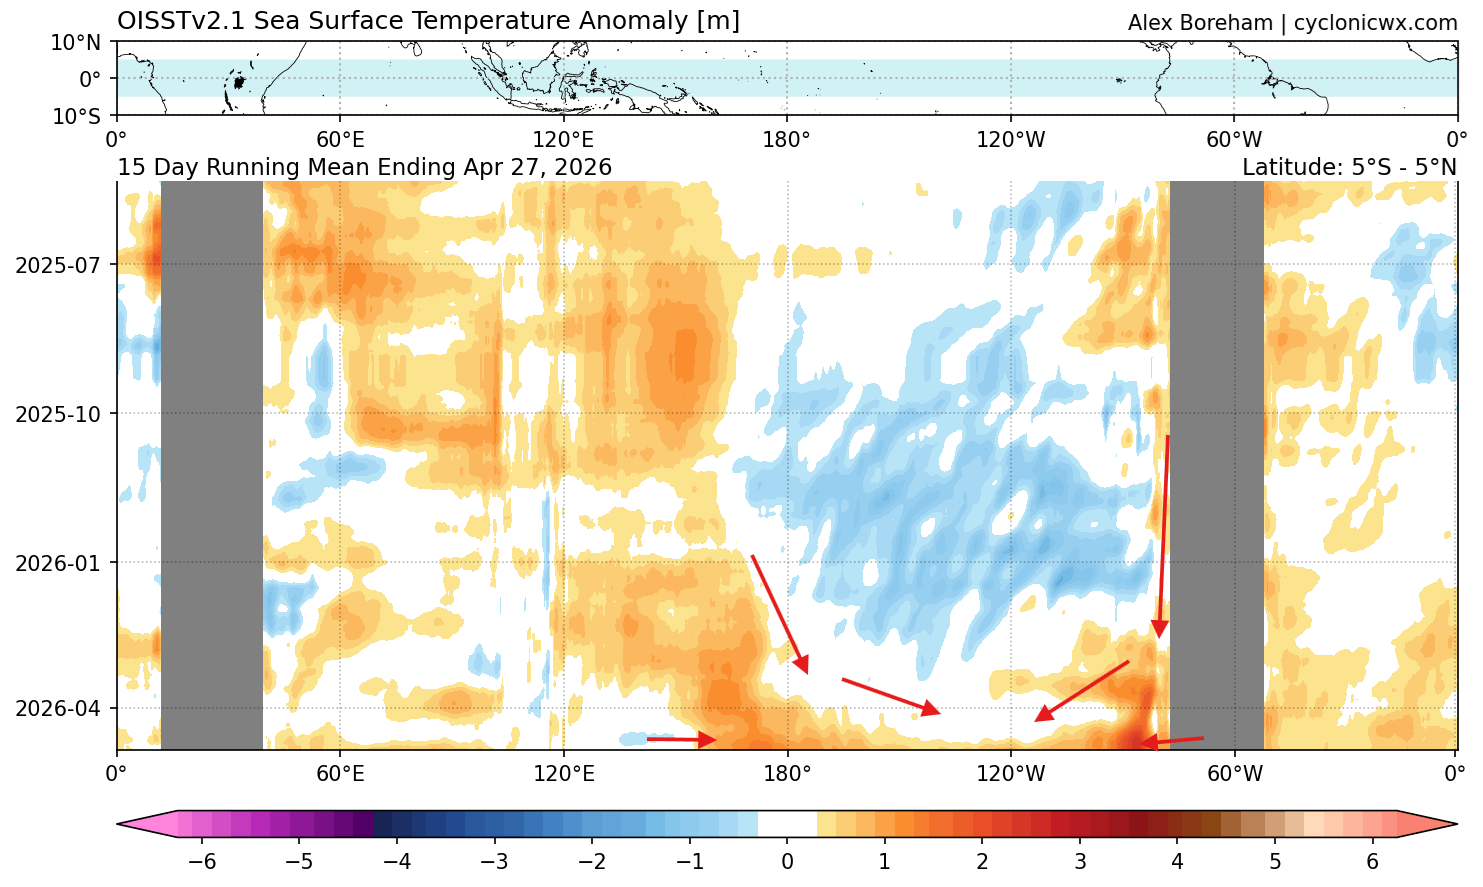
We can see the rapid shift in the Pacific in the analysis image below, which shows the ocean surface anomaly data for the past months in the tropics. You can see the cool patch associated with the weak La Niña during Winter. But recently, a rapid intrusion of warm anomalies has occurred as the trade winds shift direction, triggering a massive Kelvin Wave below the surface.
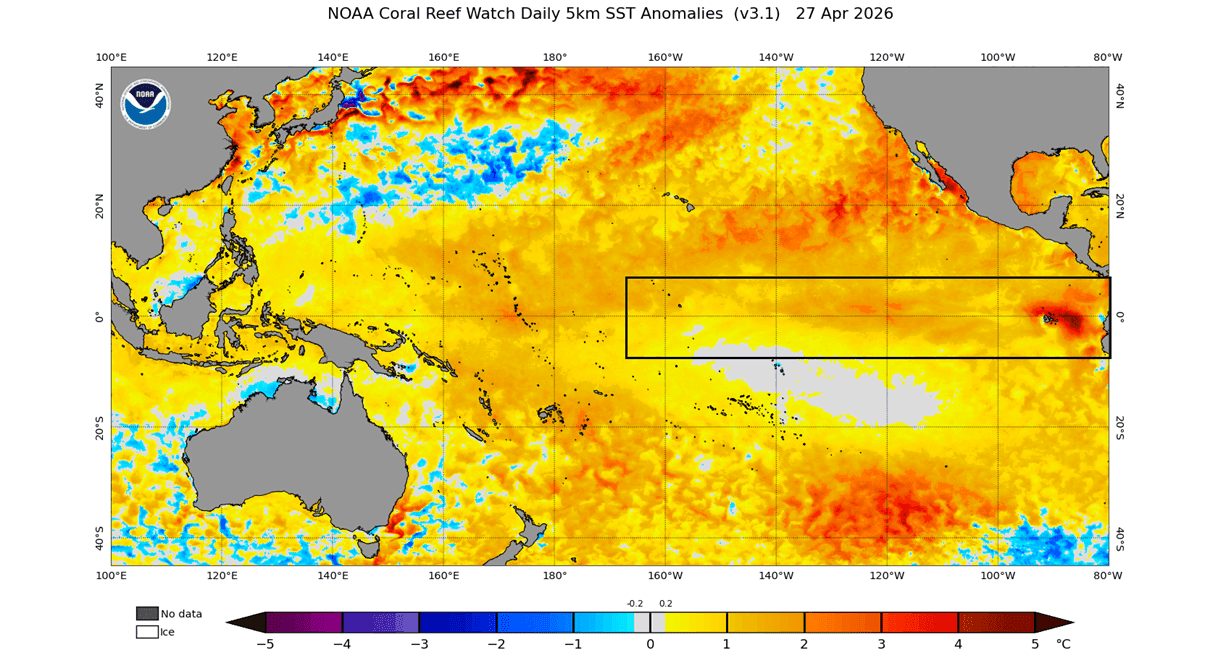
The latest ocean analysis below shows the main ENSO region now totally free of any cold anomalies, with a clear warm signature starting to dominate the region. Increased warming is expected as the subsurface anomalies also start to rise towards the surface, launching a full-scale El Niño event before Summer.
Speaking of subsurface anomalies, the image below shows the latest subsurface ocean temperature anomalies across the tropical Pacific. A massive area of warmer waters lies at depths of 50-250m (150-800ft). This is called an oceanic Kelvin wave and has grown stronger in recent weeks, reaching near 8 degrees above normal.
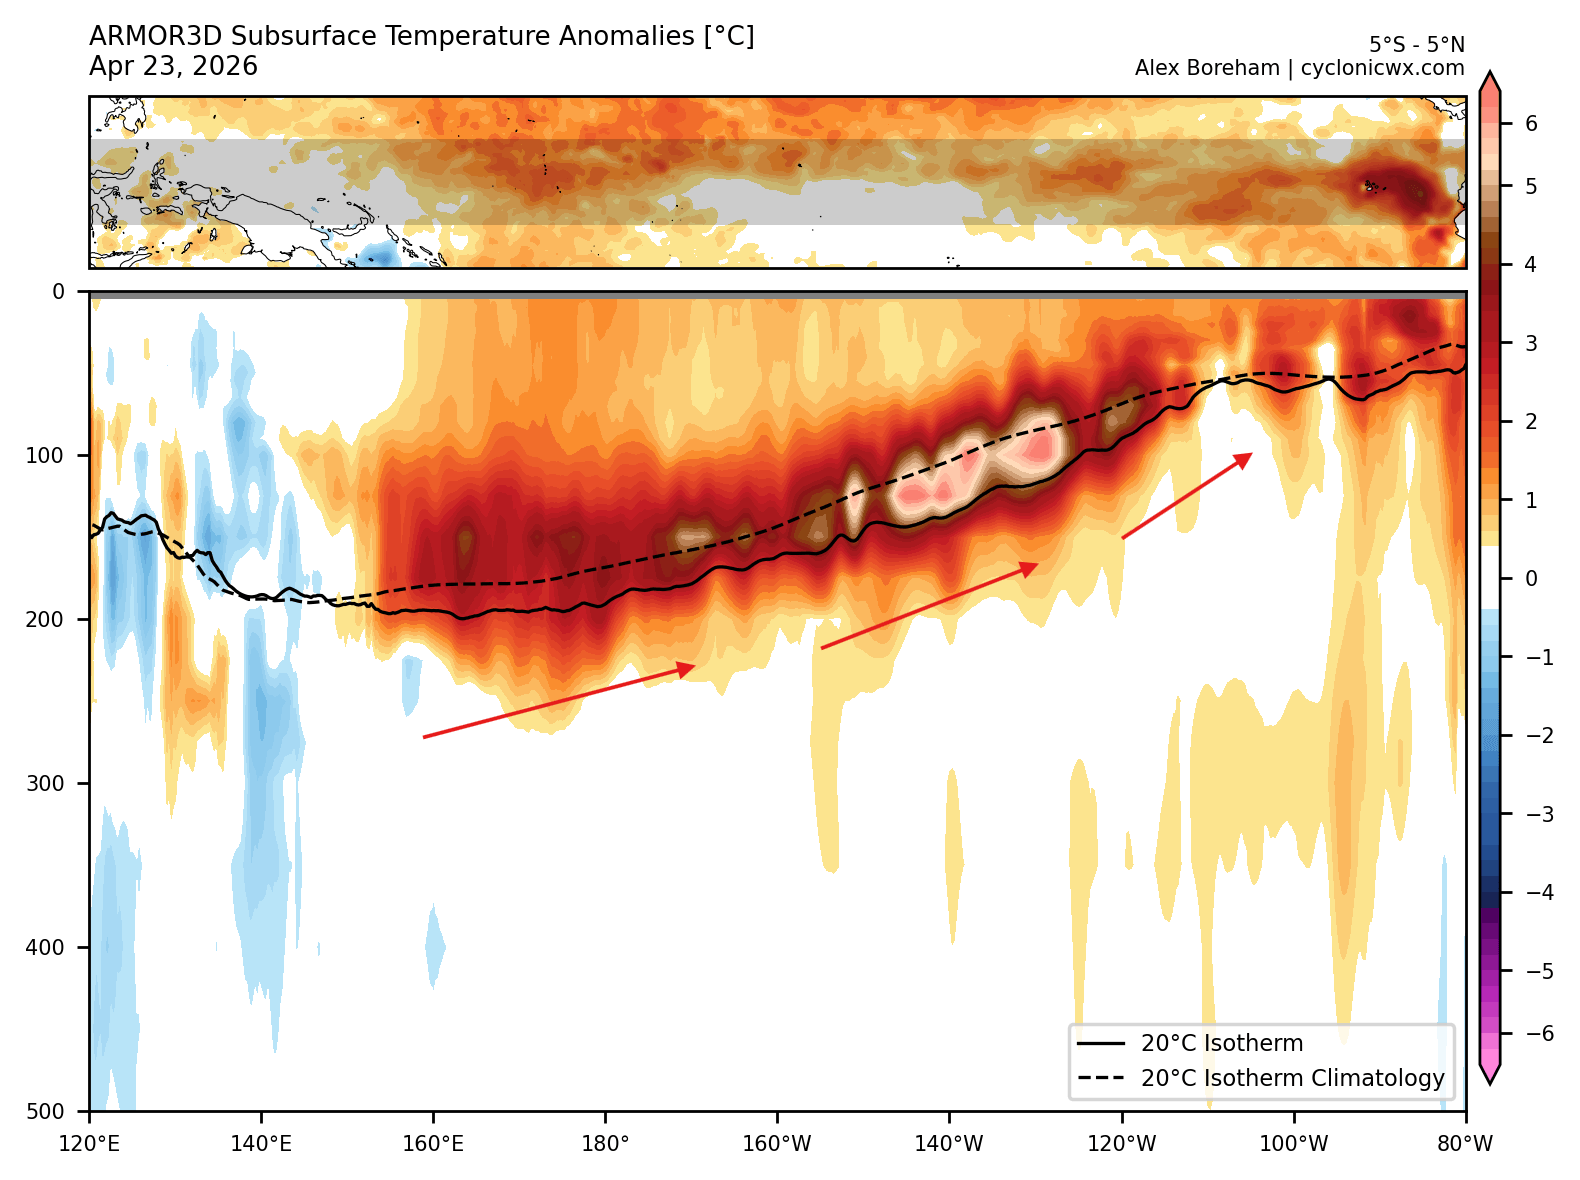
These subsurface Kelvin waves are driven by the westerly wind bursts or weaker trade winds, pushing the warmer subsurface ocean waters to the east, where they rise to the surface. This is a great example of how the atmosphere can drive the ocean changes.
All ocean forecast systems also include this development below the ocean surface, so they properly understand the full dynamics, resulting in a strong El Niño event at the surface.
Below is the latest ENSO forecast from NOAA’s CFSv2 model. It shows a very strong El Niño developing, rivaling even some of the strongest Super El Niño events in recent history. The development is also rapid enough to have a direct impact on the Summer weather patterns.
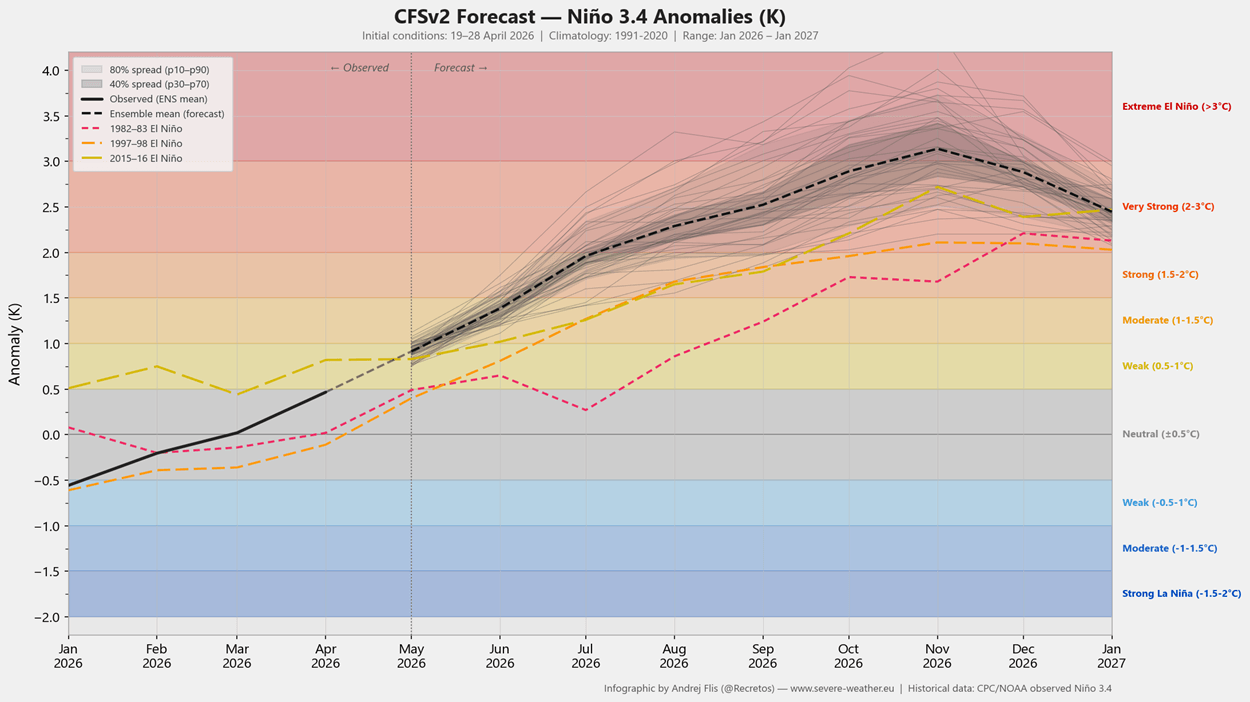
The average-to-upper value of the forecast shows a very high chance for a Super El Niño to develop. A Super El Niño differs from a normal event because the warming in the Pacific becomes more intense, resulting in a stronger impact on global weather.
This can lead to more extreme weather shifts, turning typical seasonal changes into high-impact events like massive flooding, severe droughts, and significantly altered storm tracks that can affect the entire planet.
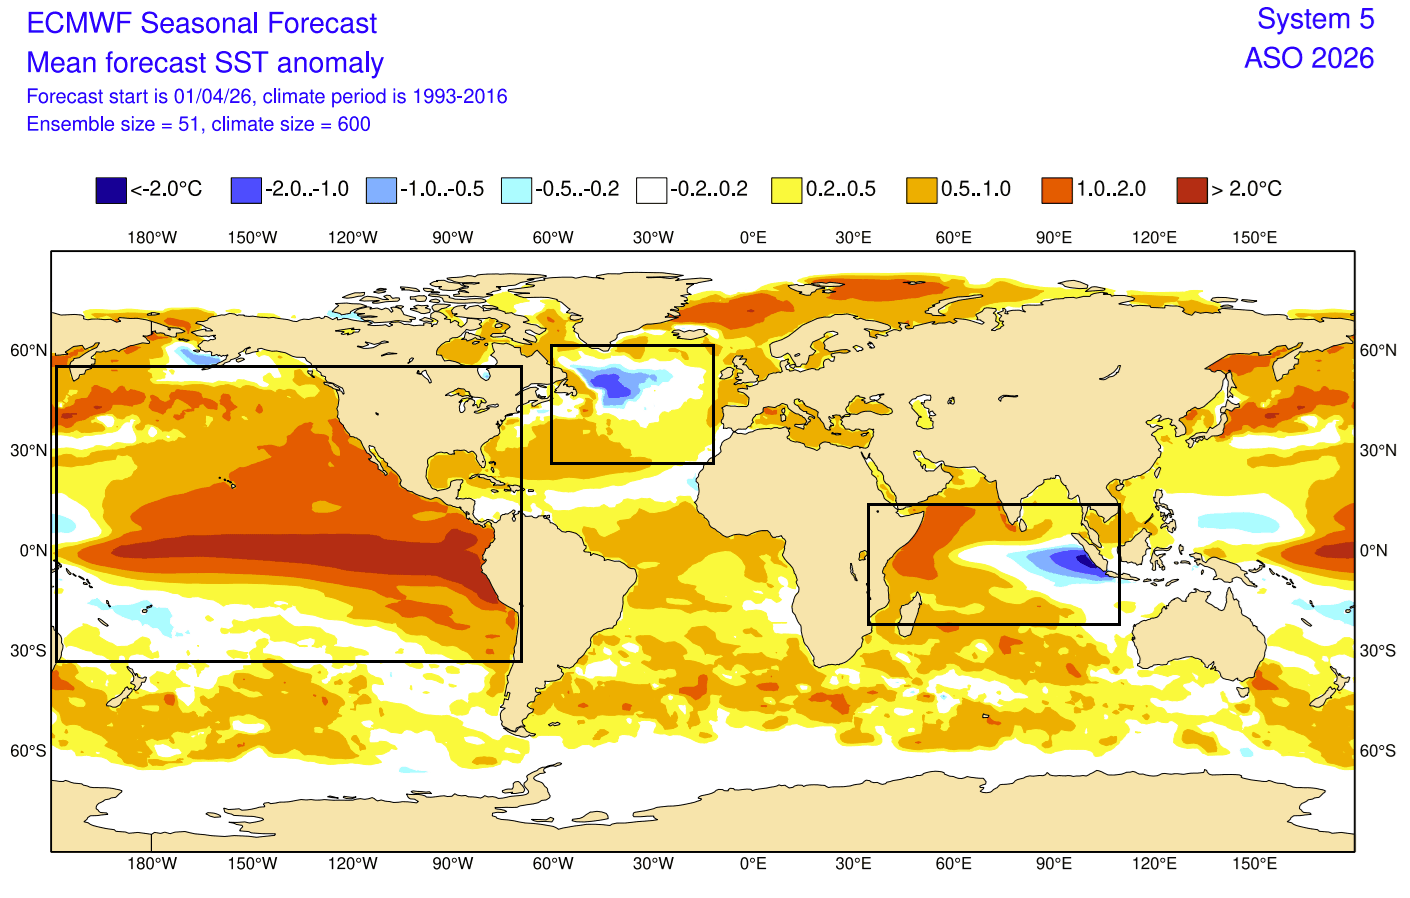
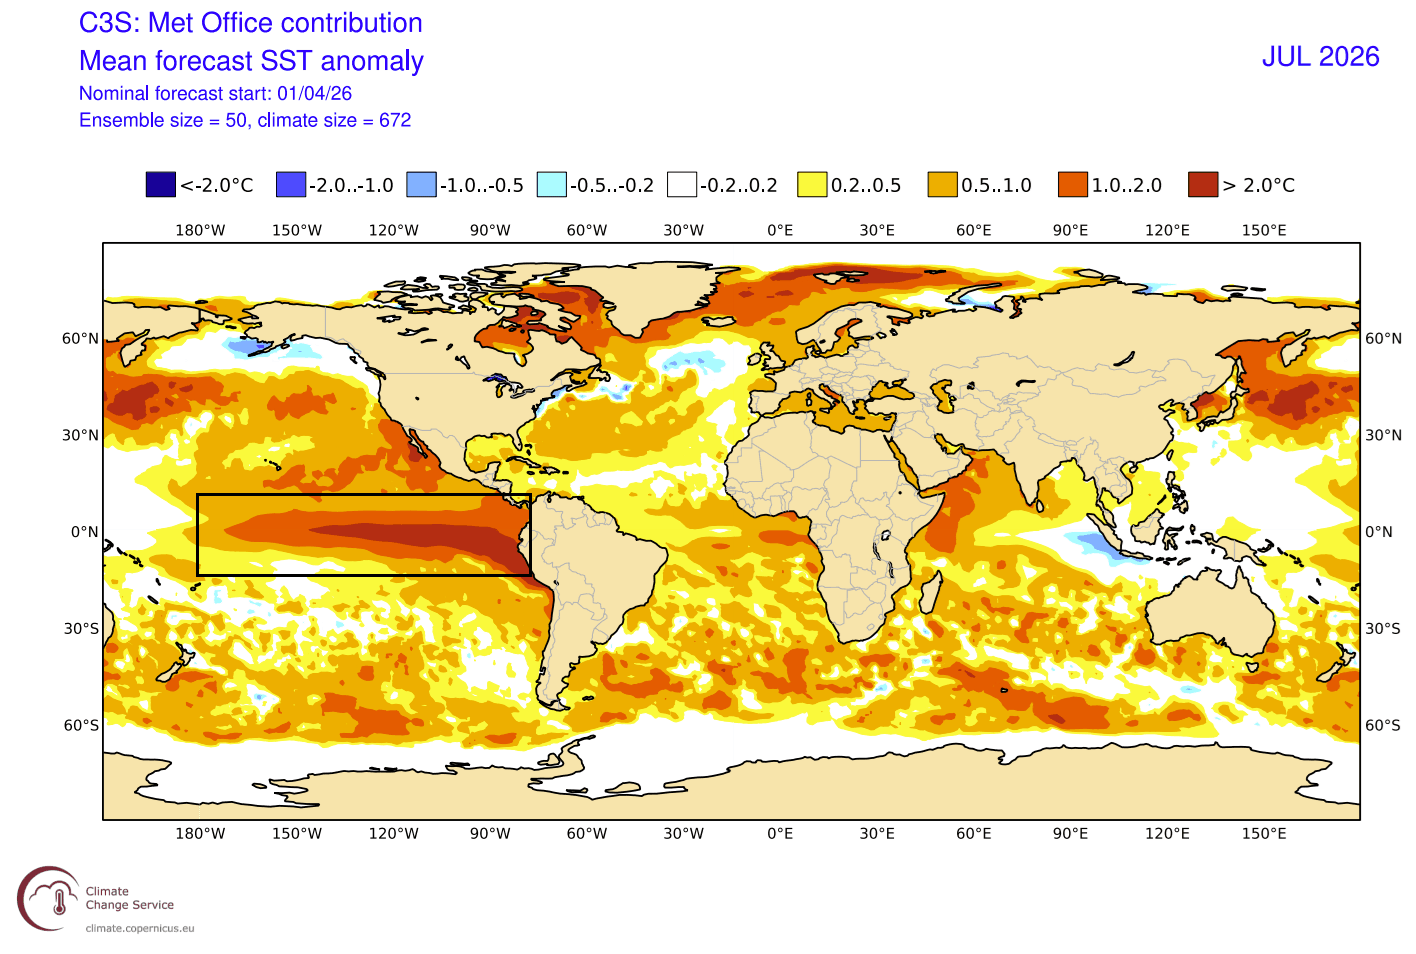
Below is the latest ECMWF forecast for the August-October period, and it shows a significant El Niño anomaly across the tropical and northern Pacific. The values exceed +2 degrees across the whole ENSO region, consistent with the strength of a Super El Niño event.
Since the Summer of 2026 is already expected to feel the impacts of the emerging El Niño, we decided to look at some past data to see the weather development in past Super El Niño summers.
Historical Patterns: Summer Atmospheric Responses to Super El Niño Events
With the rapid onset of the El Niño forecast, we can expect atmospheric changes by Summer. We decided to look at the past Super El Niño events and the summers they created in their initial year of development.
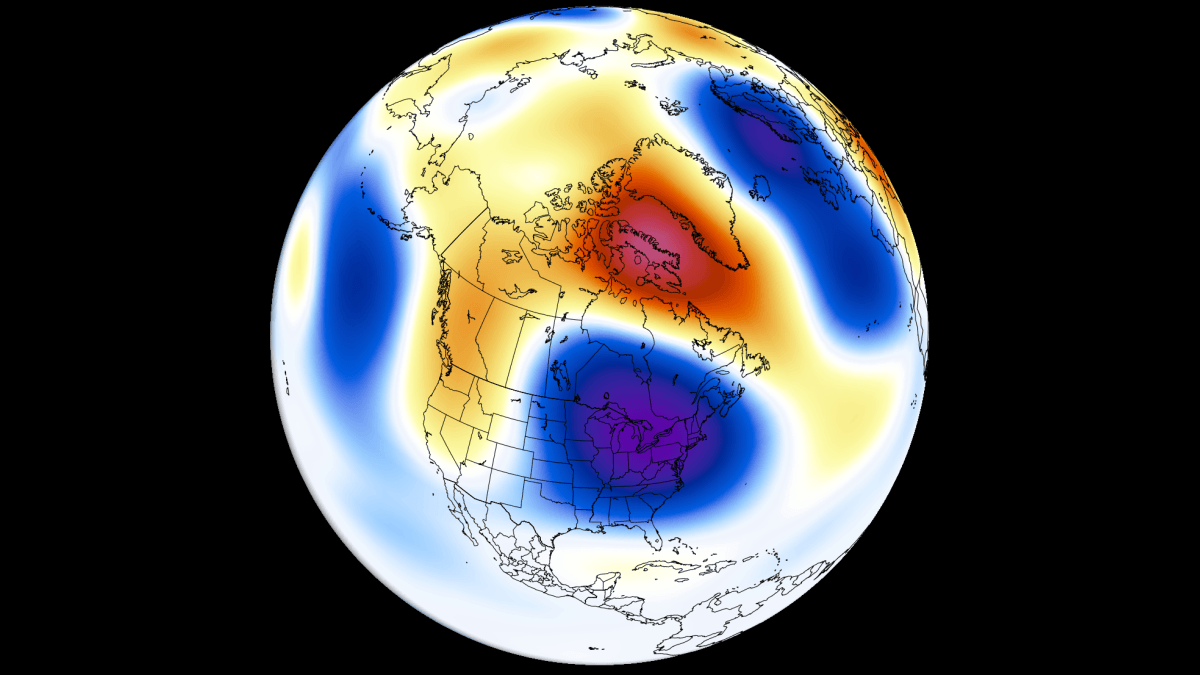
Below is the meteorological Summer reanalysis for pressure anomaly patterns in the Super El Niño years. The reanalysis shows a tendency toward a low-pressure area somewhere over the eastern United States or eastern Canada, along the west coast of Europe, and in the North Atlantic.
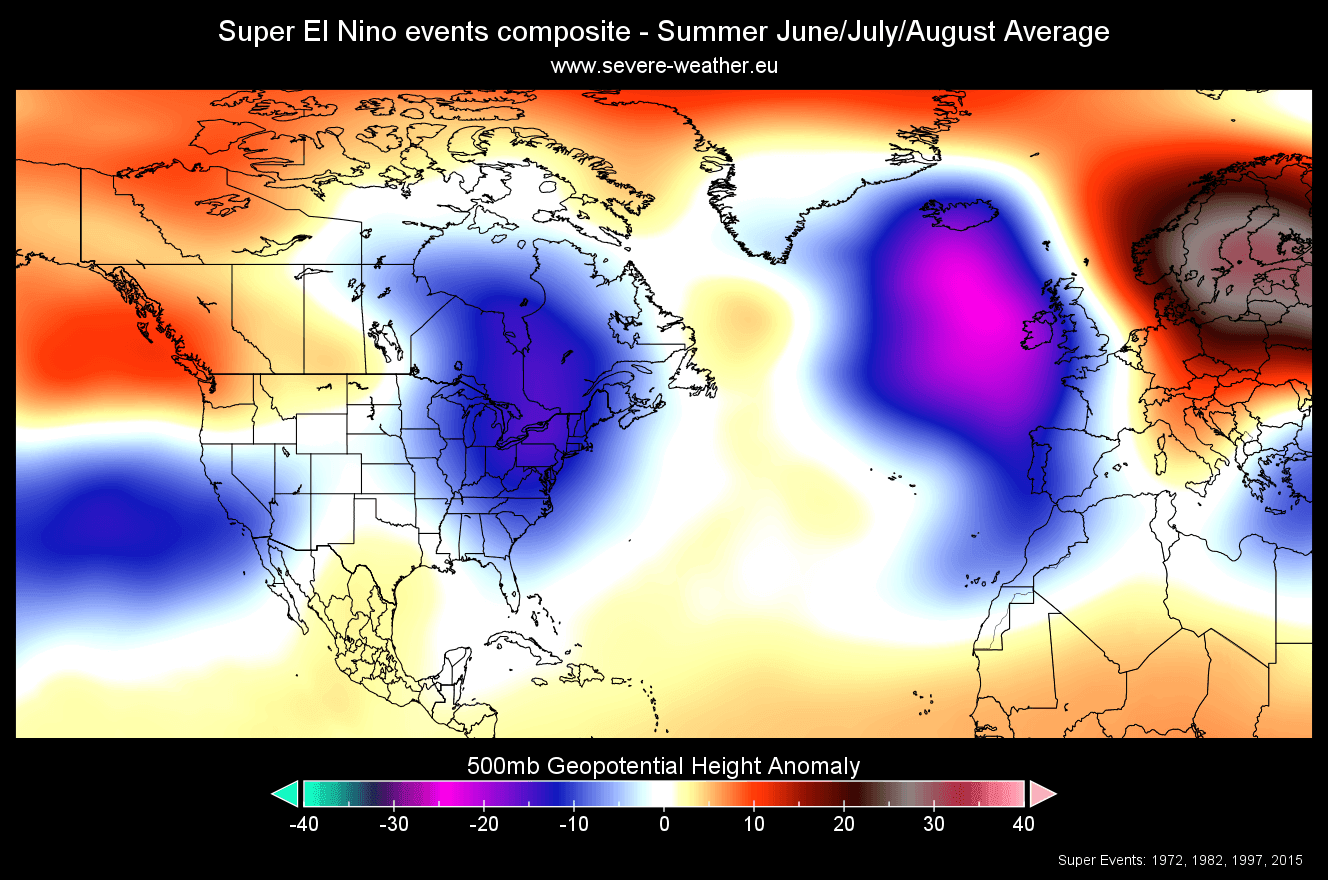
A low-pressure area over the eastern U.S. or eastern Canada supports a more northerly flow, which means more controlled summer temperatures over the northern, central, and eastern parts of the United States and southern Canada. You can also see a low-pressure tendency over the southwestern United States, which is driven by the stronger subtropical jet stream with the El Niño.
Looking at temperatures from the past super events, you can see a below-normal trend over the northern, central, and eastern United States and eastern Canada. Warmer temperatures are found over the Pacific Northwest and over a large part of central and northern Europe. But note the below-normal trend in the western parts of Europe.
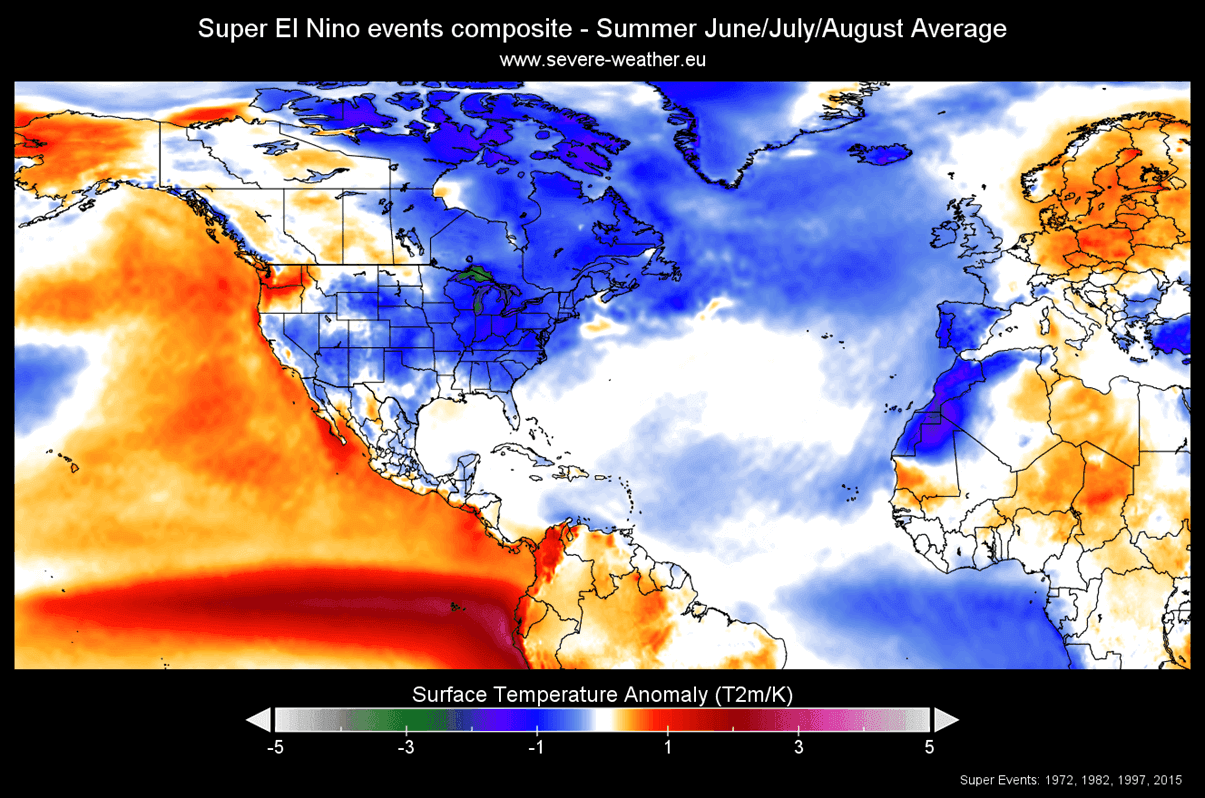
This can perhaps be misleading, since two years in the mix are several decades old, from a different climate norm, creating a bit cooler image than expected in current conditions. But the trend/tendency for lower Summer temperatures over east/central U.S. and around west Europe remains.
The rainfall pattern in such years is also interesting. You can see more rainfall from the western into central and eastern U.S. and across the Midwest into the Northeast. More rain is also expected over Florida in these conditions. Less Summer rainfall is expected in such years over the far south and across the northern plains and southern Canada.
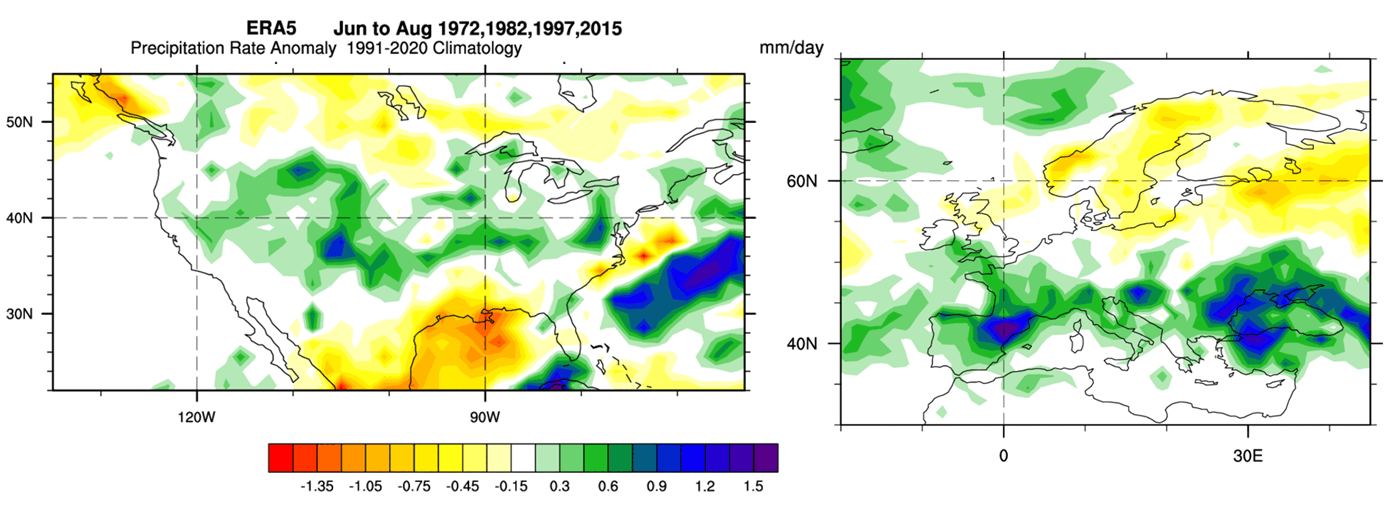
Across Europe, we see more rainfall over the central parts and the southern half, driven by a more moist southerly flow from the low-pressure area to the west. Less rainfall is seen over the northern parts, due to the impact of a high-pressure area in that region.
These are the usual signals present in the summer atmosphere at the onset of a strong super El Niño event.
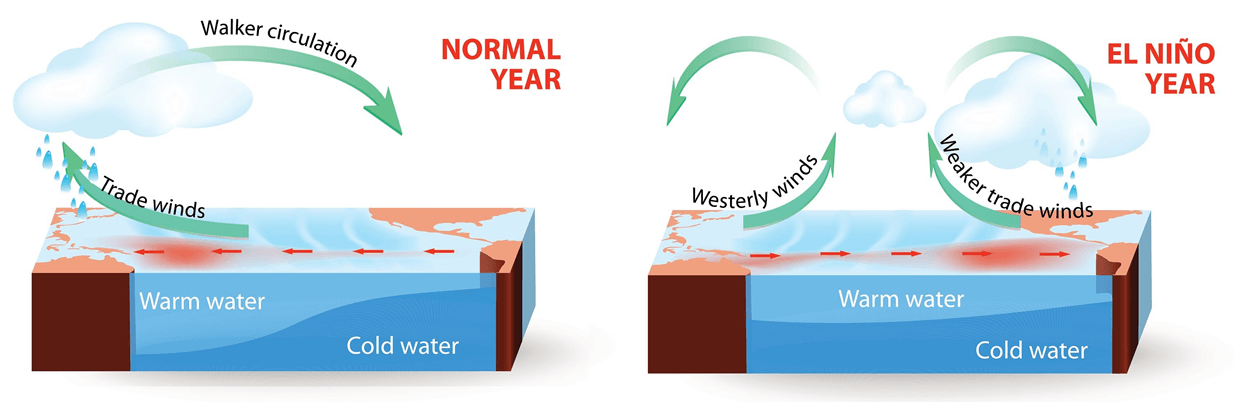
One way to detect the presence of an El Niño in the atmosphere is to analyze the global circulation. The upward and downward atmospheric motion in the tropical regions is called a Walker Cell, and is especially sensitive to strong El Niño and La Niña events. The schematic below shows the change in atmospheric motion during an El Niño event, impacting the global weather system.
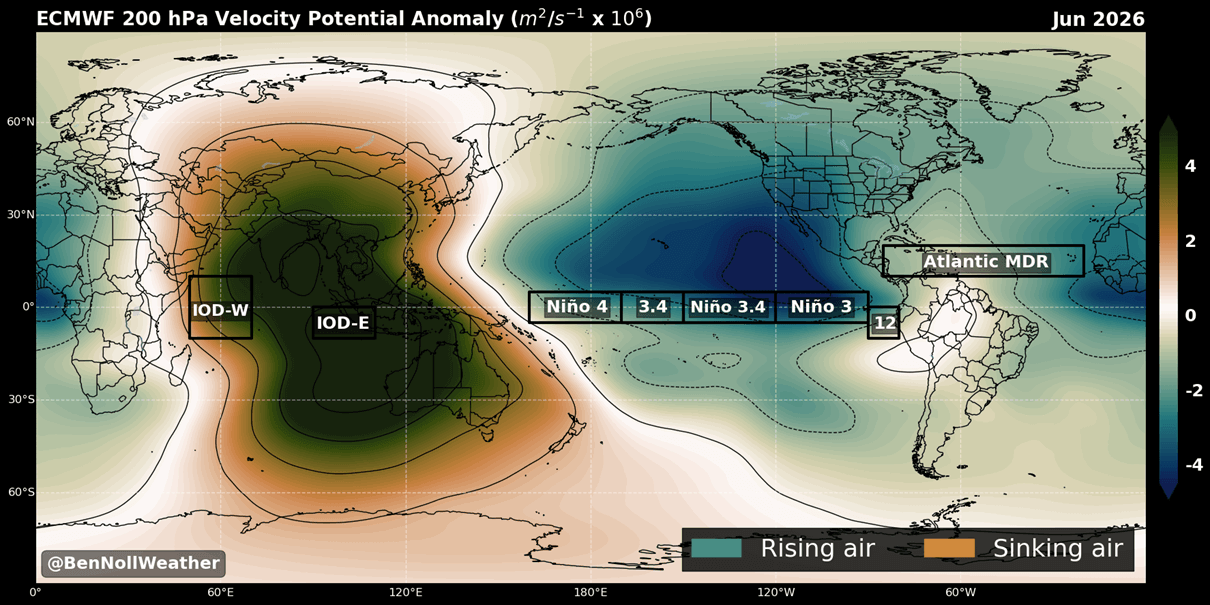
We can already see this specific impact clearly in the latest June 2026 forecast, for the parameter known as Velocity Potential (VP). It shows rising air in the Pacific and sinking air in the Indian Ocean, revealing this exact atmospheric circulation and the state of the Walker Cell. This forecast confirms a clear signal of an El Niño atmospheric circulation as early as the start of Summer. Image by meteorologist Ben Noll.
Here, we have to add that no two past or future events are always exactly the same. So the past data above serves as a baseline to compare with the latest long-range forecast data, and we will see whether the atmosphere responds again as it has in the past.
Seasonal Outlook: Latest ECMWF Summer 2026 Temperature and Precipitation Forecast
The official meteorological summer period covers the months of June-July-August, which is also the hottest quarter of the year in the Northern Hemisphere. For this update, we will use two forecasting systems: the ECMWF SEAS5 long-range model and the UKMO seasonal forecast.
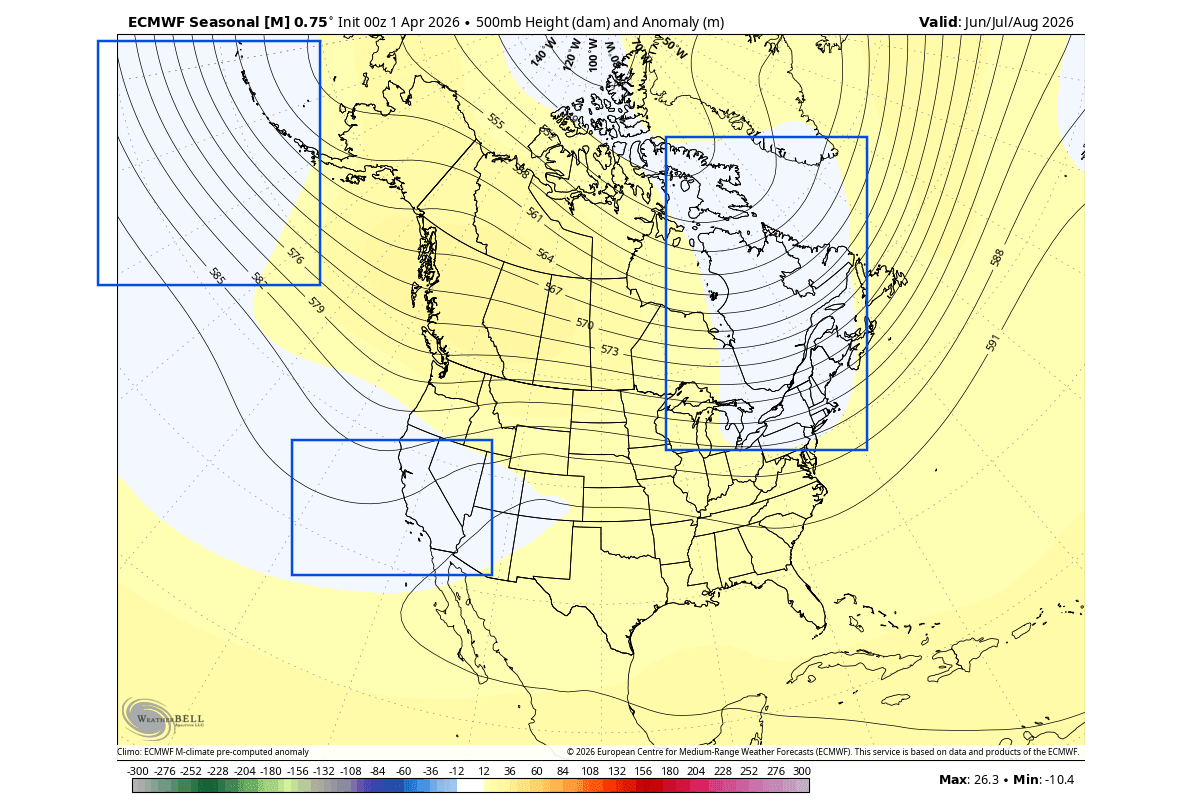
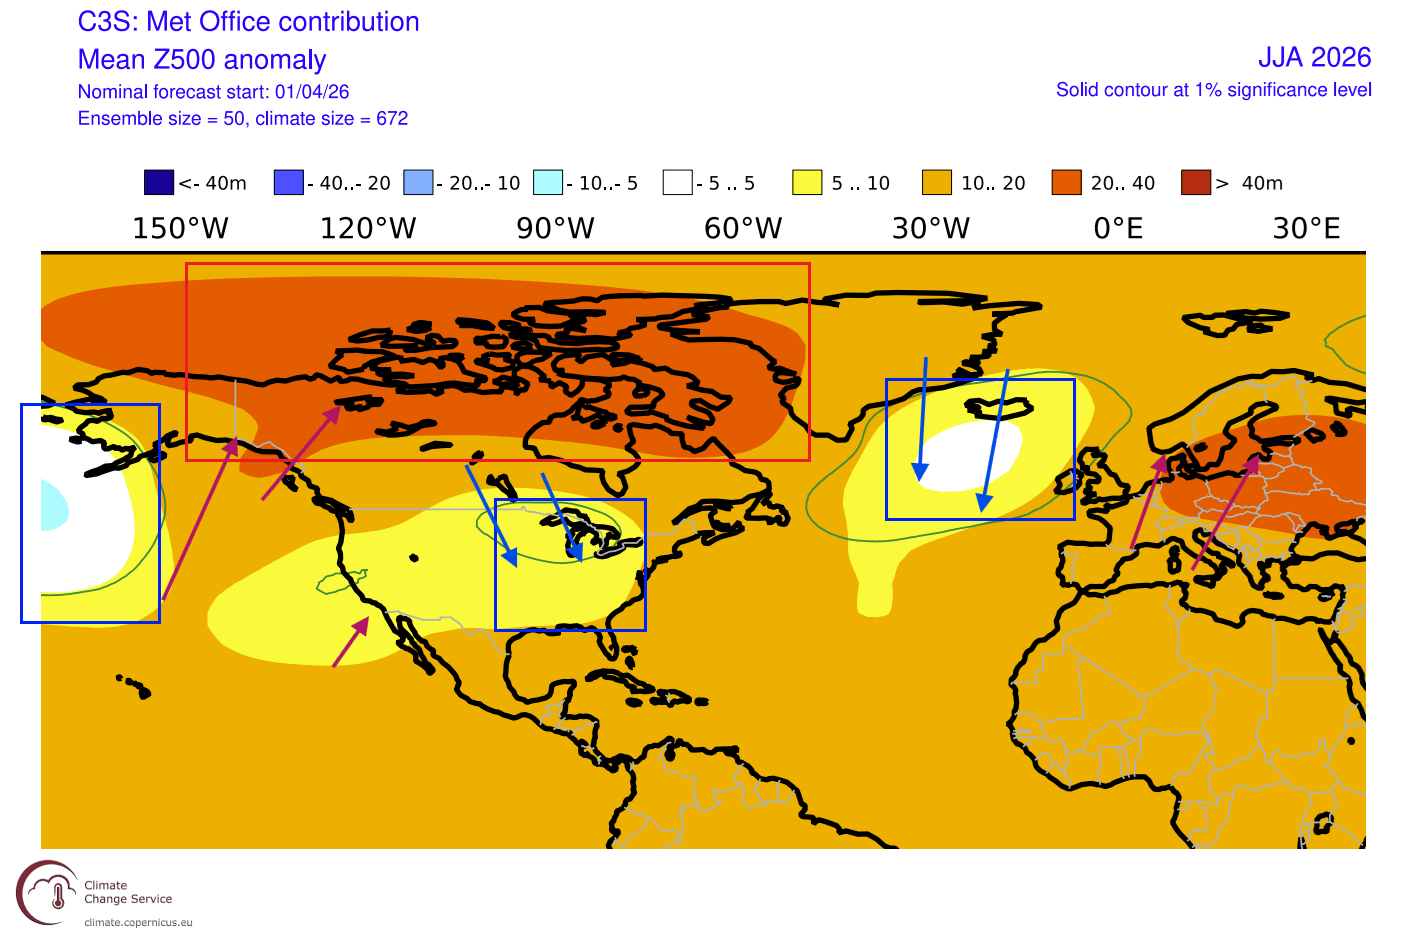
Below is the latest ECMWF long-range pressure pattern forecast for Summer, and it actually shows a very similar pressure pattern to that in the past years above. A low-pressure area is forecast over eastern Canada and the northeastern United States. A low-pressure zone is also found over the southwestern U.S. and the North Pacific, a clear sign of a rising El Niño.
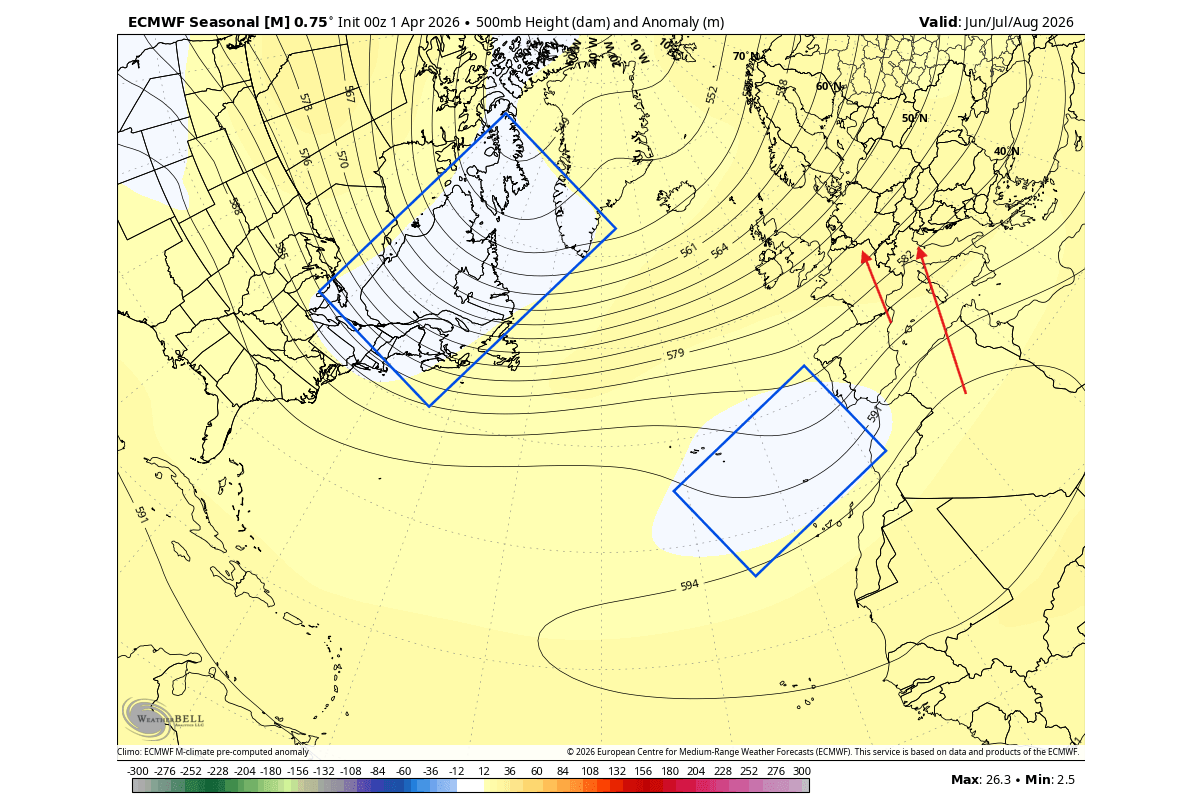
Looking at a wider view across the Atlantic, a low-pressure zone is also forecast over the Azores and southwestern Europe. This enables a warmer southerly flow into the continent.
The latest sea-level pressure forecast below shows a very clear El Niño signature, with a broad low-pressure zone over the tropics, indicating a strong rising air zone in the tropical Pacific. On the other side of the globe in the Indian Ocean, we see a high-pressure area and descending air, showing a dominant El Niño circulation pattern.
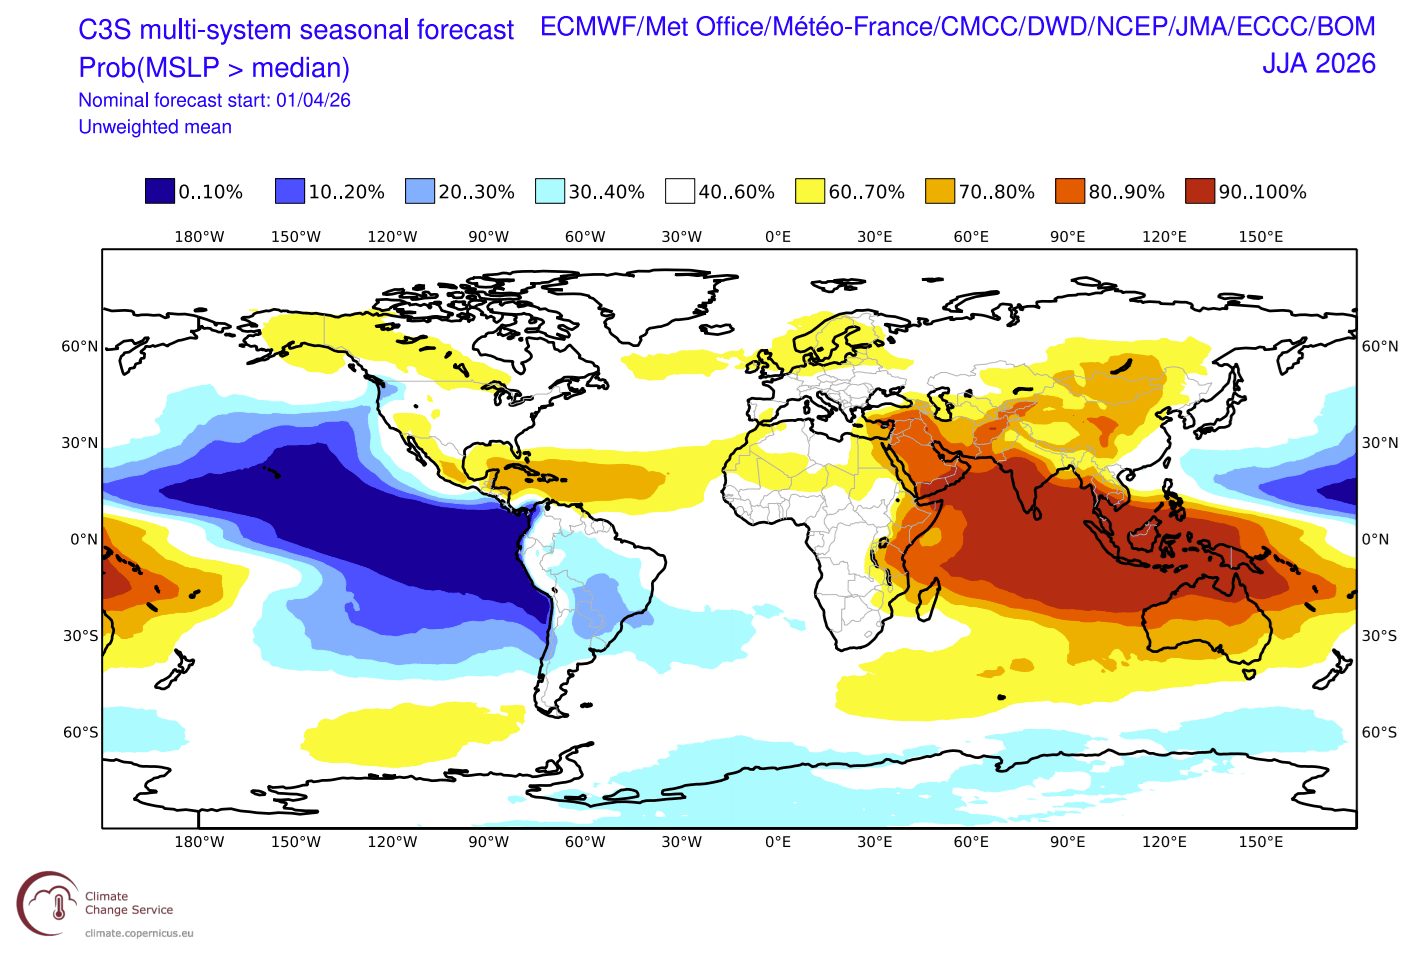
This gives us very high confidence that, at least to some degree, we are very likely to see a similar weather outcome to past super El Niño summers.
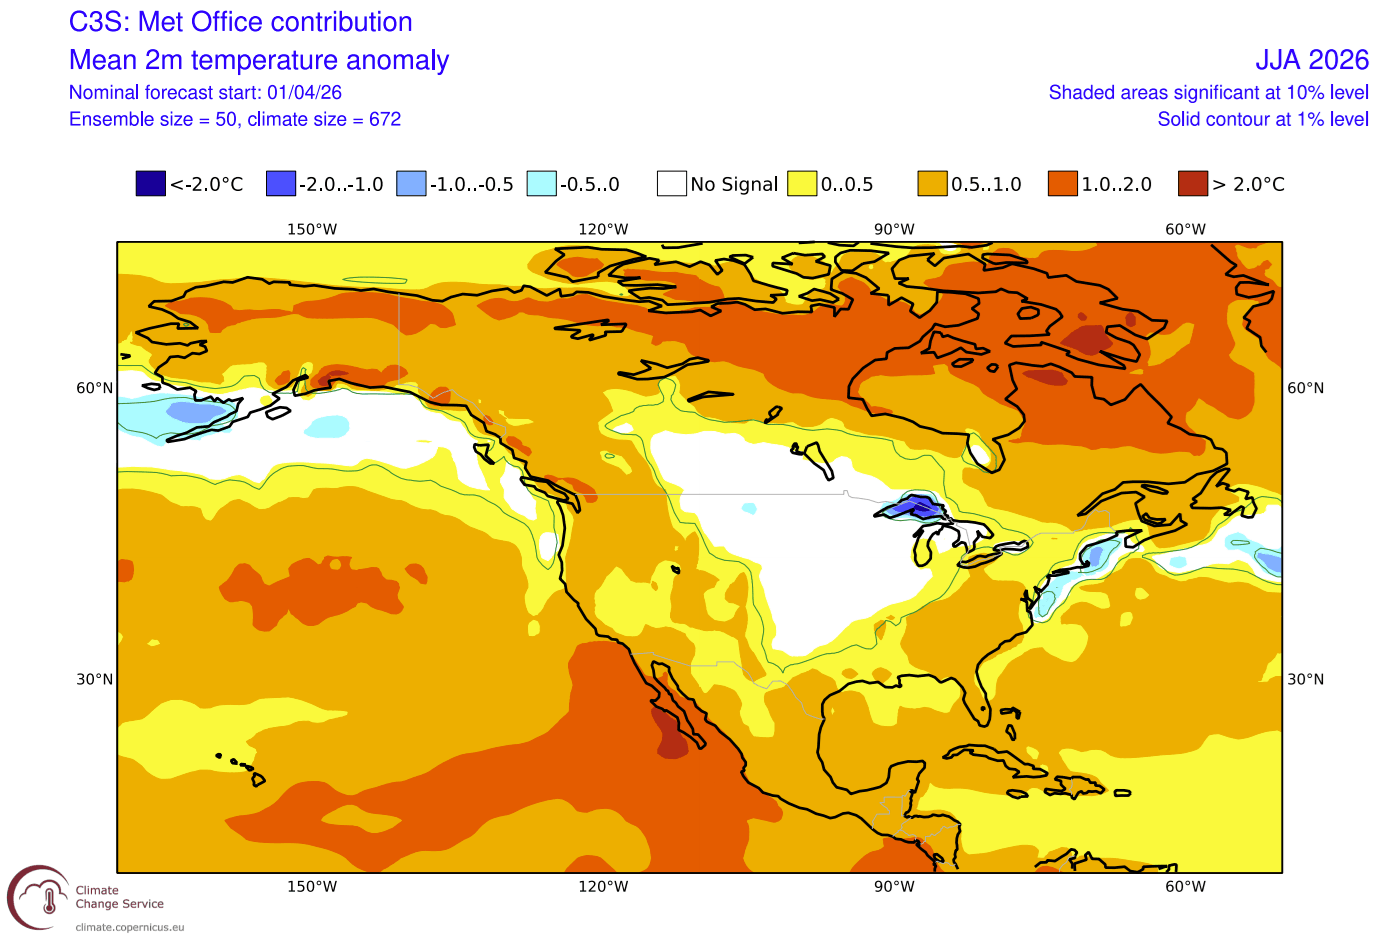
If we look at the latest Summer temperature forecast for North America, we can see the normal temperature area over the northern and northeastern United States and much of central and eastern Canada. This coincides with the trends in past data, creating more normal seasonal temperatures over the north and east, driven by a low-pressure area over eastern Canada.
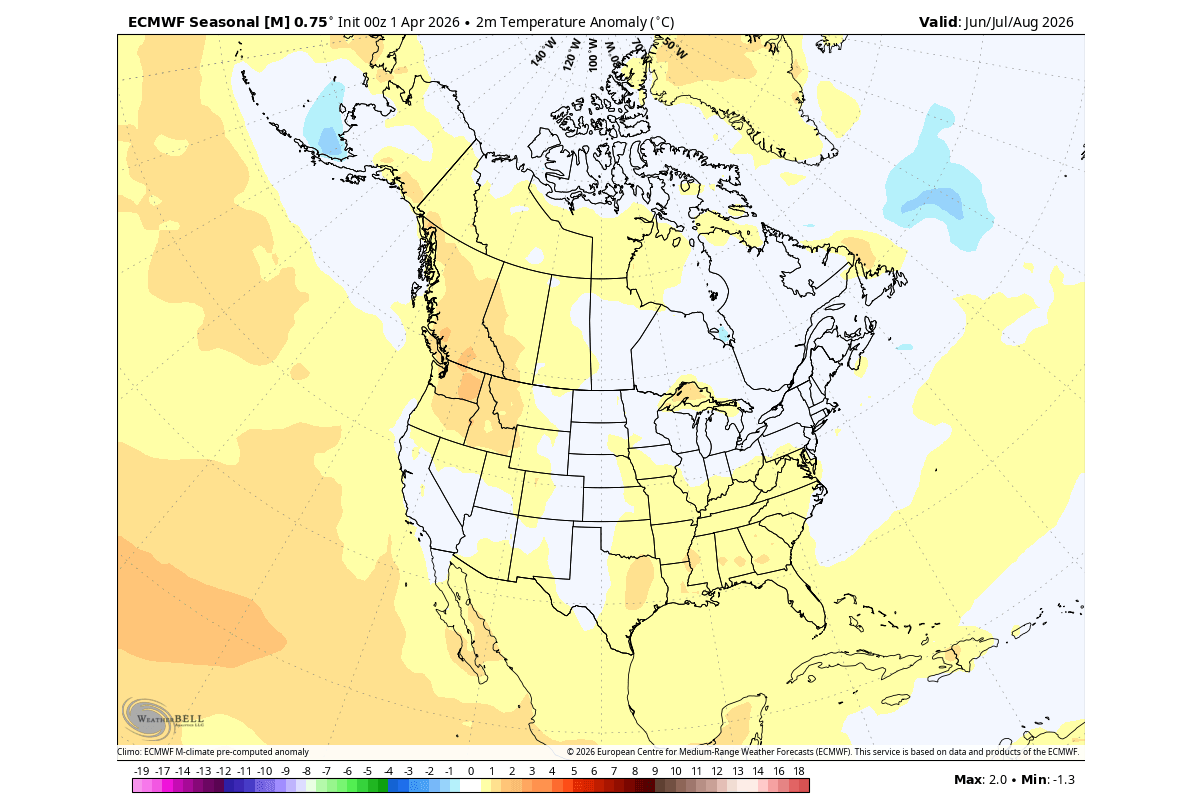
Above-normal temperatures are forecast for Summer 2026 across the northwestern United States and western Canada, as well as across the southern and southeastern United States.
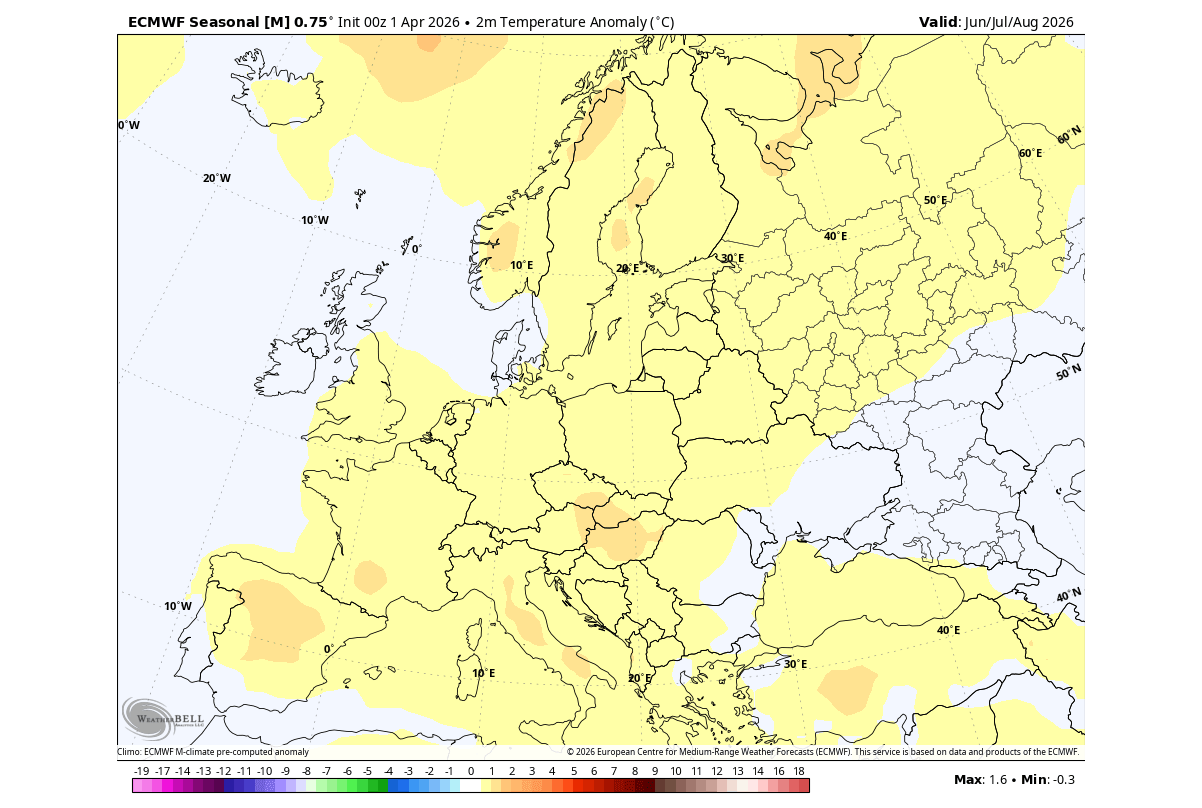
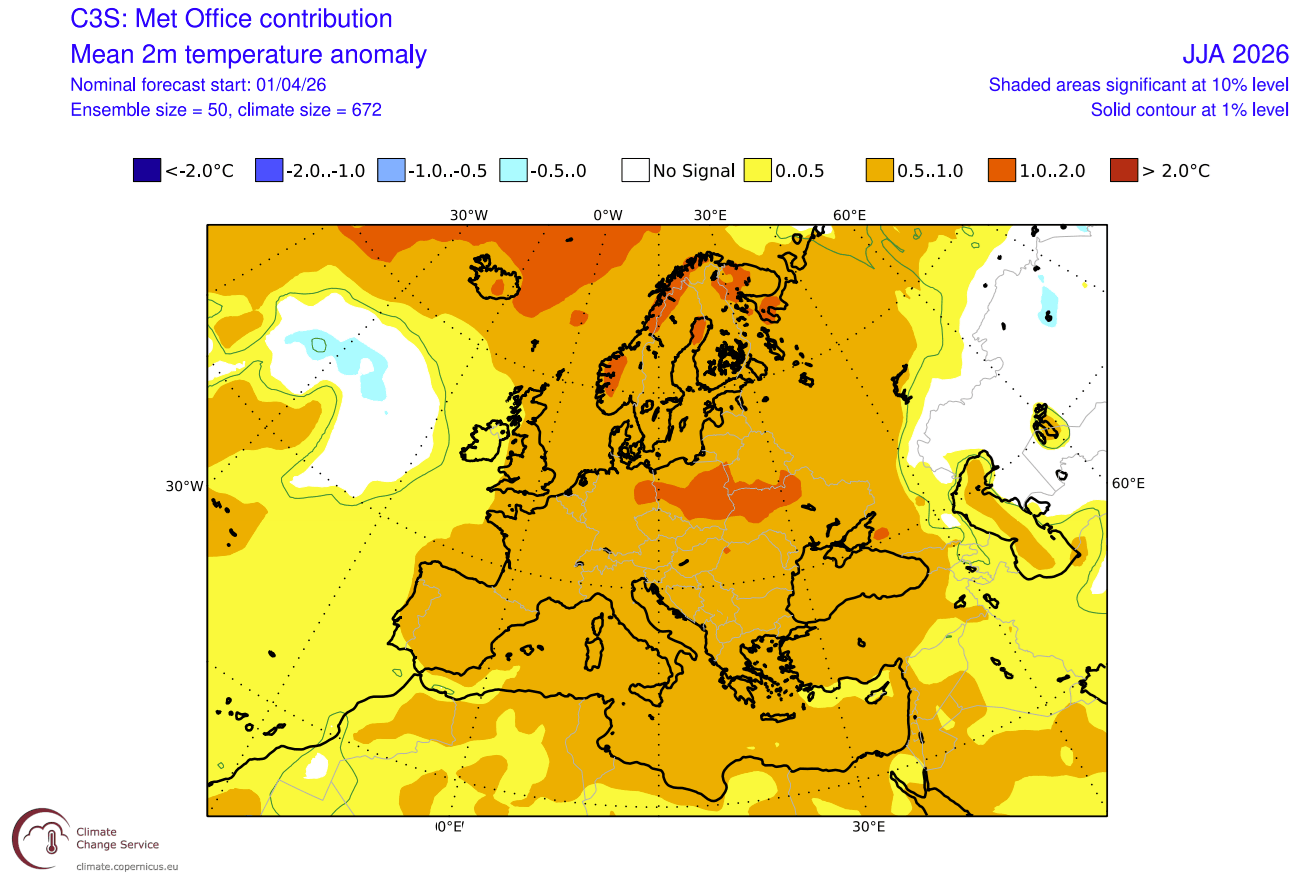
Over Europe, we can see above normal temperatures over much of the continent. The main axis of above normal temperatures spreads from the southern to central Europe into the northern parts. This is consistent with the low-pressure area out west, creating a westerly to southerly flow over the continent.
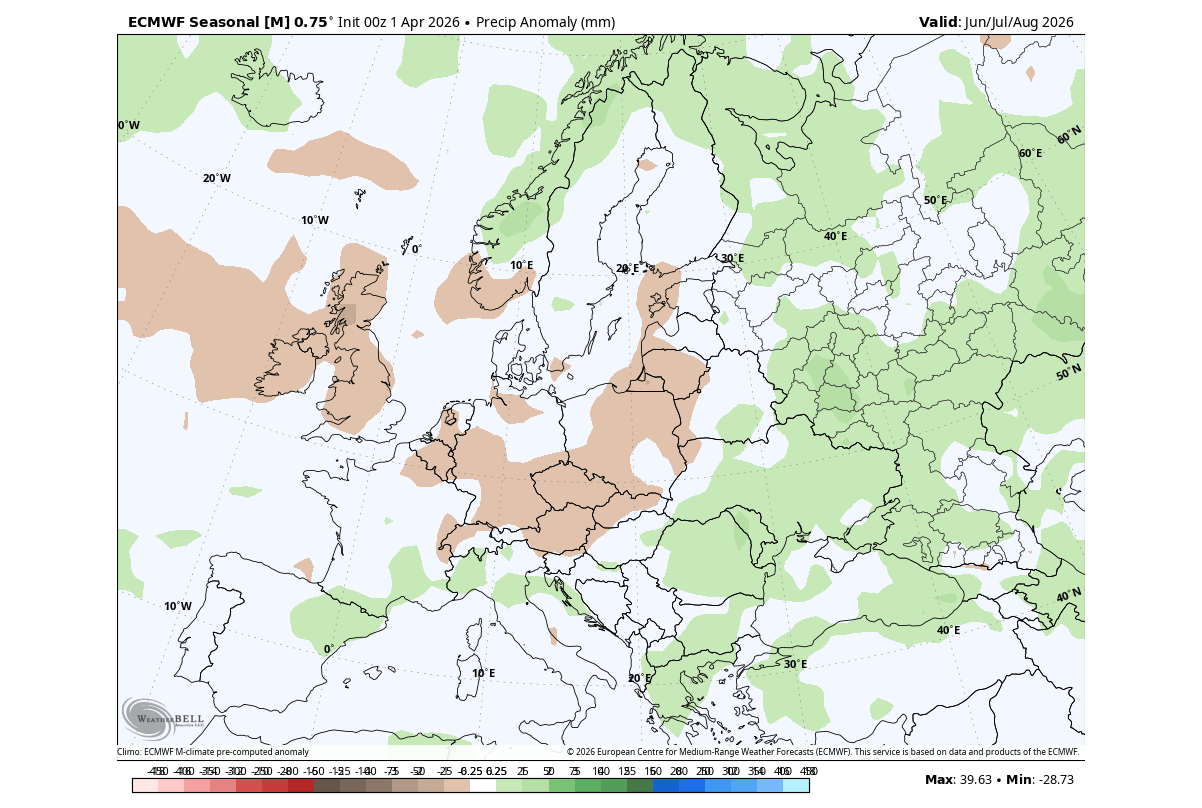
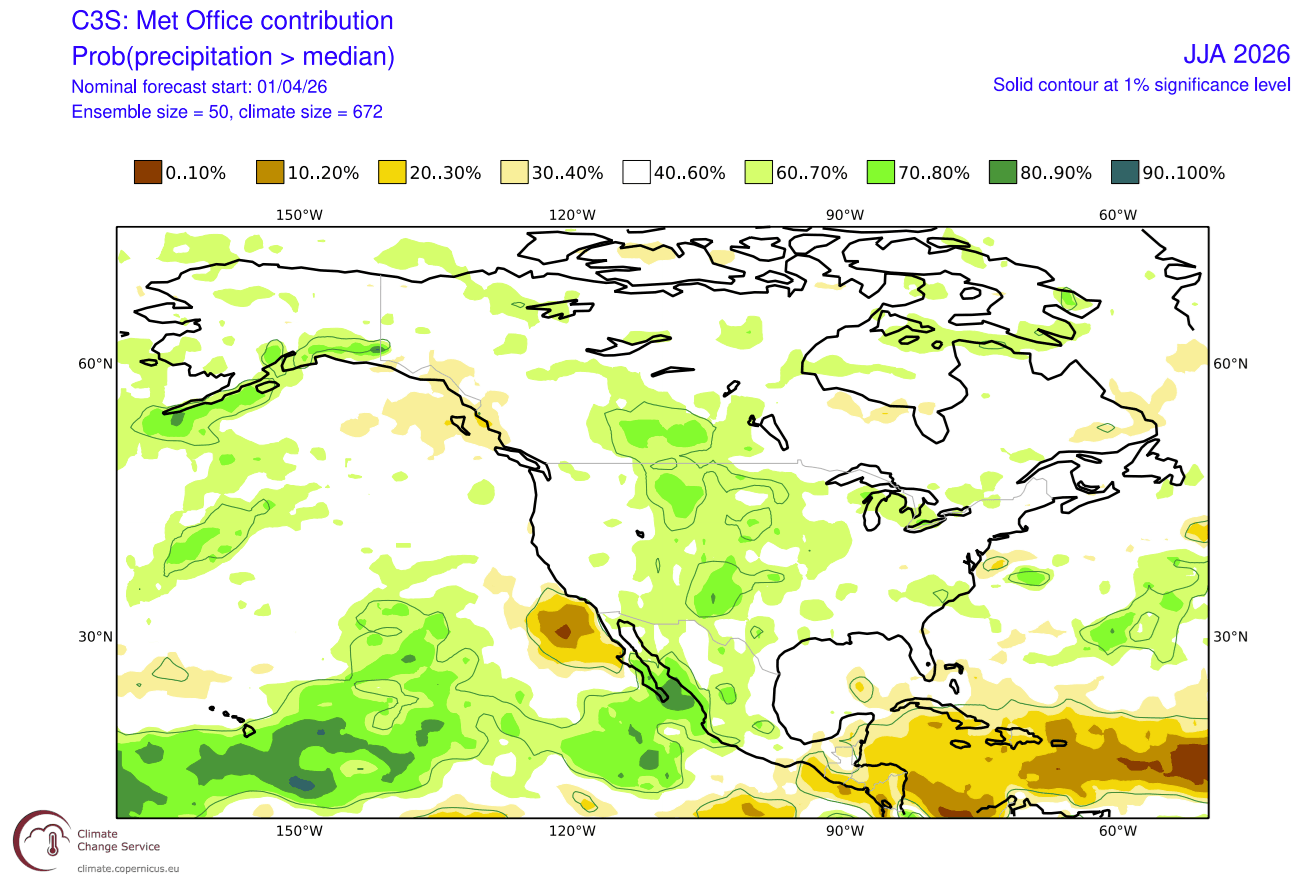
Looking at the precipitation forecast, we can see a very similar precipitation signal to the past data analysis. More rainfall is forecast over the western, central, and northeastern United States, the Midwest, and southeastern Canada.
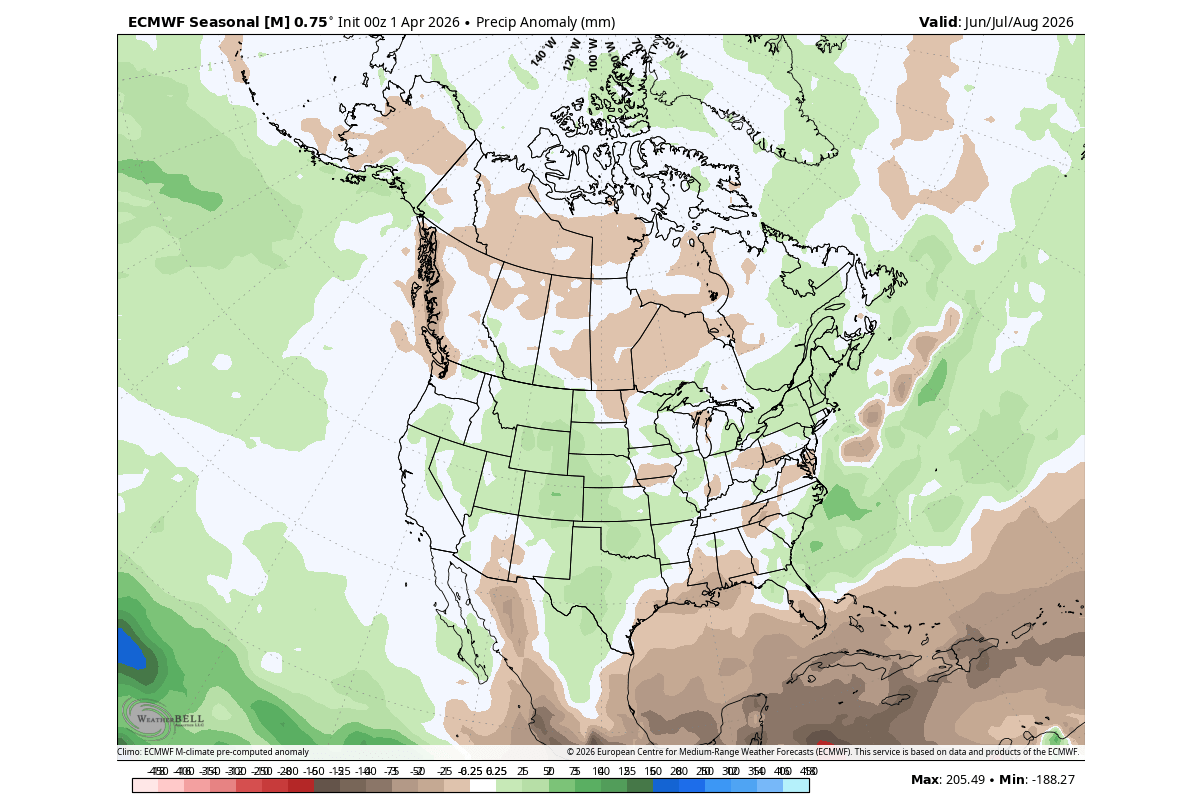
Less precipitation is forecast over the far southern United States, and also across southern and central Canada, and the Pacific Northwest.
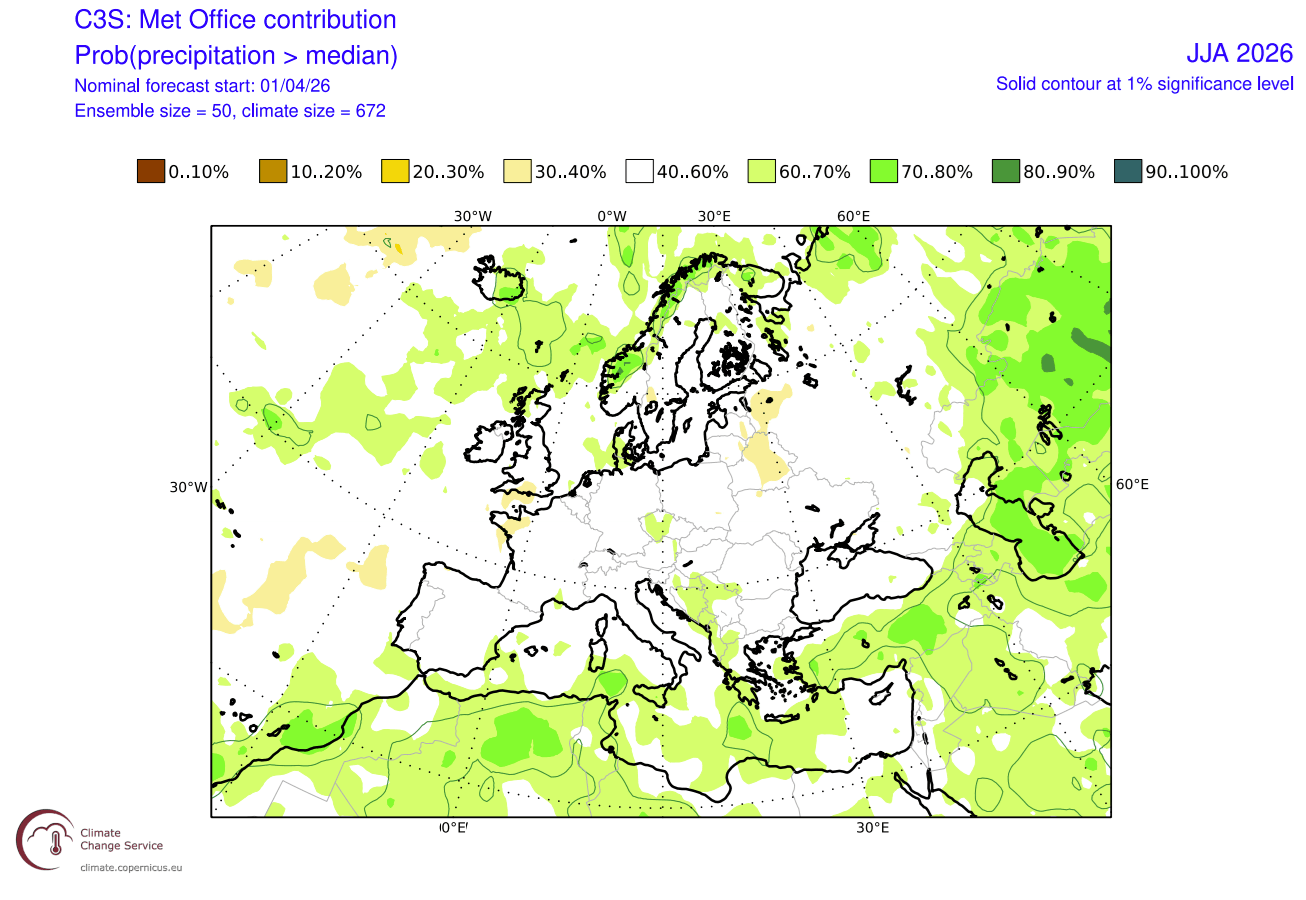
Over Europe, the forecast shows more rainfall than normal over the whole southern, south-central and eastern parts, and also over the far north. Less summer rainfall is forecast over the northwestern and central parts. Together with higher temperatures, this indicates a higher drought potential over central Europe.
Overall, the ECMWF forecast shows an interestingly similar signal to the past super El Niño events. It also confirms that the El Niño influence is already visible in the Summer weather patterns across the United States, Canada, and Europe.
Multi-Model Comparison: The UKMO Summer 2026 Weather Outlook
Our second model of choice is UKMO, from the United Kingdom Met Office. This model has been a strong performer over the past few years and has just received an upgrade, so we decided to add it for field testing and compare the results with the analysis after the season.
Looking first at the ocean forecast, we can see that the UKMO also shows a strong El Niño event by mid-summer. The central anomaly values are at or above +2 degrees, which is already nearing the super El Niño event, as it usually doesn’t peak until late Fall or early Winter.
Below is its latest long-range pressure forecast for Summer, and like the EMCWF, it also shows a somewhat similar pressure pattern to the past analysis. A low-pressure area is indicated in the northern or eastern parts of the U.S., with the second low-pressure area over the southwest, and one in the north Atlantic.
The difference from ECMWF is that it has the low-pressure area more southerly over North America, placing it in the Midwest, creating a more northerly flow into the United States. And in the Atlantic, the UKMO has a more northerly low-pressure area, creating a stronger southern flow over Europe.
The Summer temperature for North America in this model shows a very interesting picture, with a large area of normal to even below-normal temperatures across a large part of the central and northern United States and in the upper Midwest, and southern Canada. This is a clear indication of a more northerly flow due to the low-pressure area.
Above normal temperatures are forecast for the western and eastern parts of the United States, and southeastern and northern Canada, due to a southerly flow from the same low-pressure area.
Over Europe, this model shows a clear impact of the low-pressure zone in the North Atlantic. It helps to boost a more southerly flow into Europe, increasing the pressure and raising summer temperatures over much of the continent.
In the precipitation forecast for North America, the model aligns with ECMWF again, showing more precipitation than usual over the central, southern, and northern United States and southern Canada. More rainfall is also indicated over the upper Midwest and towards the East Coast. Less rain is expected over southern Florida, with normal to above-normal over the central and northern FL parts.
Over Europe, we also see a similar precipitation pattern to the previous model, with above-normal rainfall in southern and northern Europe. Normal to below-normal rainfall is currently trending in the central and western parts.
Overall, these forecasts tell a very interesting Summer story, both indicating a clear El Niño forcing in the atmosphere by Summer. We can also look at the official summer outlook over the United States, prepared by NOAA/CPC.
The Official NOAA Outlook: Summer 2026 Temperature and Rainfall Probability
The NOAA official Summer temperature outlook shows that a large part of the United States is expected to be warmer than normal. But we can see a “normal” area across the Midwest, likely expanding into the eastern United States. This is the same impact we have also seen above, due to a low-pressure zone somewhere over eastern Canada.
So this is actually close to the model forecasts above, confirming a common idea of a low-pressure area somewhere around Hudson Bay. All models see it, but we are still looking at where it will actually “land” and which forecast will have the correct placement.
But the official Summer precipitation outlook is somewhat different from the model forecasts. We see an equal-to-higher probability for more rainfall over the eastern United States and parts of the southwest. But we see a below-normal precipitation forecast for the central and northwestern United States.
This is in disagreement with the operational forecasts, which showed an area of above-normal rainfall across the central, west-central, and northern United States, a pattern also confirmed by past super El Niño events. This one will be interesting to see next month when NOAA updates it.
Another direct impact of the El Niño is also expected for the upcoming 2026 Atlantic Hurricane season, which usually starts around late Summer and lasts into Fall.
The Atlantic Hurricane Season: Why is El Niño a Natural Shield Against Tropical Storms
Based on scientific research, it is well known that an El Niño event reduces the number of Hurricanes and tropical systems overall in the Atlantic. The reason is that El Niño brings higher pressure to the Atlantic, stronger wind shear, and a stable atmosphere. This can prevent storms from organizing and intensifying into large systems.
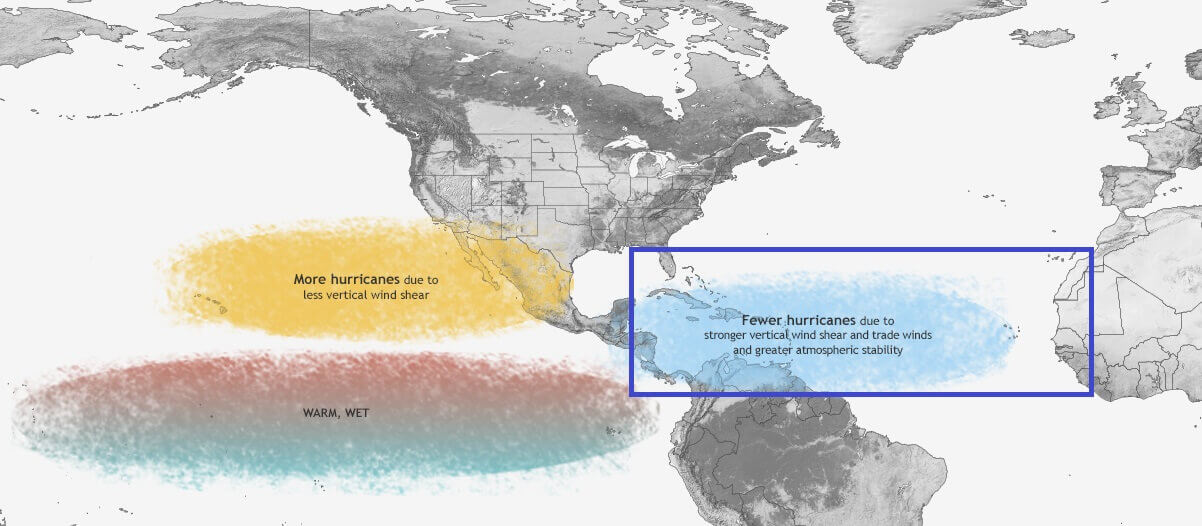
Below is the reanalysis for the hurricane seasons during super El Niño years. You can see much less precipitation in the main development zone during an El Niño, with increasingly less below normal rainfall as we get closer to the United States. The south coastal areas of the United States, the Caribbean, and most of the tropical Atlantic are drier than normal, indicating that El Niño is preventing major tropical development or hurricane landfalls.
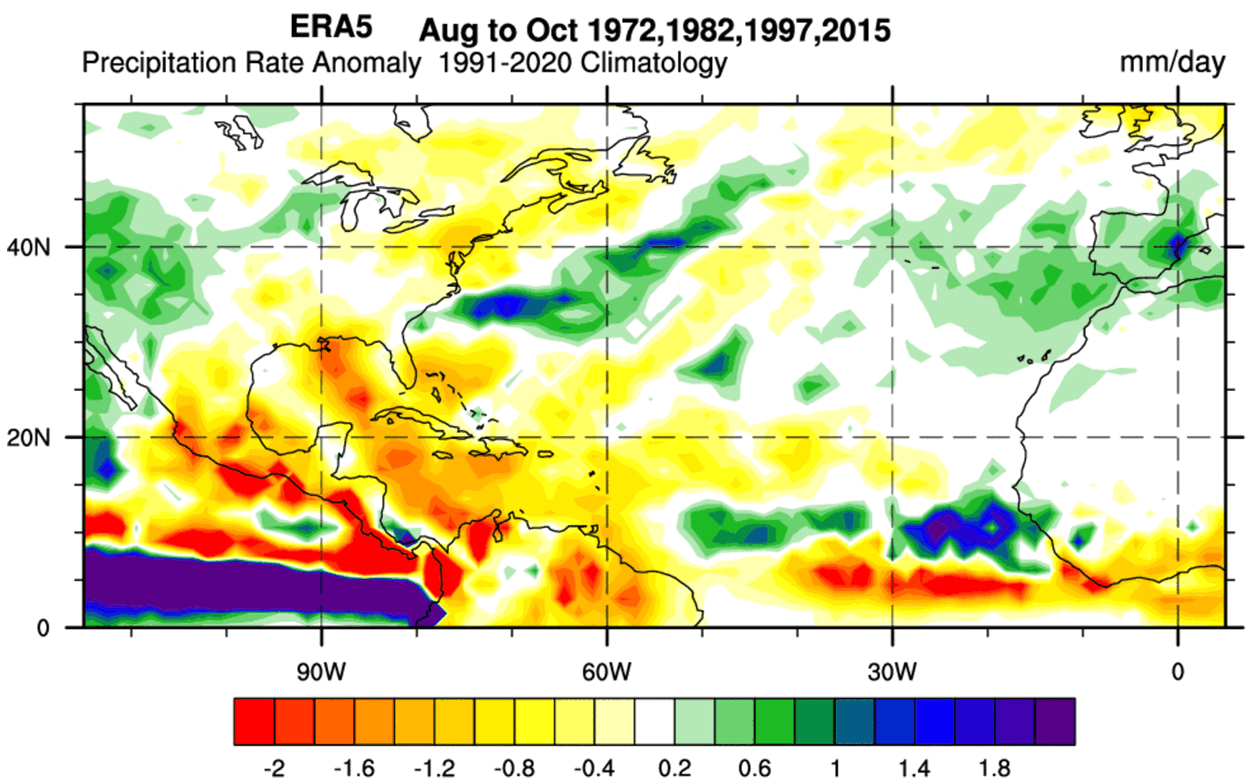
This is mostly due to higher pressure and more stable conditions across the tropical Atlantic. The final result is fewer tropical storms and/or weaker systems. So, an El Niño can act as a natural shield against strong hurricanes for the United States.
If we also look at the latest long-range precipitation forecast for the 2026 Hurricane season, it shows well below-normal rainfall in the main development region. This indicates suppressed activity and a lower chance of a large number of storms affecting the mainland United States or the Caribbean. The increased rainfall over the United States is local to the subtropical jet and pressure systems, not tropical systems.
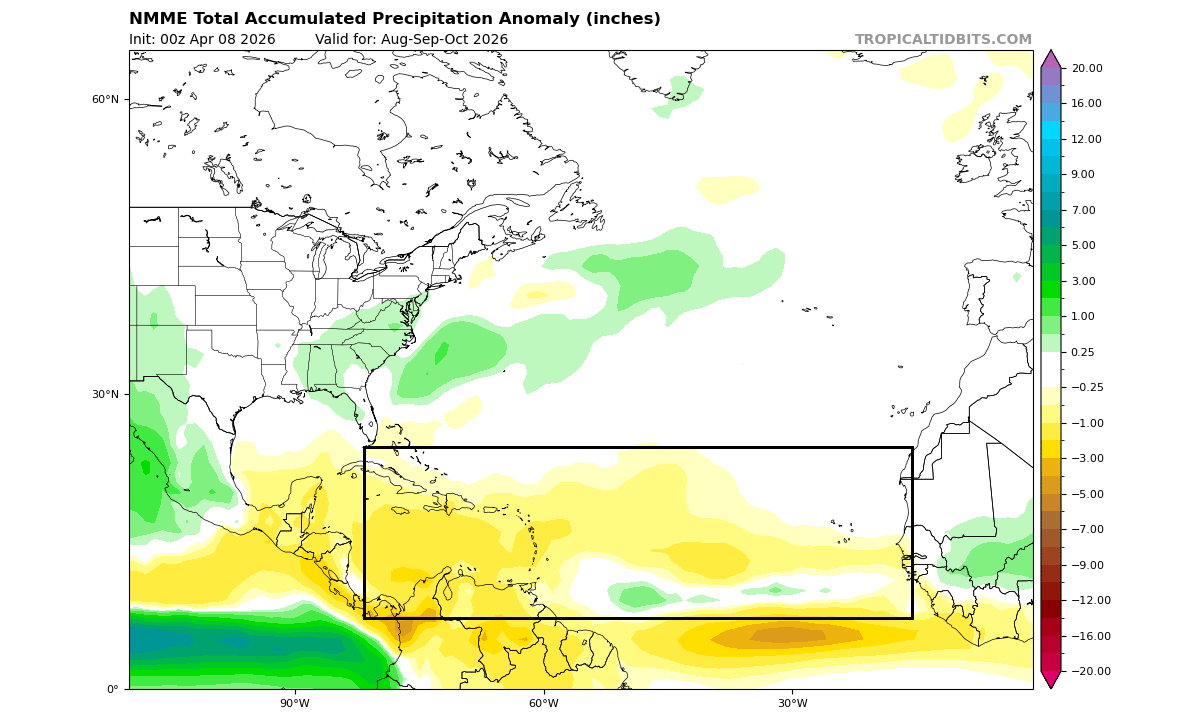
Every year still sees at least some tropical storm activity, even during the strongest El Niño’s, and a single system can still sometimes manage to get through the atmospheric “cracks”. The El Niño just makes it overall much harder for strong storms to reach into the United States.
Forecast and analysis images in this article are from cyclonicwx.com, Copernicus EU, and WeatherBell, using a commercial license.
We will keep you updated on global weather development and long-range outlooks, so bookmark our page. Also, if you have seen this article in the Google App (Discover) feed, click the like (♥) button to see more of our forecasts and our latest articles on weather and nature in general.
Don’t miss: