This guide will help you navigate the Severe Weather Europe (SWE) Satellite, Radar, and Lightning interface, a professional-grade tool designed for real-time monitoring of convective storms and severe weather across Europe and the United States. You can track atmospheric shifts with the precision of a professional meteorologist or a storm chaser.
1. Real-Time Satellite Imagery (Infrared, Visible, Geocolor, and Water Vapor)
The satellite layer is the foundation of the map, providing a “bird’s-eye view” of cloud structures.
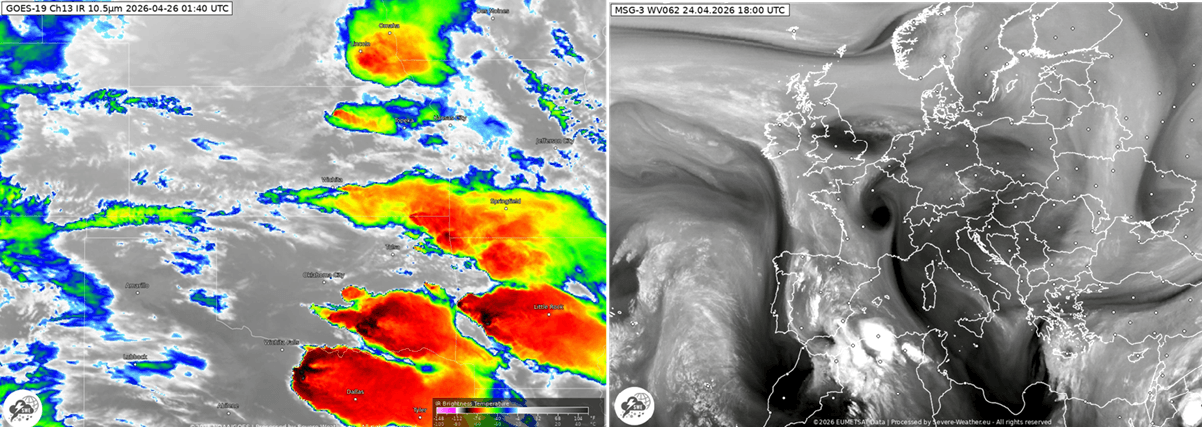
- Infrared (IR): This is the most common view used for tracking severe weather. It measures cloud-top temperatures in degrees Celsius.
– Cold Tops (Bright White/Colored): Deeply convective, high-altitude clouds. The colder the top (often shown in deep reds or purples), the more intense the updraft and the higher the potential for severe storms.
- Visible (VIS): Available only during daylight hours, this shows the texture of clouds. Meteorologists use this to spot “overshooting tops”—small bumps on top of an anvil cloud that indicate a powerful storm core.
- GeoColor (The “True-View” Experience): GeoColor is a multispectral product that creates a seamless, natural-looking view of the Earth. It is the most intuitive layer for non-experts.
– Daytime: It shows a “True Color” representation (simulating what the human eye would see from space). You can easily distinguish between white clouds, green vegetation, and brown dust or smoke.
– Nighttime: This is where it gets clever. It transitions into an infrared-based view where:
+ City Lights (Yellow): Visible as a static background to help you orient yourself over population centers.
+ Low Clouds/Fog (Blue/Green Tint): Unlike standard IR, GeoColor highlights low-level moisture and fog in a distinct cool color.
+ High Clouds (Gray/White): These remain traditional shades of gray.
- Water Vapor (The “Atmospheric Engine”): This doesn’t just show clouds; it shows the moisture in the middle and upper layers of the atmosphere, even where no clouds have formed yet.
– Bright White/Blue: High moisture content. This is where storms are likely to find the “fuel” they need to grow.
– Dark Orange/Black: Very dry air. Dry air “slots” are often found behind cold fronts or near jet streaks.
– Swirls & Spirals: Use this layer to find the Jet Stream and mid-atmospheric “vortices.” If you see a dark area “punching” into a moist white area, it often signals a rapidly developing low-pressure system.
Link to Satellite Page for Europe: SWE Satellite Viewer – Europe
Link to Satellite Page for the United States: SWE Satellite Viewer – United States
2. Weather Radar Overlay
While a satellite sees the top of the clouds, radar sees the precipitation inside them.
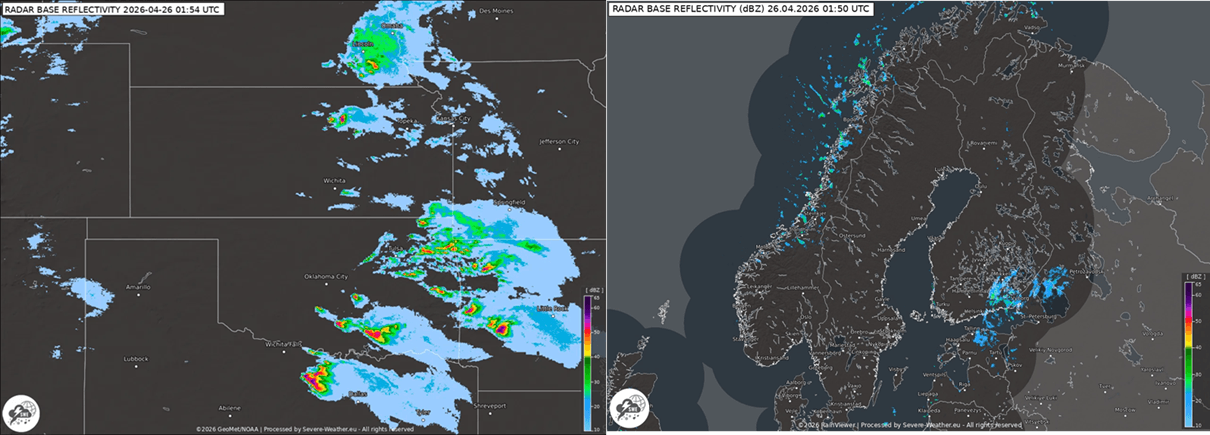
- Reflectivity (dBZ): The colors (green to red) indicate the intensity of precipitation.
– Green/Yellow: Light to moderate rain.
– Red/Pink: Heavy rain or hail.
– Purple/Violet: Extremely high reflectivity, often indicating large hail or “hook echoes” associated with strongly rotating supercells.
- Real-Time Animation: Use the play button on the timeline to see the “storm motion.” This helps you estimate when a storm will arrive at your location.
Link to Radar Page for Europe: SWE Radar Viewer – Europe
Link to Radar Page for the United States: SWE Radar Viewer – United States
3. Lightning Detection (Sferics)
The lightning layer is crucial for identifying active “electrical” storms. SWE uses high-precision sensor data to pinpoint strikes.
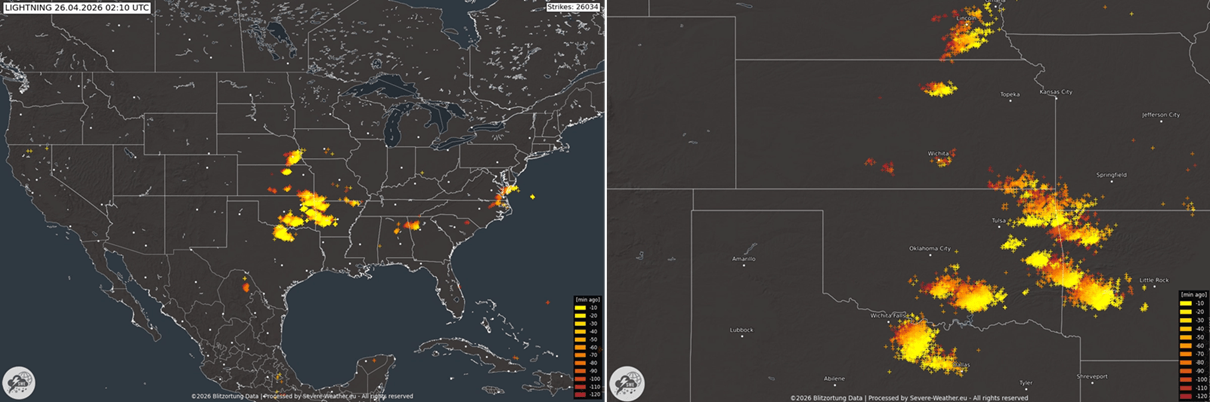
- Flash Markers: Strikes are marked by small crosses.
- Color Coding (Age): Most systems color-code strikes by time. For example:
– Yellow: Strikes that occurred in the last 0–5 minutes.
– Red/Orange: Older strikes (10–120 minutes ago).
- Lightning Density: A high concentration of “fresh” strikes in a small area usually indicates a rapidly intensifying storm cell (a “lightning jump”).
Link to Lightning Page for Europe: SWE Lightning Viewer – Europe
Link to Lightning Page for the United States: SWE Lightning Viewer – United States
4. How to Use the Navigation Panel
- Region Selector: You can toggle between “Europe-wide” and “North America-wide” views, or zoom into specific regions such as the Mediterranean, Central Europe, the UK/Ireland, Tornado Alley, and the Gulf of America.
- Time Step: Use the forward/backward arrows to analyze the trend. If the radar echoes are growing larger and the lightning frequency is increasing, the storm is likely intensifying.
5. Understanding Weather Forecast Models
While the Satellite and Radar tabs show what is happening now, the Weather Models page lets you look into the future. This section is essential for planning and identifying severe weather setups days in advance.
Key Features & Navigation
Model Selection: You can toggle between different numerical weather prediction (NWP) models.
- ECMWF (European): Widely considered the most accurate global model for medium-range forecasts.
- GFS (American): Excellent for broad trends and long-range outlooks.
- ICON (German): Often preferred for high-resolution details within Europe.
Variable Menu: Use the sidebar to switch between different atmospheric “layers.”
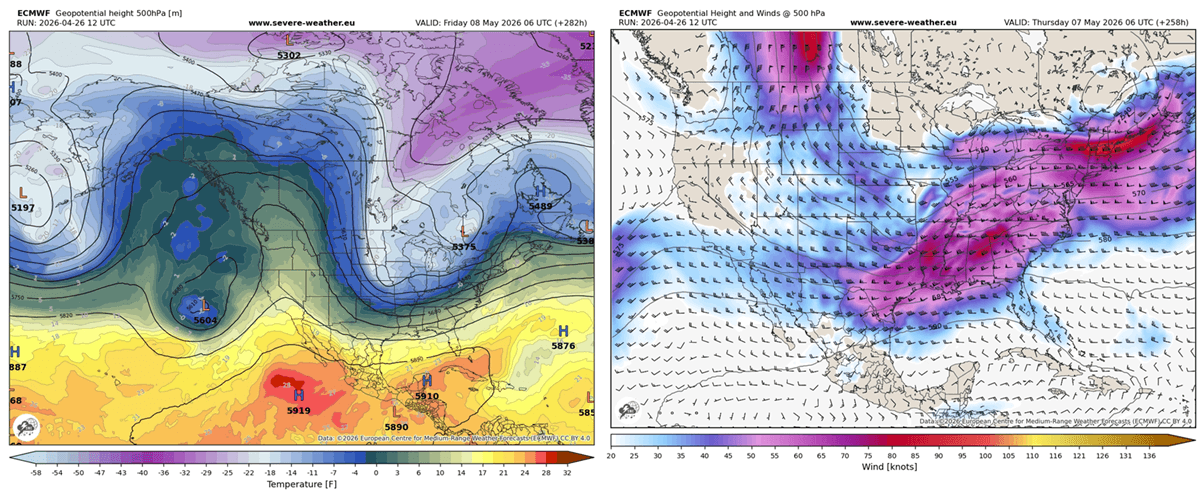
- Geopotential Heights + Winds (500 mbar)
– The “Atmospheric Steering” Layer: This map shows Geopotential Height (GPH) and Wind (W) at the 500 hPa pressure level (roughly 5,500 meters up). This is the “middle” of the troposphere and dictates where weather systems move.
– Troughs (U-shapes): Areas of low height/pressure. These are the “storm engines”—ahead of a trough is where the most violent weather typically breaks out.
– Ridges (Omega or n-shapes): Areas of high height/pressure. These usually bring stable, clear, and warm weather.
– Wind Streamlines/Barbs: These show the Jet Stream. Strong winds at this level provide the “exhaust” for surface storms, helping them become organized and long-lived.
- Total Precipitation (The “Accumulation” Forecast): This layer shows the total amount of water (rain and melted snow) expected to fall over a specific period.
– Color Intensity: Usually ranges from light blue (a few millimeters) to deep red (200mm+).
– Flood Risk: Use this to identify areas at risk of “training” storms—where multiple thunderstorms follow the same path, leading to dangerous flash flooding.
– Consistency Check: If the “Total Precipitation” footprint stays in the same spot over multiple model runs, your confidence in a heavy rain event should increase.
- Temperature 2m (Surface Temperature): This is the forecast for the air temperature 2 meters above the ground—the standard height for weather station thermometers.
– The “Real Feel” Setup: It is used to identify Frontal Boundaries. A sharp contrast in “Temp 2m” over a short distance indicates a cold or warm front.
– Convective Triggering: In the summer, watch for high 2m temperatures (30°C+) combined with high humidity; this builds the “instability” that leads to evening thunderstorms.
– Freezing Line: In winter, the 0 °C or 32 °F line on the 2m map is the critical boundary between rain and snow.
- 850 hPa Temperature: Temperatures at roughly 1,500m. This is used to track cold/warm air masses without the interference of ground-level terrain.
- CAPE/Instability: Crucial for storm chasers! CAPE (Convective Available Potential Energy) measures the “fuel” available for thunderstorms. Higher values mean more explosive storm potential.
The Timeline Control: Use the slider at the bottom to “scroll” through time. Most models update 2–4 times a day (runs), providing forecasts in 1-hour or 3-hour increments.
Link to Weather Models Page: SWE Weather Models Viewer
Pro Tip: Comparing Models
Severe weather forecasting is about consensus. If both the ECMWF and GFS models show a high-wind event or heavy rainfall in the same area at the same time, the “confidence” in that forecast is high. If they disagree, the weather remains “uncertain,” and you should check back during the next model run.
How to use the SWE Weather Interface
- Step 1: Start with the Models page to see if severe weather is predicted for your area in the coming days.
- Step 2: On the day of the event, switch to the Satellite, Radar, and Lightning page to track the storms in real-time as they develop and move.
** Feel free to bookmark the SWE Weather Models and Radar, Satellite, Lightning Interface to stay up to date with the latest weather events.**
Link to Weather Models Page: The SWE Storm Watcher’s Interface
See the most recent articles:
- A Powerful Omega Block is Funneling an Arctic air Intrusion into Europe, Threatening the 2026 Growing Season
- Latest Forecast: Super El Niño to Influence Arctic Sea Ice Loss and Raise Winter Weather Risks for 2026/2027
- Latest Forecasts Show a Super El Niño Event Developing, Bringing a Global Weather Disruption in 2026/2027