UPDATE 19th June, 2026: A Seasonal Weather Shift Is Forming as Super El Niño Connects with Record-Low Arctic Sea Ice
Arctic sea ice is currently experiencing a significant deficit, with the latest satellite observations revealing the second-lowest extent on record for mid-April. This early-season trend is being closely monitored as the tropical Pacific shifts into a strong El Niño event, which is projected to influence the polar regions through deep atmospheric connections.
As the 2026 melt season progresses, the development of a Super El Niño is expected to impact Arctic sea ice extent and volume. The interaction between tropical ocean anomalies and the polar ice cap creates a specific set of atmospheric conditions that is likely to influence global weather patterns and the stratospheric Polar Vortex in the coming seasons.
In this analysis, we examine the current state of the Arctic, the latest ENSO development, and the physical mechanisms linking tropical warming to polar sea ice loss. We also look at the long-range implications for the 2026/2027 Winter season, and the potential for increased stratospheric disruptions.
Arctic Sea Ice Analysis: Monitoring the 2026 Spring Deficit
The Arctic region is a large ocean, and it has no large-scale landmass. It is the smallest and shallowest of the world’s oceans, and it is also the coldest. And given its large size and location, it can play a significant role in seasonal weather development.
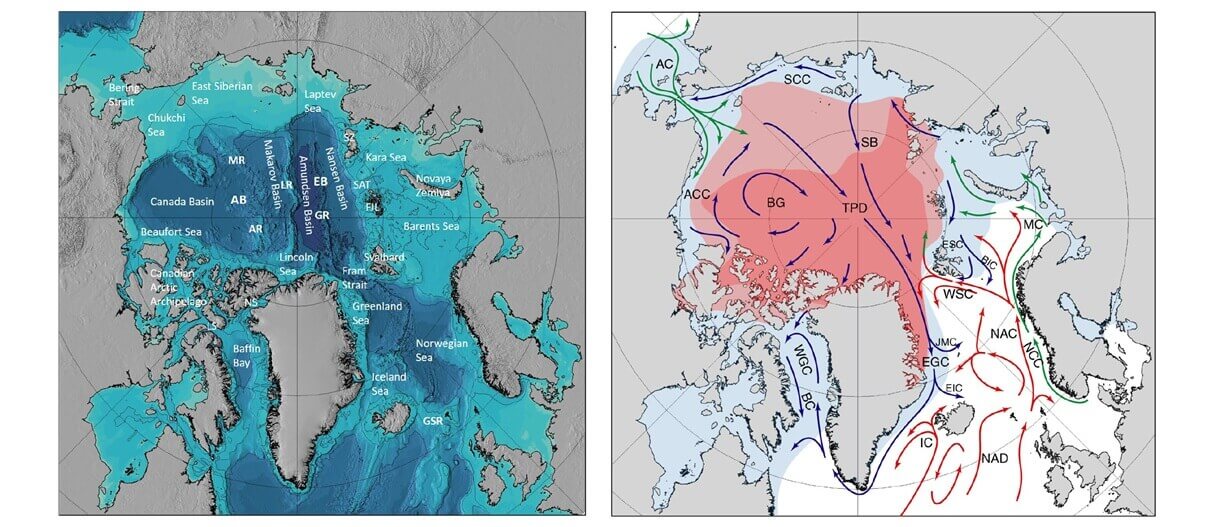
In the image below, you see the Arctic Ocean as it would look without water, revealing a very complex underwater terrain. You can see the main regions of the Arctic Ocean, and on the right, the usual surface currents and sea ice motion. Image from a study by Rudels and Carmack.
The Arctic sea ice has its own seasonal cycle, and you can see it in the image below from NSIDC. It nicely shows the seasonal change in sea ice extent over a single year. The melt season usually starts in late March and lasts well into September, reaching a grand minimum before re-freezing starts in October.
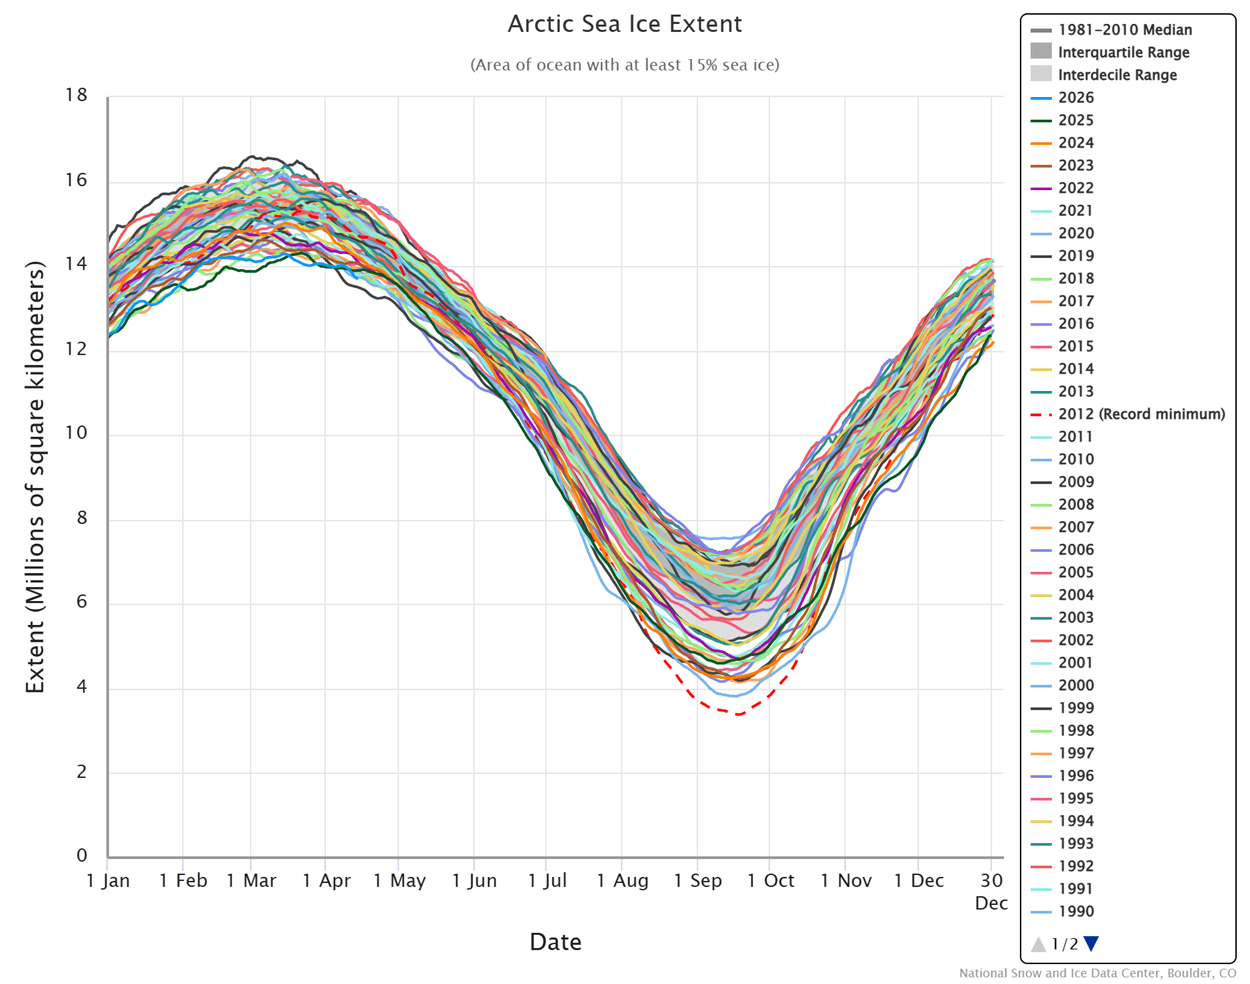
On the graph, you can see lines for the past 46 years. The dashed red line marks the 2012 season, which still holds the record for the lowest ice extent since satellite measurements began.
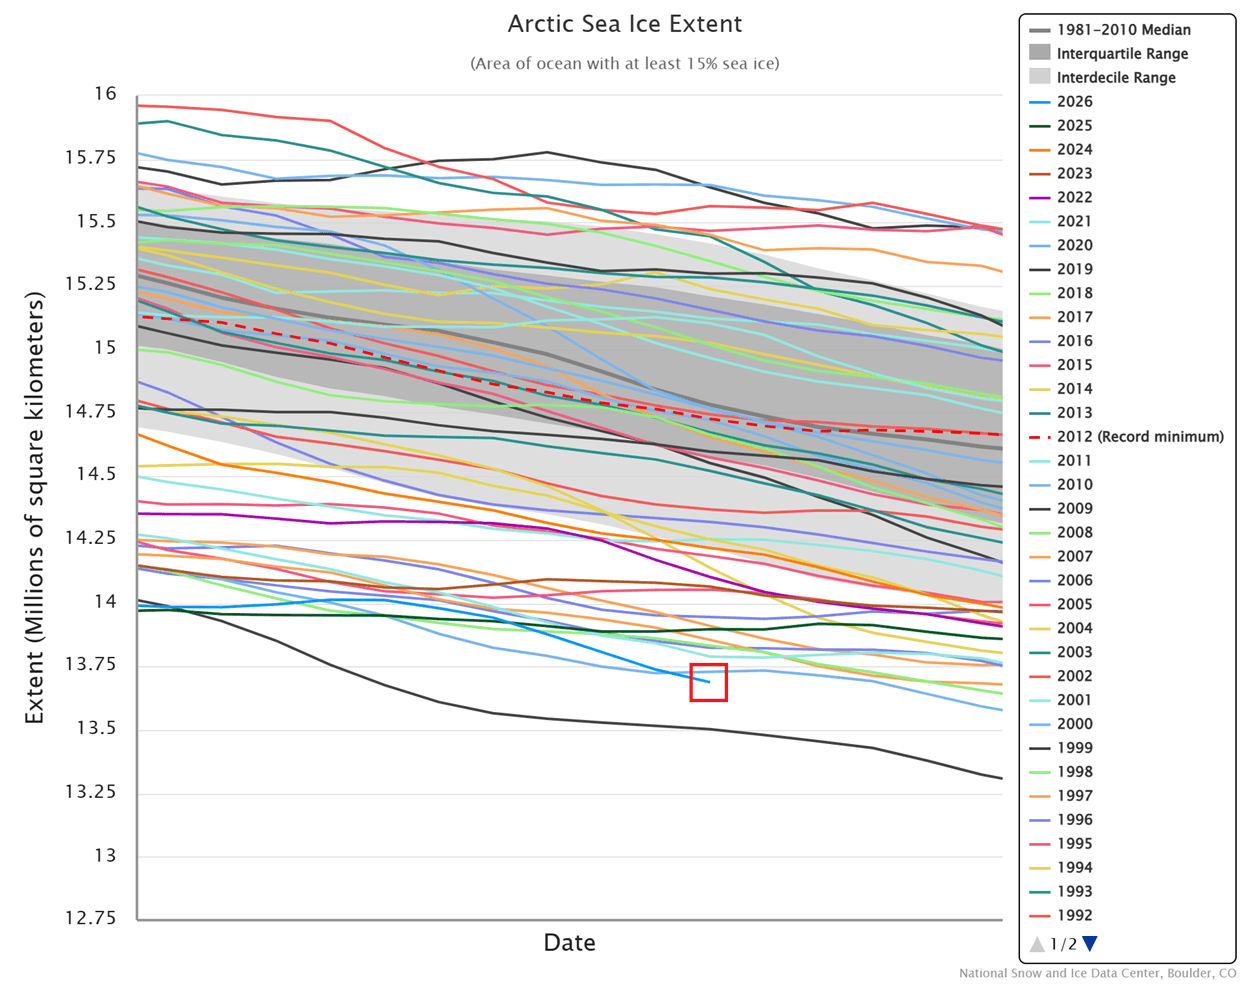
If we compare the current state (red box) to past years, you can see a big difference compared to 2025 (green line) and especially past decades. Sea ice extent is about 0.2 million square kilometers lower than this time last year. We are currently at the second-lowest sea-ice extent for this time of year, with only 2019 having a lower extent, also seen in the graph as the bottom-most line. Image by NSIDC
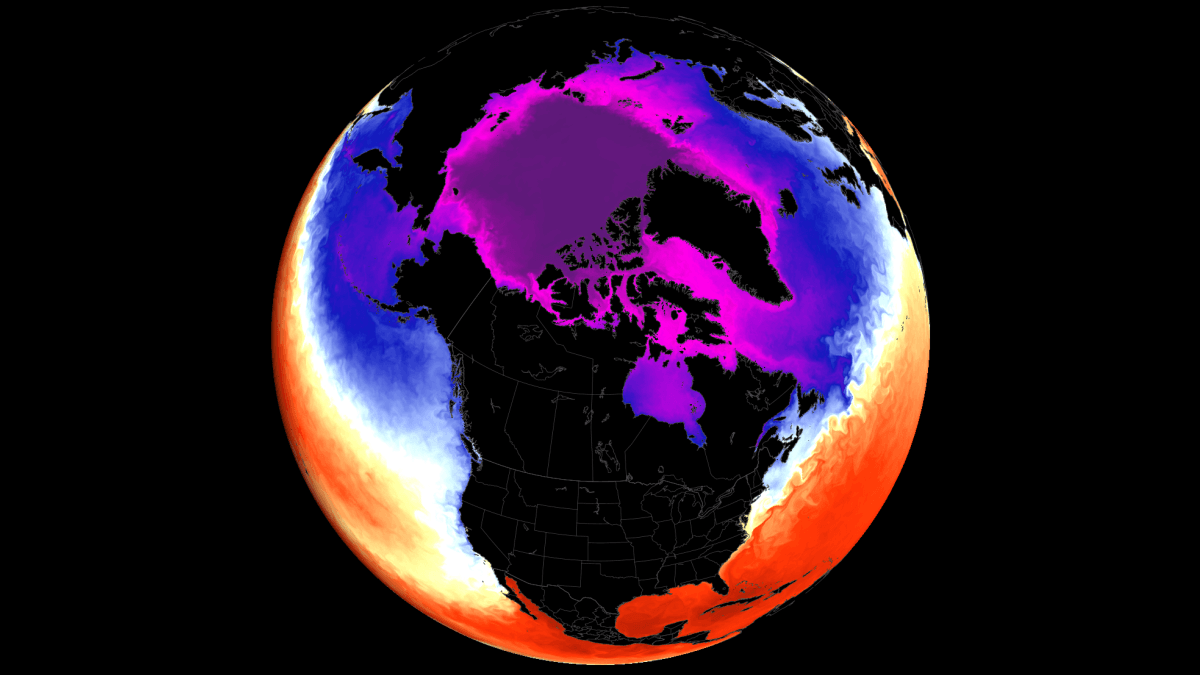
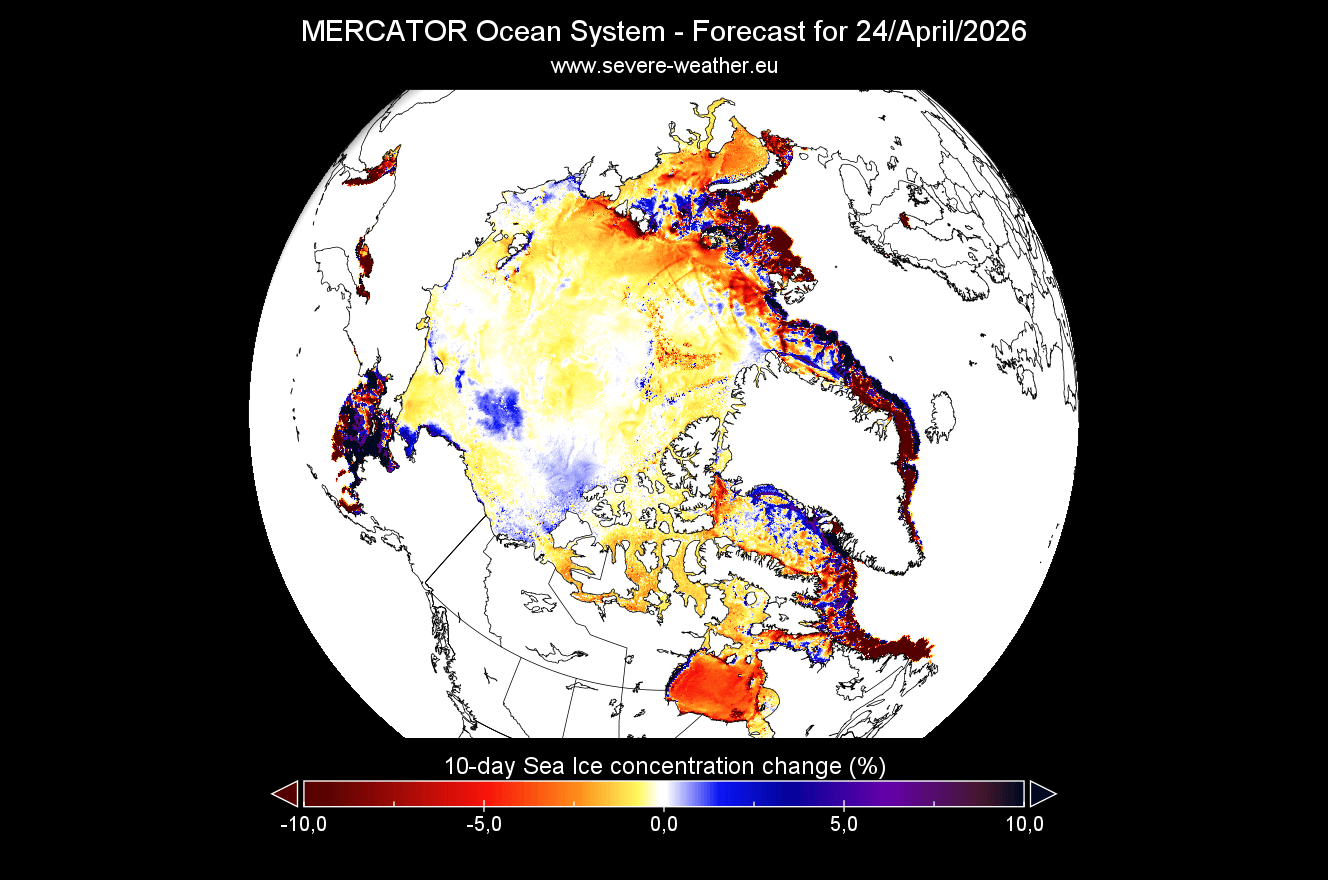
But Arctic sea ice is much more than just extent and area. Below you can see our own graphic, which shows the sea ice concentration change. It shows us the forecast change in sea ice concentration over the next 10 days. It is clear that the melt season is in full swing, with the outer edges of the icecap experiencing full melt and eventual seasonal sea ice disappearance.
With the area and thickness known, we can calculate the total volume of the icecap. Below is the sea ice volume graph, which shows a different cycle, with the volume peaking later, usually in late May, because the polar regions are still cold. The 2026 sea ice volume is lower than last year, and is projected to also peak significantly lower than several recent years.
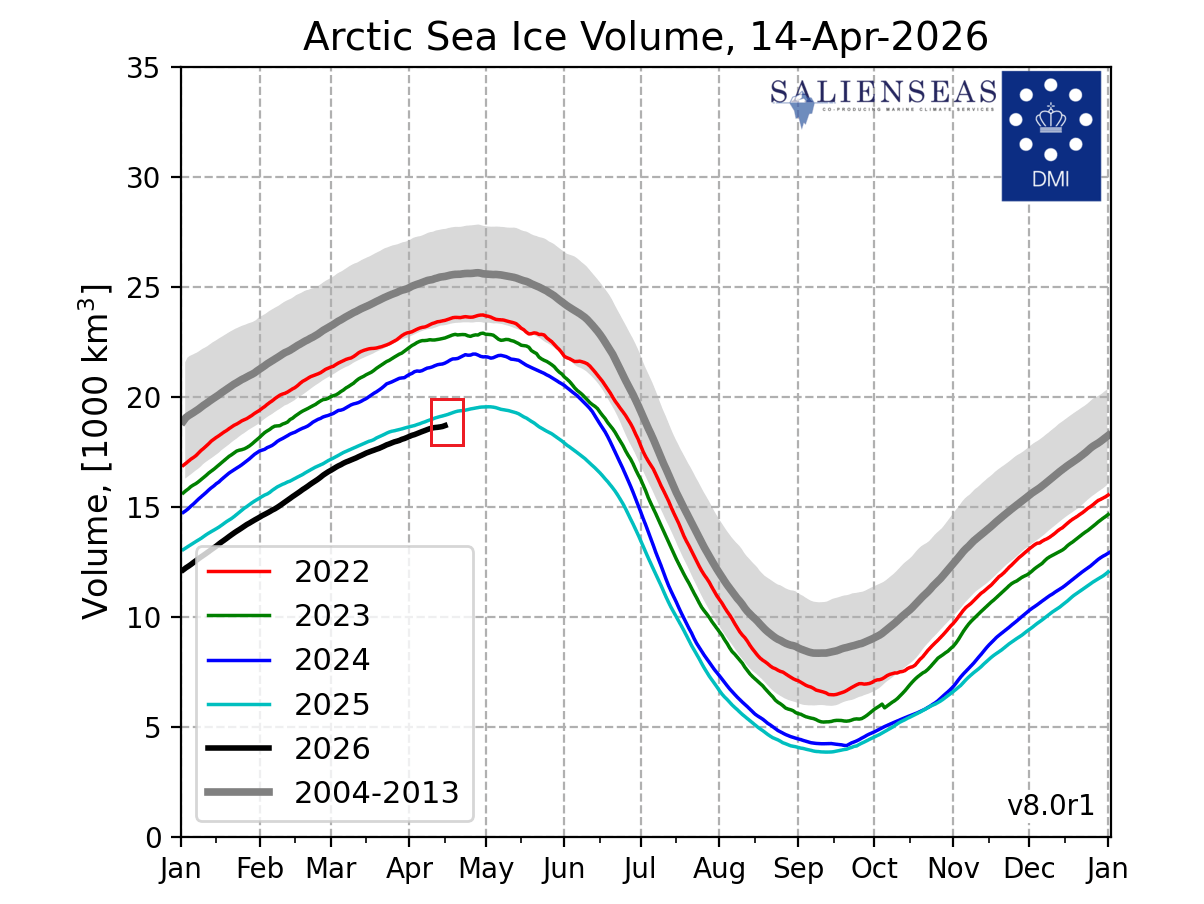
This is not a healthy ice cap, and under certain weather patterns, it will struggle to withstand rapid melting, potentially reaching a new record low in September. This can be further amplified by the upcoming El Niño event, which is currently forecast to likely develop into a Super event.
ENSO Evolution: Tracking the Shift Toward a Super El Niño
El Niño is a warm phase of the ENSO system. This is a region of the equatorial Pacific Ocean that changes between warm and cold phases in about every 1-3 years. El Niño significantly alters tropical pressure and circulation patterns, affecting weather worldwide, especially during a strong event.
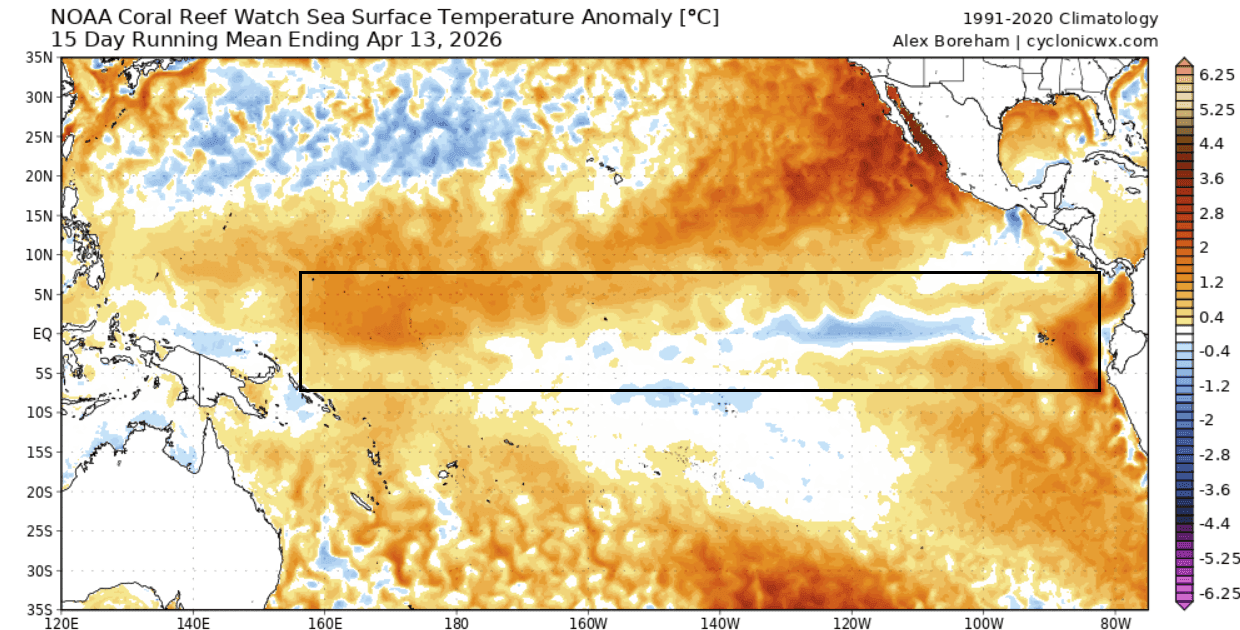
The latest surface analysis below also shows the main ENSO region with disappearing cool patches, and most of the region is already in positive anomalies. The central and eastern areas are expected to experience increased warming in the coming weeks as a warm Kelvin Wave rises beneath the ocean surface.
You can see this dynamic process in the video below, which shows the last 90 days of ocean temperature changes in the ENSO region. You can see an active weak La Niña (cold) event just two months ago and how rapidly it started to collapse in recent weeks, with a warm anomaly emerging.
Strong Kelvin waves can bring important temperature changes deep beneath the ocean surface, and you can see it in the image below. It shows the latest subsurface ocean temperature anomalies across the tropical Pacific, with a large subsurface Kelvin wave at around 100-250m (300-800ft) depth.
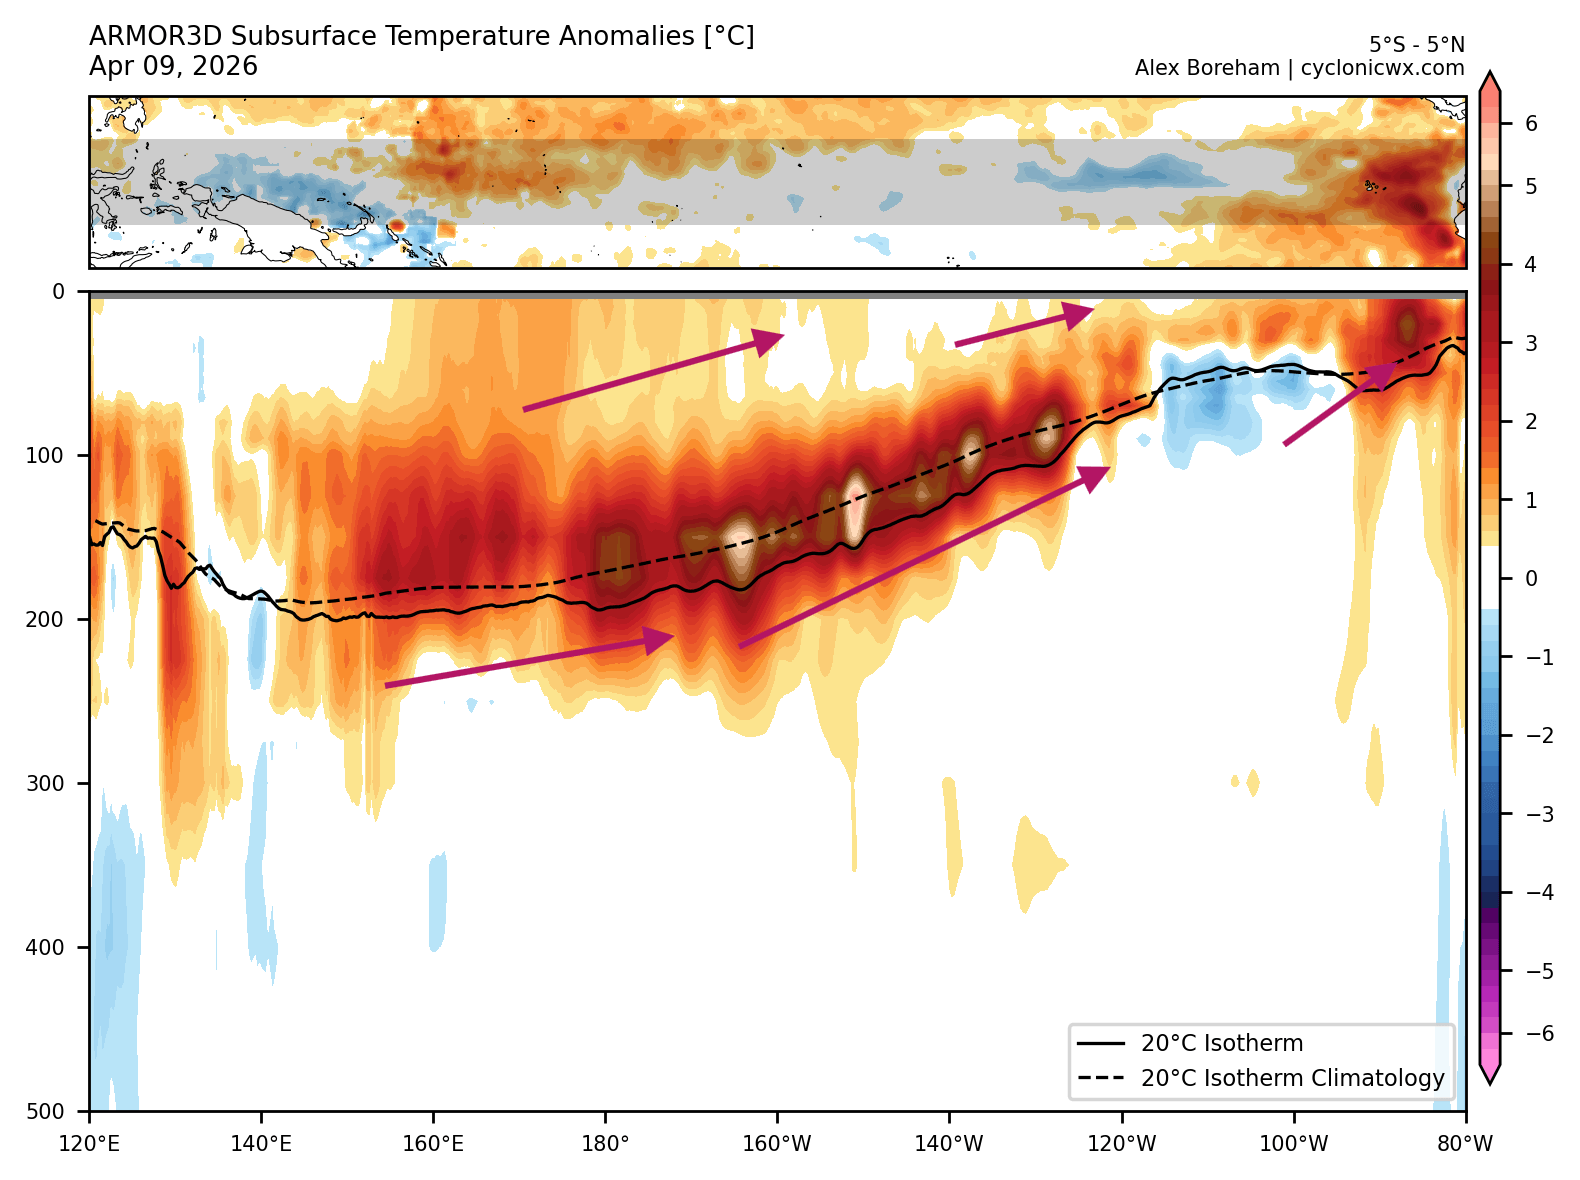
This oceanic Kelvin wave, currently moving eastward, will emerge at the surface as the visible El Niño event. These subsurface Kelvin waves are driven by the westerly trade wind bursts across the tropical Pacific, showcasing a powerful connection between the oceans and the atmosphere.
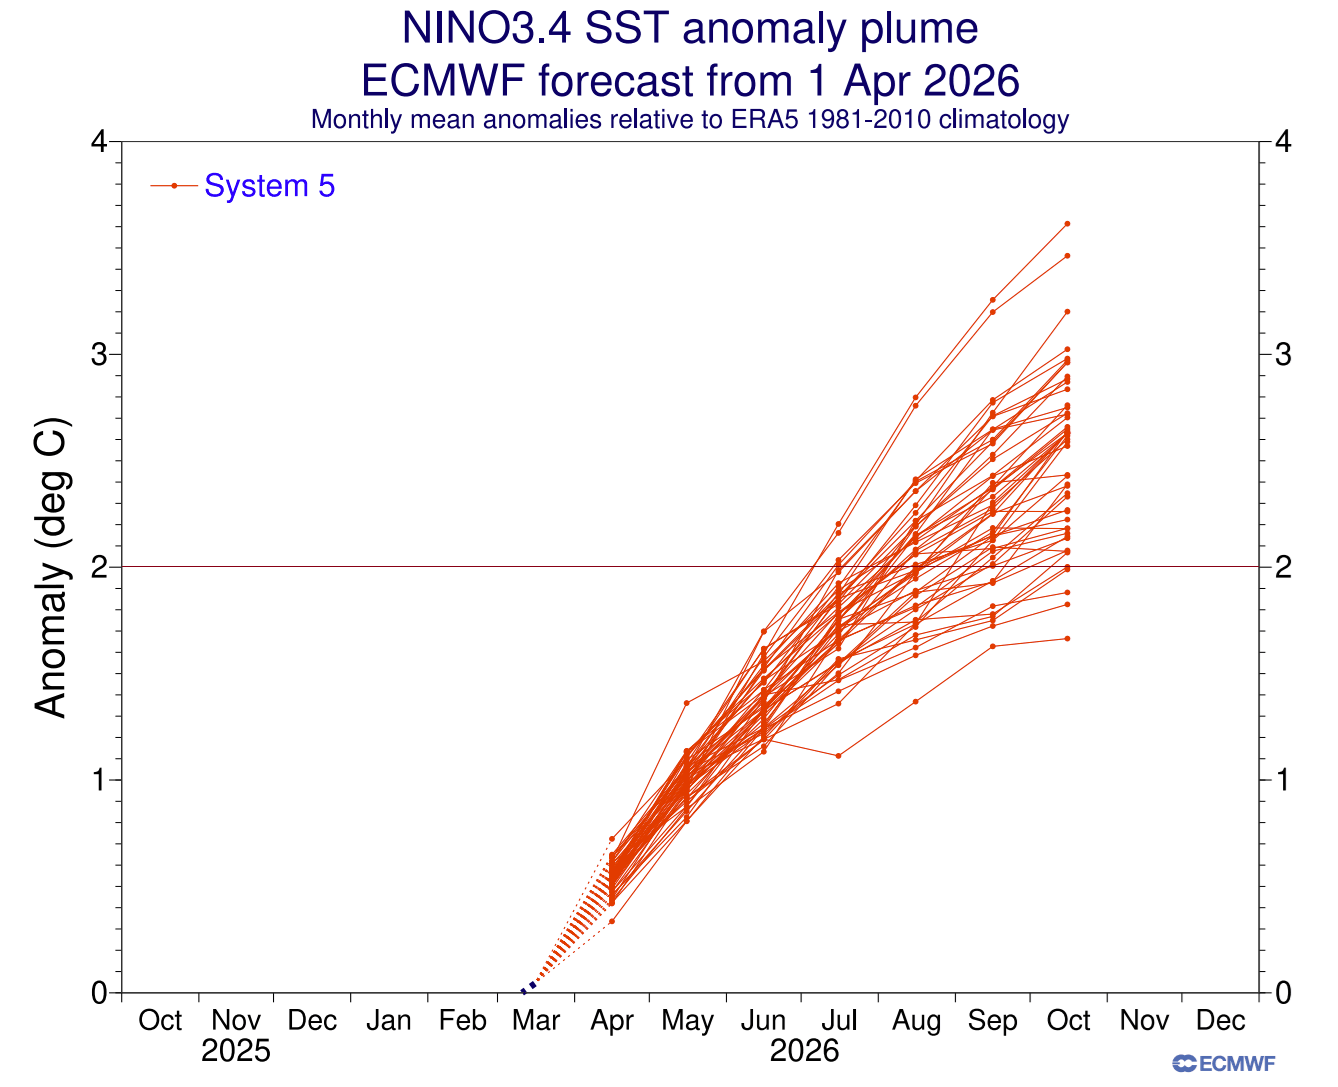
Below is the latest ECMWF ensemble model forecast for the next few months. It shows a strong El Niño developing into 2026, exceeding the +2 degrees threshold and pushing it into the Super event category. Most ensemble members exceed this boundary, aiming even higher for the peak, which is usually around Winter.
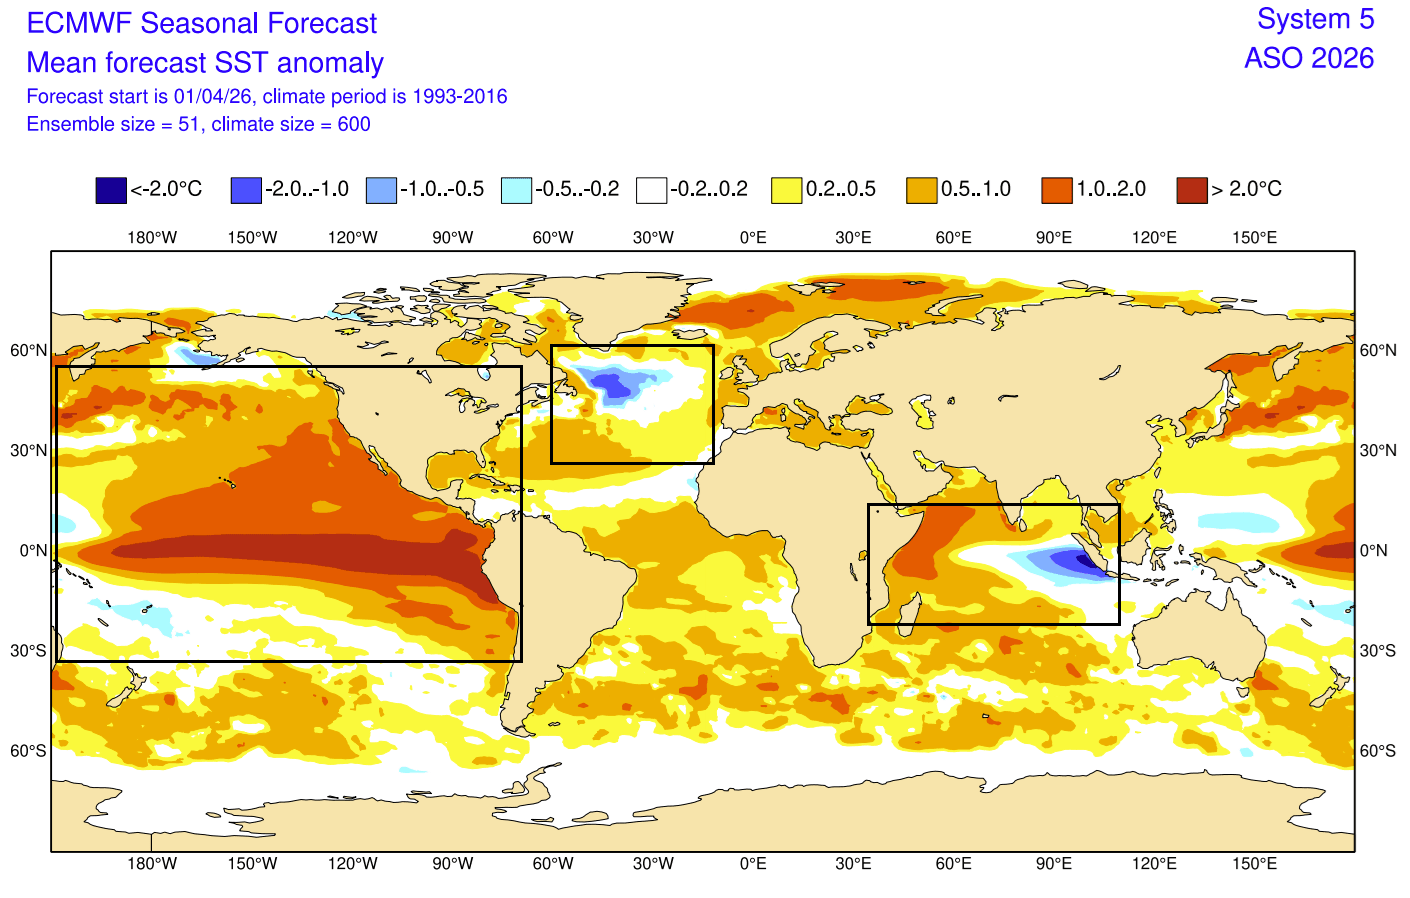
We can get a better idea of this event by looking at the latest ECMWF forecast for the August-October period, which shows a significant El Niño anomaly across the tropical and northern Pacific. The anomaly values exceed +2 degrees across the whole ENSO region, consistent with the strength of a Super El Niño event. You can also see warm ocean waters around the polar icecap.
A Super El Niño is scientifically recognized when sea surface temperature anomalies in the Niño3.4 region exceed a threshold of +2.0 or higher above the long-term average. This is used to identify events of high intensity in which atmospheric coupling is strong enough to shift global weather patterns into a high-impact state.
One of these impacts is also felt across the Arctic sea ice, driven by shifts in global pressure patterns and the resulting warm-air and cold-air transport over the polar regions.
Atmospheric Connections: How El Niño Influences Arctic Sea Ice
The peak of the sea ice melt season is in September, when the lowest extent is reached. For this reason, we tend to look at the August-October period in forecasts or past reanalysis to get the best idea of how the entire minimum season can evolve.
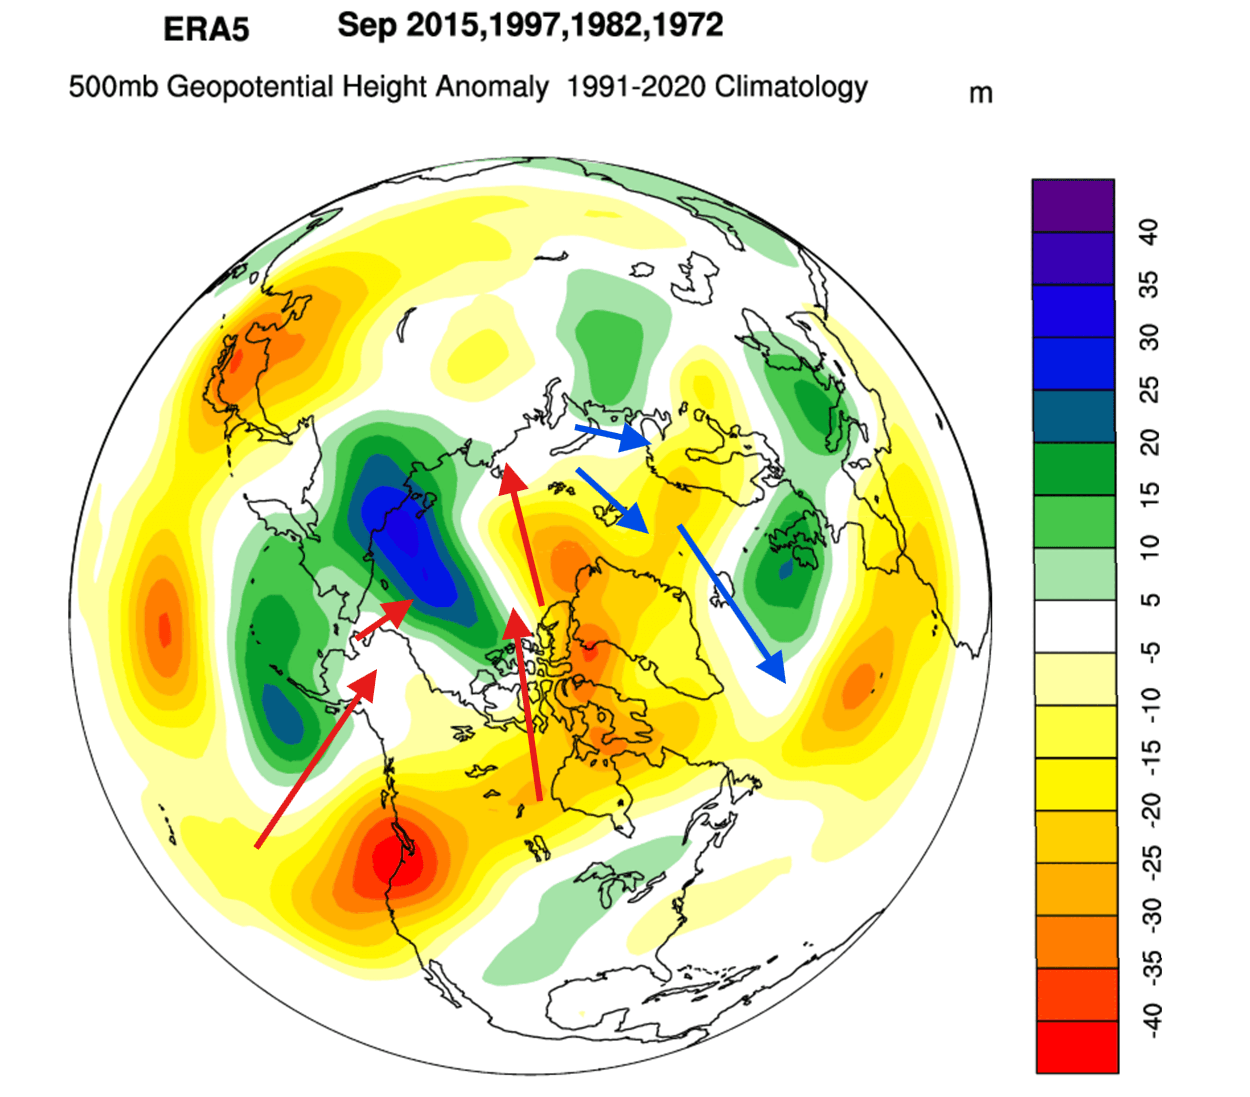
Below is a reanalysis of the September pressure anomaly pattern during the last 4 Super El Niño events, with arrows indicating airflow. You can see the low-pressure area in the North Pacific and the Aleutians, which brings warmer air into the western and central Arctic regions. At the same time, a cooler flow is on the eastern side of the Arctic.
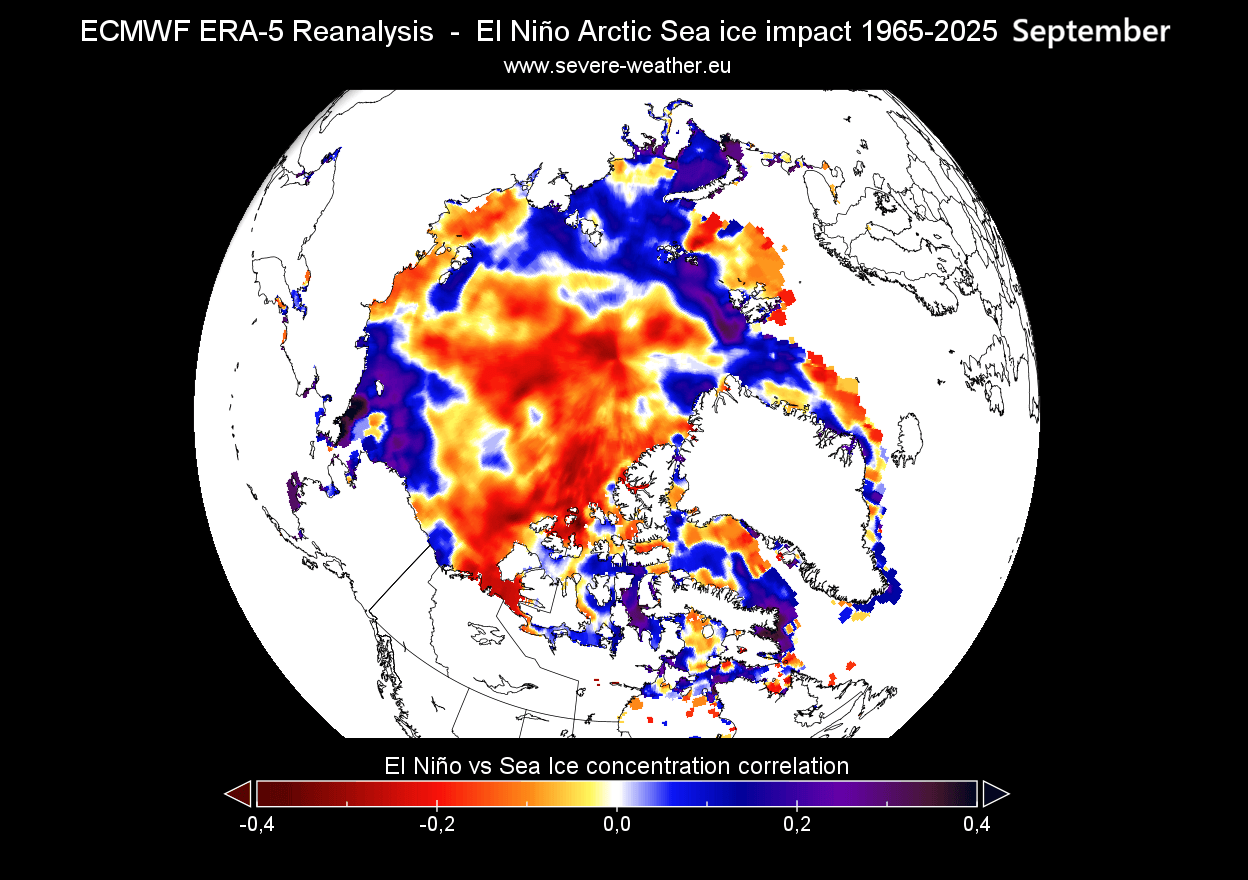
We can see the usual El Niño sea-ice impact in the image below, which shows areas of higher or lower ice concentration during the lowest month. What it shows is similar to the expected airflow, which indicates increased melting under the warm flow area in the Beaufort Sea and the central Arctic Ocean.
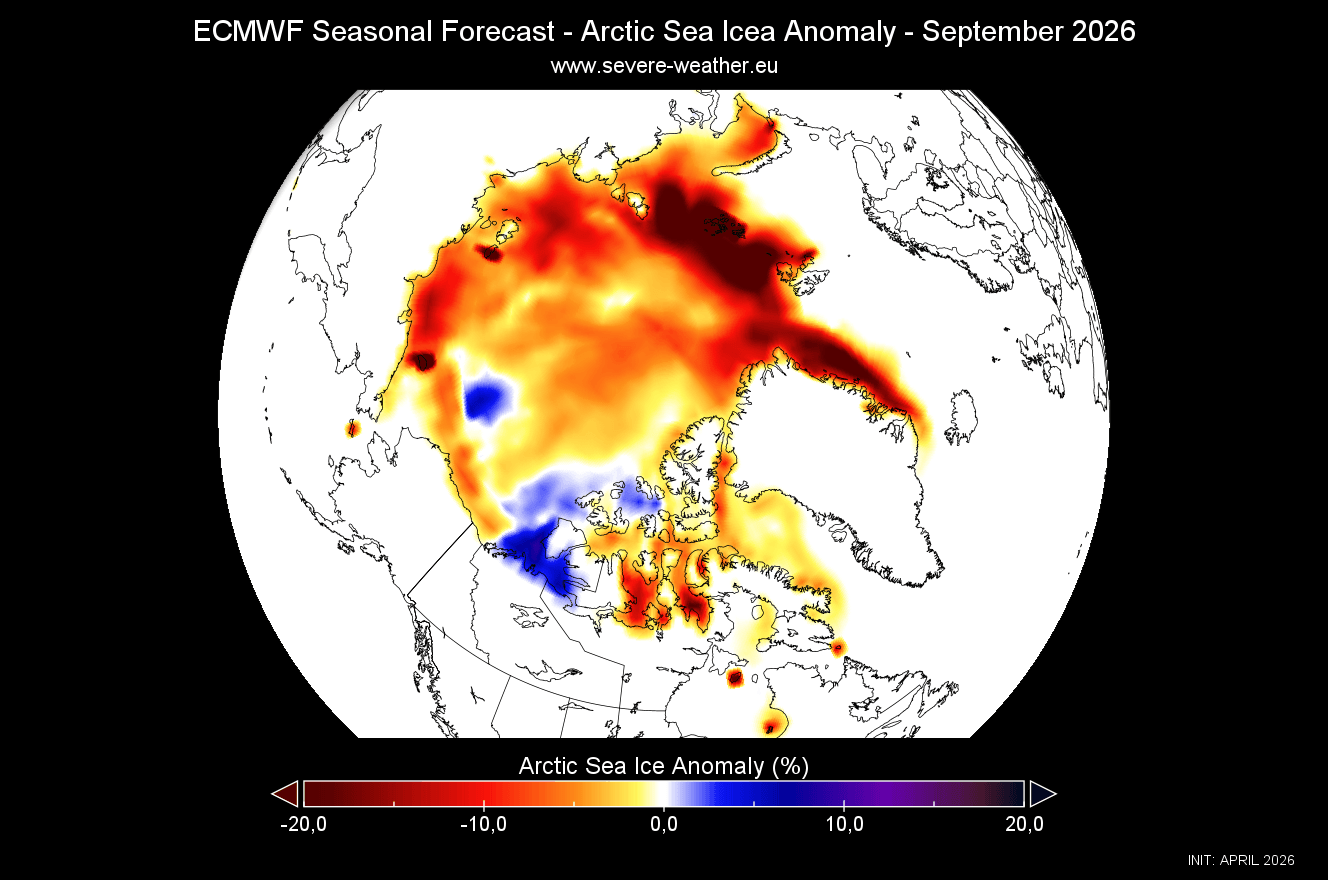
If we look at the actual September sea-ice concentration anomaly forecast from ECMWF, we can see an above-average melt season over most of the Arctic region. This is especially significant in the outer regions, which mostly experience full melt in recent years.
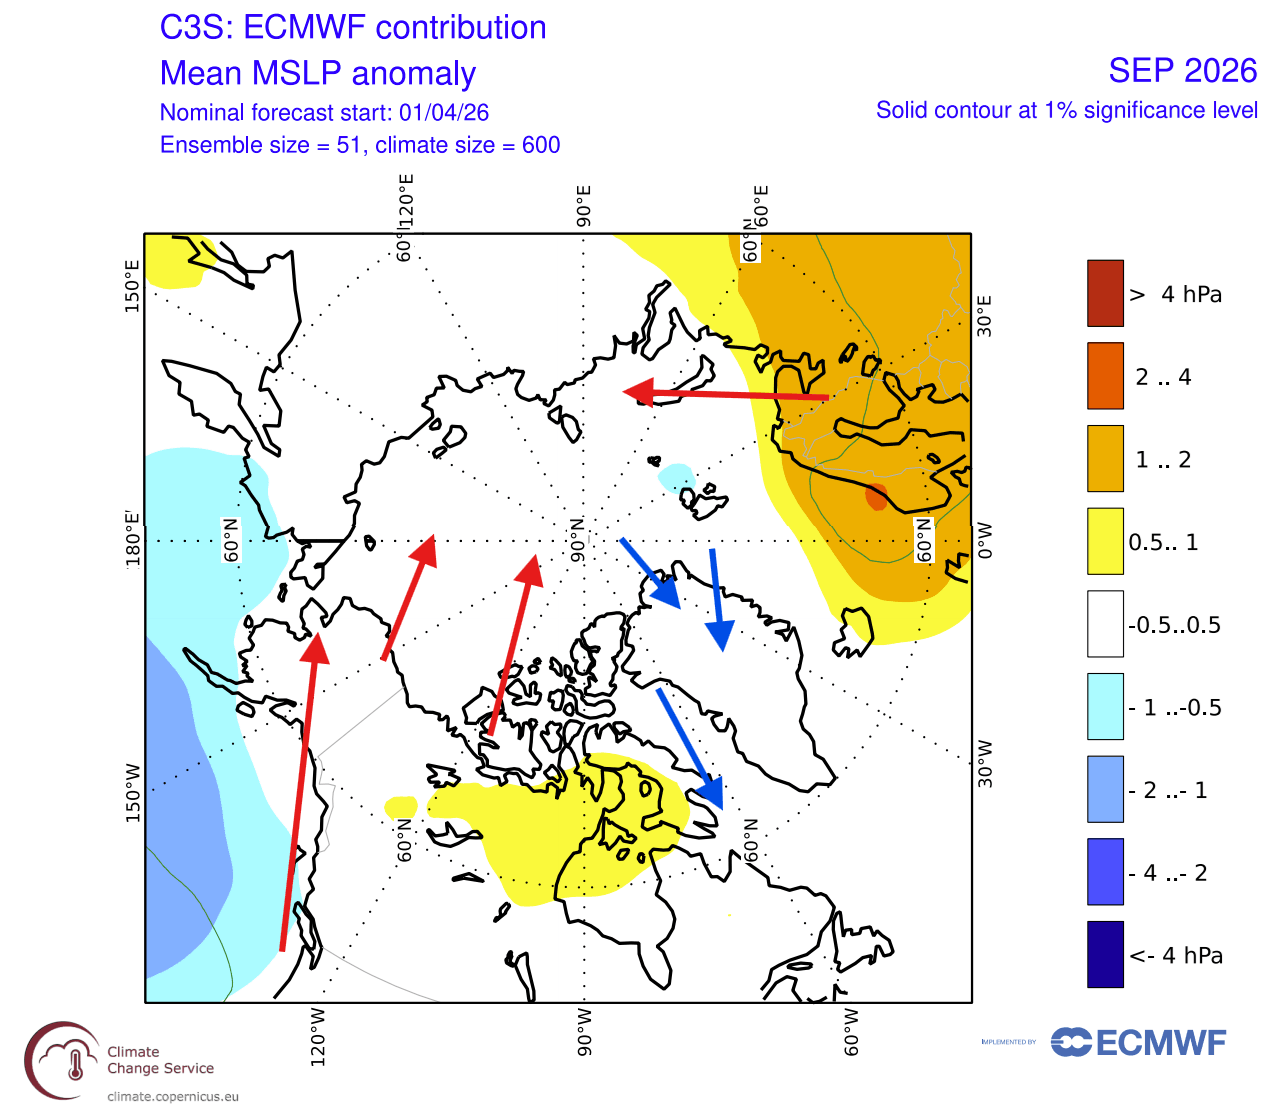
The sea-level pressure (MSLP) forecast also explains why current predictions support a stronger melt season. You can see a low-pressure area indicated over the North Pacific and the Aleutians. This is a typical El Niño effect, which helps drive warmer airflow into the Arctic. In the eastern parts, a high-pressure area is over Scandinavia, also boosting a warmer flow.
We also decided to compare proper atmospheric pressure patterns. On the left is the historical Pressure pattern that tends to bring the lowest sea-ice extent in September, and it’s obvious why: two key low-pressure areas sit on each side of the Arctic, acting like pumps to push warmer southerly flow into the Polar Circle.
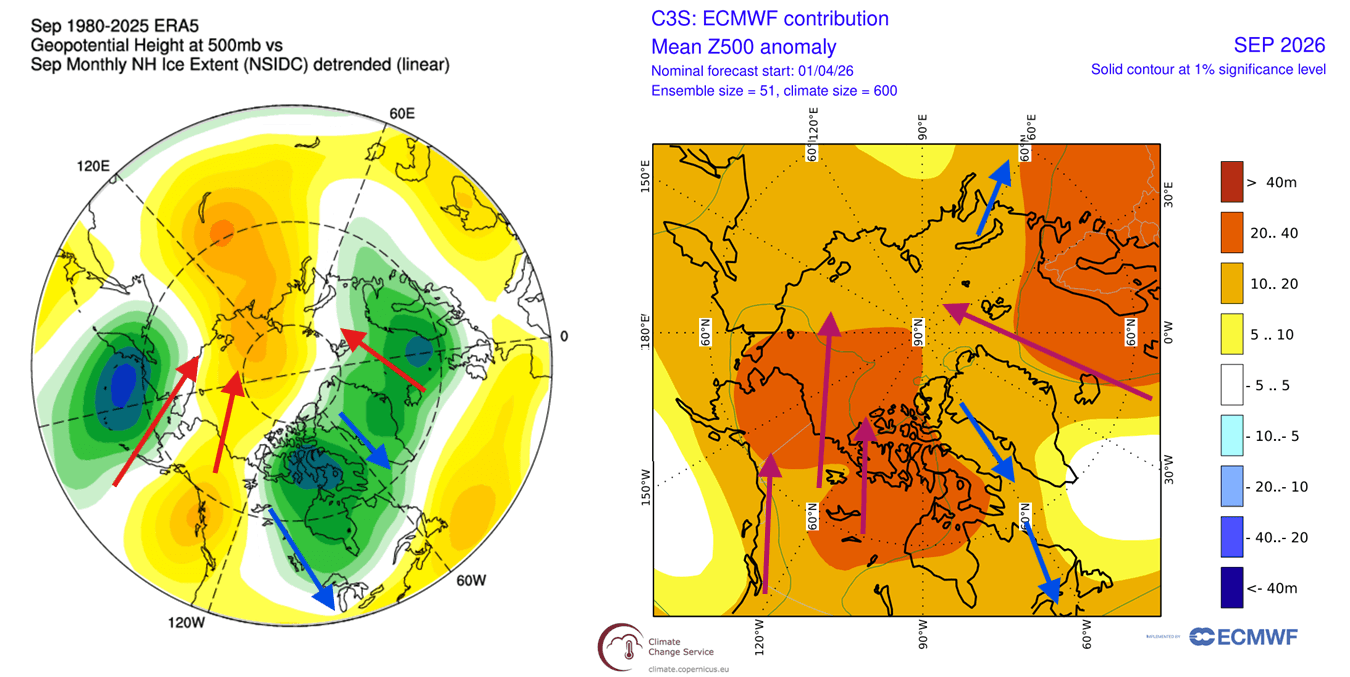
On the right, we have the ECMWF forecast for September. This is just an early trend, as we are still far out. It shows the correct idea, with a warmer flow on both sides of the Arctic Ocean, similar to the pattern with the lowest sea-ice extent.
But how does lower Arctic sea ice then influence winter weather over the United States, Canada, and Europe? One key element in that connection is likely the stratospheric Polar Vortex.
Winter Circulation: The Link Between Sea Ice and the Polar Vortex
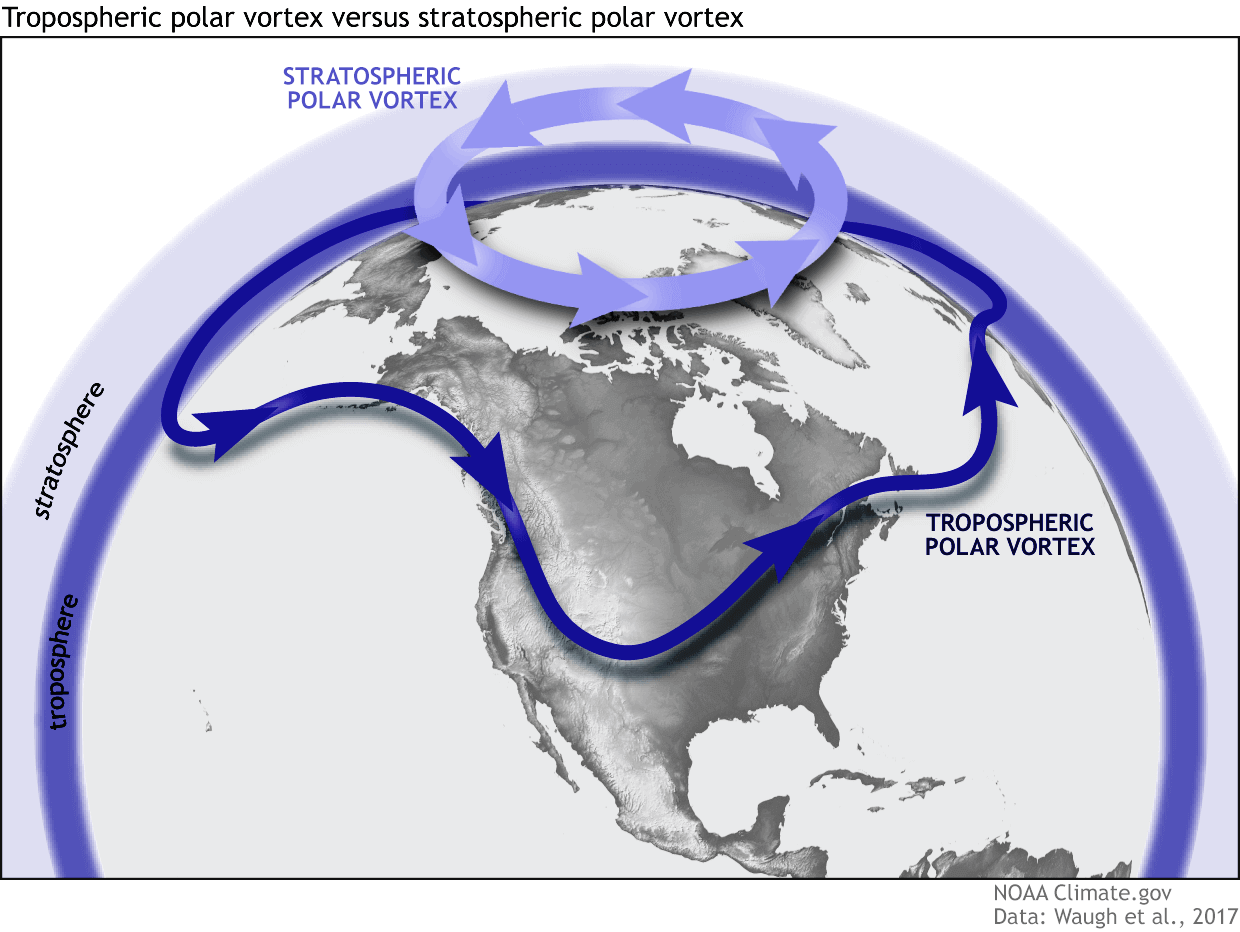
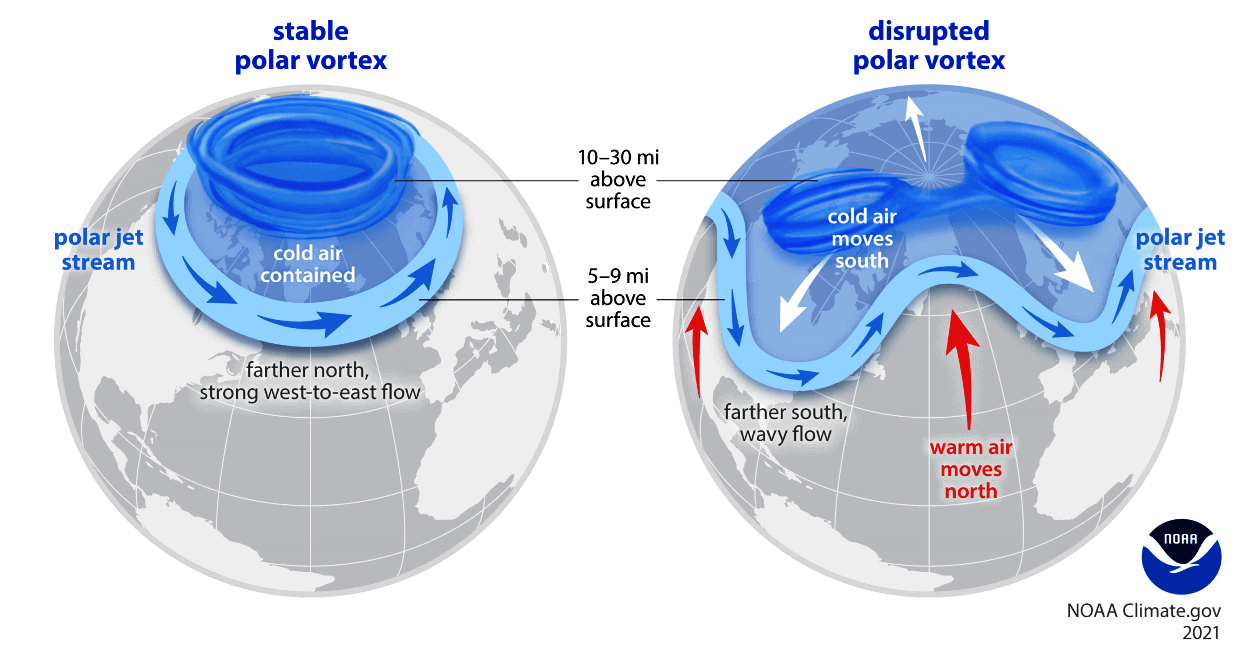
Polar Vortex is the broad winter circulation over the northern (and southern) hemispheres. You can imagine it as a spinning wall over the polar regions, rising from the surface into the stratosphere (over 50km/30 30miles high), trapping the cold polar air inside.
As seen in the image below, the Polar Vortex is divided into two layers that we monitor each winter: the stratosphere above and the troposphere below. The first is at a higher altitude, and the second is at a lower altitude. The Polar Vortex rises high through both layers, but with different shapes, strengths, and impacts.
The state of the Stratospheric part of the Polar Vortex has an important impact on the lower circulation. A strong/stable Polar Vortex locks the colder air into the polar regions, preventing it from spilling out into lower latitudes. This creates milder conditions for most of the United States and Europe.
But when the Polar Vortex is disrupted or collapses, it can no longer contain cold air, releasing it outward toward the mid-latitudes. This allows the cold air to spill into the United States and other mid-latitude regions. Below is an example of how a disrupted Polar Vortex releases cold polar air into the United States and Europe.
You can see a great example of a disrupted Polar Vortex in the 3D analysis below from late January. High-pressure areas with stratospheric warming waves were compressing the Polar Vortex, elongating its structure. This caused the lower parts to push the lower core into North America, allowing a strong northerly flow with an Arctic airmass to spill into the United States, Canada, or parts of Europe.
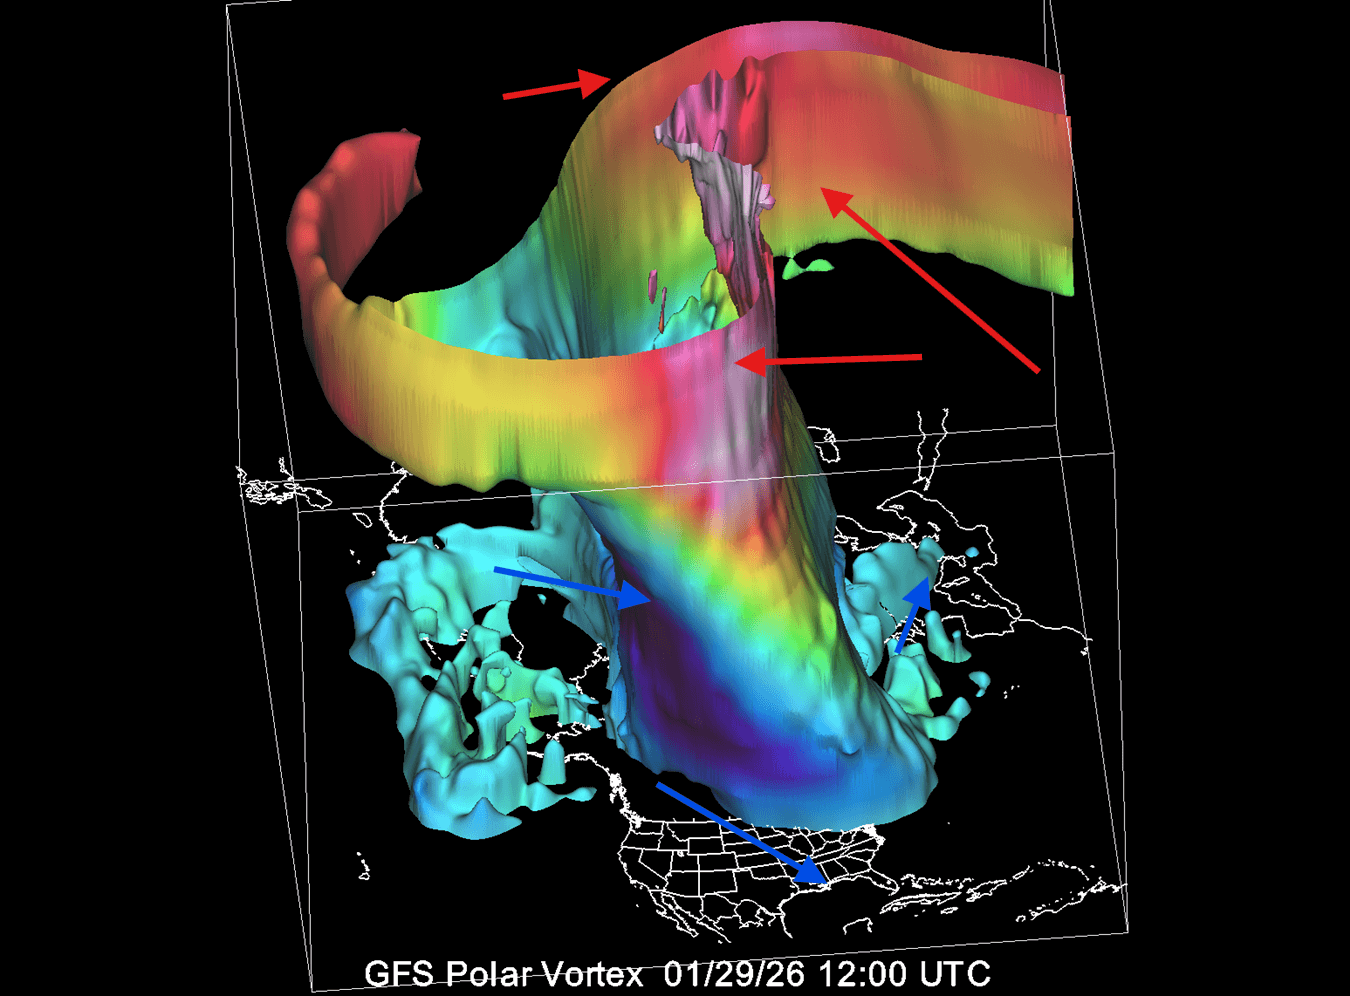
We have seen several such cases during the past winter, resulting in unseasonable cold events across the United States and Canada.
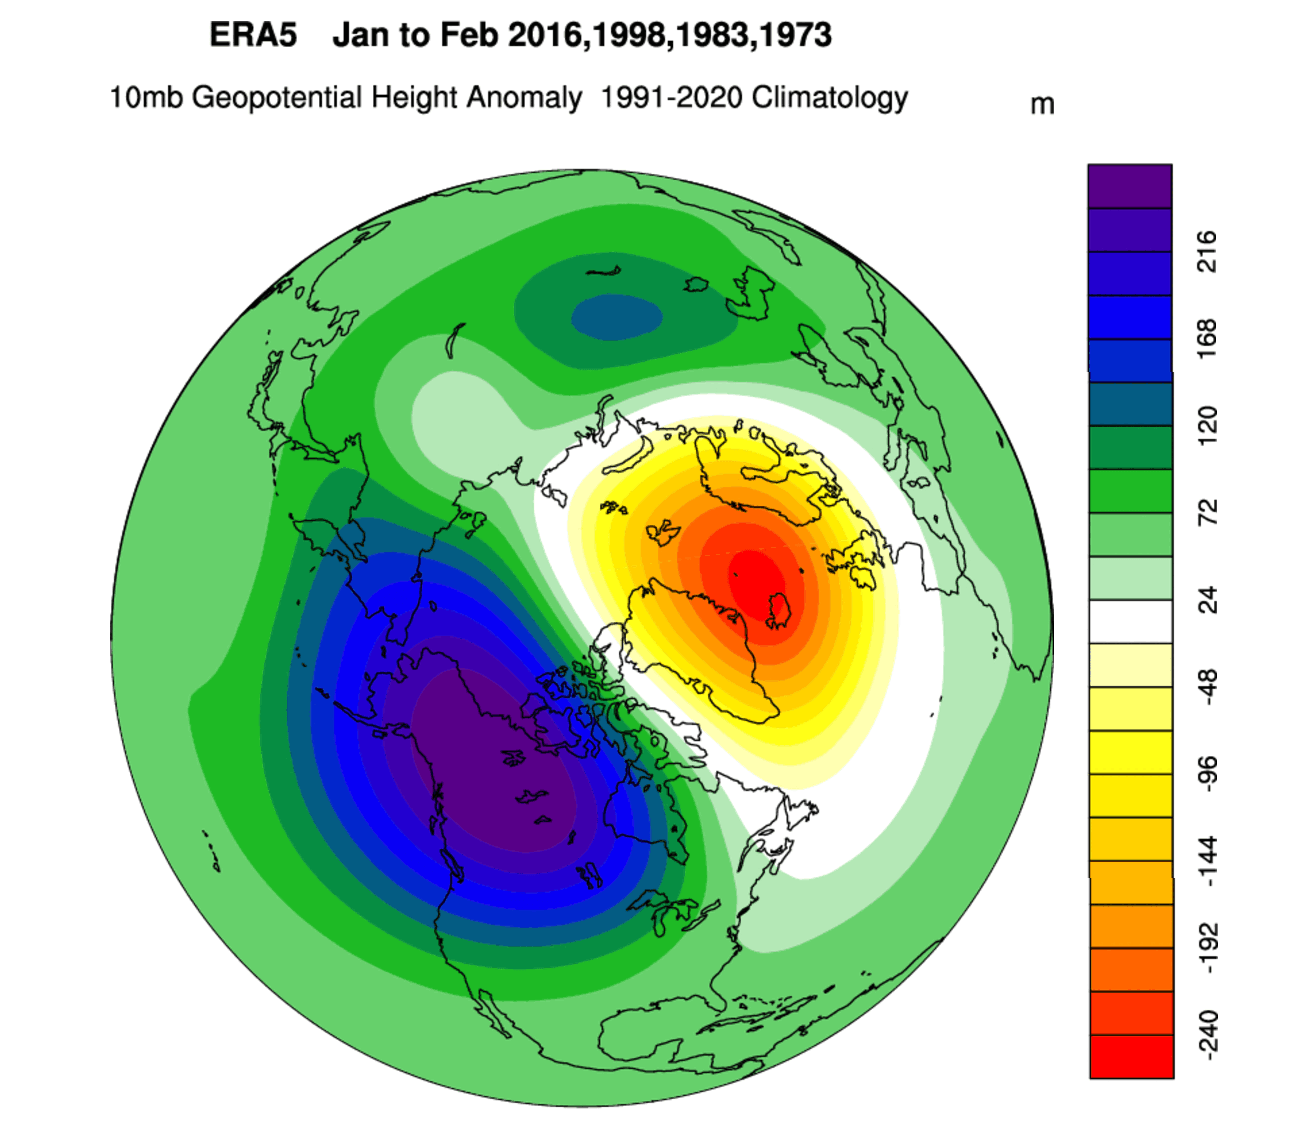
Below is an analysis of the stratospheric pressure anomaly during Super El Niño winters. You can actually see that in Super El Niño winters, the Polar Vortex is weaker, and its core is displaced by a stratospheric high-pressure area. This is one of the disturbances that can affect the weather lower down in the Atmosphere.
We can also look at the sea-ice signal. In the image below, you can see the potential connection between the low sea-ice Falls and the following mid-winter stratospheric temperatures. It is clear that the lowest sea-ice years favor a warmer stratosphere, increasing the likelihood of a Stratospheric Warming event and a disruption of the Polar Vortex.
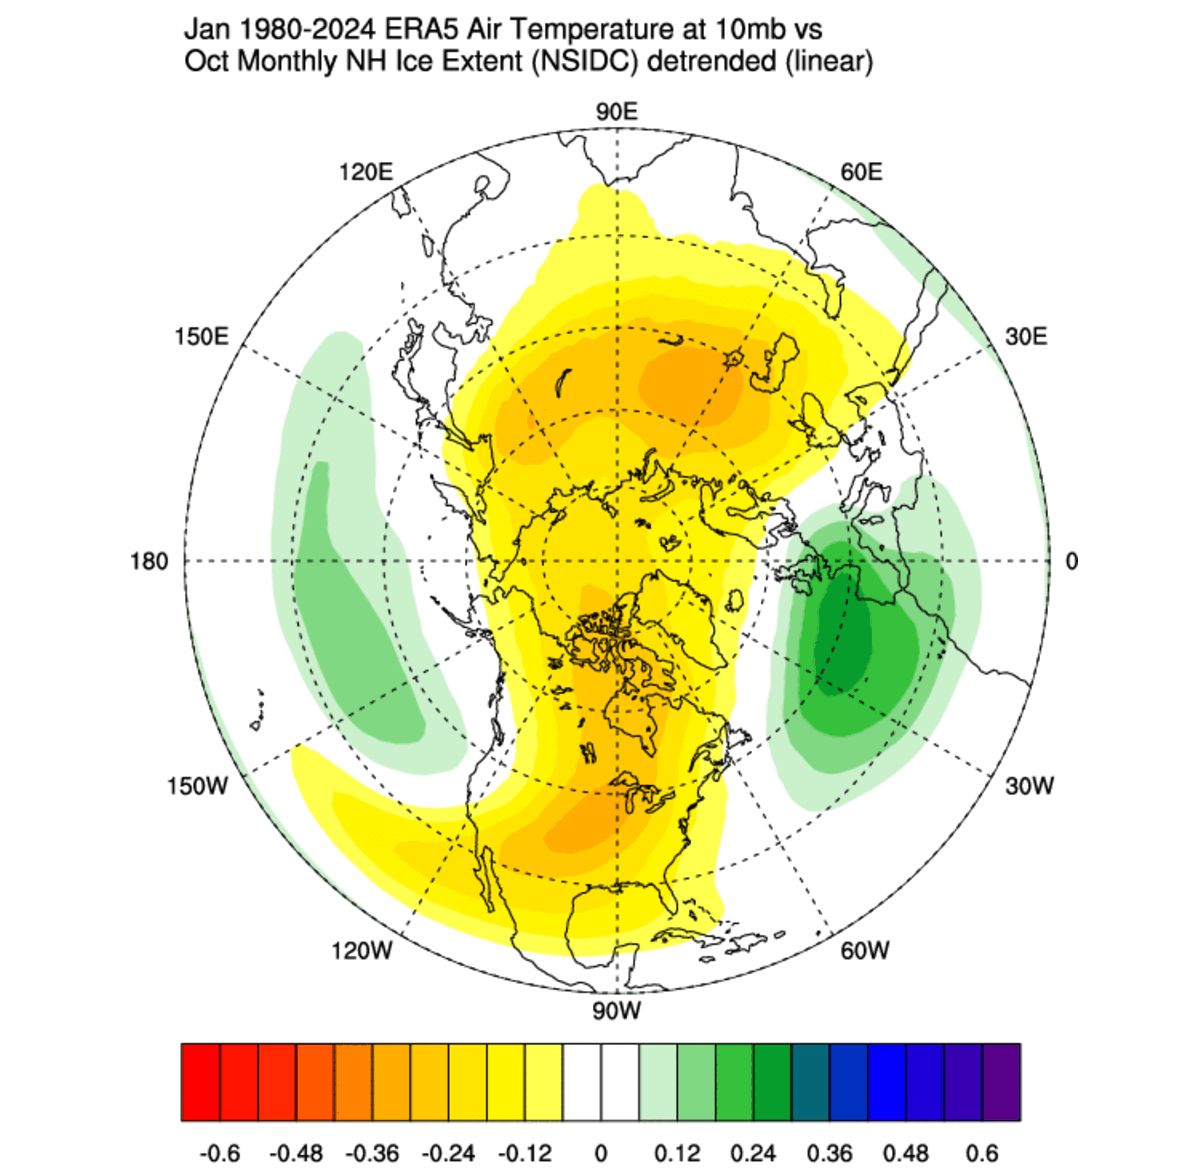
This proves that low sea ice extent combined with an El Niño can trigger a response in the Polar Vortex. It usually makes it weaker, which can result in a colder winter in Canada, the United States, and Europe.
We will keep you updated on the global weather pattern development, so don’t forget to bookmark our page. Also, if you have seen this article in the Google App (Discover) feed, click the like button (♥) there to see more of our forecasts and our latest articles on weather and nature in general.
Don’t miss the in-depth El Niño 2026/2027 analysis and forecast: Latest Forecasts Show a Super El Niño Event Developing, Bringing a Global Weather Disruption in 2026/2027