La Niña event in the Pacific has reached its strongest cooling, playing an important role in creating the current “Polar Express” weather pattern over North America. But while the La Niña impact will likely reach into Spring, we are starting to see early signs that an El Niño event could emerge later in the year.
Global climate is very sensitive to large-scale changes in the oceans. For this reason, we closely monitor these anomalies, as they can significantly influence seasonal weather patterns.
We will look at the latest boost of ocean cooling in the Pacific and how it helped to bring the current Polar cold into North America. Then, we will look at the latest long-range forecasts and what an emerging El Niño event would mean for the 2025/2026 weather seasons.
FROM ENSO TO WINTER WEATHER
The El Niño and La Niña we mentioned are just opposite faces of the ENSO, which stands for “El Niño Southern Oscillation.” This is a region of the Pacific Ocean that periodically shifts between warm and cold phases. Typically there is a phase change around every 1-3 years.
The image below shows the ENSO regions across the tropical Pacific. Regions 3 and 4 cover the east and west tropical Pacific. The main area covers parts of regions 3 and 4, seen in the image as the Nino 3.4 region.
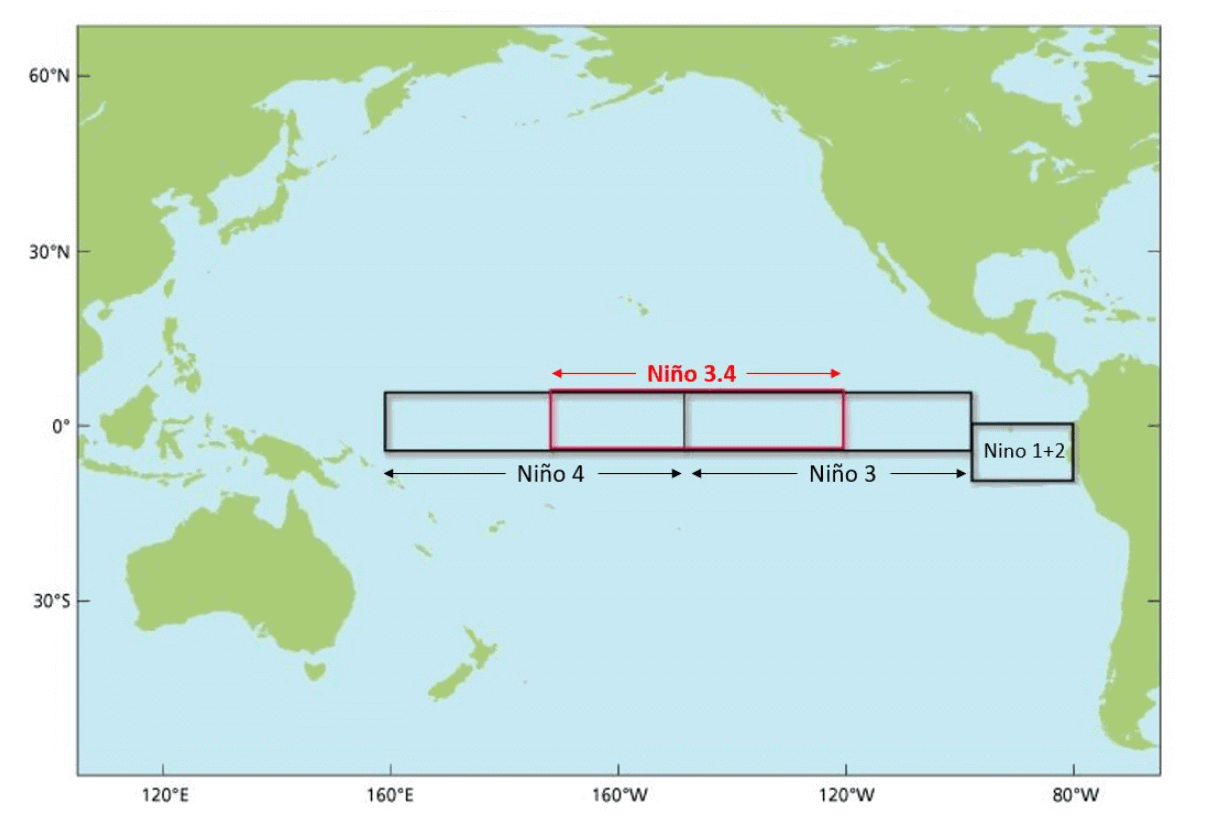
Each ENSO phase influences the pressure and weather in the tropics differently. This affects the overall global circulation over time, changing the weather patterns across the world.
Each phase (cold/warm) usually develops between late summer and early Fall and typically lasts until Spring. But some events can last up to two or three years, as in the current cold phase.
The cold ENSO phase is called La Niña, and the warm phase is El Niño. Besides the temperatures, one of the main differences between the phases is the pressure patterns they develop, seen below as high (H) and low (L) pressure zones.
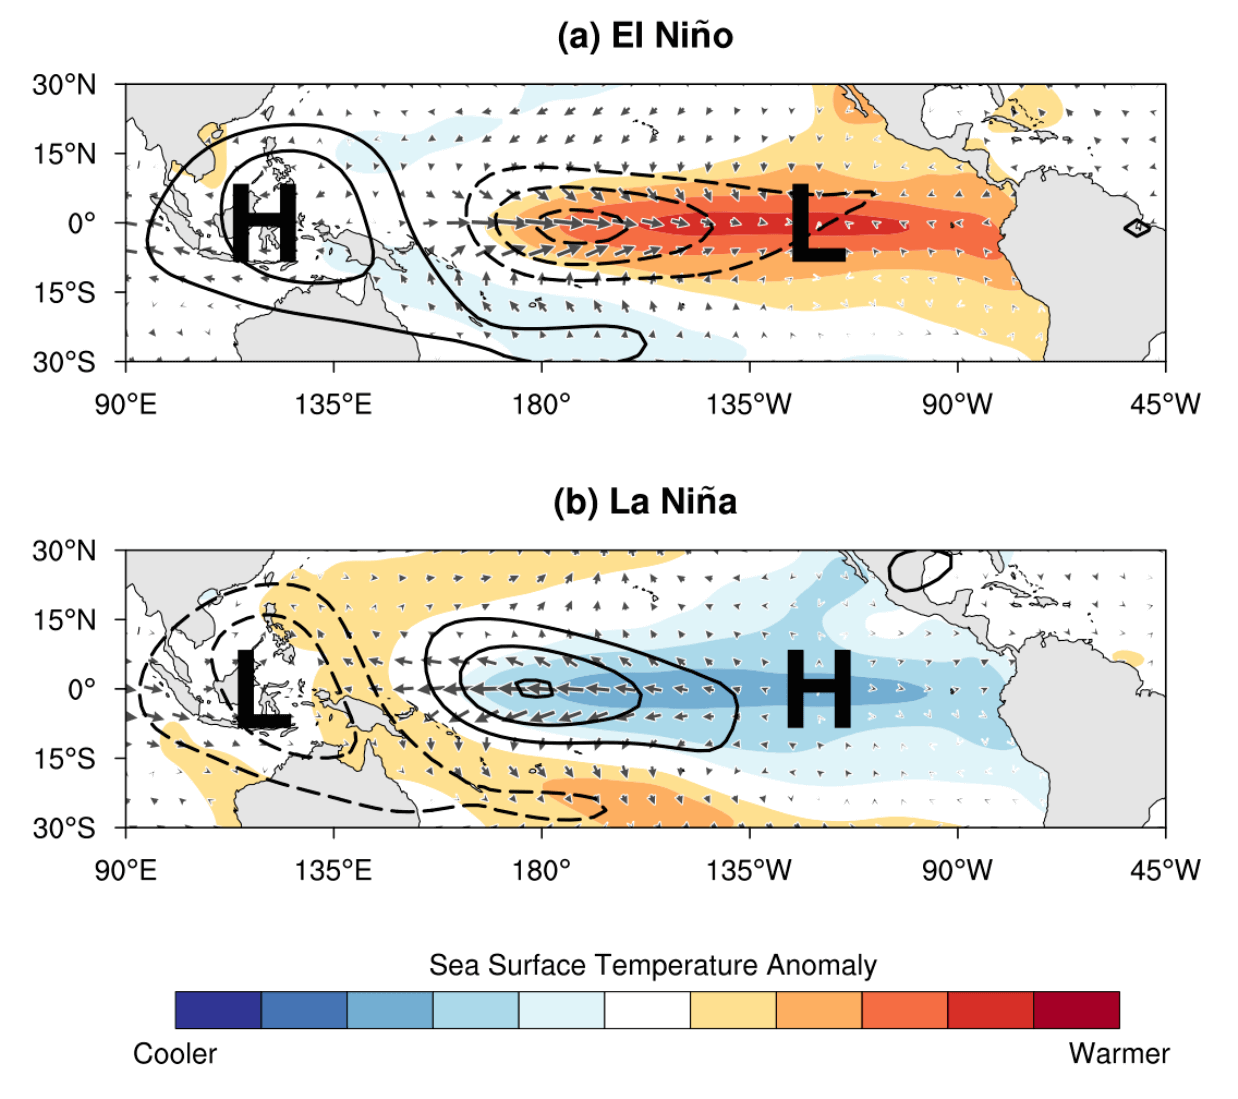
During an El Niño, the pressure over the tropical Pacific is lower, with more rainfall and storms in this region.
But during a La Niña, the pressure over the equatorial Pacific rises. That creates stable conditions and fewer storms. These pressure changes then translate into global circulation over time, affecting seasonal weather over both Hemispheres.
Below is the latest weekly ocean analysis, where you can see the main ENSO region marked in the image. As you can see, there are colder than normal waters across the main region, extending west. This is the typical signature of a central-based La Niña event.
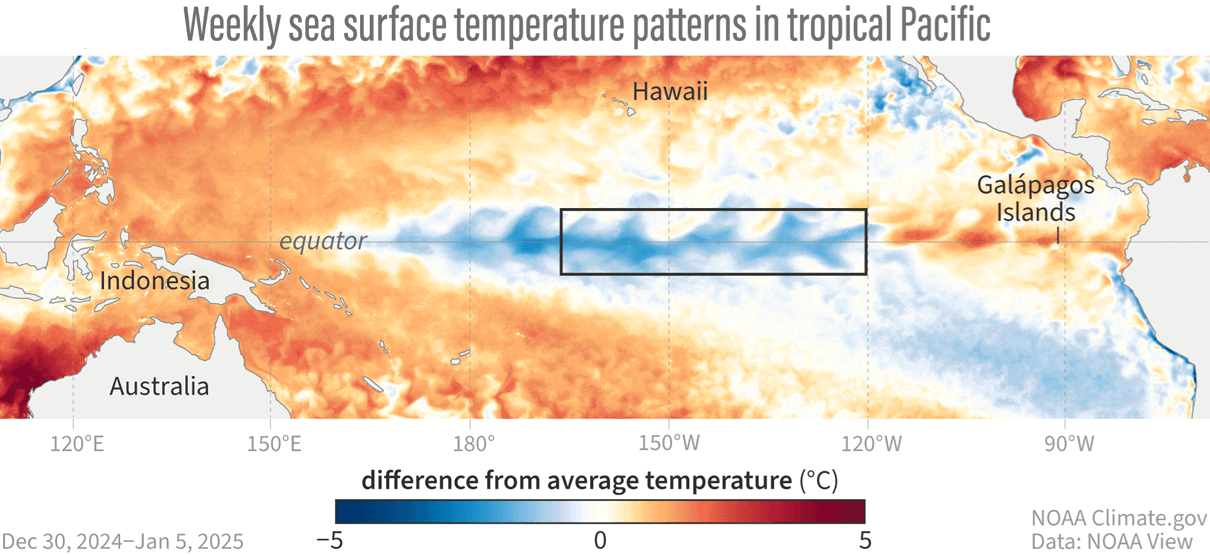
A stronger cooling phase has been ongoing since early December. As a result, you can see cold waves developing across the equatorial Pacific as the easterly winds push surface waters to the west.
Below is the anomaly data across the ENSO region since early 2024. You can see the latest ocean temperature drop starting in December. The gray lines are past La Niña events. As you can see, they were all typically coldest around January.
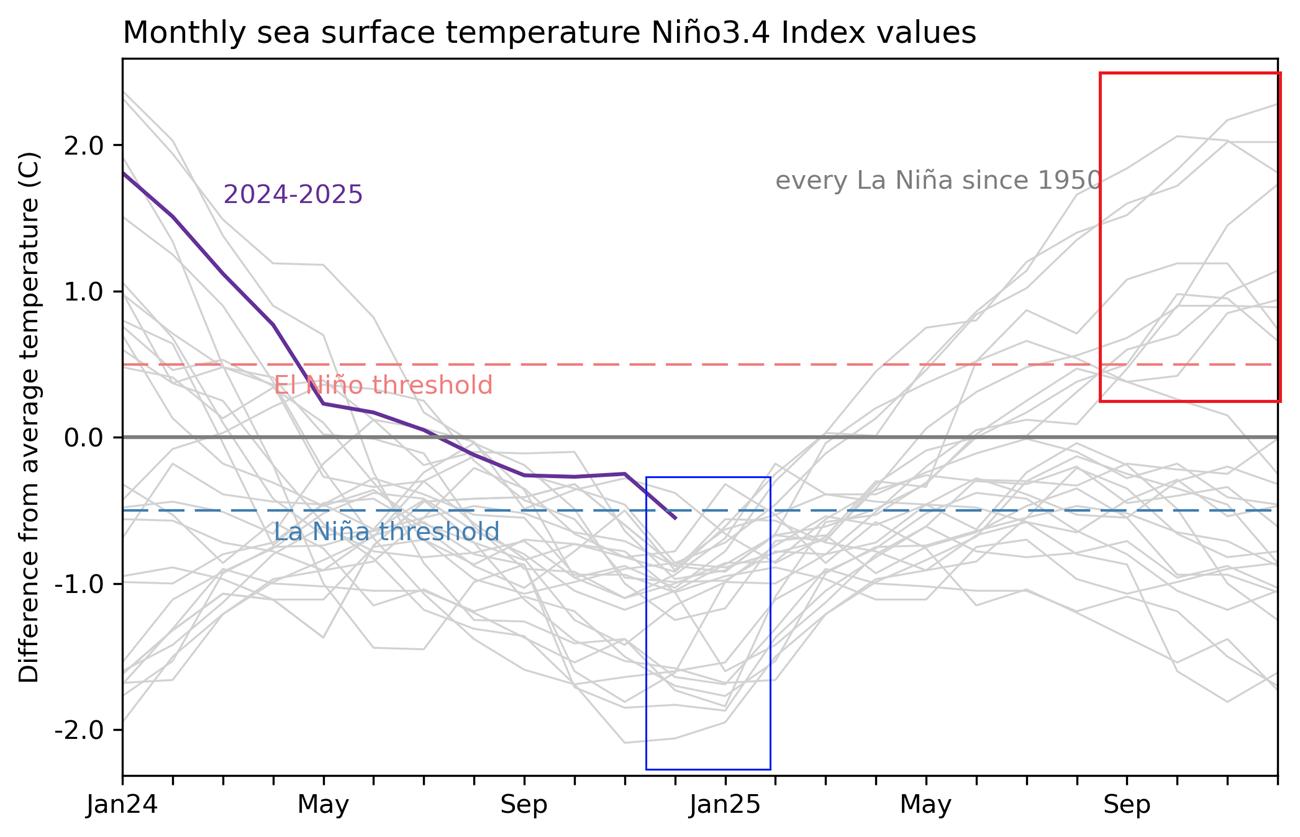
But looking ahead, you can see that plenty of those past La Niña events have evolved into an El Niño event before next Winter (red area). There are also many events where the La Niña repeated next winter. But based on other global factors, that is not a very likely scenario for 2025.
Looking closer at the latest cooling period, we produced a video from the official weekly ocean analysis. As you can see, it shows a strengthening of the negative anomalies across the ENSO regions in the past month, right across the main ENSO region.
But why is this latest cooling important? As you will see, based on past events, a La Niña phase can help to create a colder pattern over the United States in January. We are currently observing what will be one of the coldest January months in recent years, if not decades, when the month is over.
COLD IN THE OCEAN…
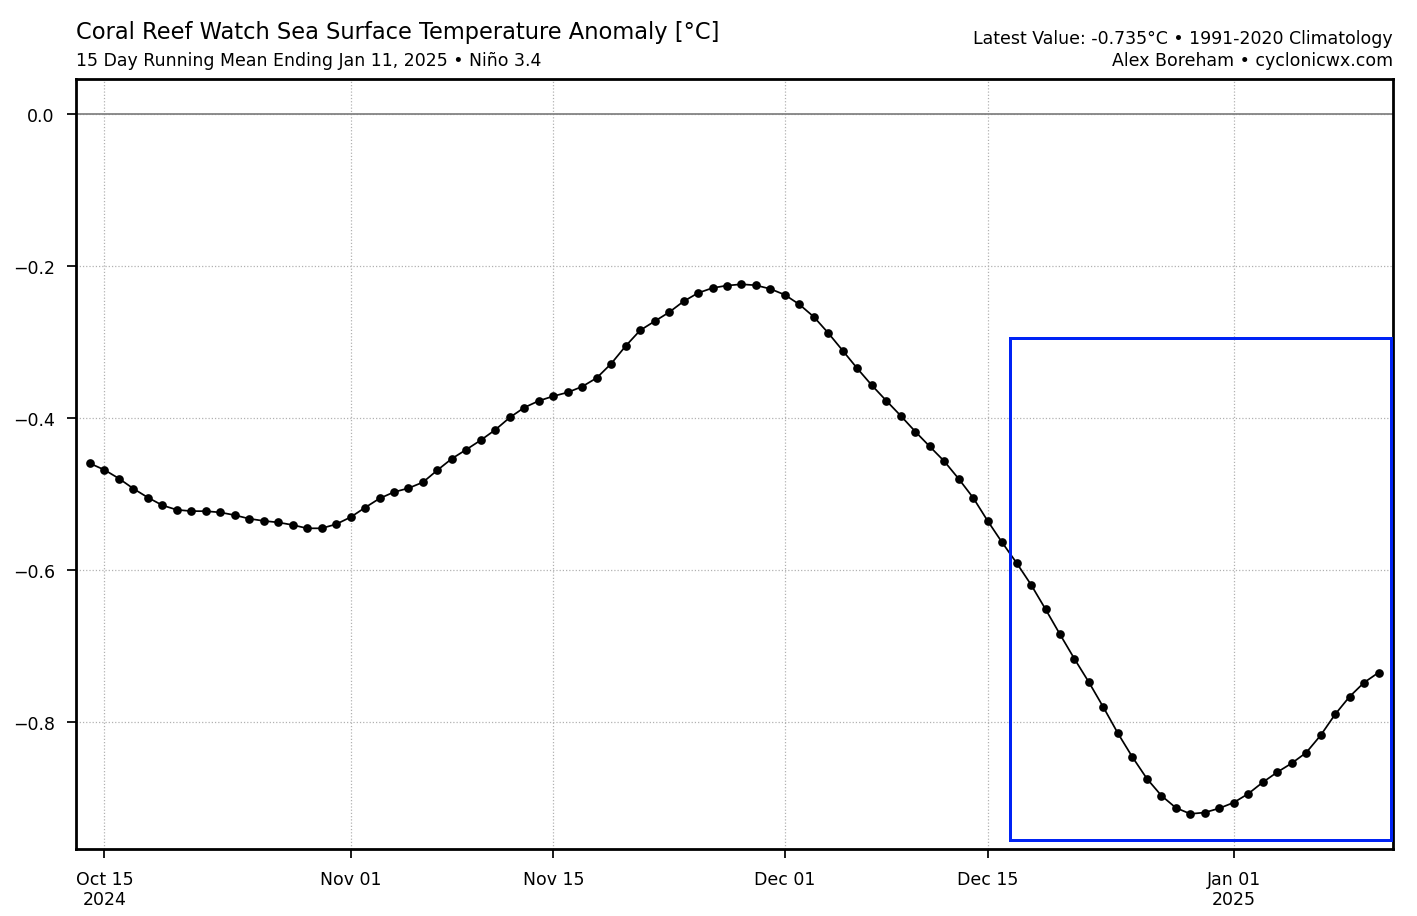
The graph below shows the ocean temperature anomaly for the main ENSO 3.4 region since October. You can see it has recently reached its lowest value after starting to cool down in early December, going below the -0.5 La Niña threshold. Image by cyclonicwx.com
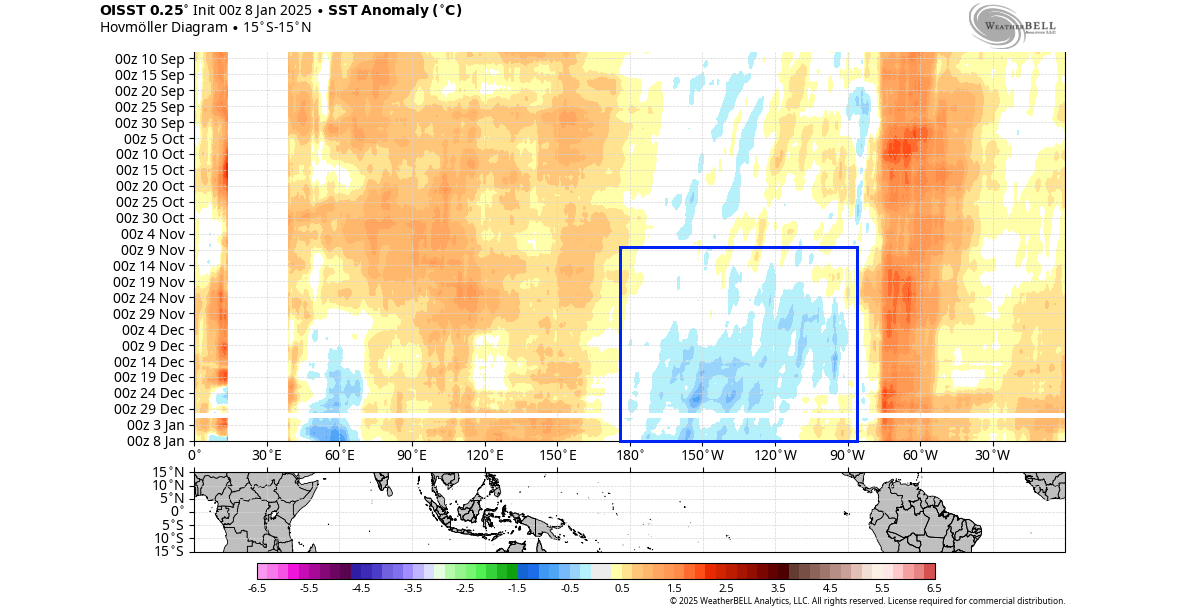
Looking at the wider region below, the graphic shows the actual ocean surface anomaly change. Here, you can even better see the widespread cooling across the central Pacific area, starting around mid-November but intensifying in early December.
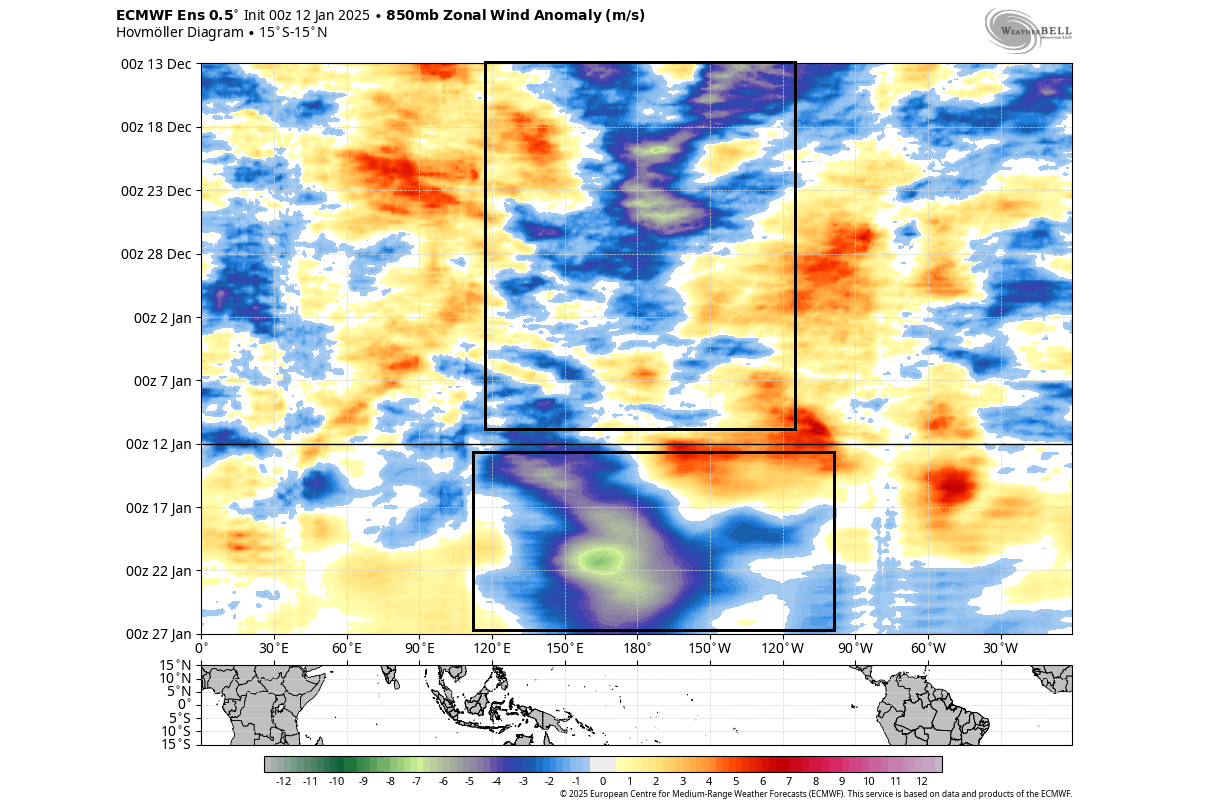
An important driving force behind this ocean cooling were the easterly trade winds. The image below shows the wind anomaly in the lower atmosphere. You can see the negative values, which show easterly winds that promote ocean surface cooling, centered around the central Pacific, with more in the lower (forecast) part.
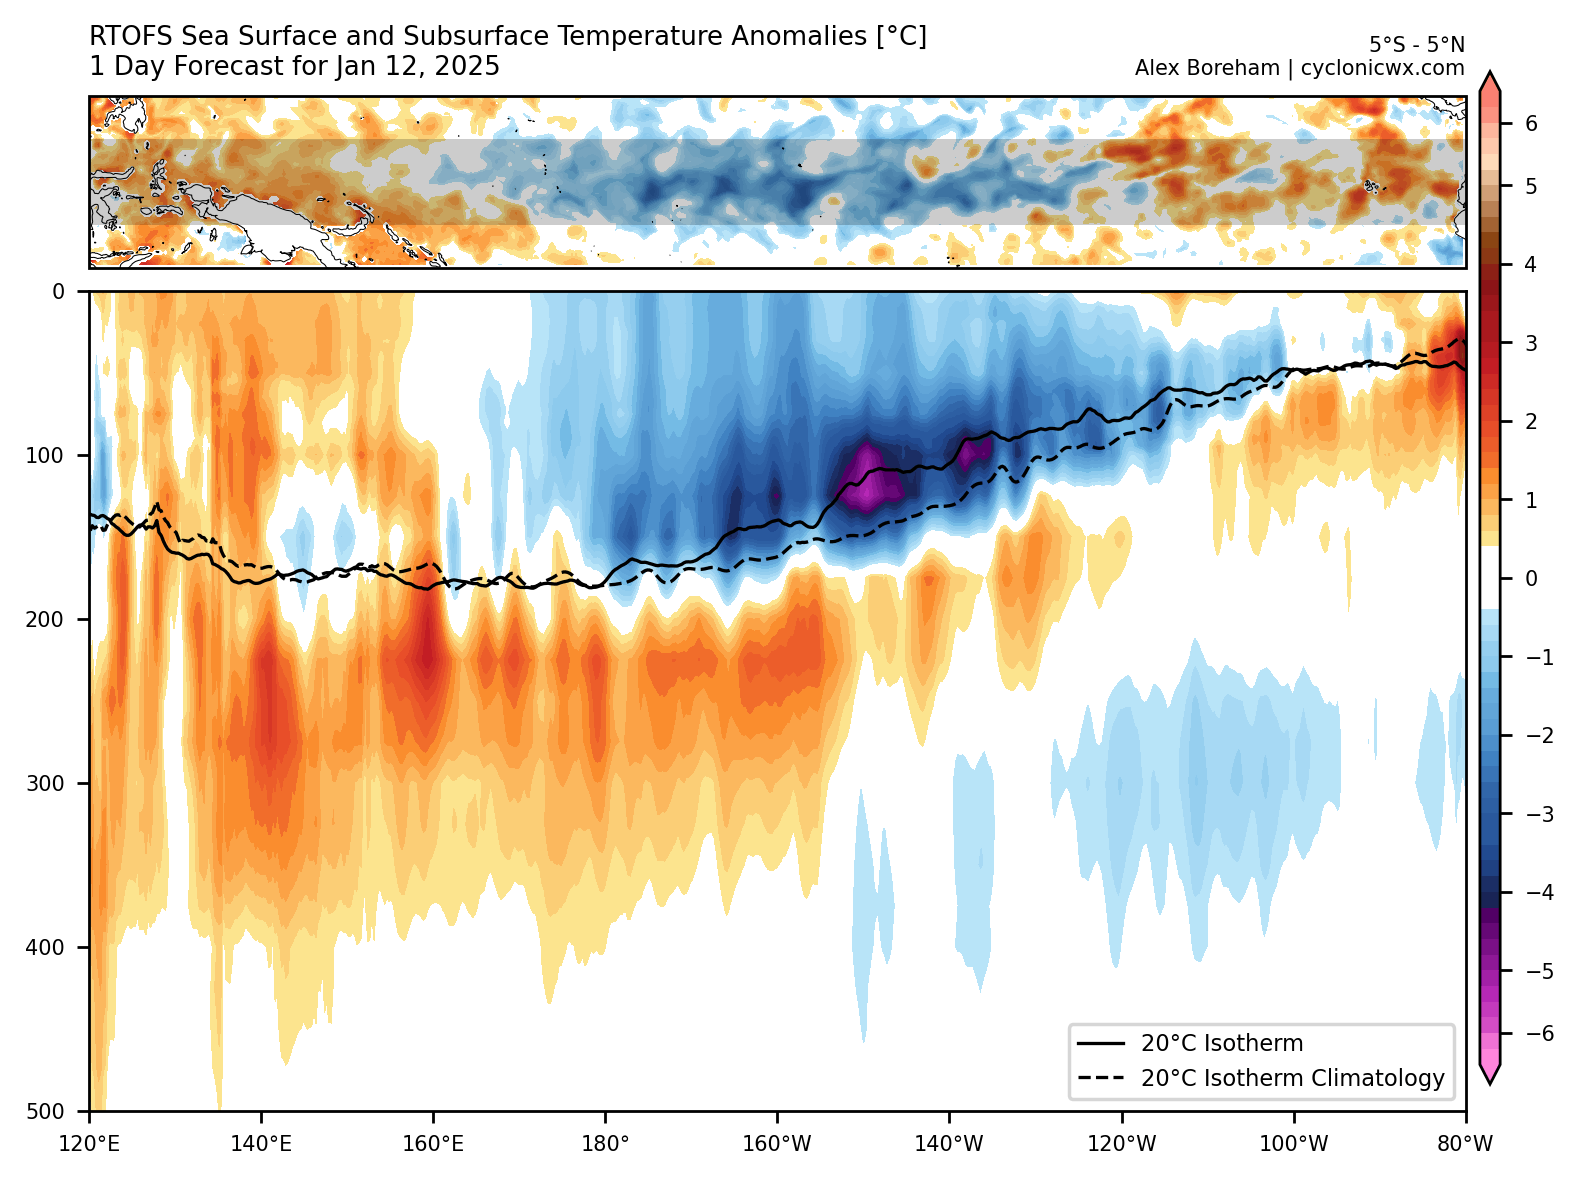
The activity deeper down is also very important. Below is the subsurface ocean analysis by depth. You can see the cold pool of the currently active La Niña, focused in the central Pacific basin down to around 150m (500ft) depth. But a warm anomaly is seen below the ocean to the west and deeper down, which could play a role down the line in 2025.
This cooling phase has strengthened the La Niña and also very likely its presence in the atmosphere. We have reasons to believe that it has also helped to boost the cold air outbreak this month over the United States, and the upcoming polar cold event.
…COLD IN THE ATMOSPHERE
As mentioned, the La Niña has a well-known atmospheric impact during the Winter season. Below is a typical January pressure anomaly pattern in a La Niña season. You can see the strong high-pressure anomaly in the North Pacific, which is its signature.
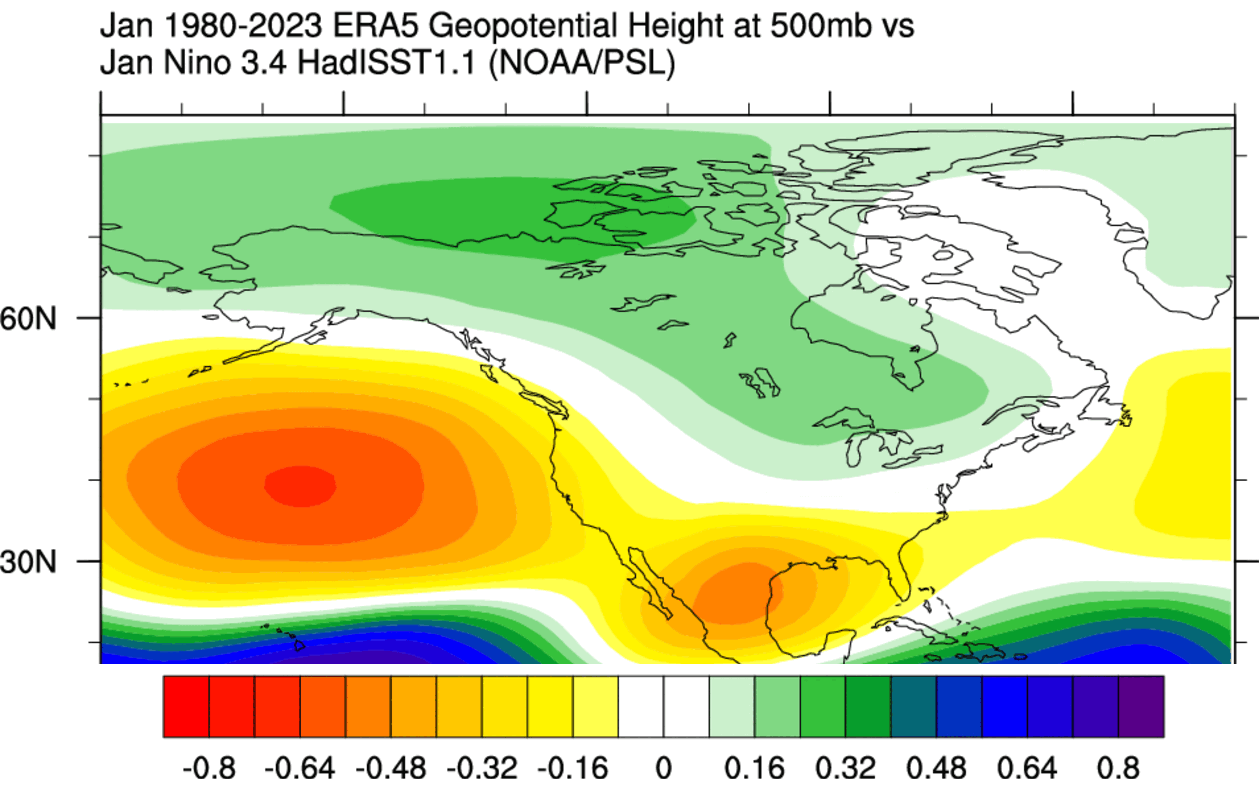
A high-pressure area in the North Pacific allows a low-pressure area to expand over Canada and into the northern and central United States. This typically enables a more northerly flow, allowing the transport of colder air into the continental U.S.
Below is the latest pressure forecast for the second half of January 2025. You can see a very similar pattern as the average one above. A high-pressure area is in the North Pacific, driving an unusually strong low-pressure system over the United States and eastern Canada.
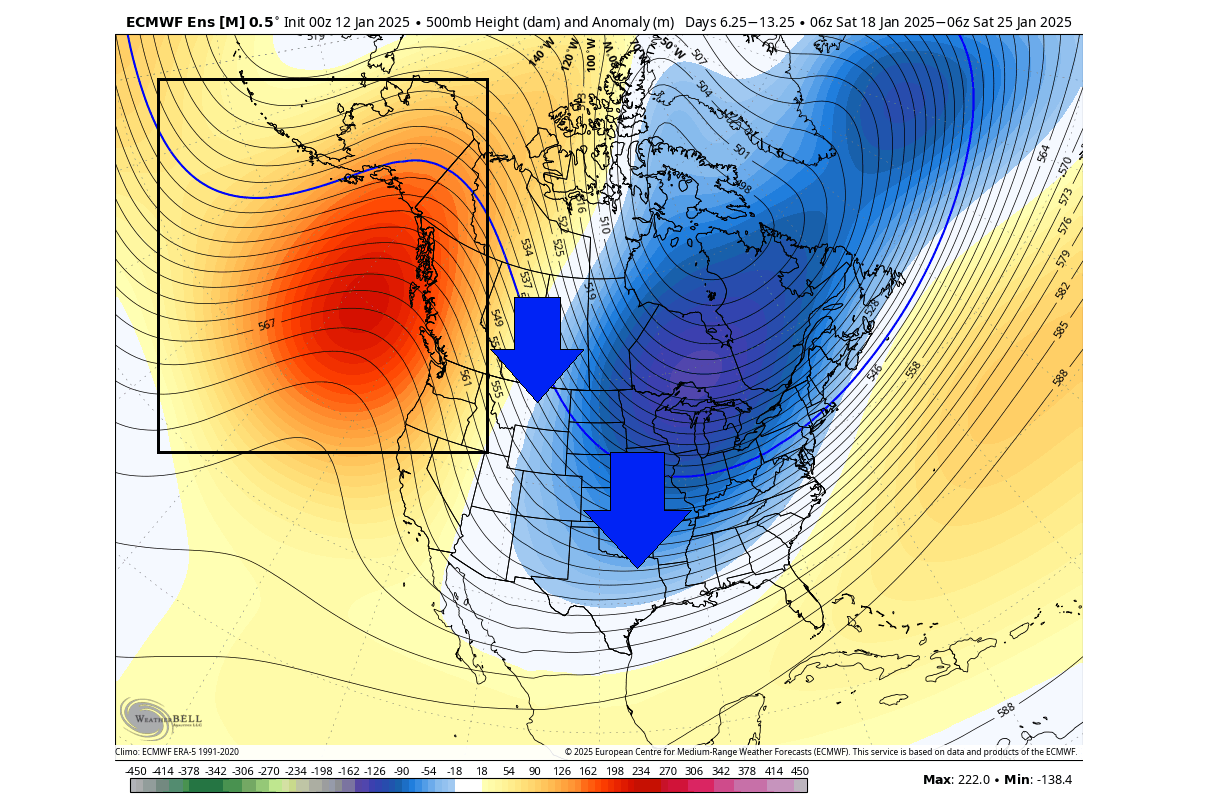
The large pressure difference between both systems drives a very strong northerly flow, also known as the “cross-polar flow” or sometimes the “Polar Express”. The terms are not an exaggeration, as such a flow can really bring down the coldest air from the polar regions into Canada and the United States.
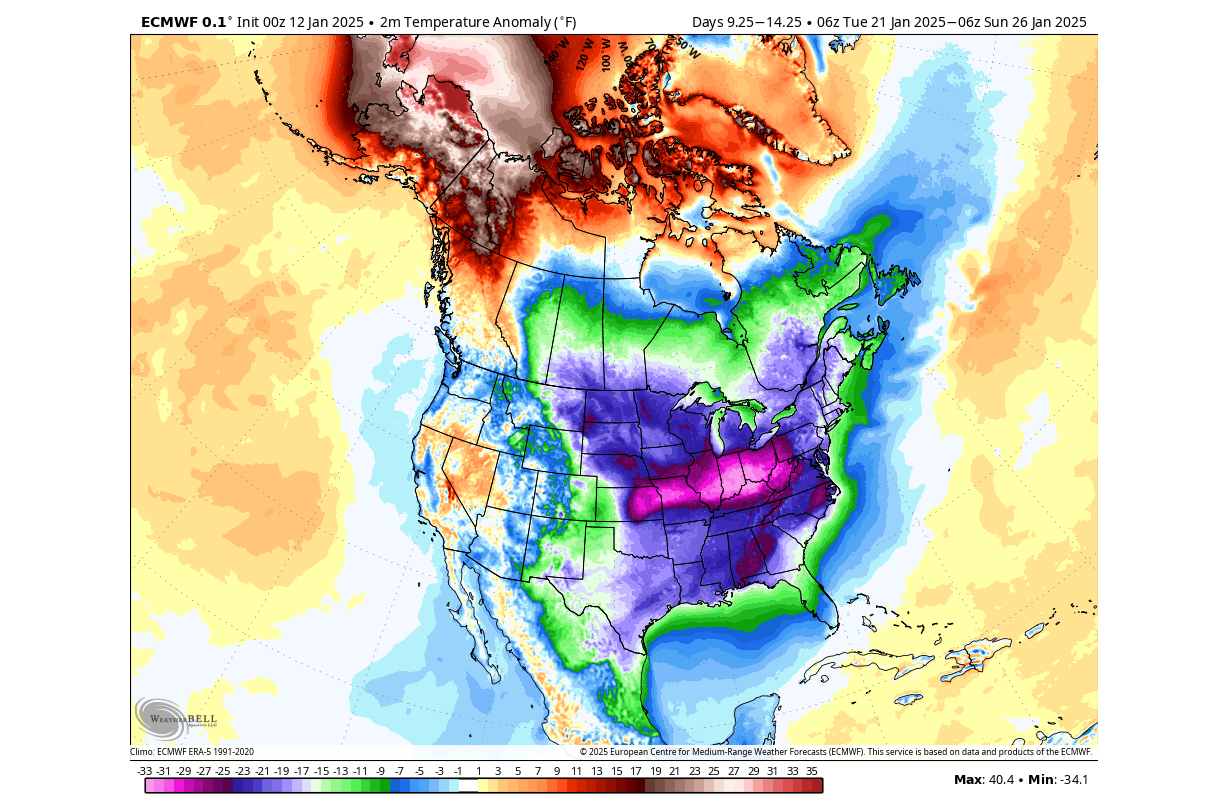
You can see this in the temperature forecast below, which shows the temperature anomaly for days 9-14. This pattern will bring down the lowest temperatures of the season so far, across a large part of the United States and southern Canada.
The image below shows an average La Niña temperature anomaly for January. While it is not as cold as the forecast above, it is produced from several decades of data, so it looks more averaged out. But you can still see that a La Niña event supports such cold events, thanks to its associated pressure pattern.
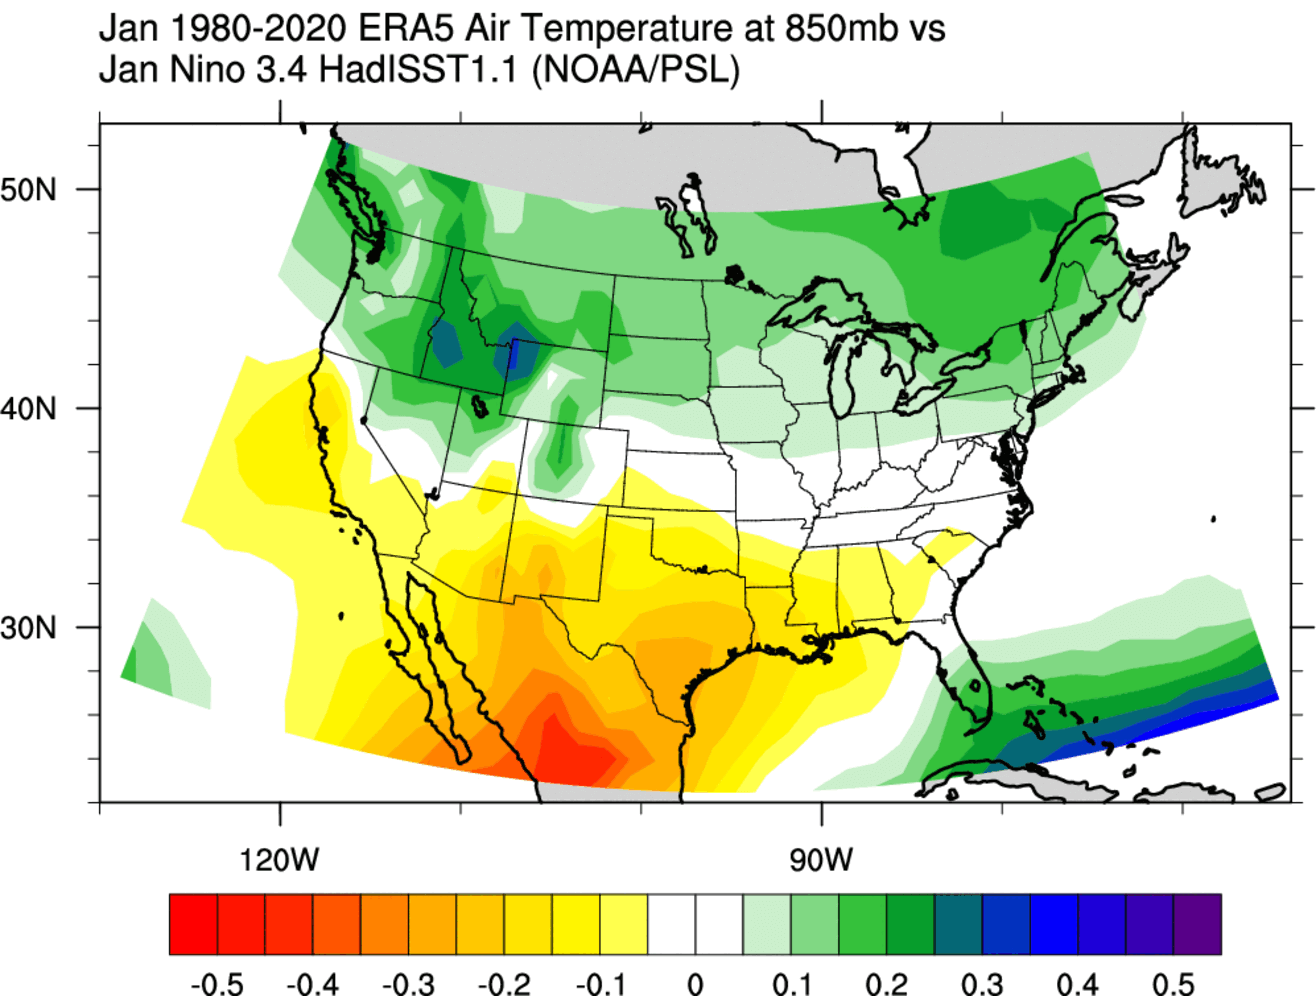
We can’t say that this ocean cooling alone is the main reason for the unusually cold January in the United States. Other factors are also at play, but as you can see, the role of the cold ENSO phase is very visible in the weather patterns.
But while the current winter is in the domain of La Niña, the early long-range forecasts are starting to show the first signs that an El Niño event could emerge in the 2025/2026 season.
EL NINO ON HORIZON
The first hint is already visible in the latest ECMWF ocean forecast below for early Summer. It shows a warm area spreading in the eastern tropical Pacific, with the cold anomalies disappearing. While this is not an El Niño, this is something you would expect to see appearing in the long-range projections in early summer for one to develop.
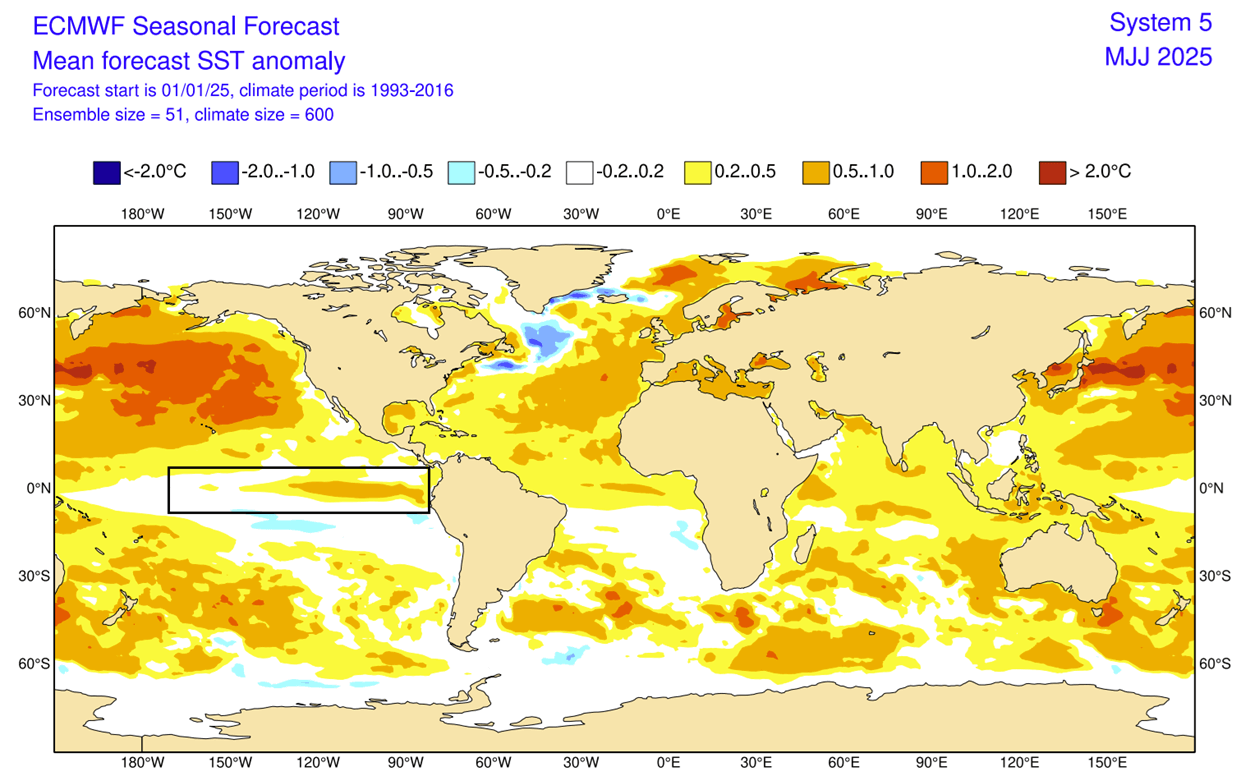
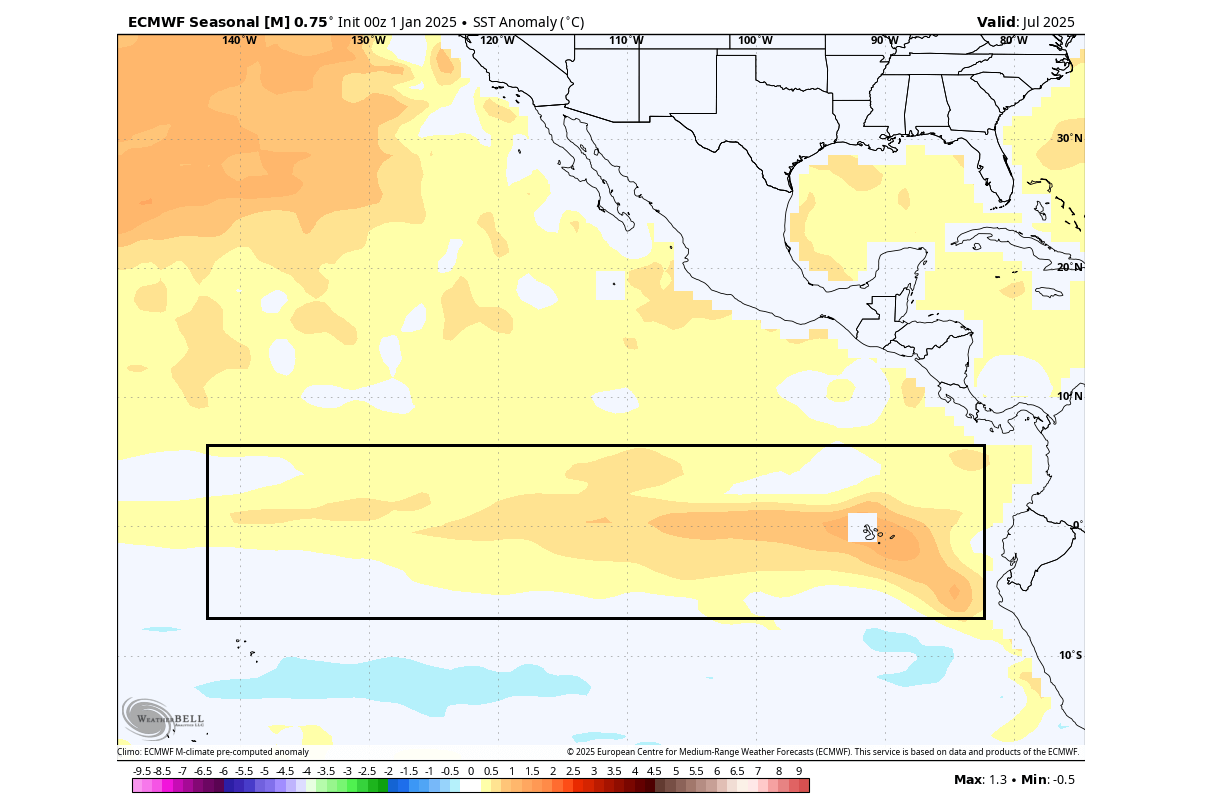
Looking at the monthly ocean anomaly forecast map for mid-summer, you can see the ECMWF forecasting an area of warm anomalies across the equatorial Pacific. These anomalies hint at a rather rapid breakdown of the La Niña over Spring.
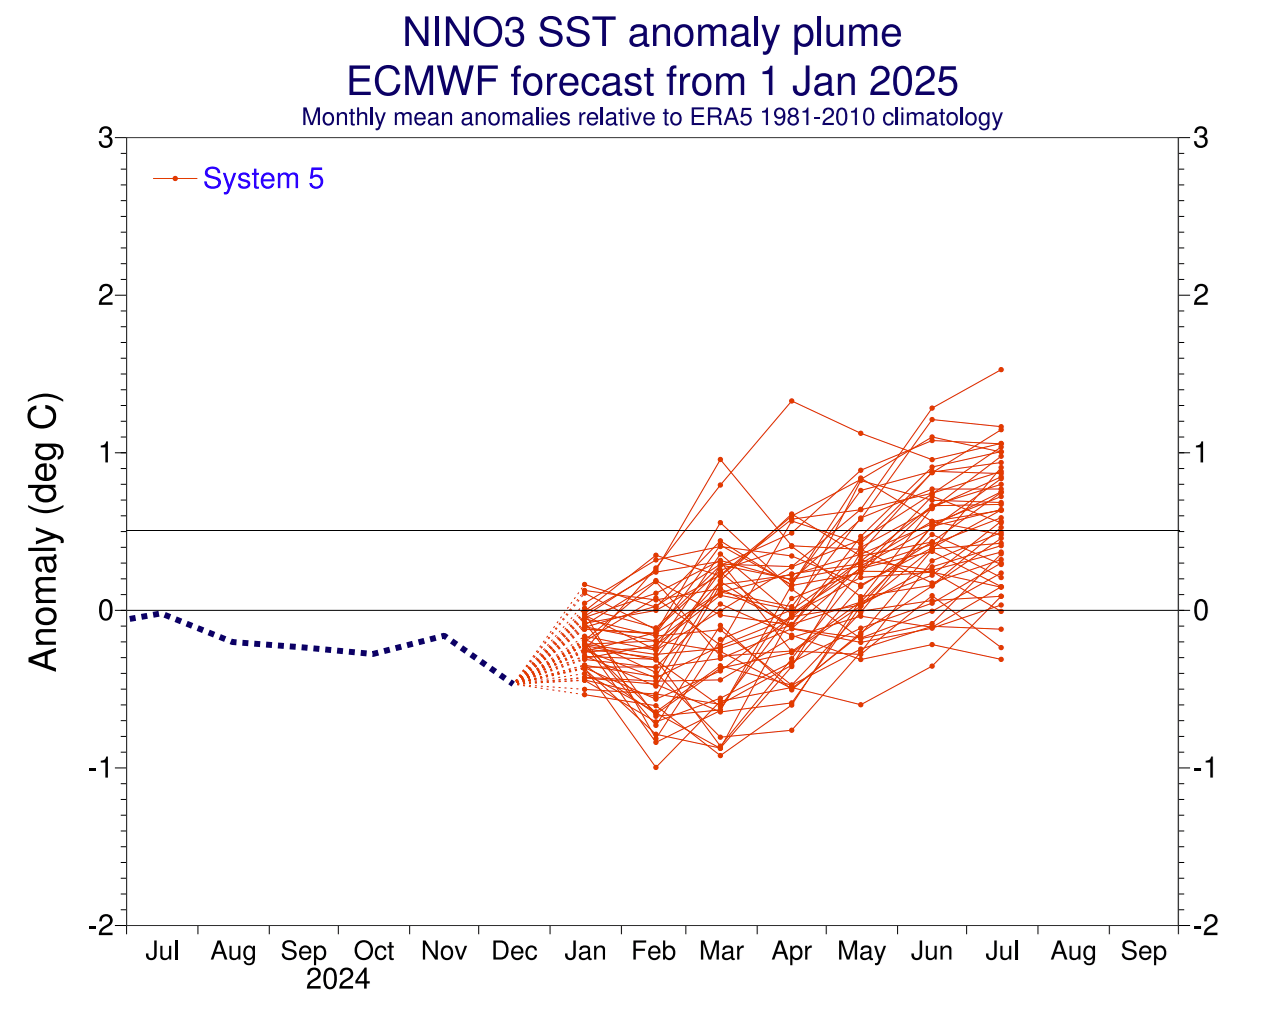
The analysis and ensemble forecast below shows the forecast for the eastern ENSO region. The La Niña conditions (below -0.5) will prevail over Winter. But a weakening of the La Niña is expected to start in between, with a shift into a neutral phase in Spring and rising higher during Summer.
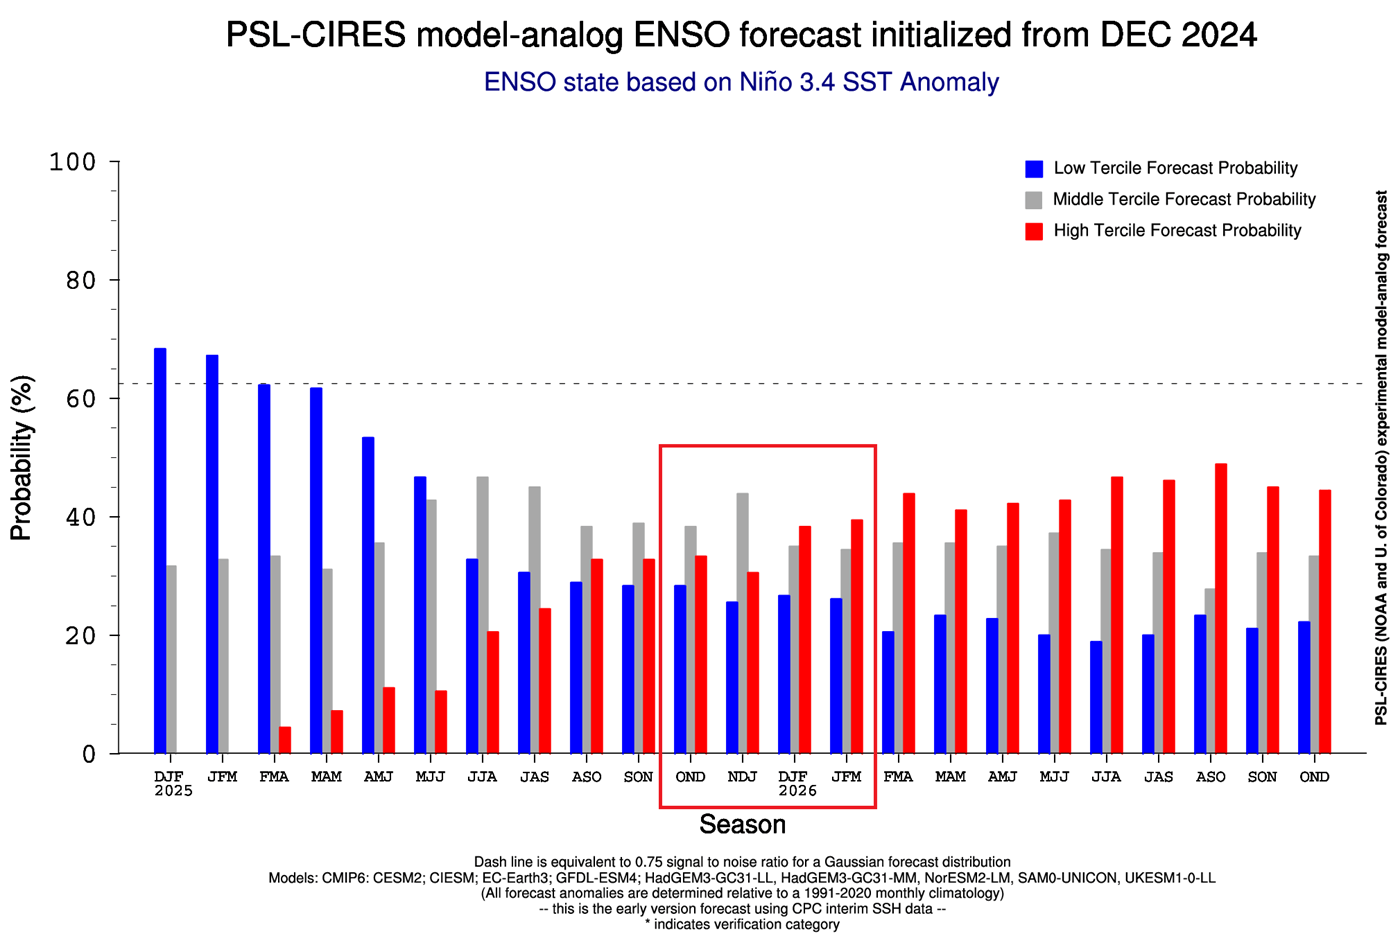
Below is also an extended analog forecast by the Physical Science Laboratory for the main ENSO region. It shows the cold phase active over Winter. But a fast weakening of the cold phase will follow, with El Niño event chances increasing by late 2025 and increasing even higher in 2026.
But what would an El Niño event mean for the weather patterns, especially in Winter?
EL NINO WINTER WEATHER OVER NORTH AMERICA
Usually, the main influence of these ocean anomalies can be seen in the changes to the jet stream. The jet stream is like a large river of air at around 8-11km (5-7mi) altitude. It brings along moisture and precipitation, so it has an important effect on temperature and snowfall patterns in the Winter season.
The most typical pressure effect of an El Niño is the low-pressure area in the North Pacific. That usually strengthens the subtropical jet stream over the southern United States.
The image below from NOAA Climate shows the average position of the jet stream during El Niño winters and the resulting weather patterns over the United States and Canada. You can see the stronger Pacific jet stream across the southern United States.
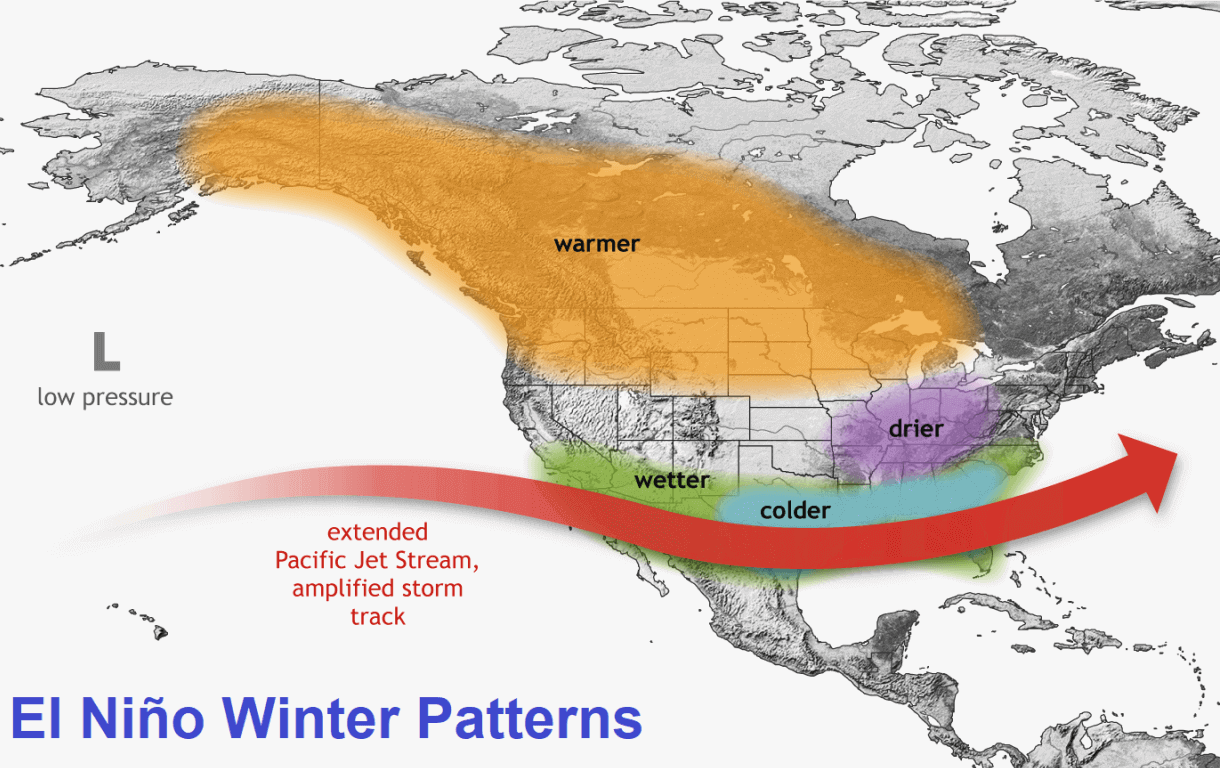
A stronger subtropical jet stream comes with lower pressure, cooler temperatures, and more moisture over the southern U.S. That combination increases the snowfall potential across the central and eastern United States if enough cold air is available.
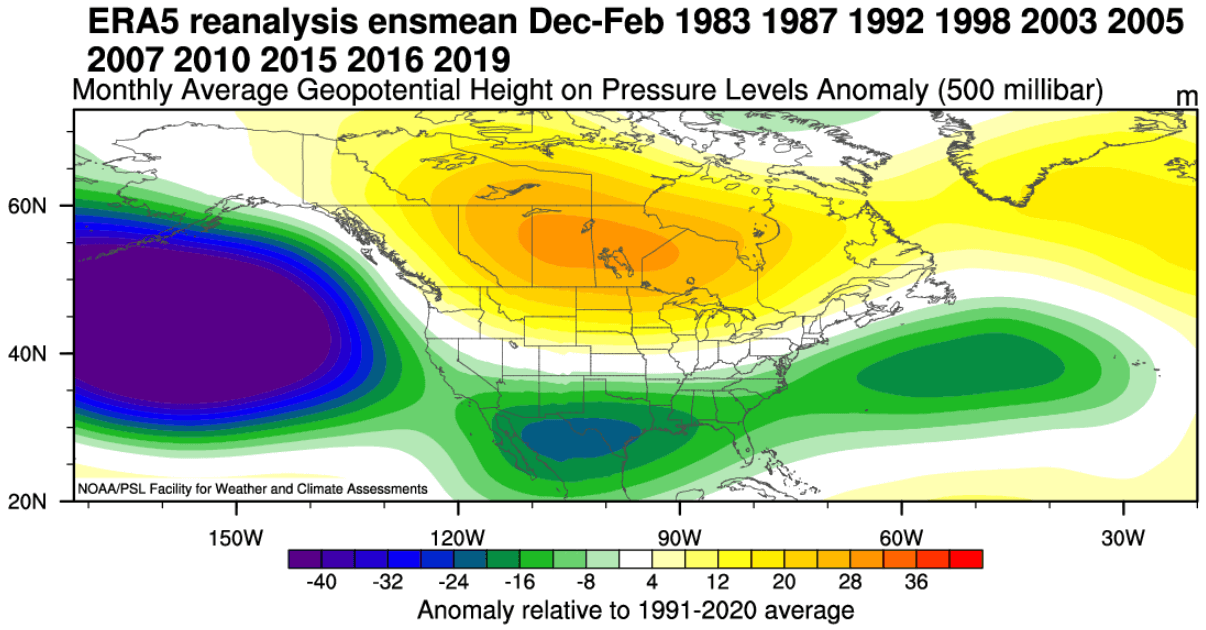
The image below shows the average winter pressure pattern for El Niño winter. You can see the strong low-pressure area in the North Pacific, typical for an El Niño. A high-pressure zone is focused over Canada, with a low-pressure storm track and precipitation spanning the southern United States.
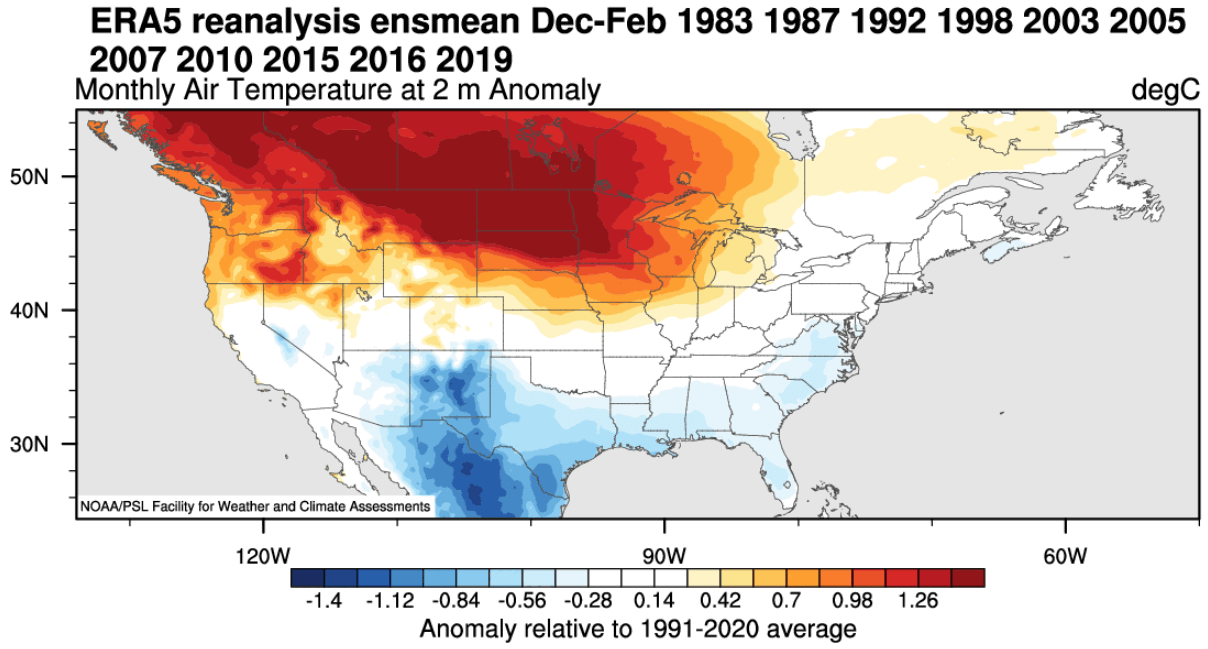
Below are temperature anomalies for the same winters. You can see the average El Niño winter having colder temperatures in the southern half of the United States and parts of the eastern United States. The northern half of the country is warmer than usual, with the anomalies spreading also covering southern Canada.
Temperatures have a major role in snowfall potential. The image below shows snowfall anomalies during El Niño winters. Some areas with more snowfall during an El Niño include the eastern United States, the southern United States, and the central and upper Plains.
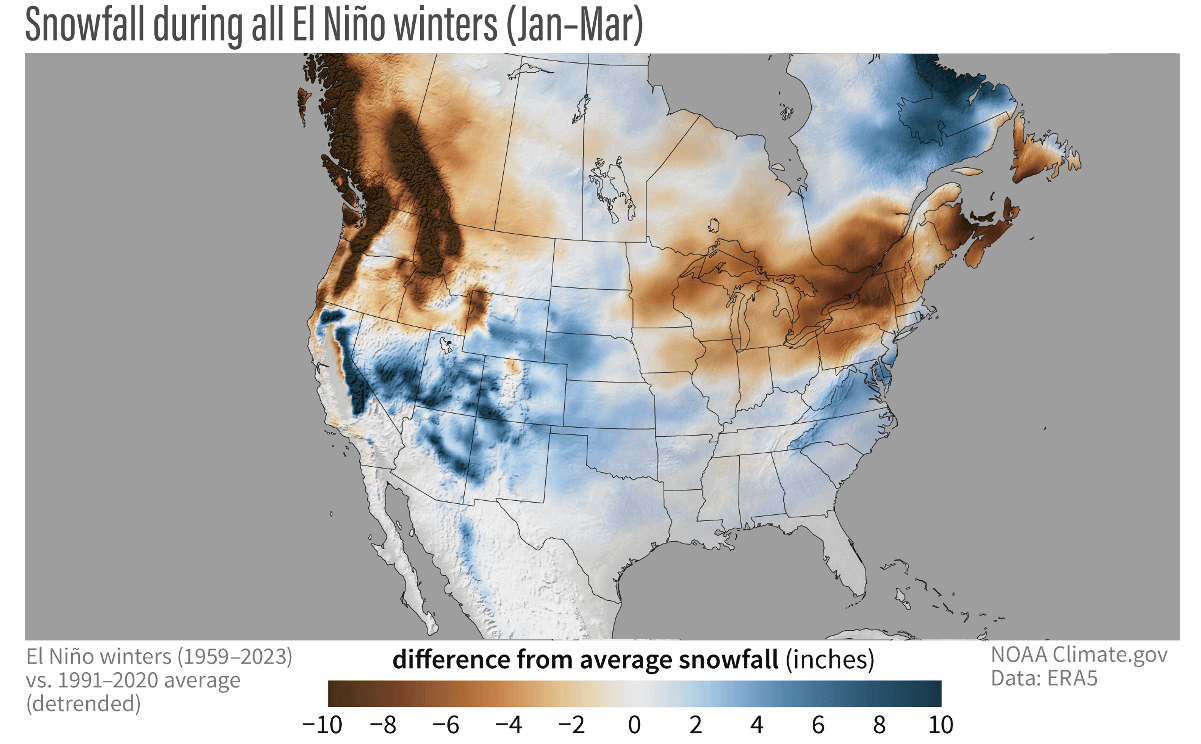
That is mainly due to low-pressure systems trailing across the southern United States. More moisture increases the chances of snowfall in the southern half if colder air is available.
Less snowfall is usually seen across the deep southern United States, Ohio Valley, Midwest, northern Plains, northern Rockies, and Pacific Northwest.
Actual snow amounts are always limited in the southern United States because it needs to be cold enough to snow. For that reason, there is usually much more snowfall during an El Niño in the higher and colder elevations of the southwestern United States.
There is usually less snowfall around the Great Lakes, interior New England, the northern Rockies, and the Pacific Northwest, extending into western Canada.
We also have another winter snowfall map, but this one was produced by Rohan Shroff and only shows more weak to moderate El Niño years in the mix. This is called “analog forecasting” where we look at past years with specific global configurations and their winter outcome.
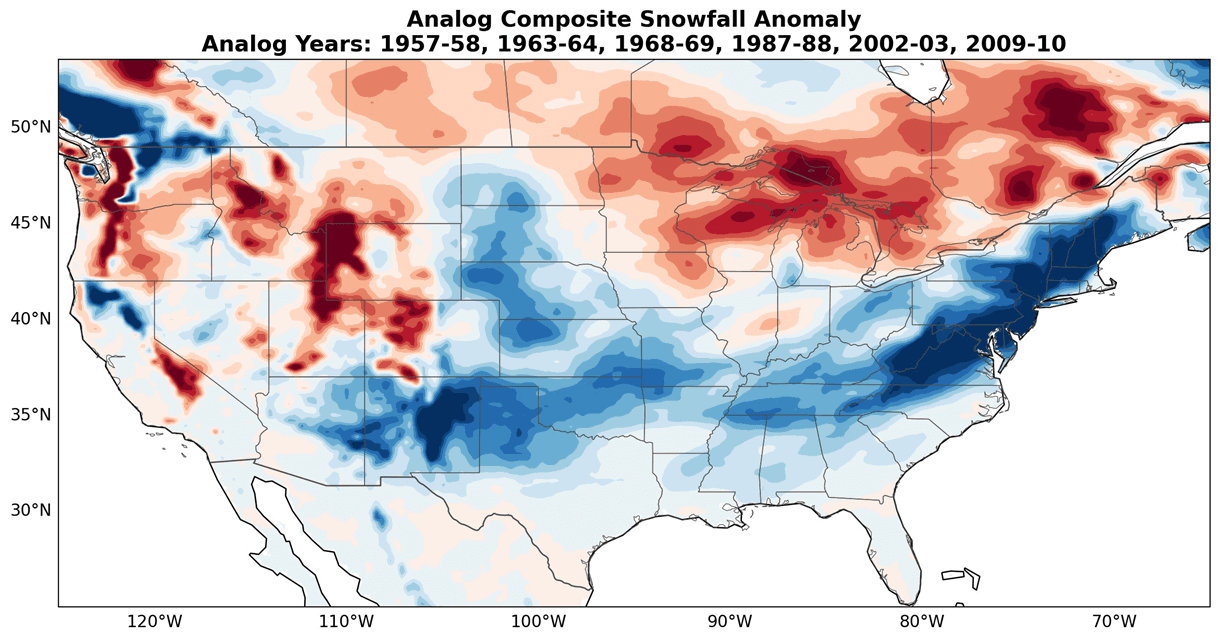
You can see that weak to moderate El Niño years can produce very good snowfall amounts across much of the eastern United States, especially the northeast. You can also see increased snowfall amounts across a large part of the central and southern United States.
This is essentially just an analysis of specific past winters. But just as 1+1=2, we can also see in weather how a combination of certain global factors can produce a similar winter season more than once.
We will keep you updated on other developing weather trends, so bookmark our page. Also, if you have seen this article in the Google App (Discover) feed, click the like button (♥) there to see more of our forecasts and our latest articles on weather and nature in general.
Don’t miss: January 2025 Forecast: How long will this cold Winter period last over the United States?