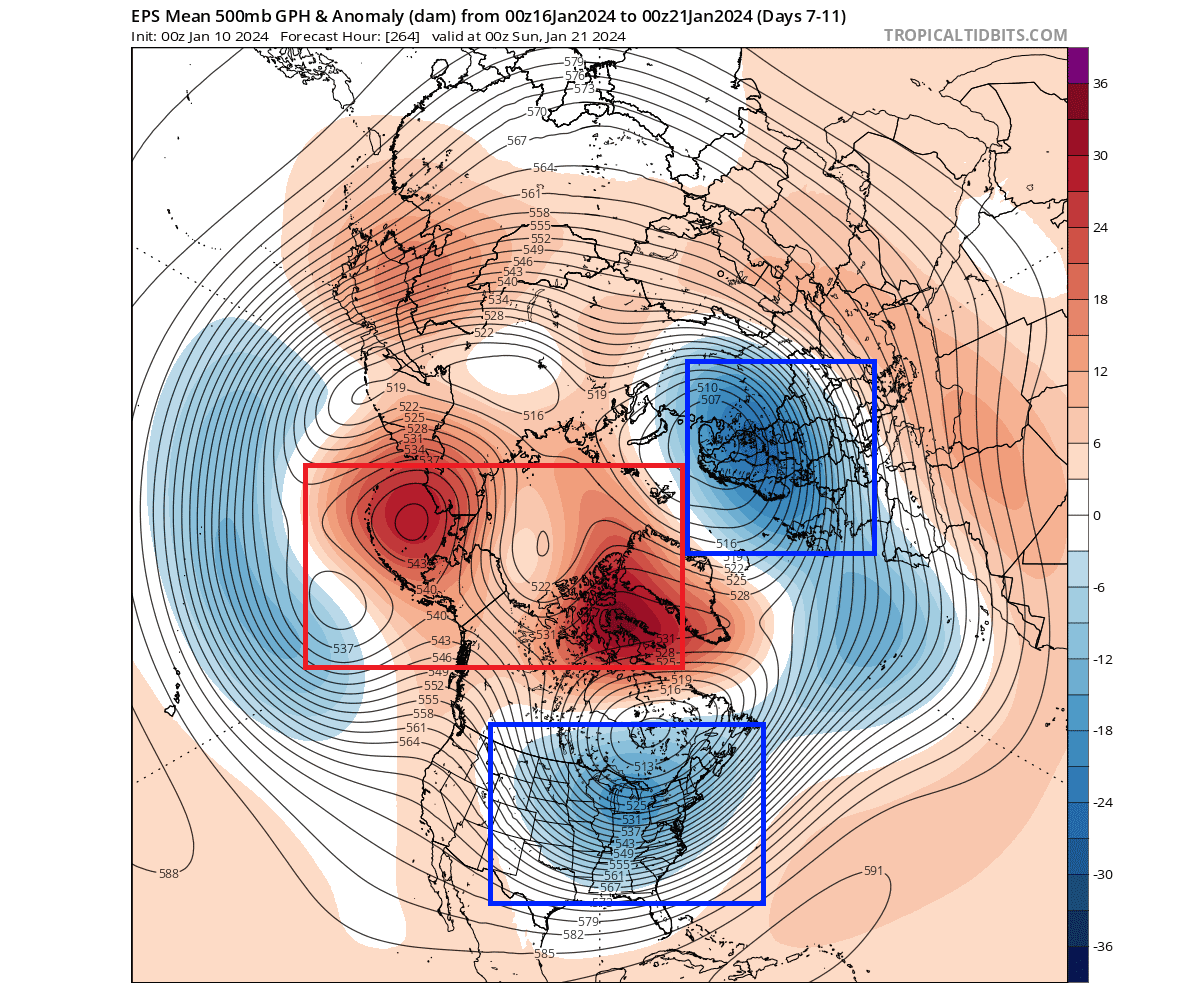
A new forecast update has been issued by the ECMWF, and it shows a strong Winter weather pattern continuing for the eastern United States in February and likely into March. A high-pressure zone over the Polar regions will remain in place, with a low-pressure pattern across the United States.
A trail of low-pressure systems has taken over the weather pattern over the United States. This is a big change from the warmer December pattern, which we talked about in a similar forecast article over a month ago and has now verified extremely well.
Now that the Winter pattern has arrived across the Northern Hemisphere, we will take a look at how long it might last. What is the latest long-range forecast, and what is the leading force behind such strong winter weather pattern changes?
SECOND WINTER MONTH
Meteorological winter covers three months, from December to February. This winter, the first month was unusually warm. But as the month just began, the early long-range forecast already called for a winter pattern shift in January.
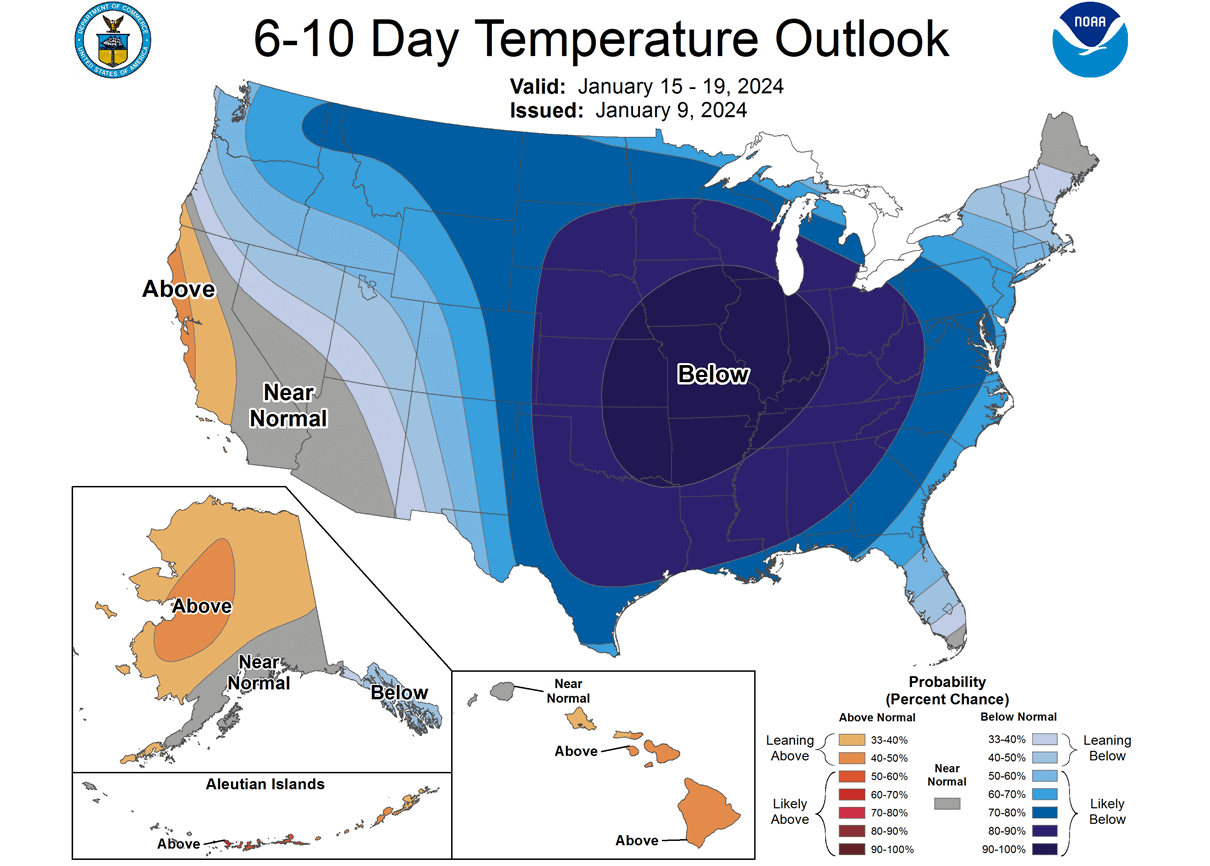
So, looking at the latest temperature outlook for mid-January, we can see the strong cold event spreading across the United States. The coldest temperatures are expected across the central and northern United States, spreading towards the east and the northeastern United States.
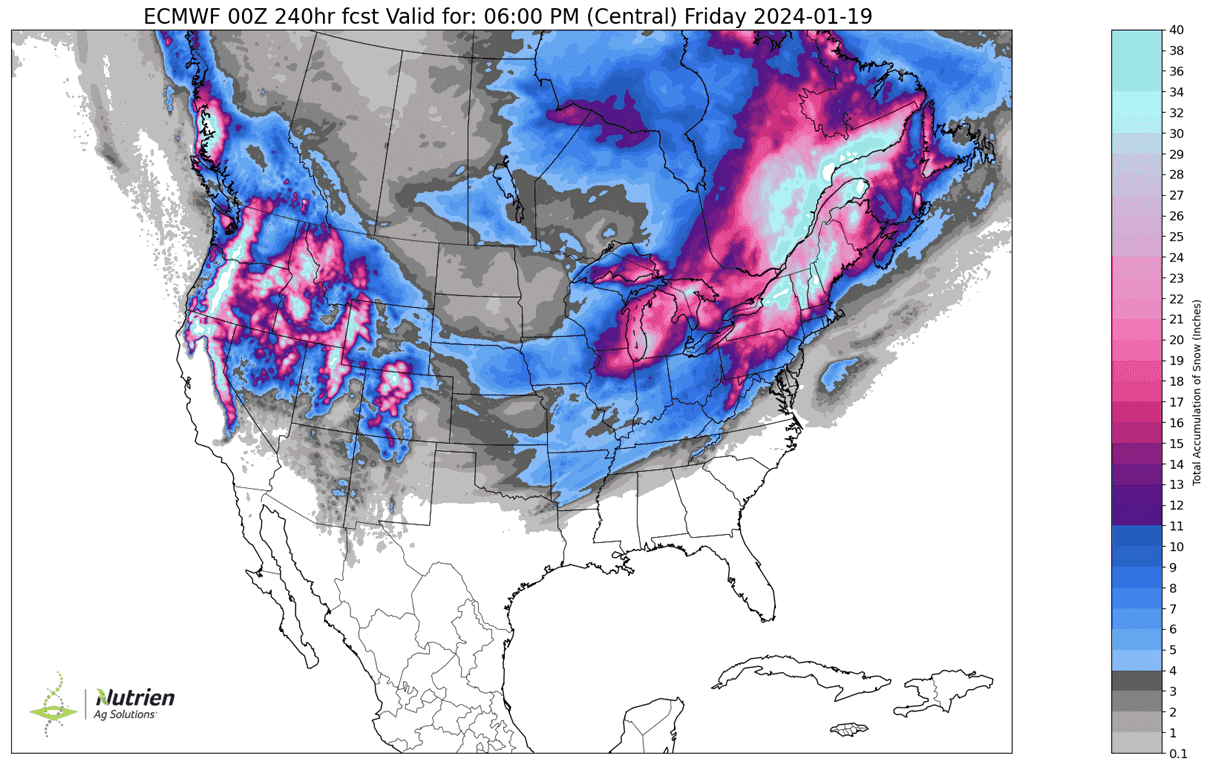
Below is the ECMWF snowfall forecast for the next 10 days. You can see plenty of snowfall in the higher elevations of the western United States and also in the northern lowlands. But the main story is the snowfall across the central plains, and especially the higher amounts across the Midwest and the northeastern United States.
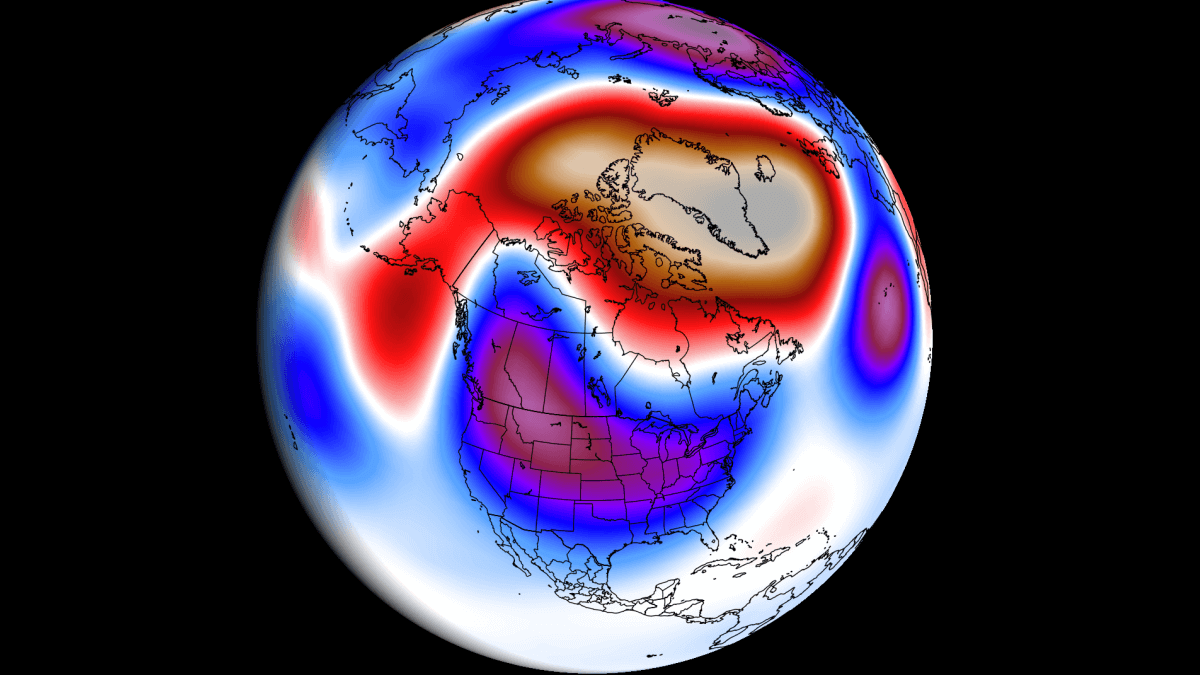
The driving pressure pattern in mid-January will be a high-pressure zone over the Pole, Greenland, and the Aleutians. A low-pressure area can be seen over the eastern half of the United States, bringing down colder air to the country and creating a proper weather pattern, as the long-range forecast indicated for January. Another low-pressure area is forecast over northern Europe.
This is a strong shift from the weather patterns we saw in December. For that reason, we can look at this pattern as a confirmation that the long-range predictions were on the right path more than a month ago.
But will this winter weather last, and what do the same long-range forecasts now show for the next months?
WINTER CONTINUES?
In the world of meteorology, February is usually regarded as the last winter month. And in many historical examples, it is usually at the end when Winter hits the strongest. But for that, you need some “global” support.
One such global factor is the El Niño event, currently active in the tropical Pacific Ocean. It has a known past of strong weather effects across the United States. We will talk more about this event further down below. But first, let’s look at what the latest forecast data shows for February.
The graphics below show the long-range forecast from the ECMWF data, openly available by the Copernicus project. Images are provided by weathermodels.com, using a commercial forecaster license.
The February upper-pressure anomaly forecast shows a clear colder signal for the central and eastern United States. You can see a broad low-pressure area extending from the entire East Coast inland over the southern United States. A ridge is forecast over the western United States and western Canada.
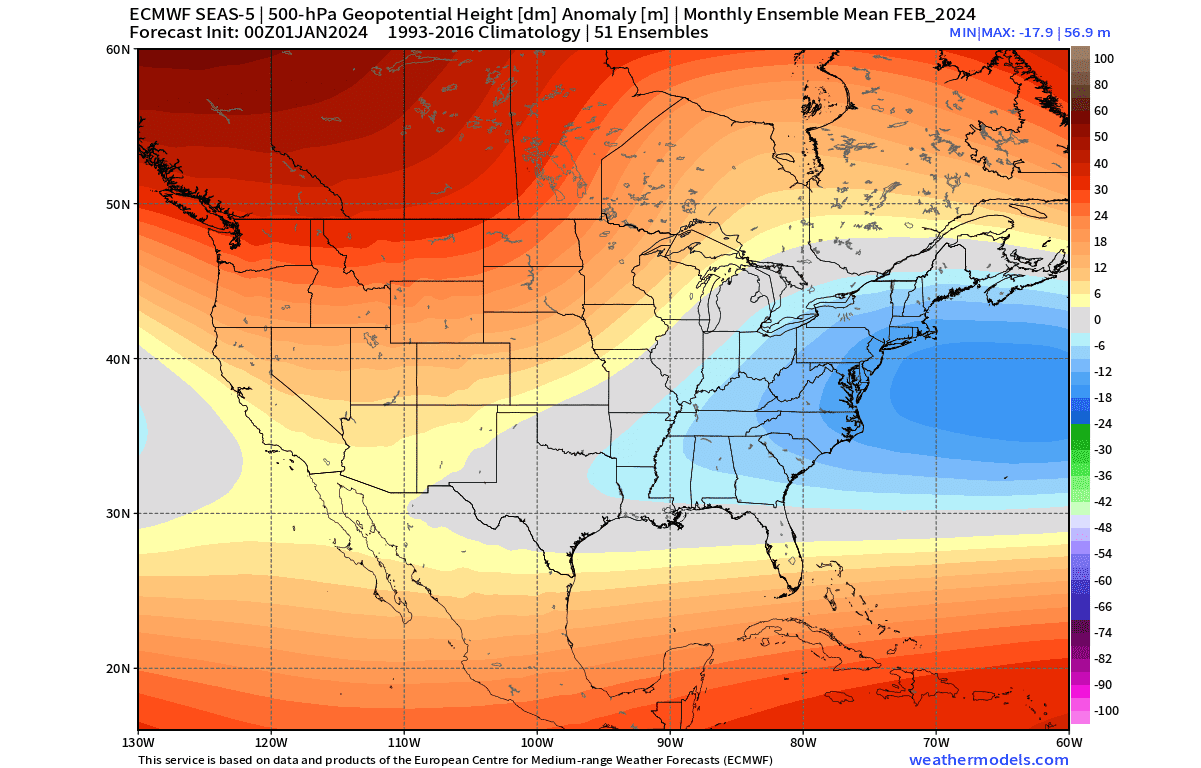
This helps to support a colder, northerly flow from southern Canada down into the United States. The image shows a monthly average forecast, so individual events can also impact the northern United States, as we see with current events.
Looking at the surface temperature forecast for February, it does not really show strong cold anomalies, but rather an area of normal temperatures with some colder areas. This was a similar case in the January forecast. What matters is the signal, which shows the best cold potential across the central and eastern United States.
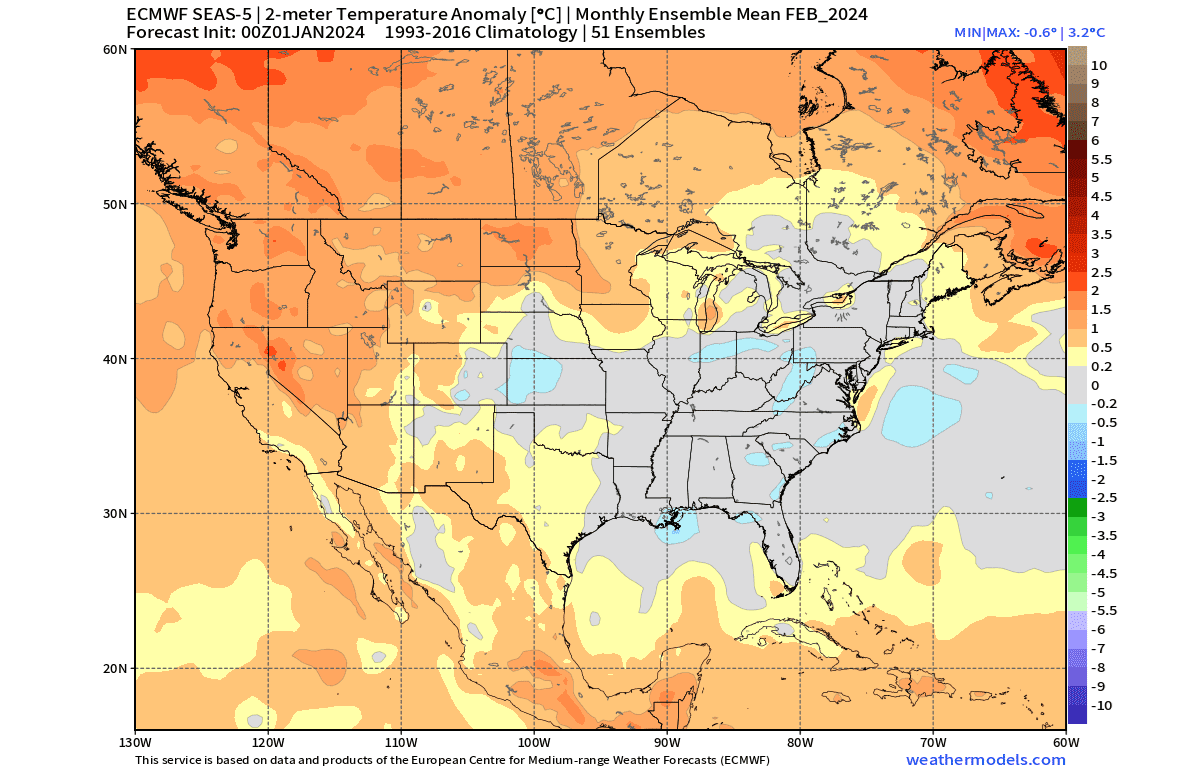
You can also see a warmer anomaly for the western and northern United States under the influence of the high-pressure area. Most of southern Canada is seen warmer than normal, except for the southeast, which is closer to the influence of the low-pressure area over the eastern United States.
But, as with the upper-level pressure, this forecast is a monthly average, and it does not mean that cold air will be stationary for an entire month over the eastern United States. It is likely that we will see a progression of a low-pressure system once or twice over the eastern United States, bringing a strong cold airmass along.
In the image below, you can see the sea-level-pressure anomaly forecast for next month. This forecast helps us to better understand the surface-level winds. In this forecast, you can see a predominantly northerly to northeasterly flow, which supports the colder-than-normal forecast across the central and eastern United States.

And also, this can indicate the potential for a “Nor’easter” event, with a low-pressure center off the coast and over the ocean. A Nor’easter is a storm along the East Coast of North America. It got its name because the winds over the coastal areas are typically from the northeast.
Nor’easters usually develop in the latitudes between Georgia and New Jersey, within 100 miles east or west of the East Coast. These storms generally move towards the northeast, and are usually strongest around near New England and the Maritime Provinces of Canada.
They bring heavy rain or snow, with gale-force winds, rough seas, and, in many cases, coastal flooding.
The forecast also hints at this, as more precipitation is expected across the southeastern United States and up along the east coast, consistent with a low-pressure zone. More precipitation is also seen over California, thanks to the stronger subtropical jet stream.
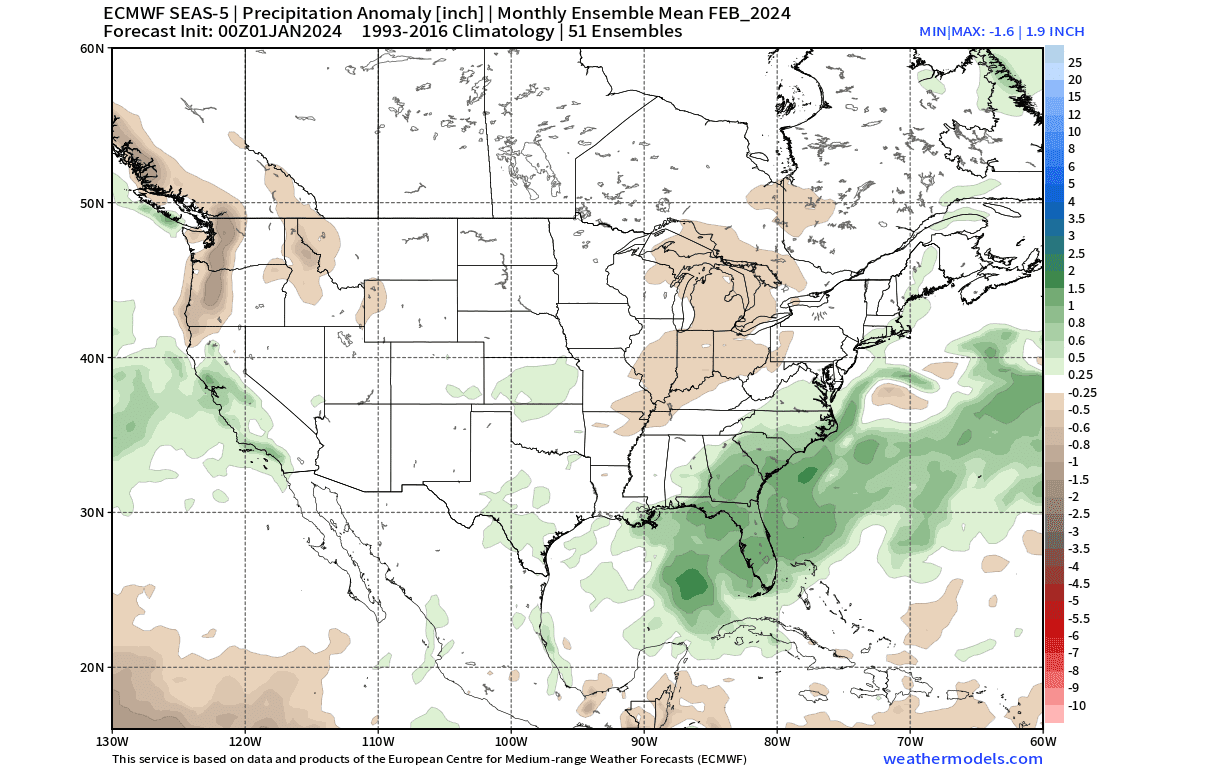
The main snowfall potential in this setup is over the eastern United States, like the Appalachians, around the Great Lakes, upper Midwest, central Plains, and the Northeast.
Looking quickly at the January pressure pattern over Europe, we can see a strong low-pressure zone over the northern and central parts. This is likely to bring a more westerly flow into the mainland and a more northerly flow over the northwest and north.
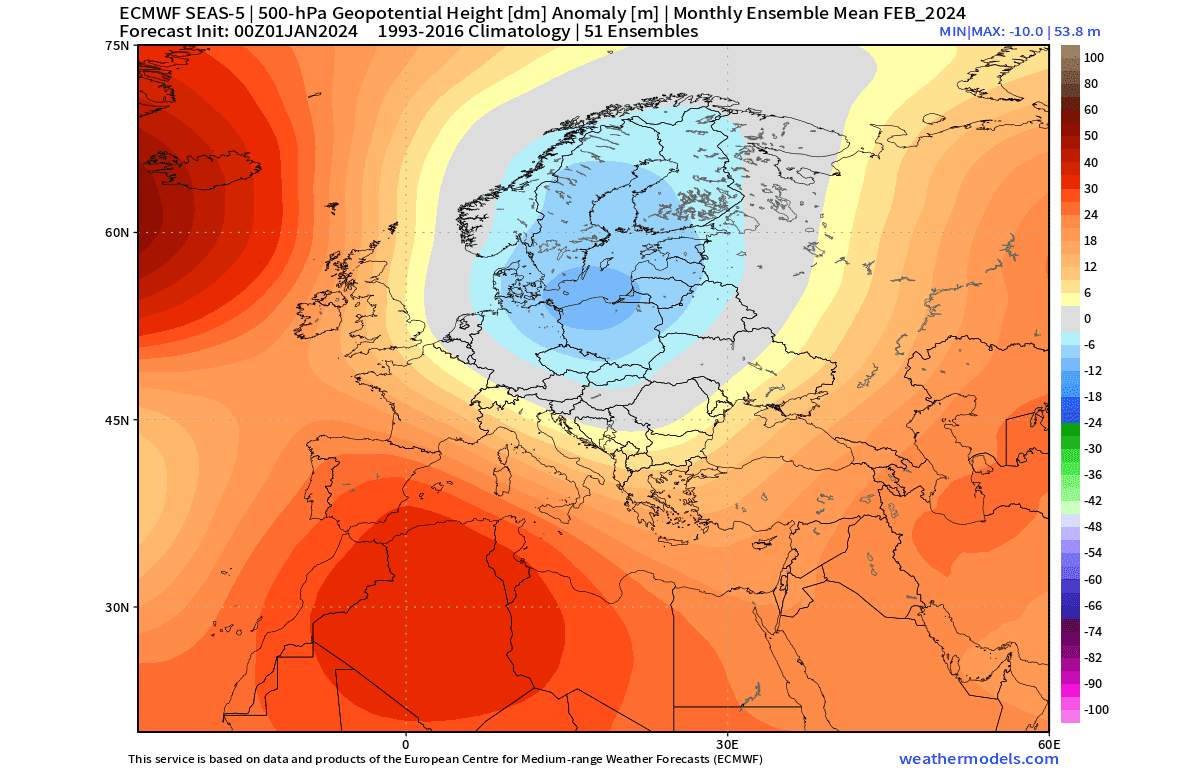
Looking at the temperature anomaly for February, there is a cold anomaly over northern Europe. Warmer anomalies are over the central and western regions due to the more westerly flow. But just like over the United States, such a broad low-pressure zone is not stationary over the entire month.
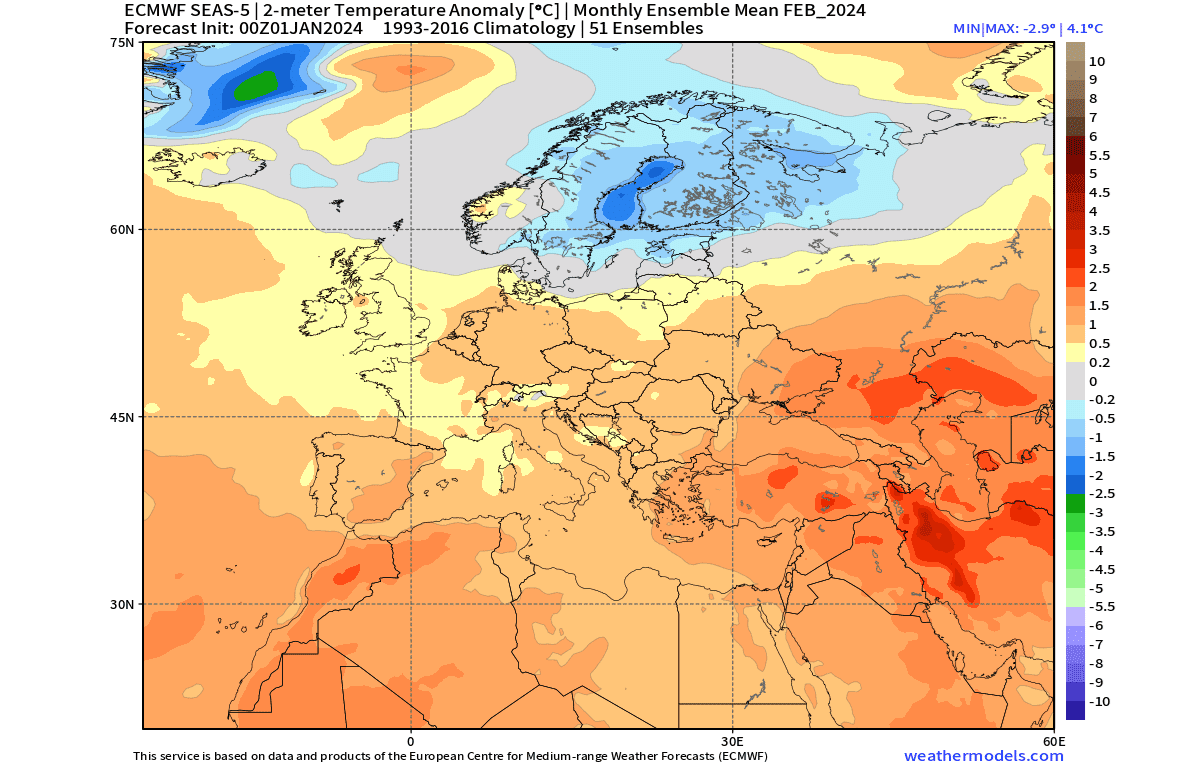
There is still a chance of a cold air outbreak across the continent as the low-pressure system drops lower down or moves further to the east. Exactly like we are seeing now in January, which was also forecast to be overall warmer than normal but still delivered colder periods.
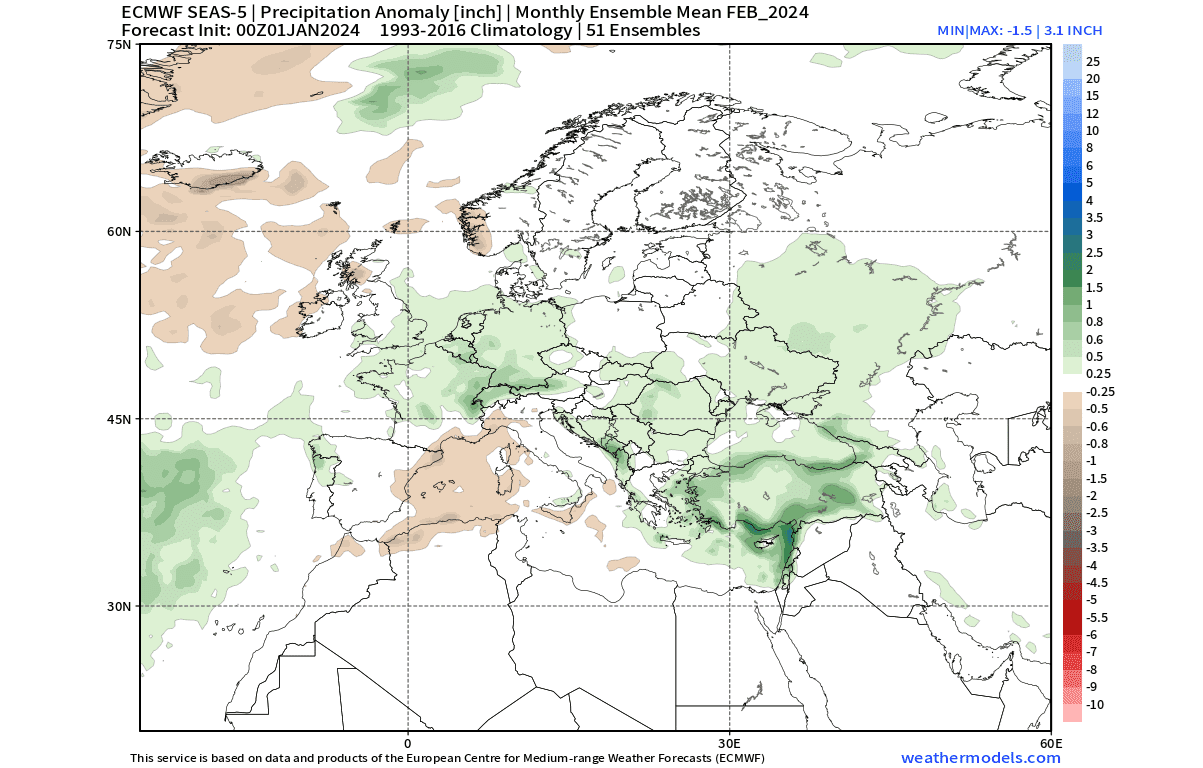
With a low-pressure system over the north, the forecast shows above-normal precipitation over much of continental Europe next month.
But what will happen as the global weather starts to change once we move into the first Spring month?
MARCH WEATHER PATTERNS
We will only look at North America in this segment as there is still enough of the El Niño influence left to create a meaningful skill for the forecast. But Europe already shows a diluted signal for February, with an even less clear/meaningful pattern shown for March.
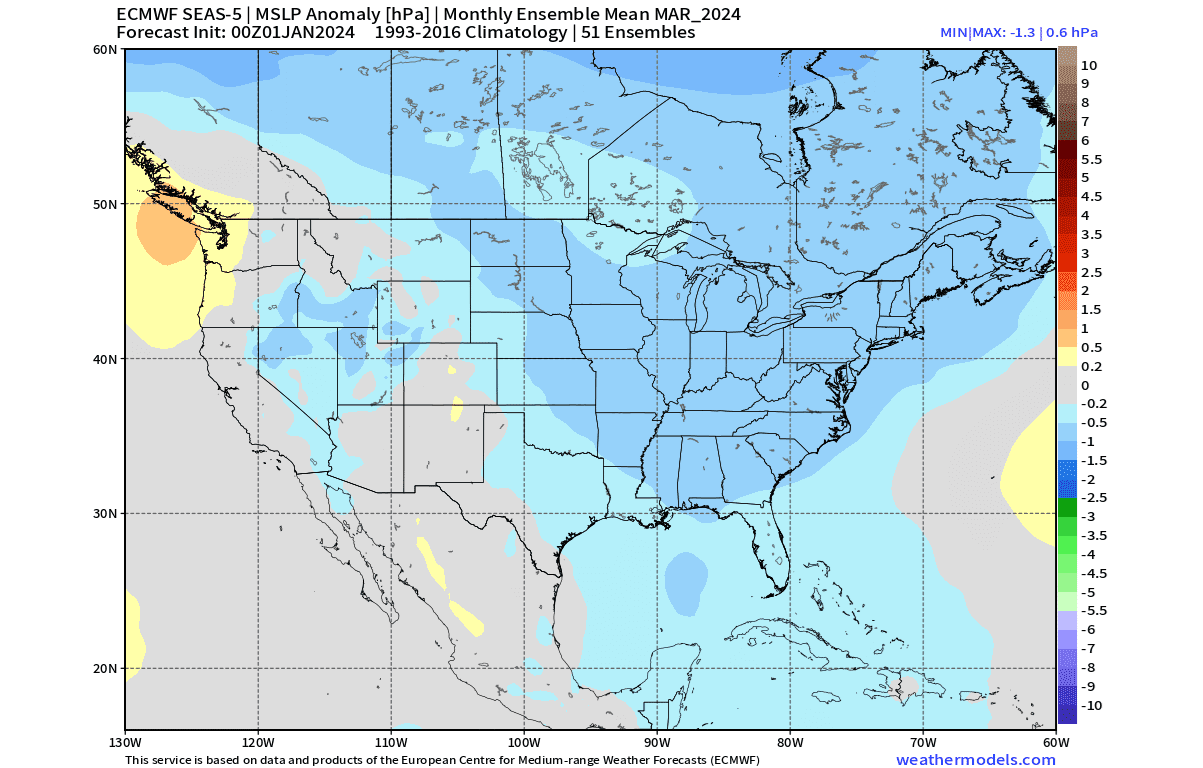
The March upper-pressure anomaly forecast shows a similar pattern to February on a quick glance: A low-pressure area signal over the eastern United States and a ridge over the Pacific Northwest. But the overall configuration is slightly different from February.
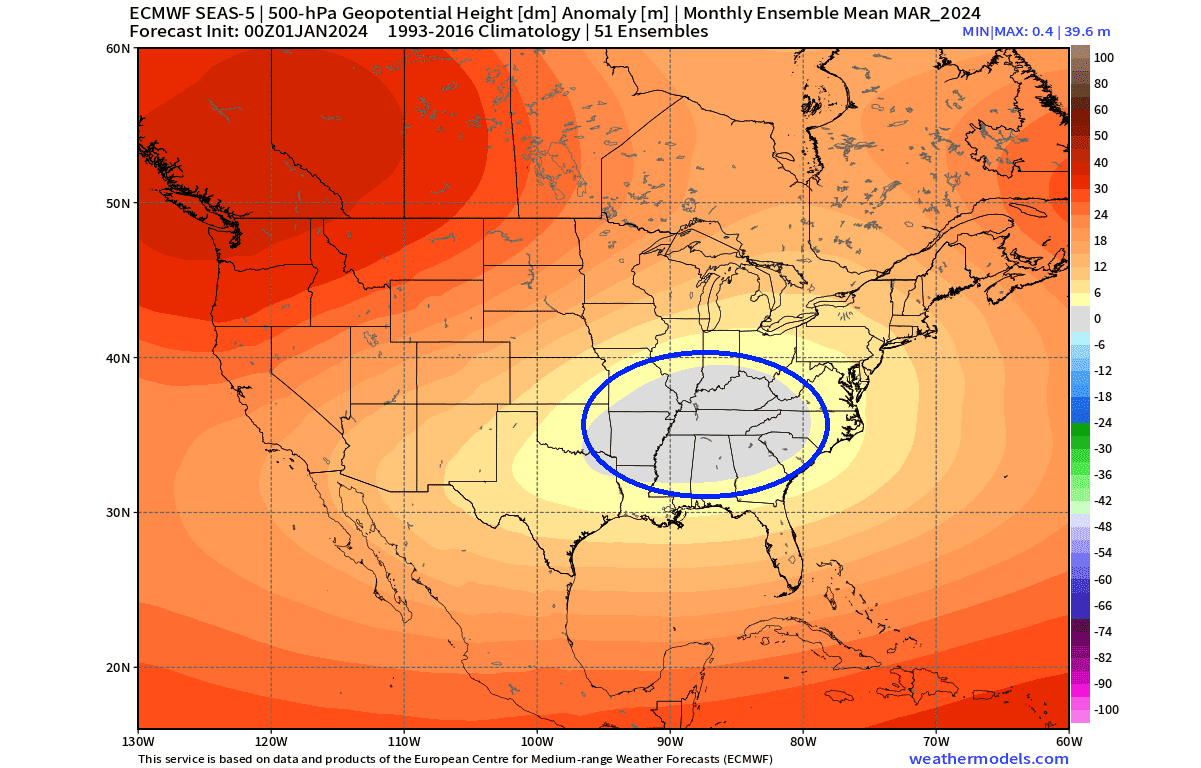
The low-pressure area is centered more inland over the southeastern United States. As a low-pressure area spins counter-clockwise, that means a northerly flow for the central and southern United States and a more southerly flow for the Northeast.
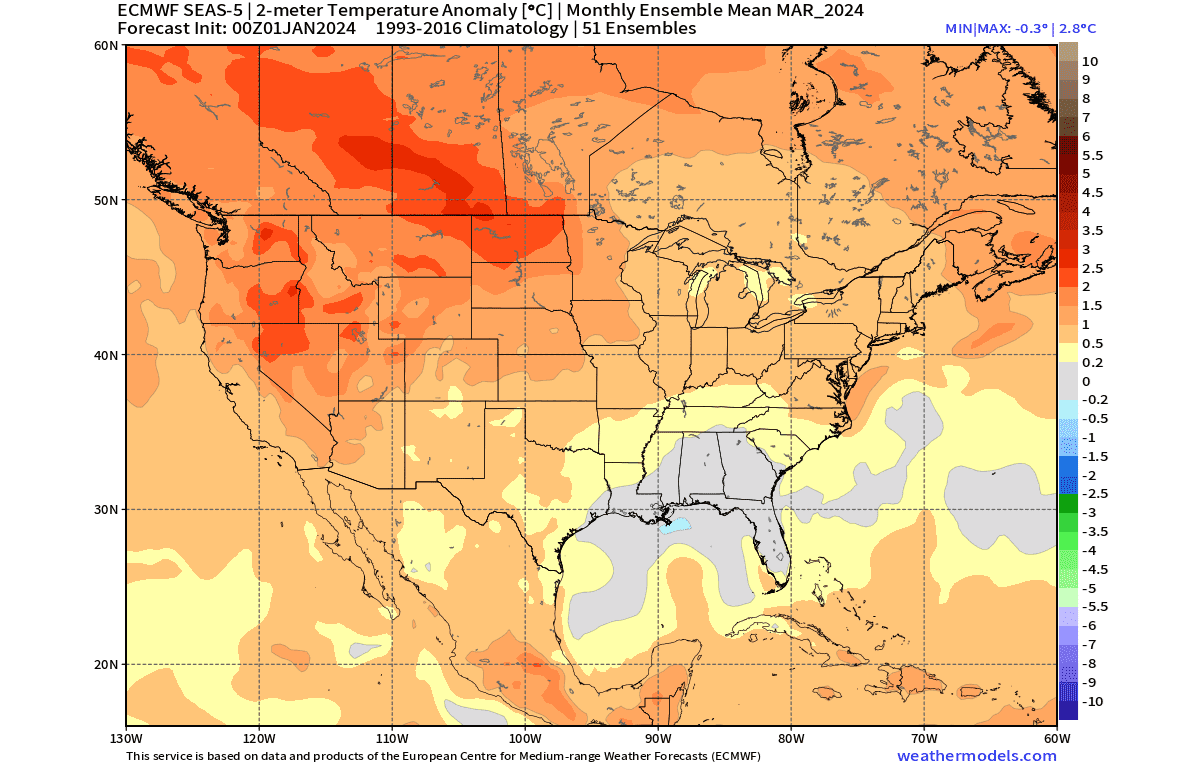
You can see that effect on the temperature forecast below. Warmer temperatures are forecast over the western United States and Canada, due to the high-pressure zone. But warmer than normal temperatures are also forecast for the northeastern United States, due to the more southerly flow.
The sea-level-pressure forecast below shows the eastern United States under lower surface pressure. This still has a potential for some cooler/colder periods across the central and eastern United States. But overall, it is more prone to bring a warmer airmass to the northeast.
That effect can be seen in the precipitation forecast. You can see more precipitation across the East Coast and parts of the eastern United States. This is the result of the warmer southerly flow, which also brings along more moisture.
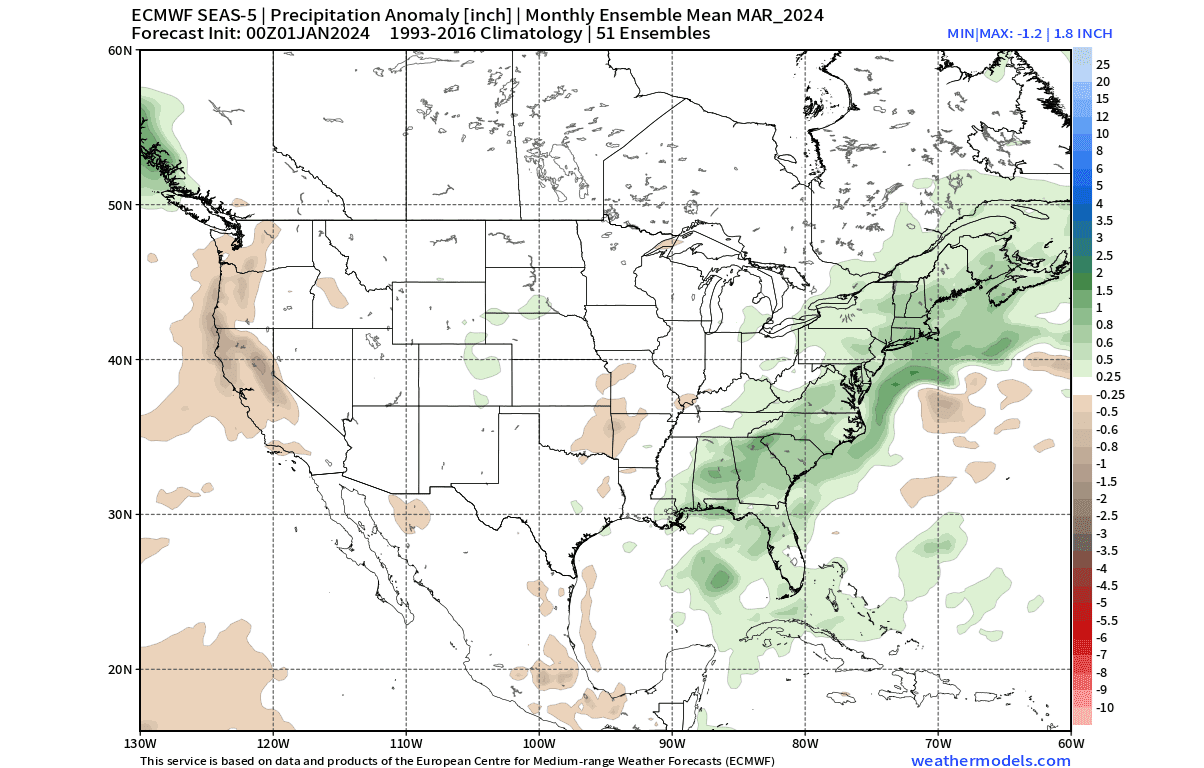
The main snowfall potential is likely to remain around the Great Lakes and over the northeastern United States in the borderline scenarios where some cold air from Canada is still available during a low-pressure system transition.
But what is actually behind these low-pressure areas over the United States? The answer is the ENSO.
ATMOSPHERE AND THE OCEAN
El Niño Southern Oscillation (or ENSO) is a region of the equatorial Pacific Ocean that changes between warm and cold phases. Typically, there is a change around every 1-3 years between phases.
We are currently in a warm phase called El Niño, which is expected to last into Spring 2024 and turn neutral by Summer.
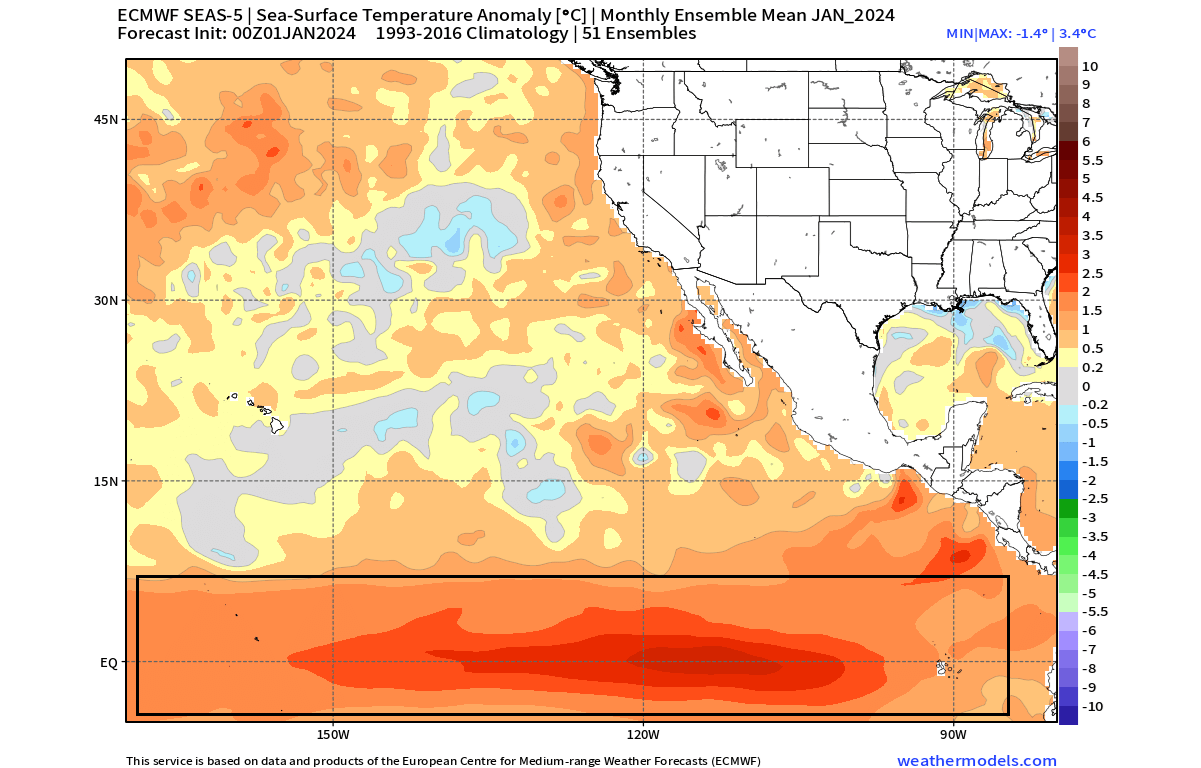
Below is also an ocean surface anomaly forecast for January 2024. You can see the strong ocean temperature anomaly in the Pacific Ocean. The forecast shows a central/basin-wide event strong enough to have a very noticeable atmospheric impact on weather patterns.
We produced a video showing the ocean anomalies from late Winter to Summer to better understand how the El Niño event began.
The cold ocean anomalies quickly broke down at the beginning of the year, with warm anomalies emerging in early Spring. This is how the El Niño event came to life as a result of large-scale atmospheric changes.
During the El Niño winter season, there is typically a strong and persistent low-pressure area in the North Pacific. That pushes the polar jet stream further north, bringing warmer-than-normal temperatures to the northern United States and western Canada.
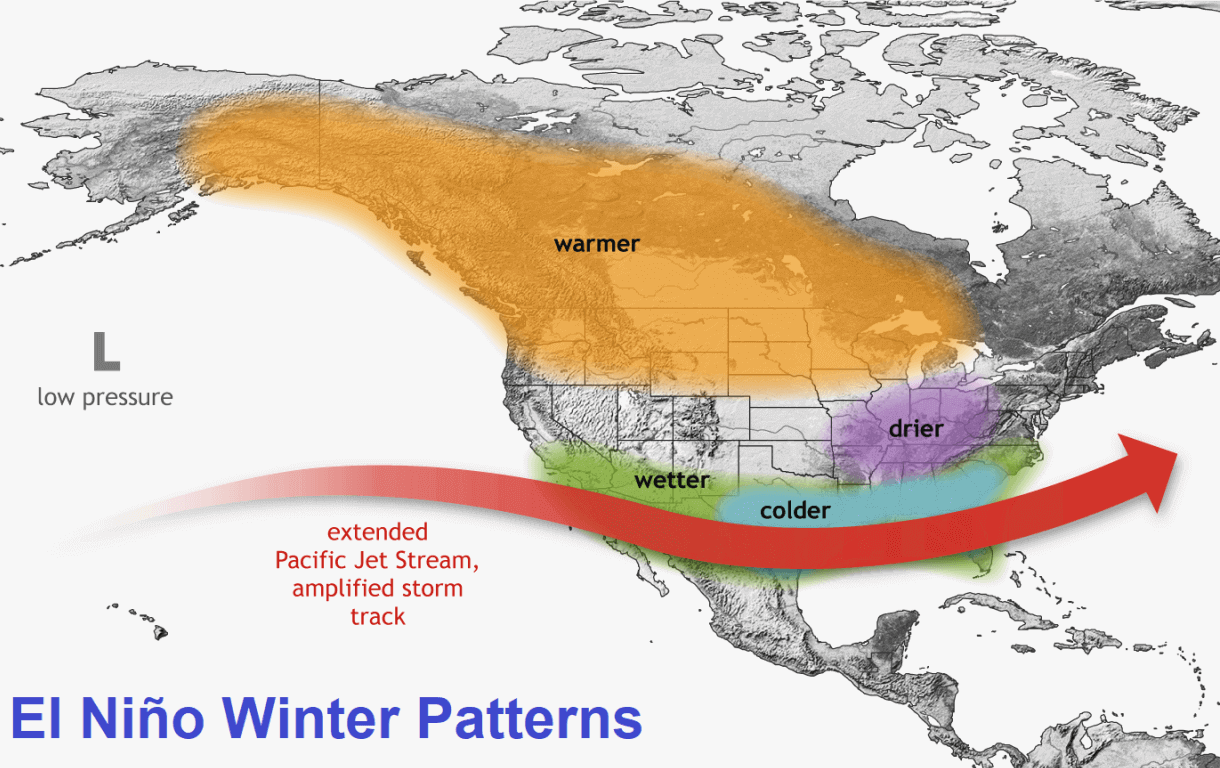
But the southerly Pacific jet stream is usually stronger during an El Niño, bringing low pressure and storms with lots of precipitation and cooler weather to the southern and southeastern United States.
Such a pattern is similar to what we currently see in the January weather patterns and in the February forecasts by the ECMWF. So, it is safe to say that there is a noticeable oceanic influence in the winter weather patterns in the coming weeks/months.
This development is important because changes in ocean temperatures also bring along changes in pressure and precipitation patterns in the tropics. And through those changes, the impact of the El Niño event can spread into the global circulation.
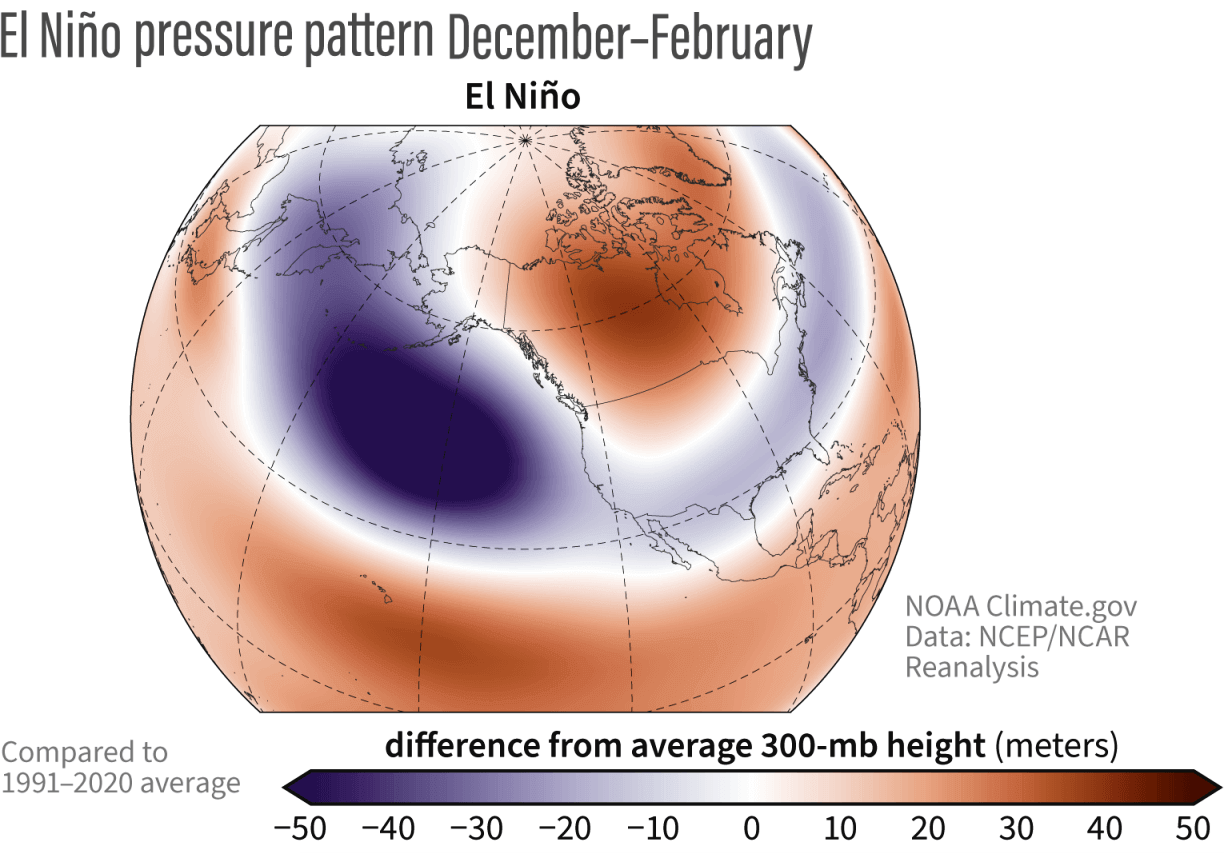
Below, you can see the average El Niño winter pressure anomalies. Notice the strong low-pressure anomaly in the North Pacific. Also, you can see the high-pressure area over Canada and the northern United States, exactly as in the forecast for the rest of January and February.
But a bigger can be seen if we look at the daily graphs. Below is a special image produced by meteorologist Eric Webb. It shows the usual percentage of strong low-pressure systems across the northeastern United States in an El Niño winter, based on the past 150 years of data.
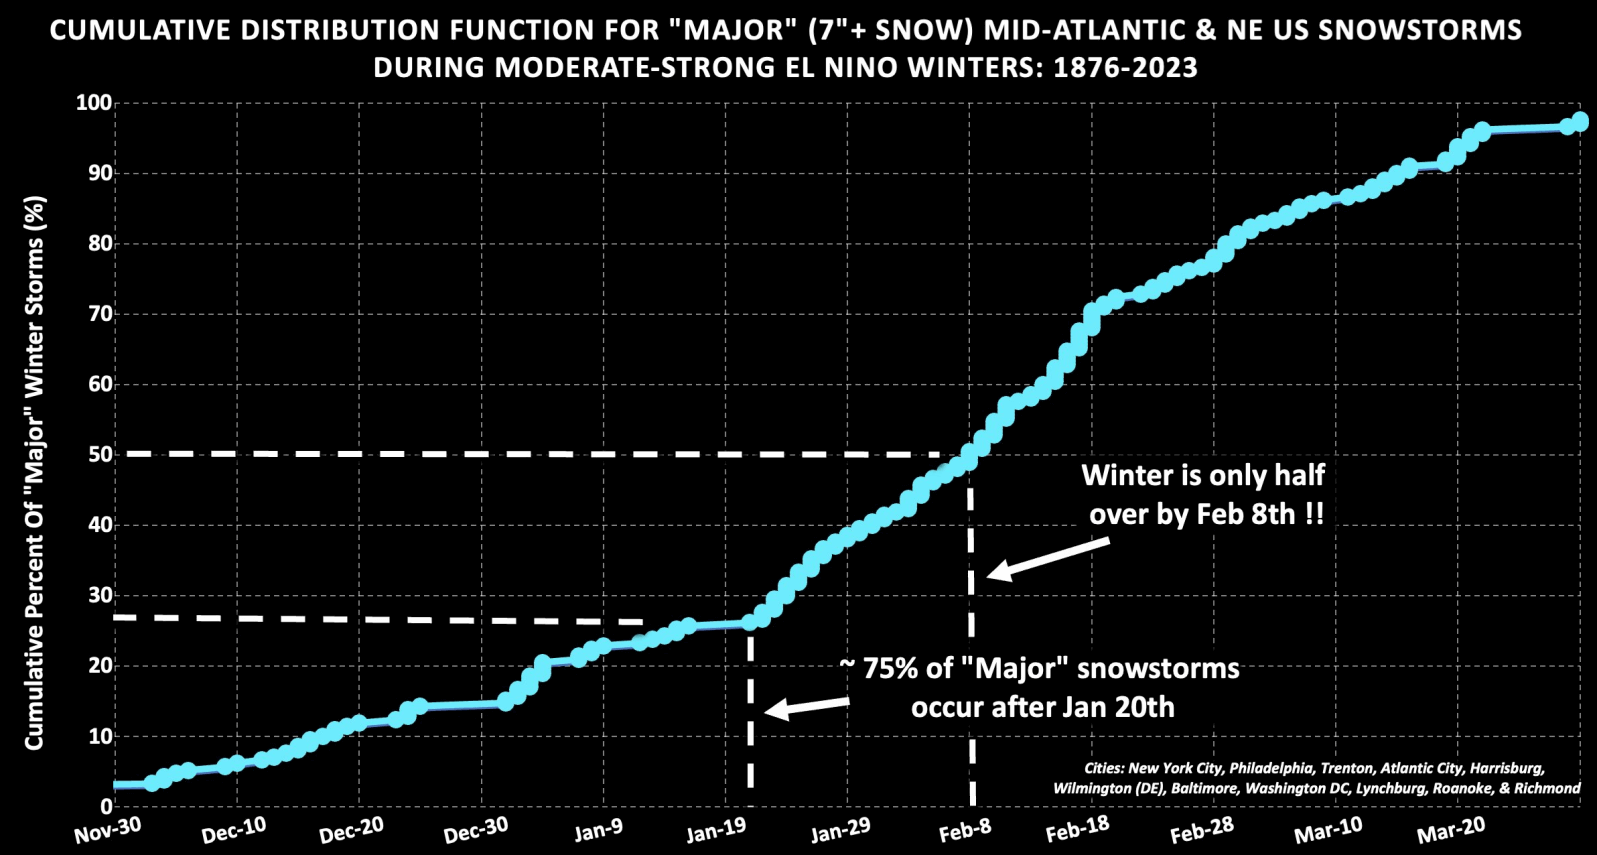
There are two things to take away from this graph. First, three-quarters of major snow events over the northeastern United States occur after January 20th on average. And second, winter is only half over by early February during an El Niño season.
Below is a temperature analysis by NOAA, which shows the number of past El Niño events that were more often warmer or colder. A pattern is seen that during these events, the winters are mainly colder than average across the southern half of the United States and up into the northeast.
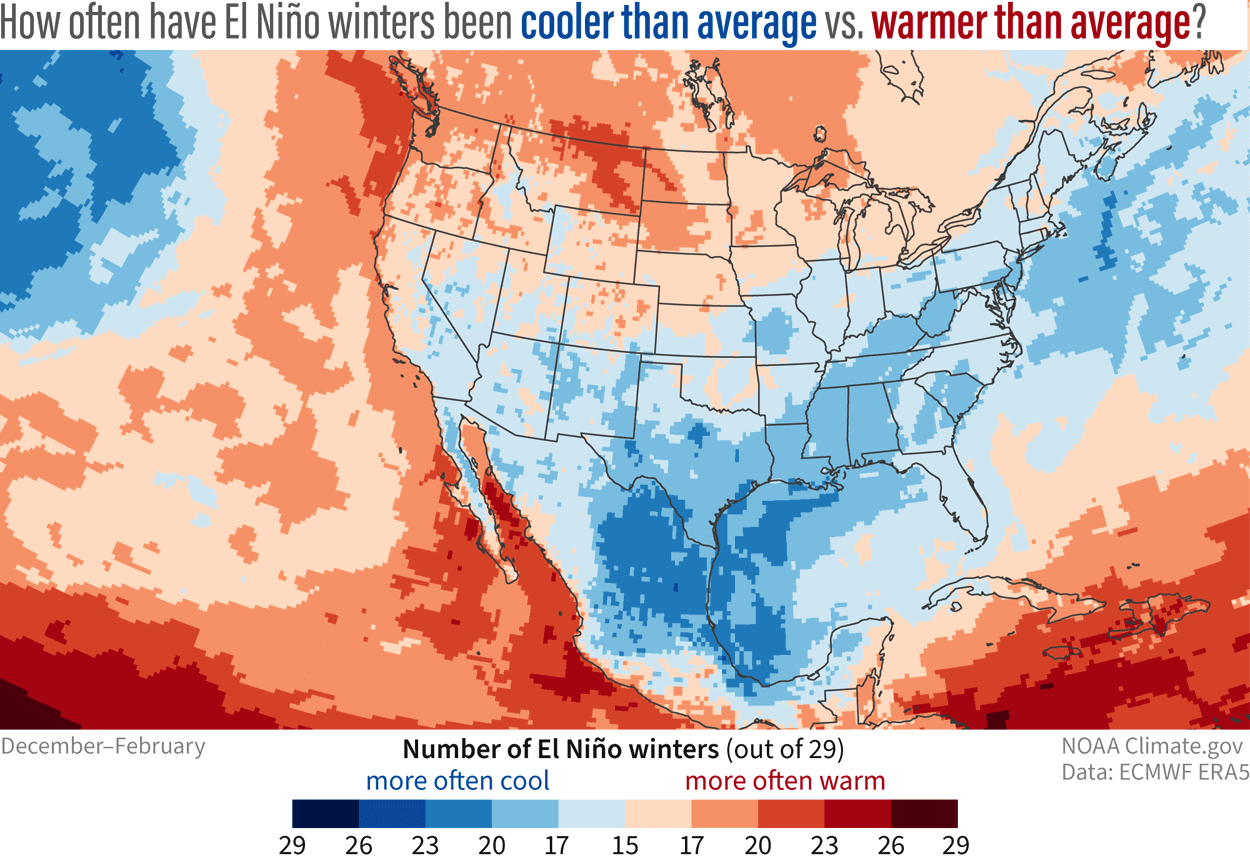
Warmer than average winters are usually over the northern Plains, upper Midwest, and the Pacific Northwest. This is also a similar pattern that we are in right now, and also, as the forecast indicates for February.
All this data combined gives us a very clear indication that the 2023/2024 winter season is heavily driven by the strong El Niño event. It also seems to follow a very textbox example of its impact from early warmth across the United States to a winter pattern shift in January and a finale in February.
We will keep you updated on the developing weather trends in the coming weeks, so make sure to bookmark our page. Also, if you have seen this article in the Google App (Discover) feed, click the like button (♥) there to see more of our forecasts and our latest articles on weather and nature in general.
Don’t miss: