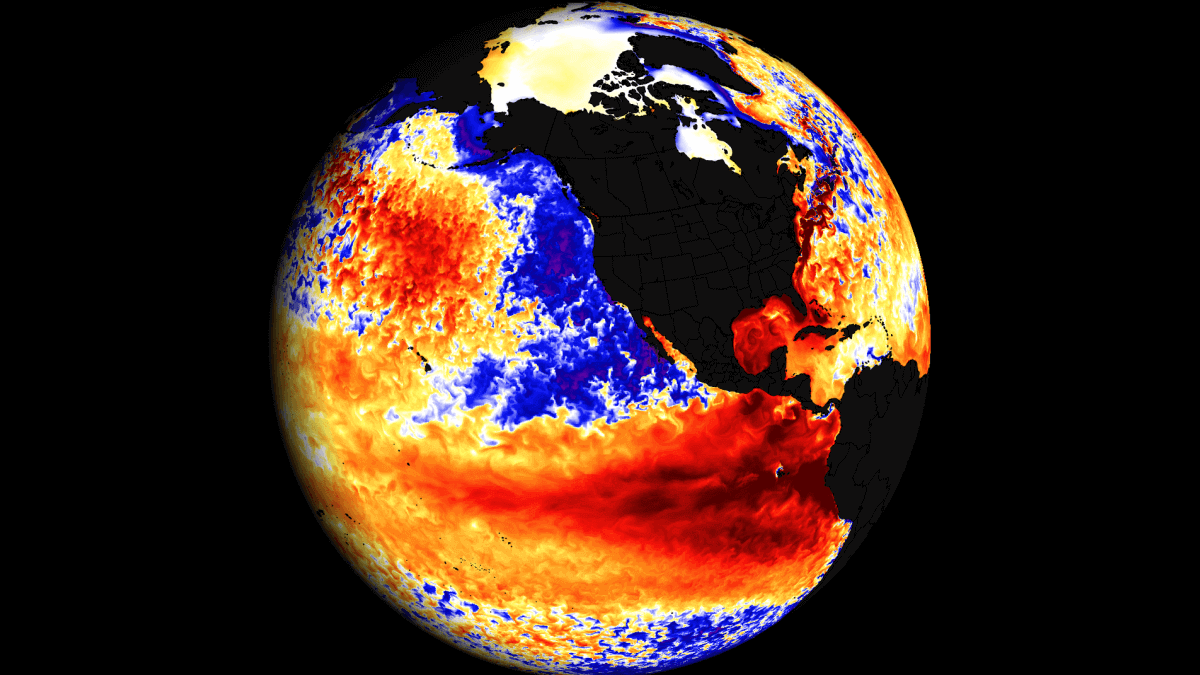
Latest changes in the ocean and the atmosphere have prompted NOAA to release an official El Nino watch. This means that El Nino is starting to develop, bringing worldwide weather impacts in the second half of the year and especially over next Winter.
Ocean anomalies can often impact the atmospheric conditions and our weather on shorter and longer time scales. Perhaps even more so in Winter, when the pressure systems are strongest.
First, we will look at how these ocean anomalies impact global weather patterns. Then you will see how El Nino is already emerging and how it is expected to influence the Hurricane season, especially the WInter 2023/2024.
WHERE THE OCEAN MEETS THE ATMOSPHERE
El Nino and La Nina are two phases of the ENSO, which stands for “El Niño Southern Oscillation.” This region of the equatorial Pacific Ocean regularly shifts between warm and cold phases. Typically there is a phase change around every 1-3 years.
The image below shows the ENSO regions across the tropical Pacific. Regions 3 and 4 expand over the east and west tropical Pacific. The main area combines regions 3 and 4, seen in the image as the Nino 3.4 region. But notice the regions 1+2, as they are important in this story.
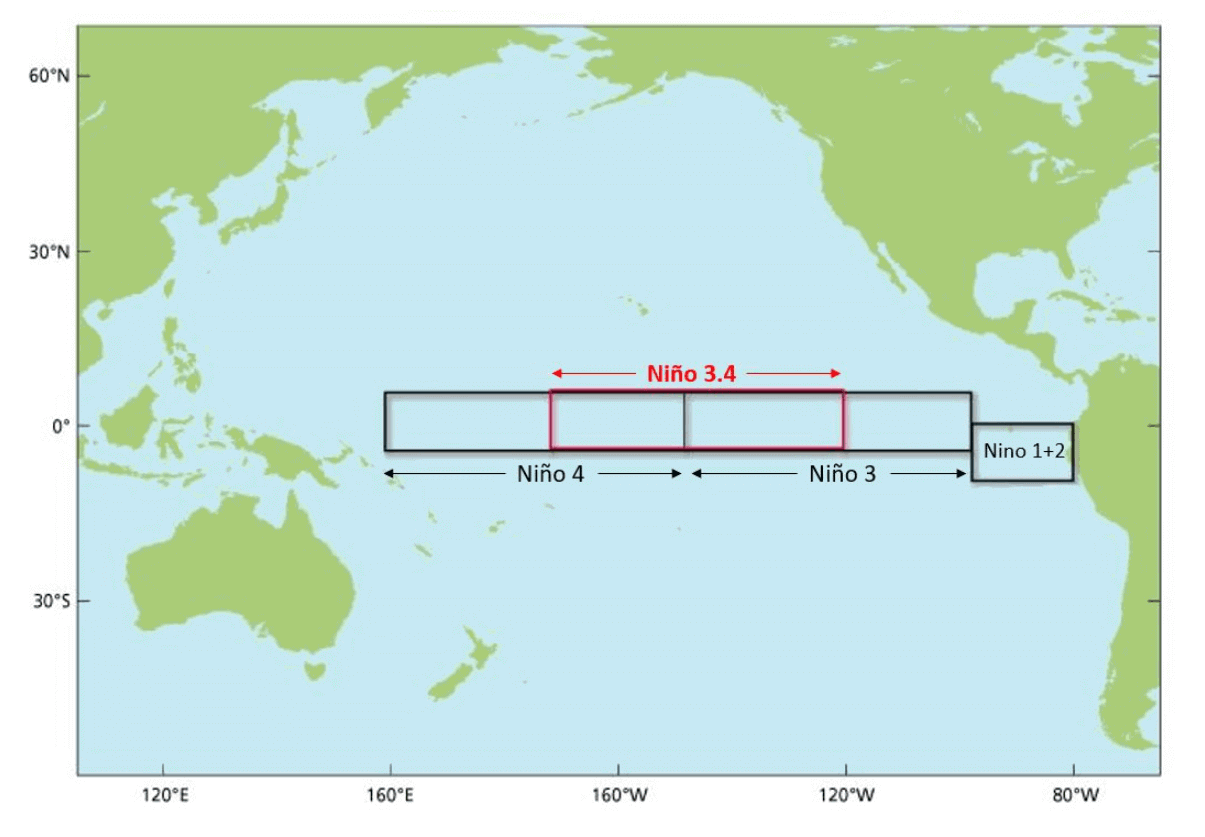
Each ENSO phase influences the pressure and weather in the tropics differently. This affects the overall global circulation over time, changing the weather patterns worldwide.
A new (cold/warm) phase usually develops between late Summer and early Fall. It then lasts until Spring, but some events can last up to two or three years.
The cold ENSO phase is called La Nina, and the warm phase is called El Nino. Besides the ocean temperatures, one of the main differences between the phases is the pressure patterns they promote, seen below as high (H) and low (L) pressure zones.
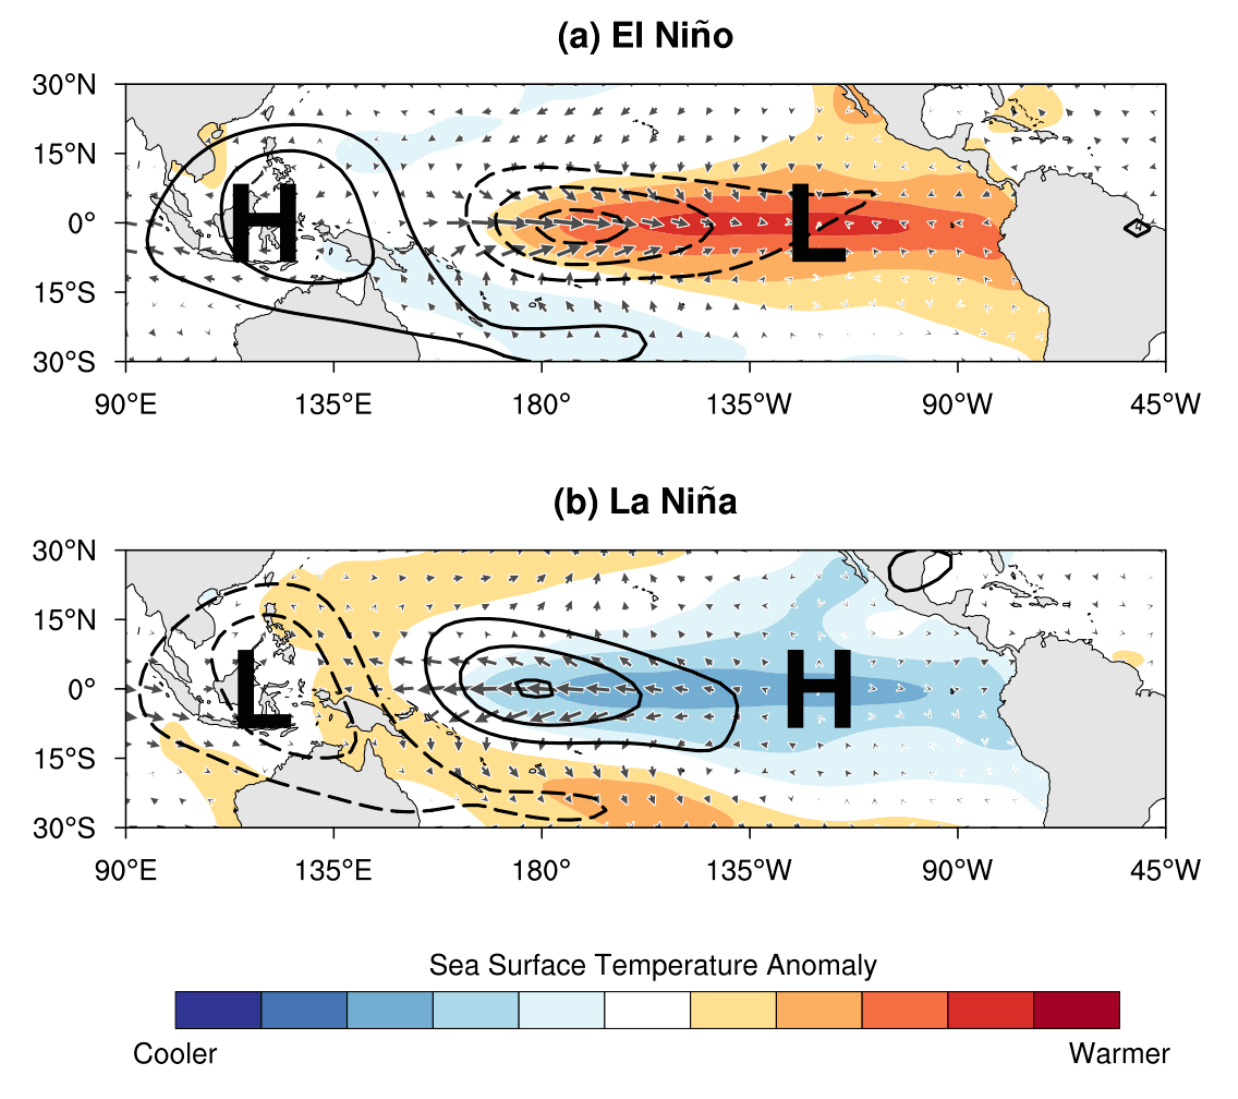
During an El Nino, the pressure over the tropical Pacific is lower, with more rainfall and storms in this region. But during a La Nina, the pressure over the equatorial Pacific is higher, creating stable conditions and fewer storms.
These pressure changes translate into global circulation over time, affecting seasonal weather over both Hemispheres. We can observe a global shift in pressure patterns during the emergence of an ENSO phase. But it is usually more influential during the peak of its phase.
The following image below from NOAA Climate shows the typical circulation during an El Nino event, which is the warm phase of the ENSO, now developing.
Rising air in the eastern Pacific causes more storms and precipitation and lowers the pressure over that region. At the same time, the air is descending in the western Pacific, causing stable weather and high-pressure conditions.
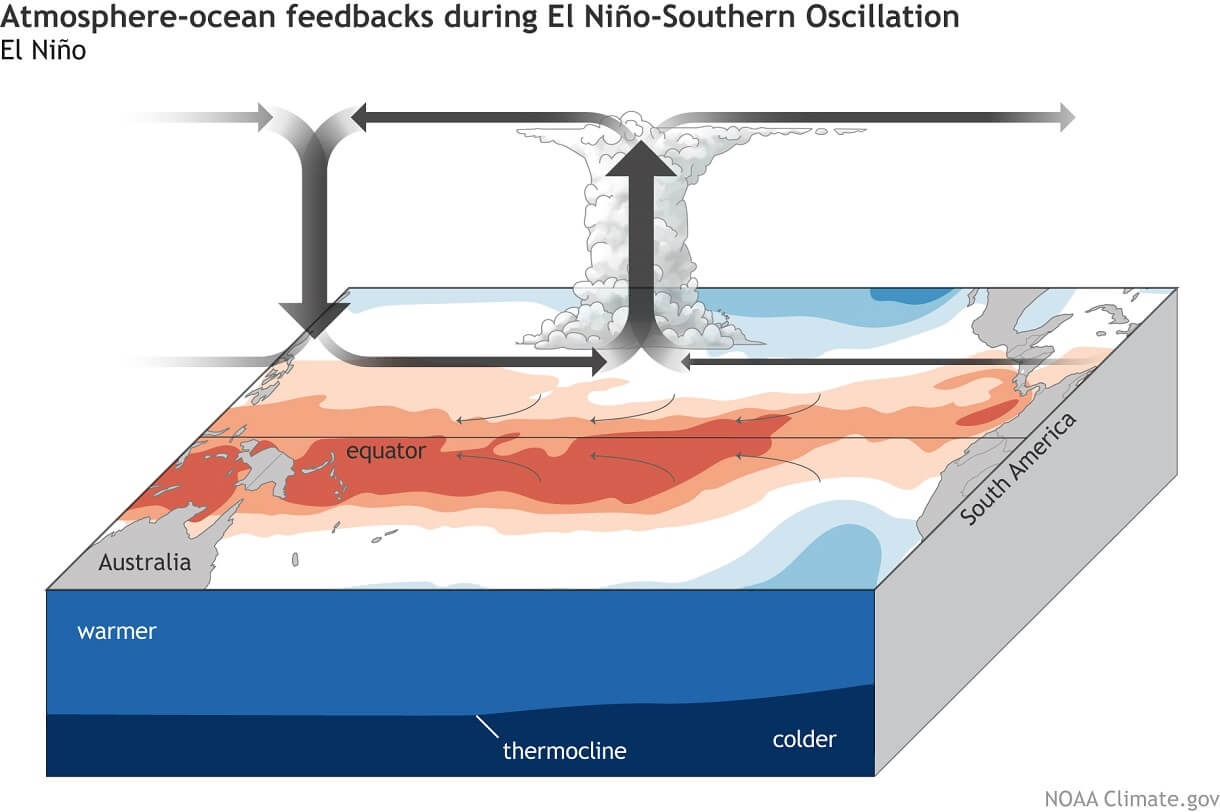
This way, ENSO strongly impacts the tropical rainfall and pressure patterns, affecting the ocean-atmosphere feedback system. Through this ocean-atmosphere system, the ENSO influences the weather globally.
ATMOSPHERIC FLOW
But how can ENSO shift between cold and warm phases so rapidly? The simplest answer is that it happens because of a complex relationship between pressure, winds, and ocean currents.
Global trade winds usually start or stop a certain ENSO phase by overturning the ocean surface layers and altering the ocean currents. Trade winds are steady and persistent winds, blowing towards (and along) the equator in both Hemispheres.

But the key here is not just in the winds, as pressure differences drive them. Thus, the ENSO phase directly responds to an atmospheric pressure change called the Southern Oscillation Index (SOI).
The Southern Oscillation Index or SOI represents the difference in air pressure measured at Tahiti (French Polynesia) and Darwin (Australia). The image below shows the location of the two pressure zones important for ENSO.
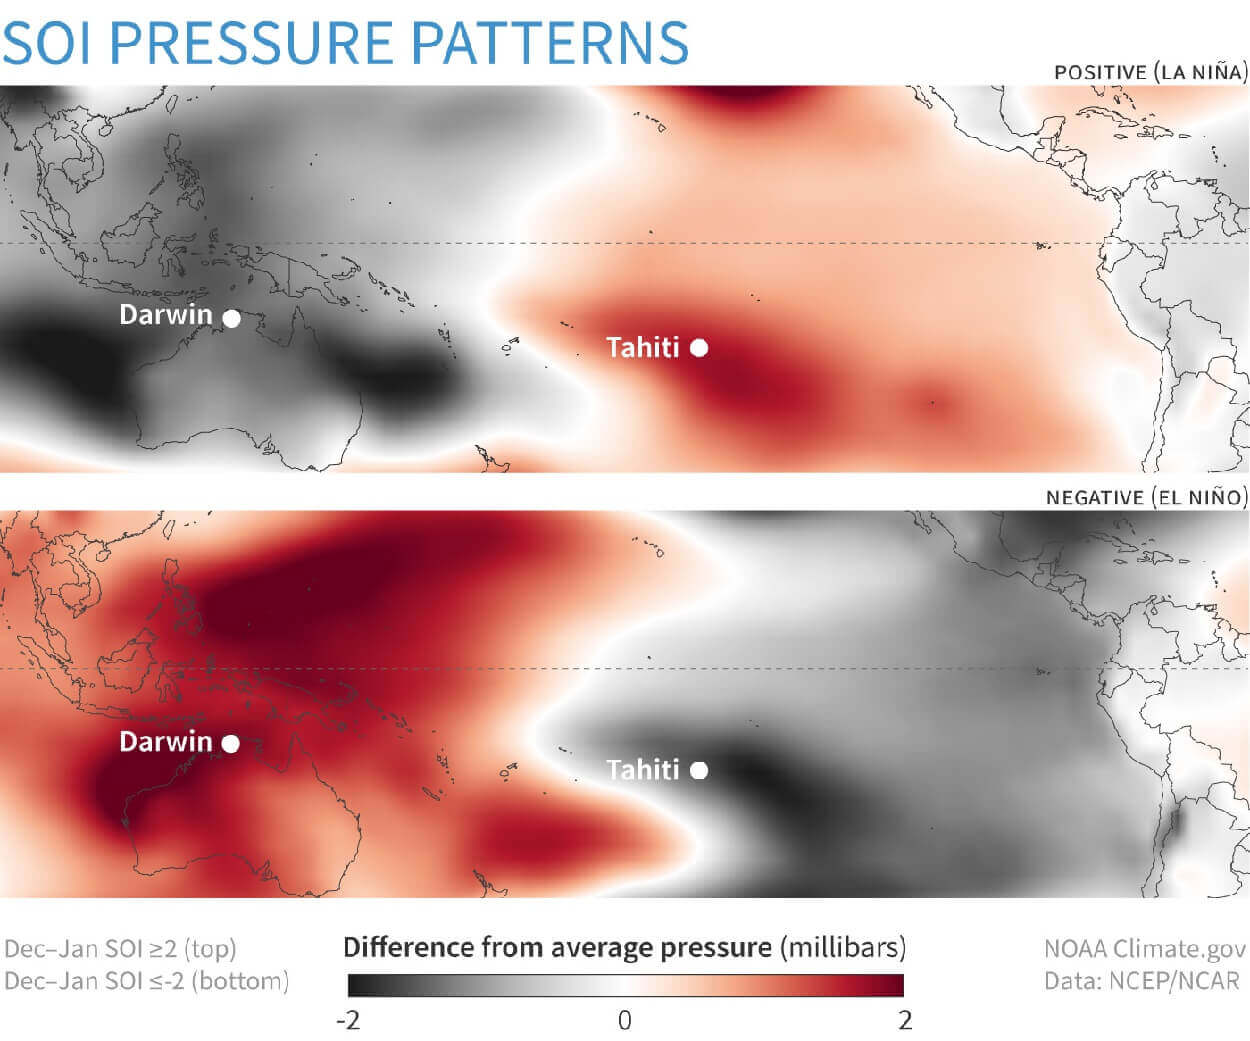
Positive SOI values mean the pressure over the Tahiti side is higher than over Darwin in Australia. This corresponds to stronger easterly trade winds, supporting La Nina conditions.
But during an El Nino, we see lower pressure in the eastern Pacific, over Tahiti, and higher pressure over Darwin. This produces a negative SOI value and weaker trade winds, which means less ocean surface cooling.
You can see this entire process in the video animation below. It shows the ocean temperature anomalies from Winter to Spring 2023.
The cold La Nina anomalies quickly broke down over the Winter, with warm anomalies emerging in early Spring. Notice the motion of the anomalies, being driven by the trade winds.
And as you will also see, the trade winds are now starting to have a major role in the rapid shift from cold to warm ENSO conditions.
AS THE WINDS CHANGE
The image below is a wind analysis from ECMWF over tropical regions. The upper two marked areas show a burst of westerly winds in March and early April. Generally, westerly winds support the warming of the ocean surface but also play an important role in weather and climate locally and globally by influencing storm patterns and impacting ocean circulation.

In the lower marked area is the forecast, which shows the westerly winds expanding further east across the ENSO regions toward late April. The importance of the westerly winds is also in their ability to force an oceanic Kelvin wave.
To simplify, an oceanic Kelvin wave, forced by the westerly winds, can create warmer than normal conditions across the ENSO regions, pushing the warmer waters to the east and lowering the thermocline border.
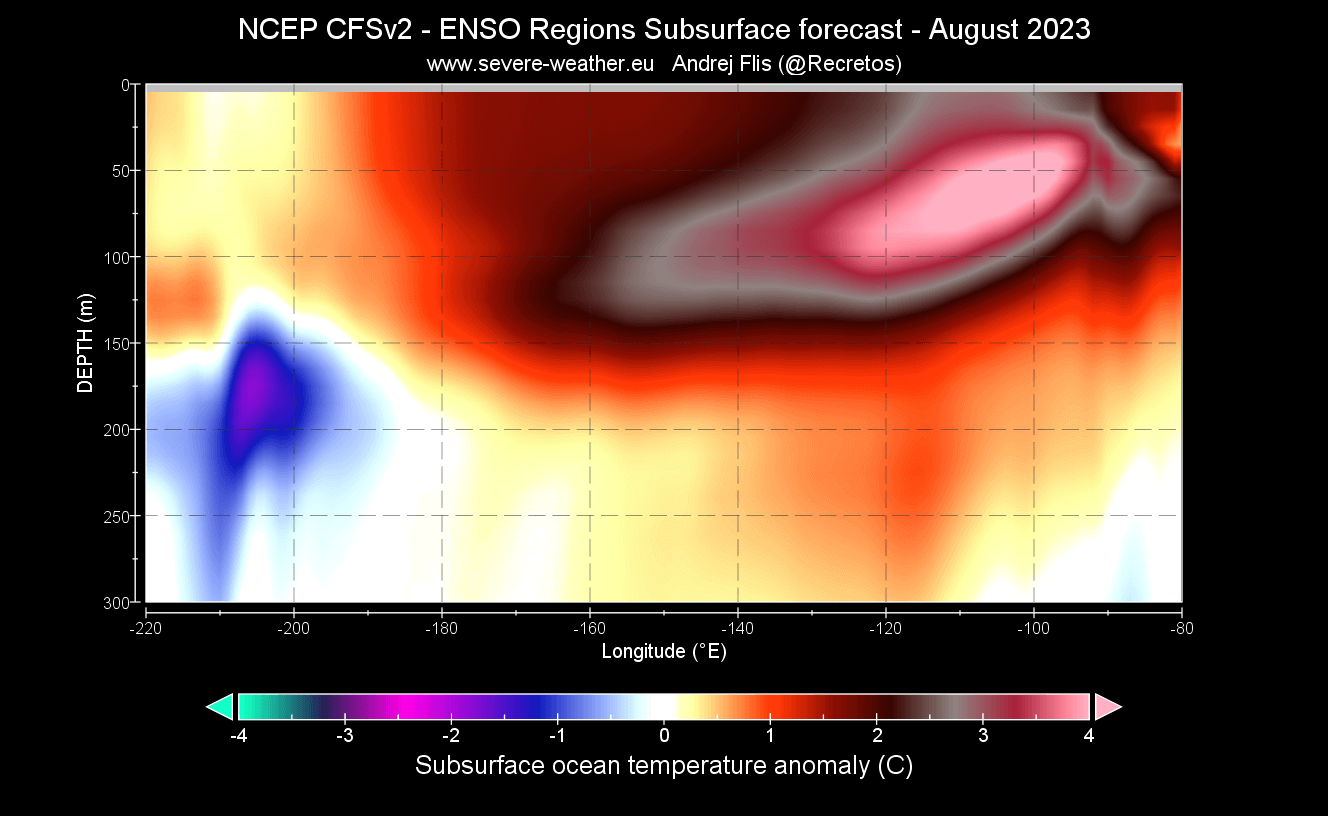
The best example of an oceanic Kelvin wave in action can be seen in the image below. It shows the subsurface ocean temperature anomalies. The large below-surface warm pool is the Kelvin wave, growing larger and spreading towards the east and up to the surface.
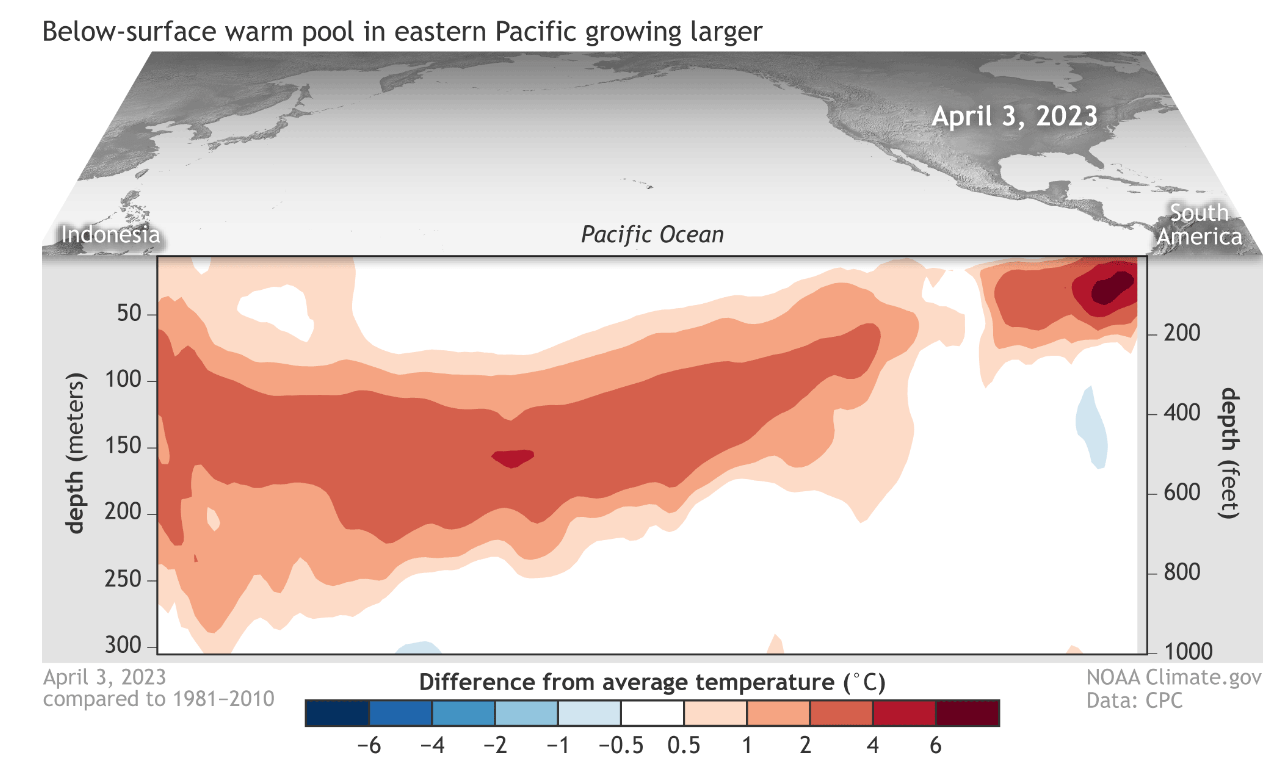
A strong subsurface warm pool is the main pre-condition to kickstart an El Nino event. That is why we closely monitor the atmospheric winds and ocean currents across the tropical Pacific.
You can see two analyses from TAO/TRITON data in the image below. The top shows the zonal winds, where we marked a large area of westerly wind anomalies. The bottom shows the ocean heat content, where warm (positive) anomalies are currently emerging.

The changes in the ocean heat content are mainly due to the expansion and rise of the strong subsurface warm pool, seen in the previous image.
Looking at the ocean heat content graph below, you can see the strong cold phase in 2022 associated with La Nina. But notice the strong shift into warm anomalies in March, as the Kelvin wave expanded east across the equatorial Pacific, warming the upper ocean levels.
This has prompted NOAA Climate Prediction Center to issue an official El Nino watch, as the latest oceanic and atmospheric changes indicate an El Nino event is already starting to develop.

In their discussion, they write: “The most recent IRI plume favors a transition to El Niño, beginning June-August 2023 and persisting into the Winter. …the recent oceanic Kelvin wave plus recurring westerly wind anomalies are anticipated to further warm the tropical Pacific Ocean.”
So now, we will focus on winds and subsurface temperatures and the actual visible changes on the ocean surface.
THE EL NINO IS RISING
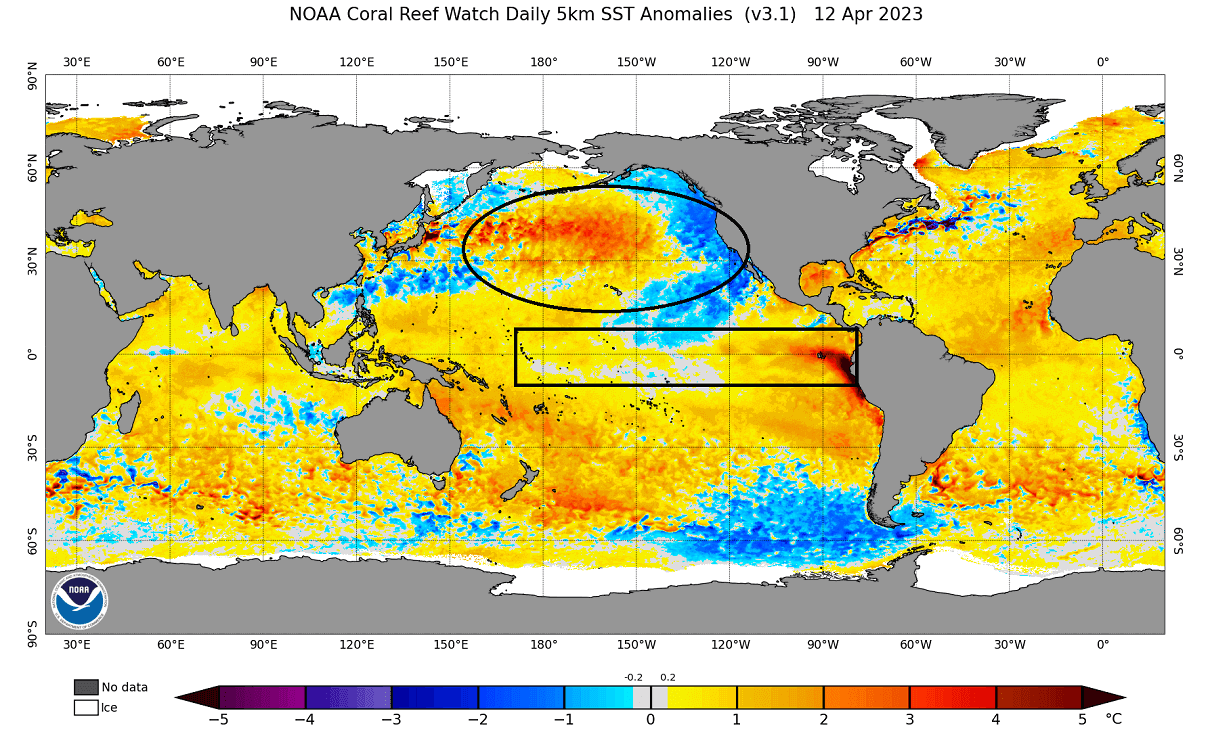
The latest global ocean analysis below shows two main regions we watch. First are the ENSO regions, with strong warming starting in the eastern regions. Second is a relatively strong cold horseshoe pattern on the west coast of North America, associated with a negative PDO phase. Image by NOAA CRW.
Below, you can see the anomaly data from the past years across the ENSO region. You can see the extended cold ENSO phase in the past three years. But lately, the temperatures have risen, and we are aiming for the El Nino threshold before the Spring ends.

Looking more closely at the latest analysis of the ENSO regions below, the cold anomalies are pretty much gone. And not only that, you can see strong warm anomalies are now entering the eastern parts of the ENSO regions.
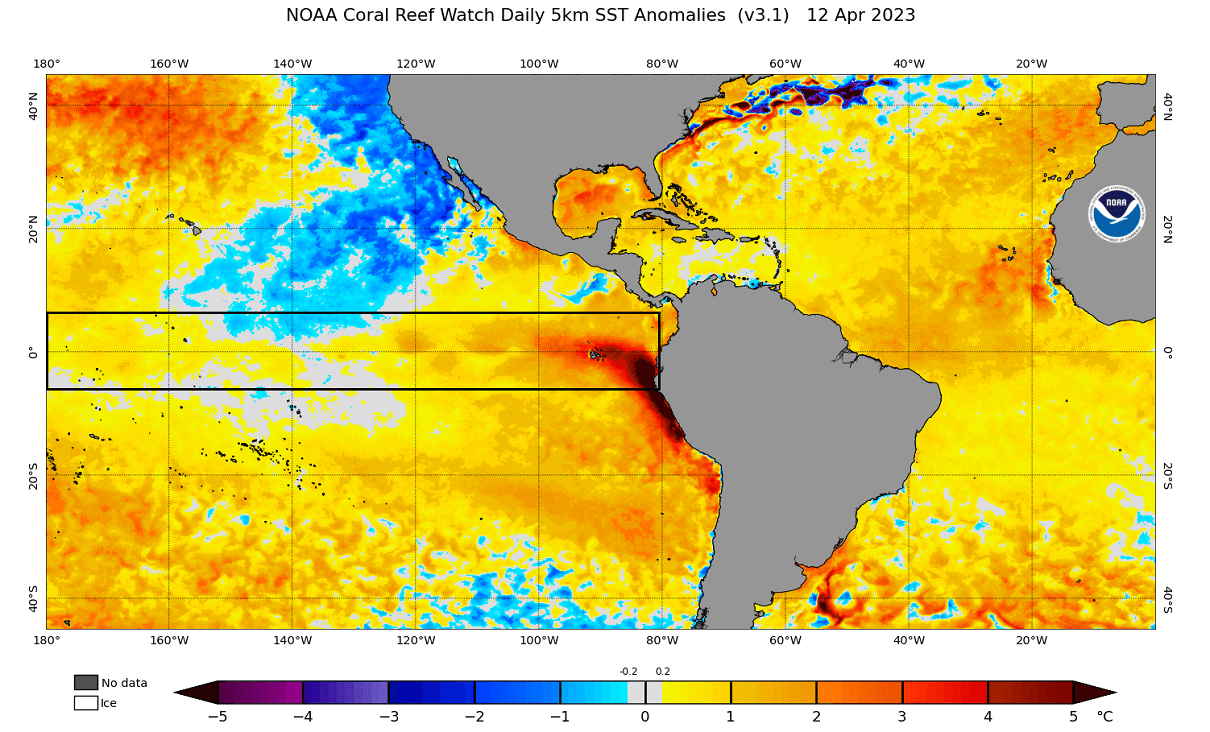
Below we have the latest 7-day ocean temperature change, where you can see the rapid warming trend in the east even better. The warming trend is also present across most ENSO regions, indicating a rapid shift from a cold into a warm phase.

Focusing more on the eastern ENSO regions, you can see that the temperatures are in alert levels 1 and 2 over the region. This is used to monitor coral bleaching events and to track ocean warming and emerging warm zones.

Another useful parameter is the degree heating weeks (DHW). In this context, we can use it to track sustained sub-seasonal conditions in ocean temperatures. And here, it shows a strong sustained warm zone in the far eastern ENSO regions, now expanding across the equator.
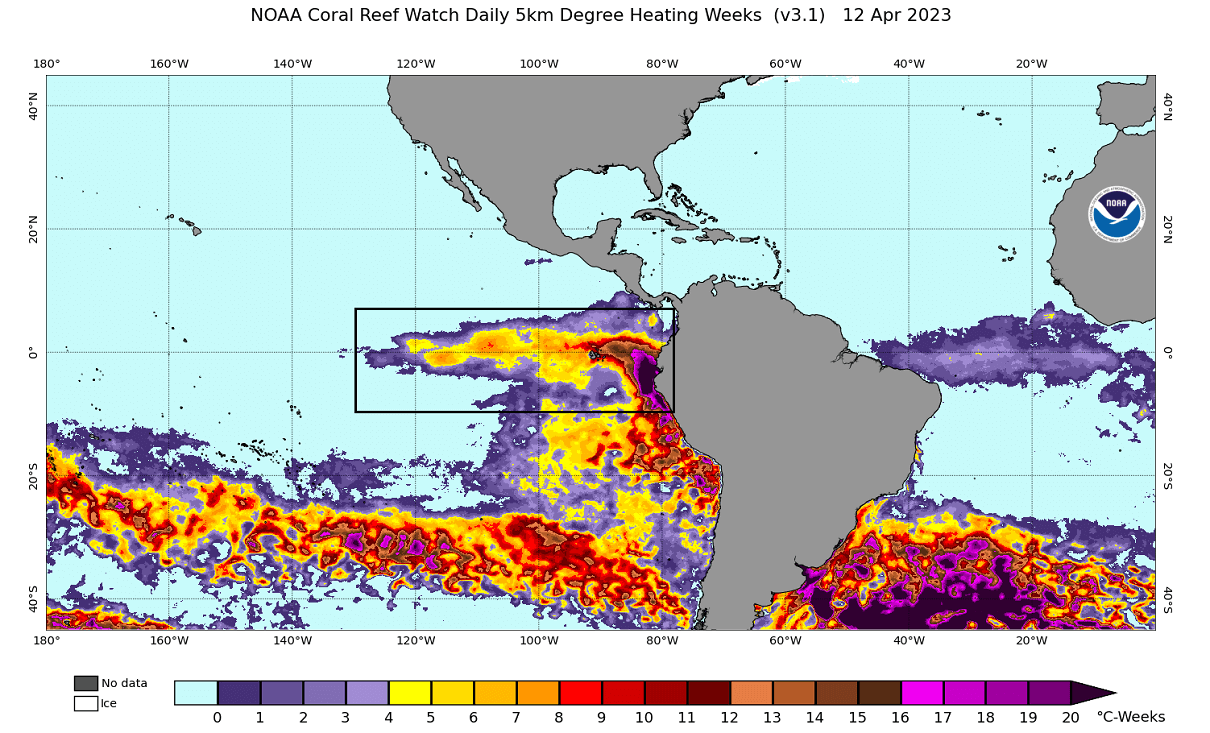
But there is also one more important thing about these far eastern regions. They can sometimes indicate what to expect from the main ENSO regions.
WEATHER STARTS IN REGIONS 1 AND 2
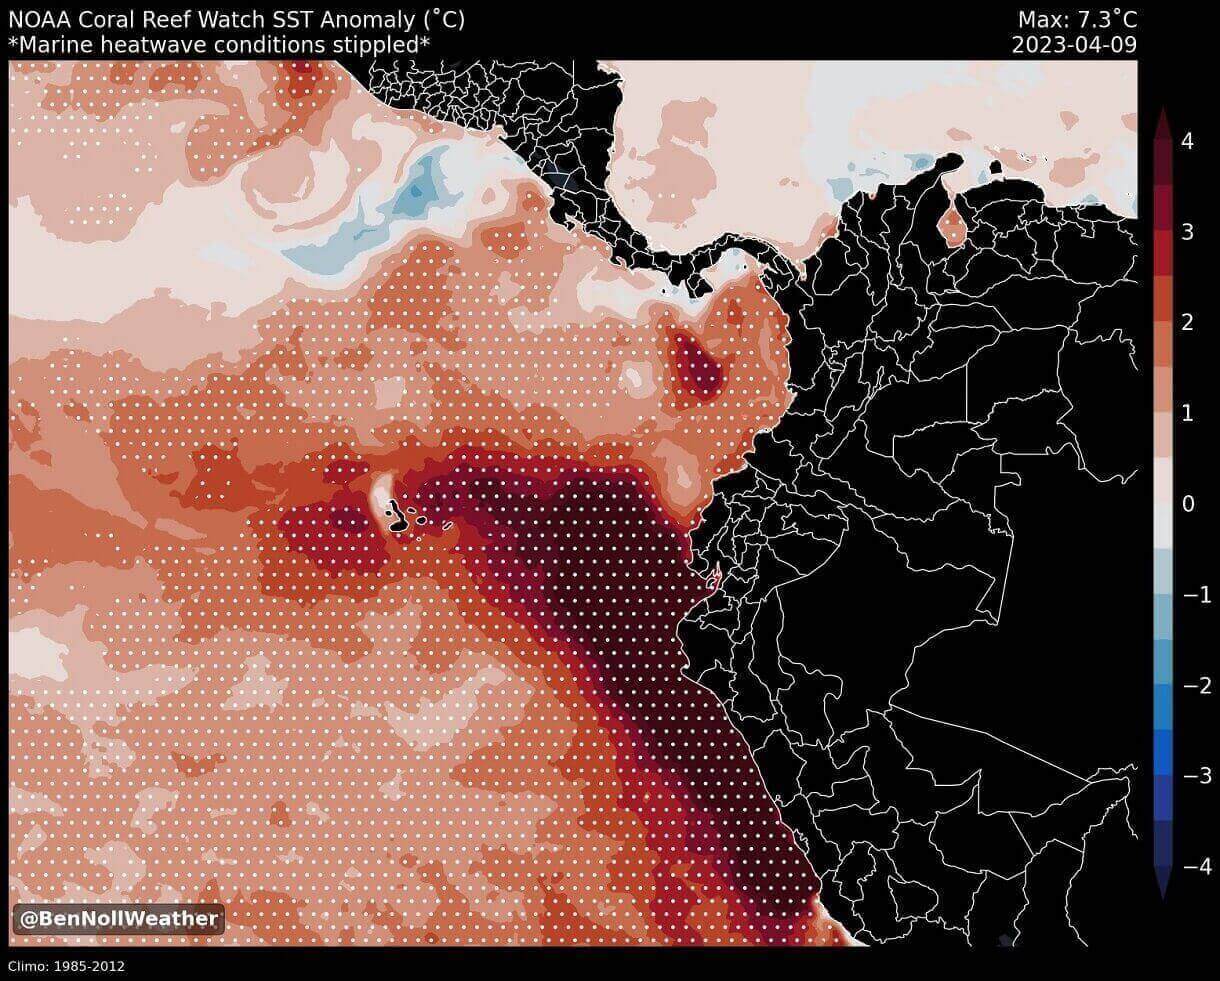
Looking closer at the far eastern regions (1+2), you can see the strong anomalies in the image below. Peak anomalies are in the range of 6 to 7 degrees Celsius above normal, which is a lot. Image by Ben Noll.
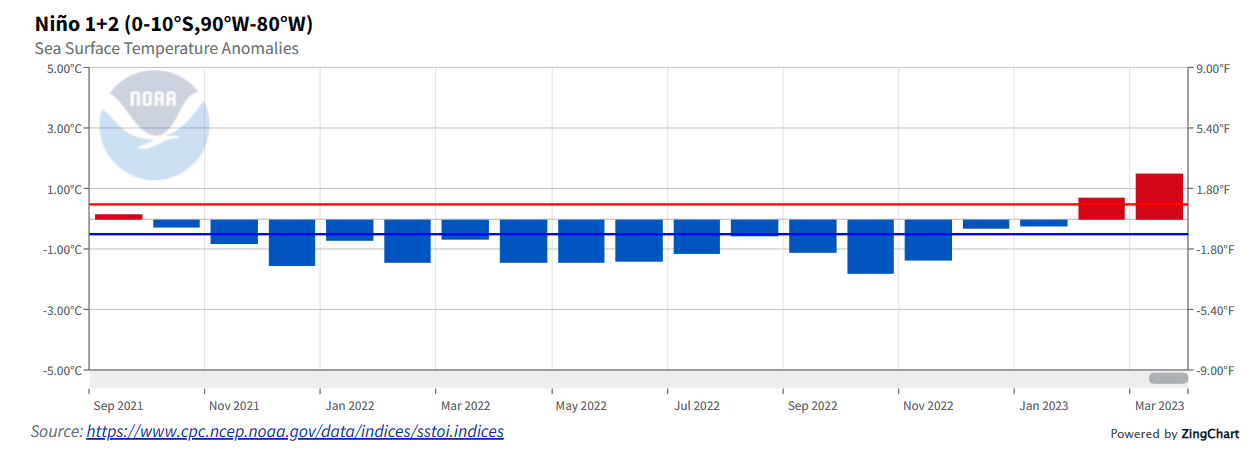
Below is the NOAA monthly analysis of the far eastern ENSO regions. You can see a rapid temperature anomaly increase in March that continues into April. This comes after a prolonged cold phase.
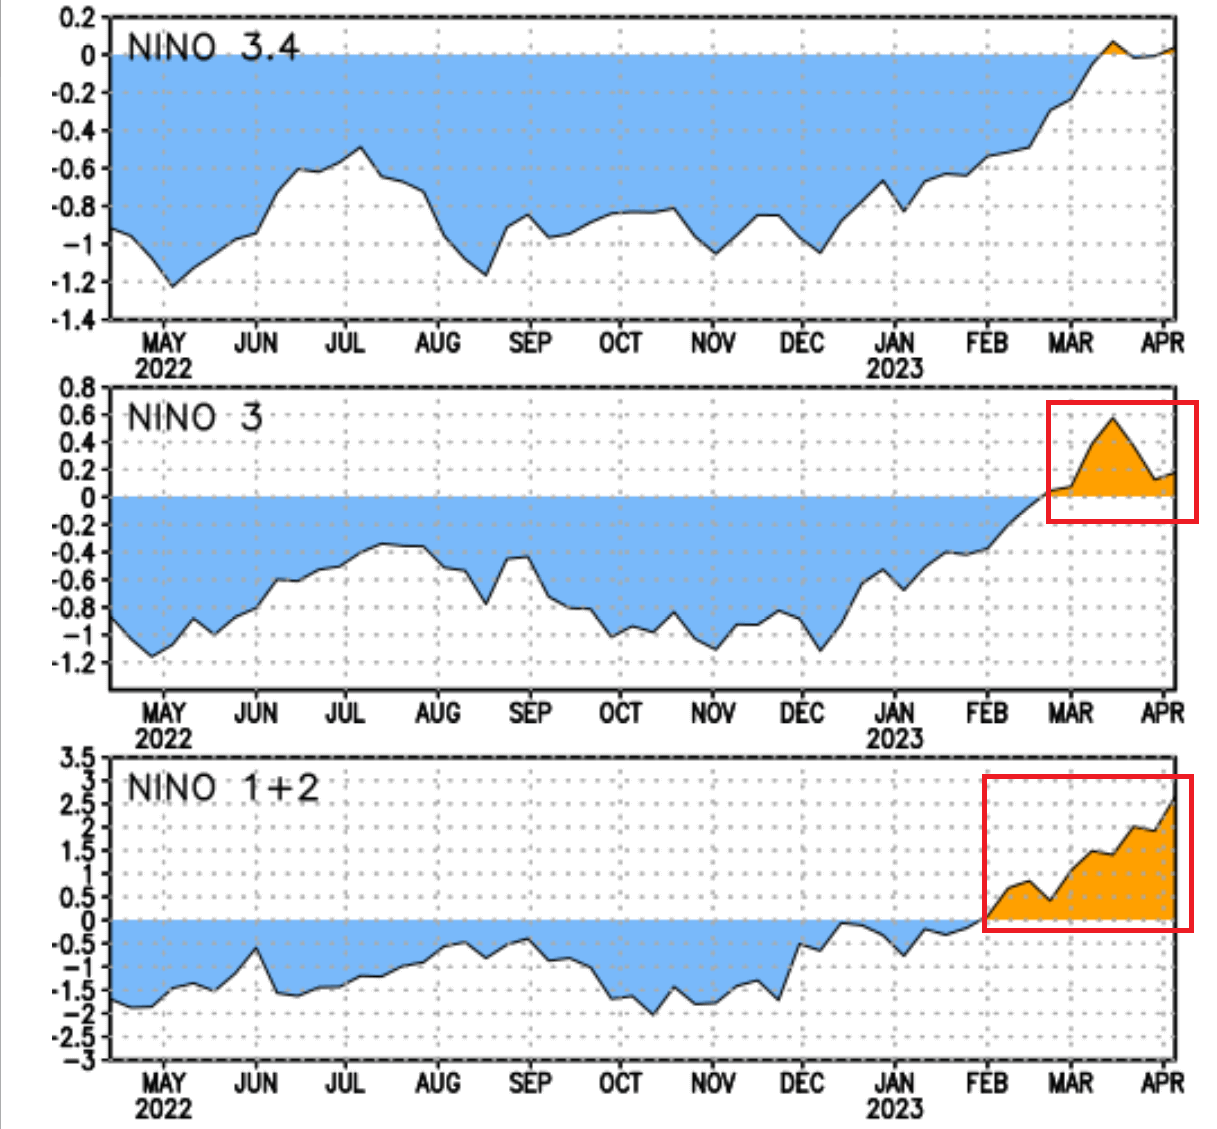
Looking at the main ENSO phases, you can see the rapid warming trend in regions 1 and 2. Central region 3.4 also follows behind, with eastern region 3 already well in the warm anomalies.
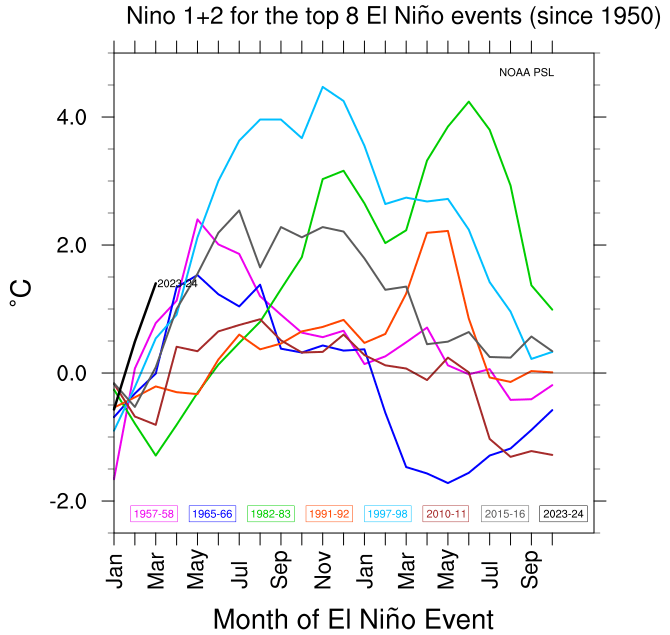
This is important because, in many historical cases, the far eastern regions 1 and 2 were somewhat of an indicator of the overall strength of the incoming El Nino. For example, that can be seen in the NOAA PSL image below, where strong anomalies in the 1+2 regions preceded the stronger El Nino events.
EL NINO 2023 FORECAST
Below you can see the ensemble forecast for the 1+2 ENSO regions. Again, a rapid rise in temperatures is seen, with the anomaly forecast ranging between 2 and 4 degrees above normal. Based on historical data, this signals that a strong El Nino event could be in the works.

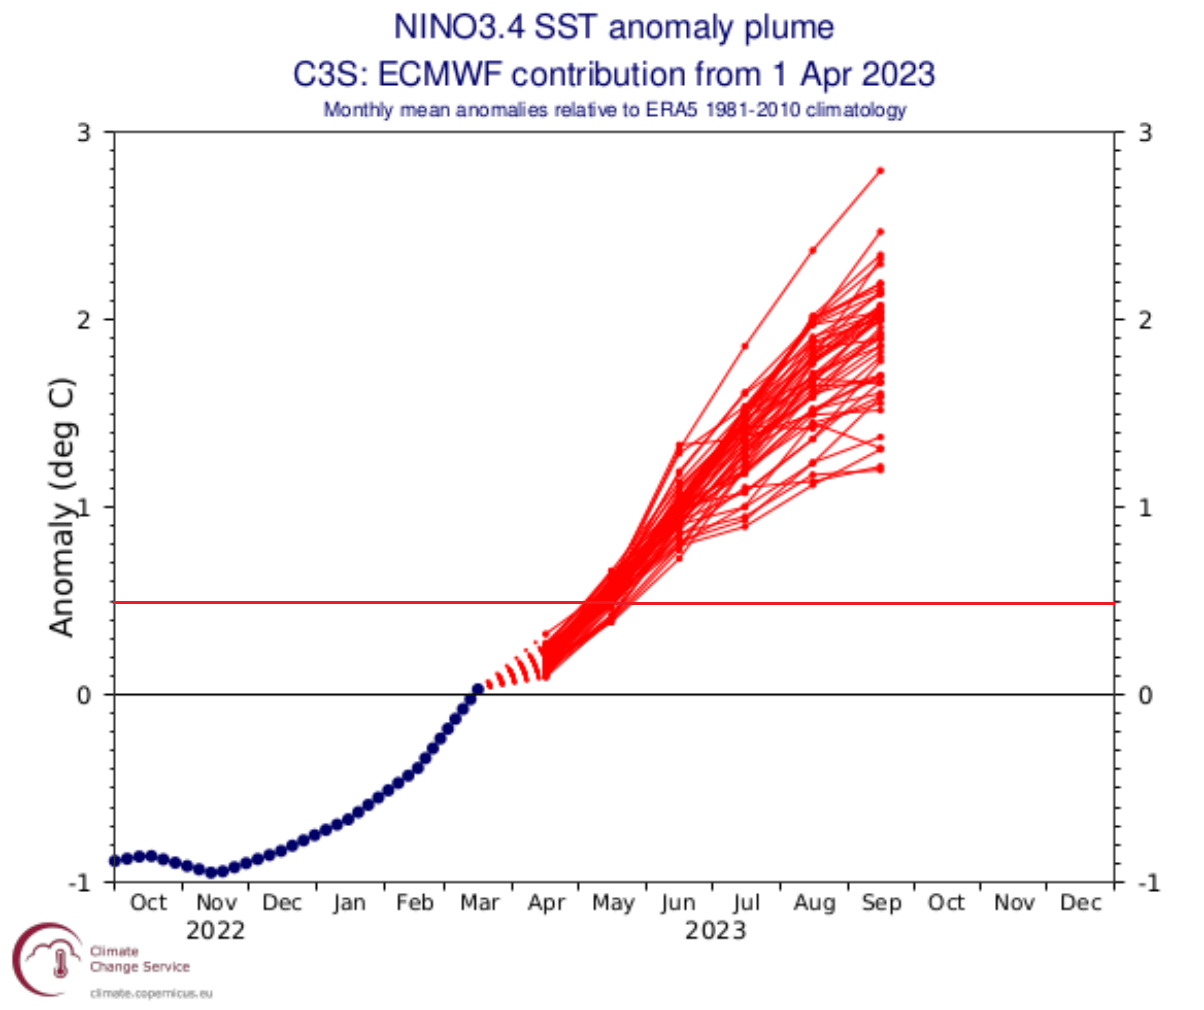
And below, you can look at the latest seasonal forecast for the main ENSO region. The ECMWF forecast takes it close to the 2 degrees above normal range by Fall, which is considered a strong El Nino event. The stronger the event is, the stronger its seasonal weather impact is.
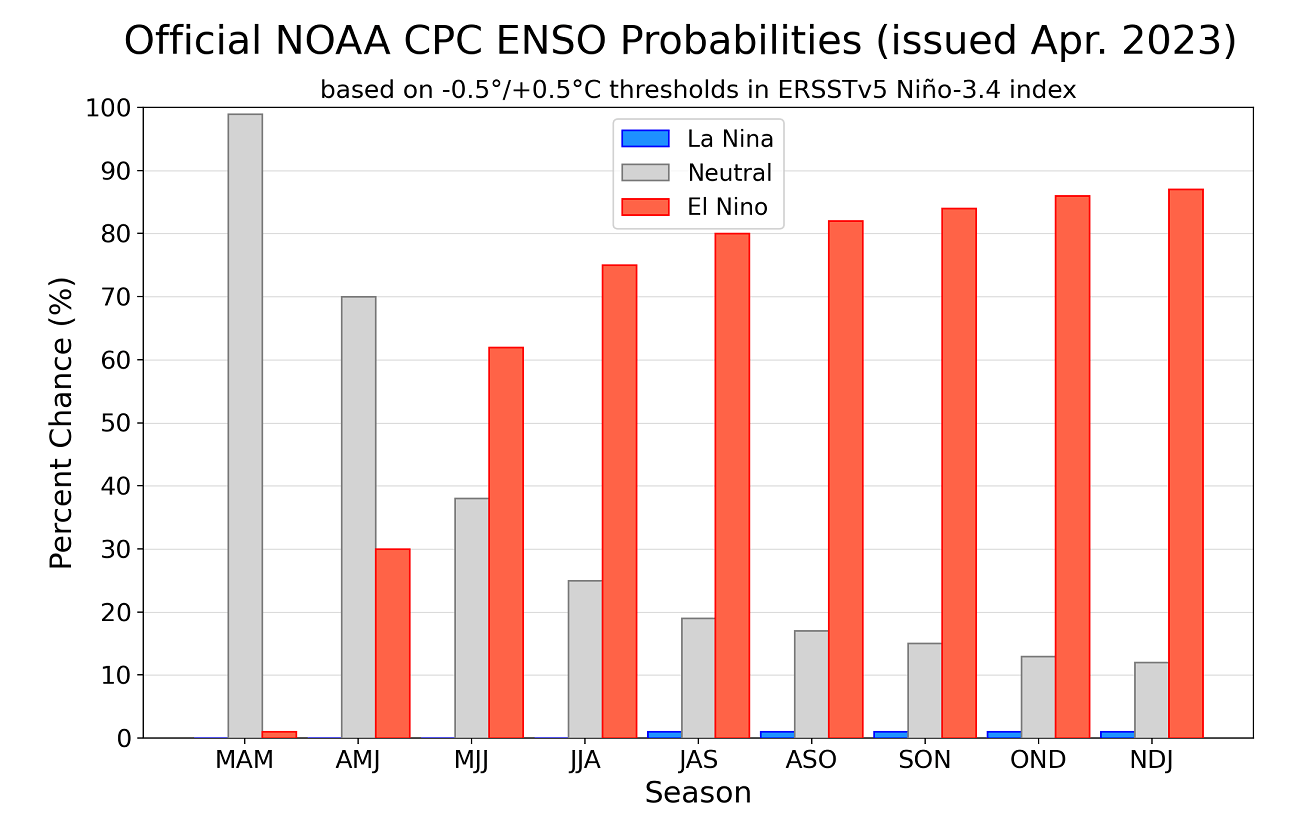
The IRI official probabilistic ENSO forecast has shifted into full El Nino mode, already giving a full El Nino state by Summer 2023. The event will likely continue at least over the 2023/2024 Winter season.
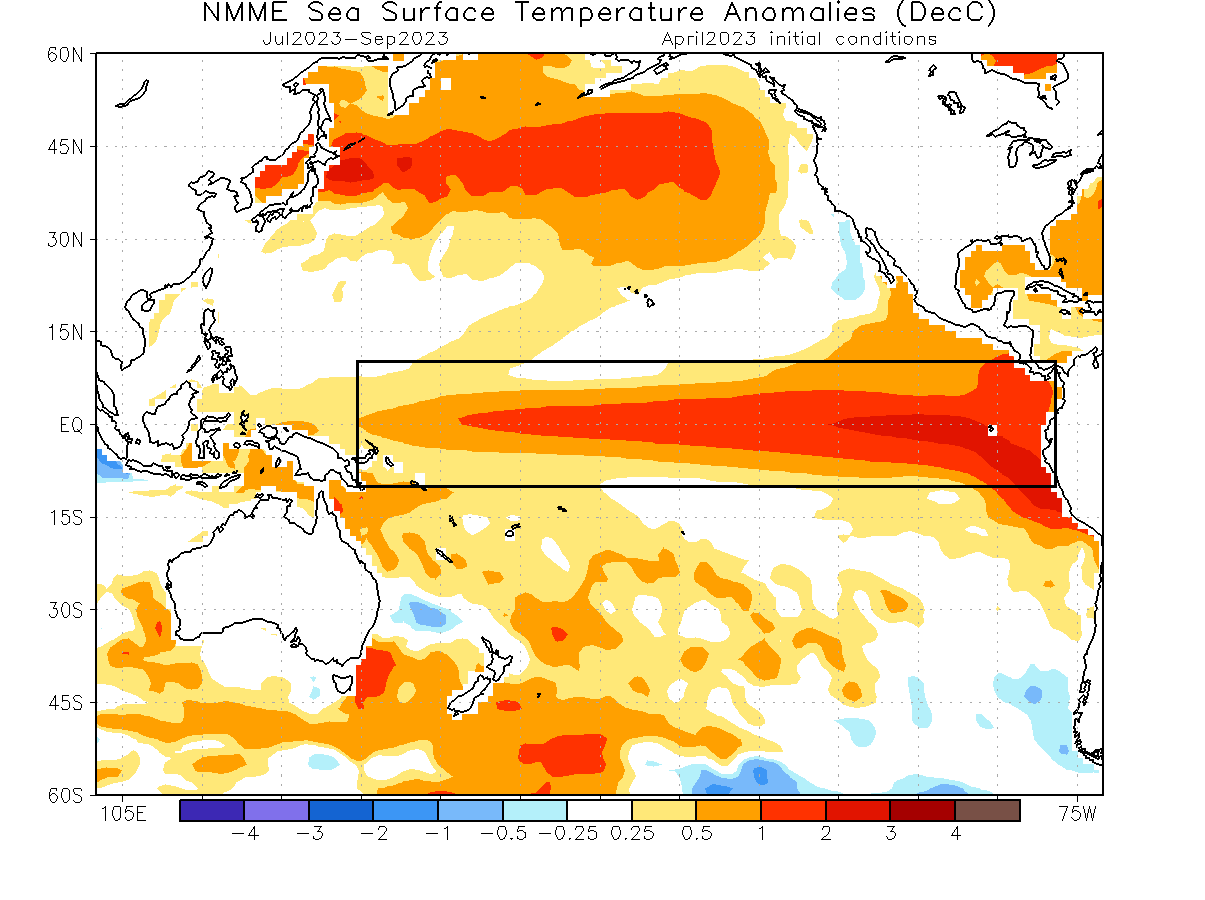
Looking at the late Summer ocean forecast by the ECMWF, you can see a strong El Nino event expanding across the entire tropical Pacific. The cold ocean anomalies along the west coast of the United States are also gone in this forecast.

The North American multi-model ensemble forecast (NMME) also shows the same anomalies developing over Summer. It is actually showing the exact temperature anomaly pattern and strength as the ECMWF, giving both forecasts good confidence.
Also, looking at the subsurface forecast below by the CFS, we can see a strong warm pool taking over the tropical Pacific regions over the Summer. This signals a very healthy El Nino event, lasting over the Winter season and could extend into the Spring of 2024.
But before we get to the Winter, the El Nino event will also influence the Atlantic Hurricane season, which might actually be in a good way.
ENSO AND THE HURRICANE SEASON
Based on the available data, it is well known that an El Nino event reduces the number of Hurricanes and tropical systems overall in the Atlantic. The reason is stronger wind shear, preventing the storms from organizing and powering up.
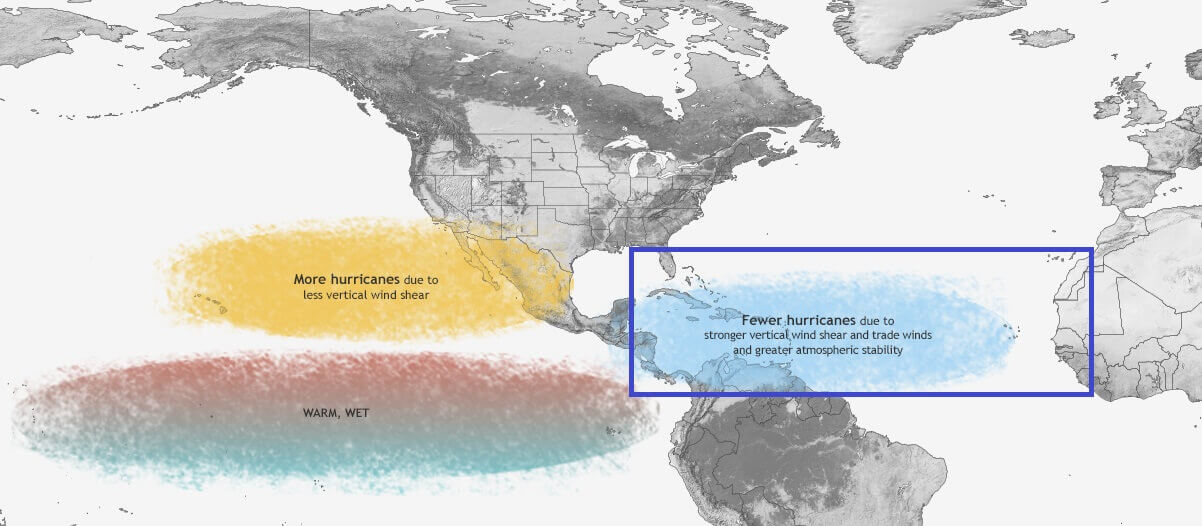
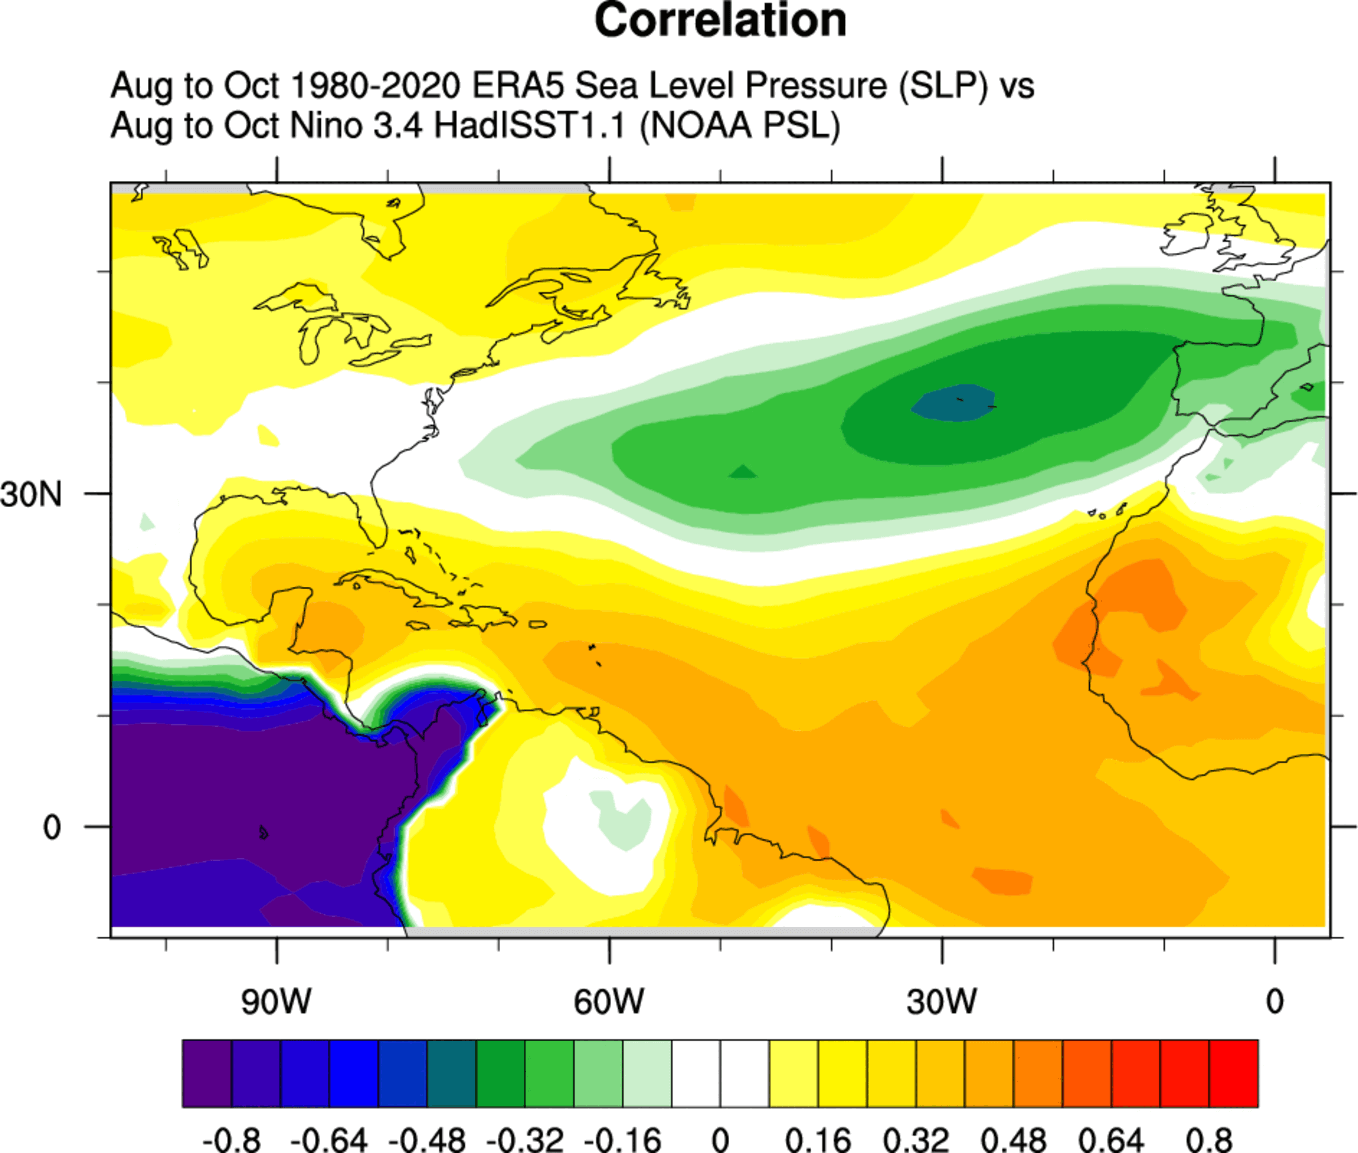
We produced a historical re-analysis of pressure trends during an El Nino event. As you can see, there is mostly higher pressure across the tropical Atlantic, right in the main development region of tropical systems.
Also, looking at precipitation, you can see much drier trends across most of the tropical storm regions. During an El Nino hurricane season, the Gulf of Mexico, the Caribbean, and most of the tropical Atlantic are drier than normal.
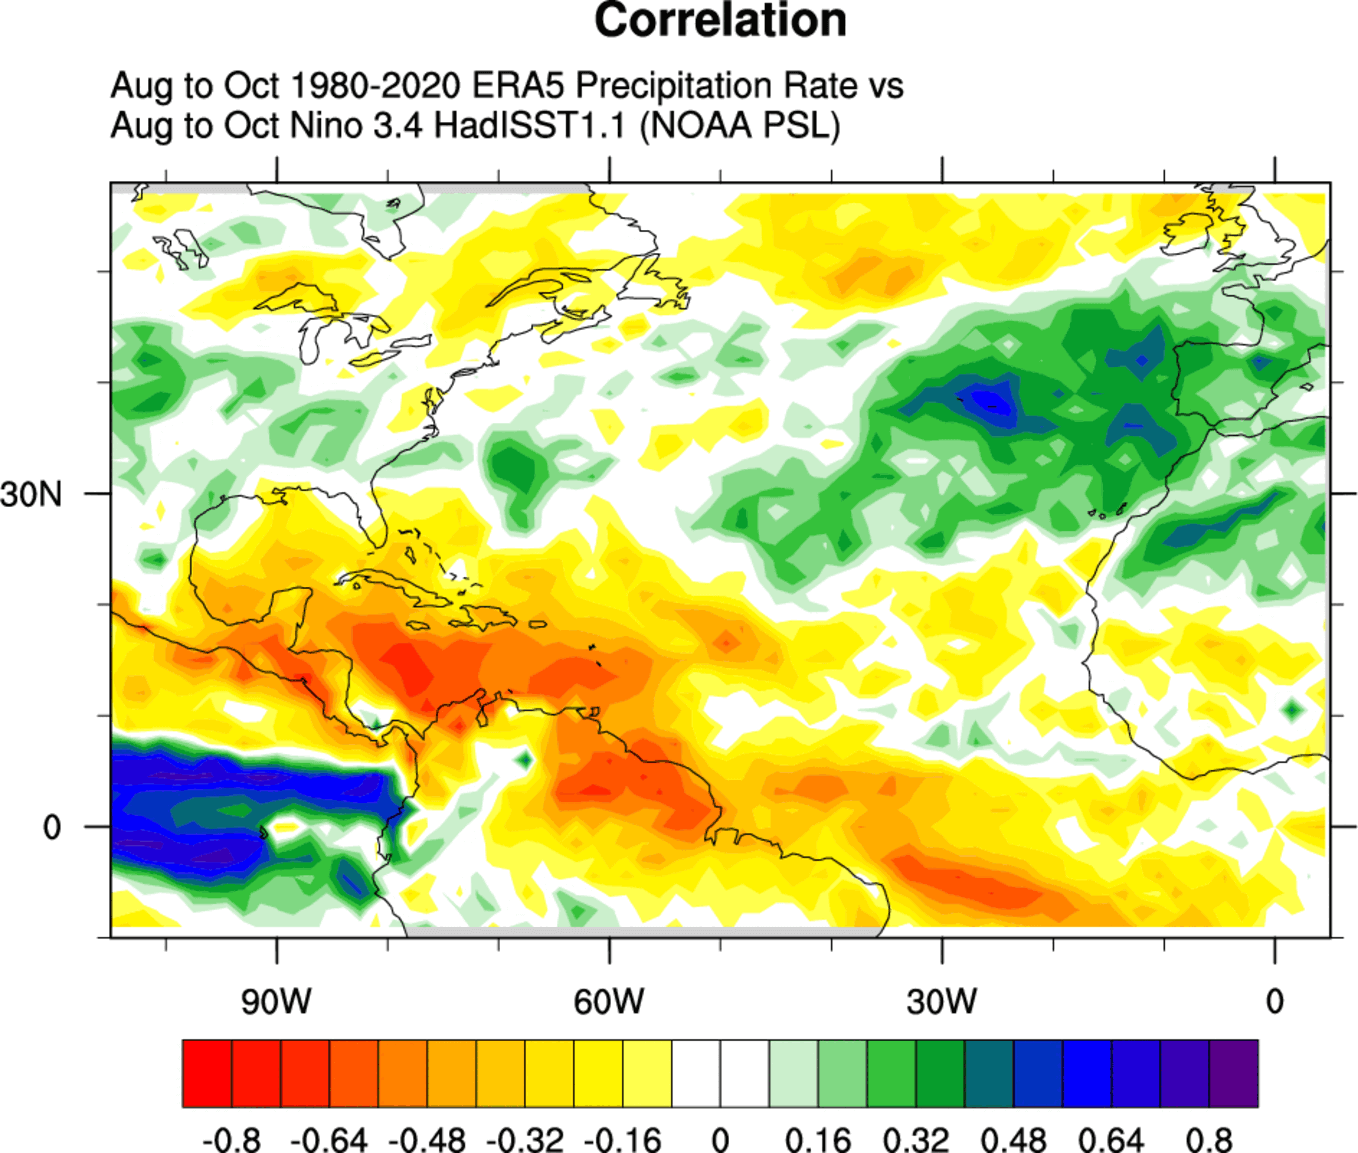
This is mostly a result of higher pressure and more stable conditions across the board. This means fewer tropical storms and weaker systems. So an El Nino can greatly reduce the chance of a strong hurricane impacting the United States.
But, this still does not mean that no storm can reach the coast of the United States. The number of storms is lower, as is their strength. But only one storm is enough to do major damage to the coastal areas.
EL NINO WINTER WEATHER PATTERNS
During the El Nino winter season, there is typically a strong and persistent low-pressure area in the North Pacific. That pushes the polar jet stream further north, bringing warmer-than-normal temperatures to the northern United States and western Canada.
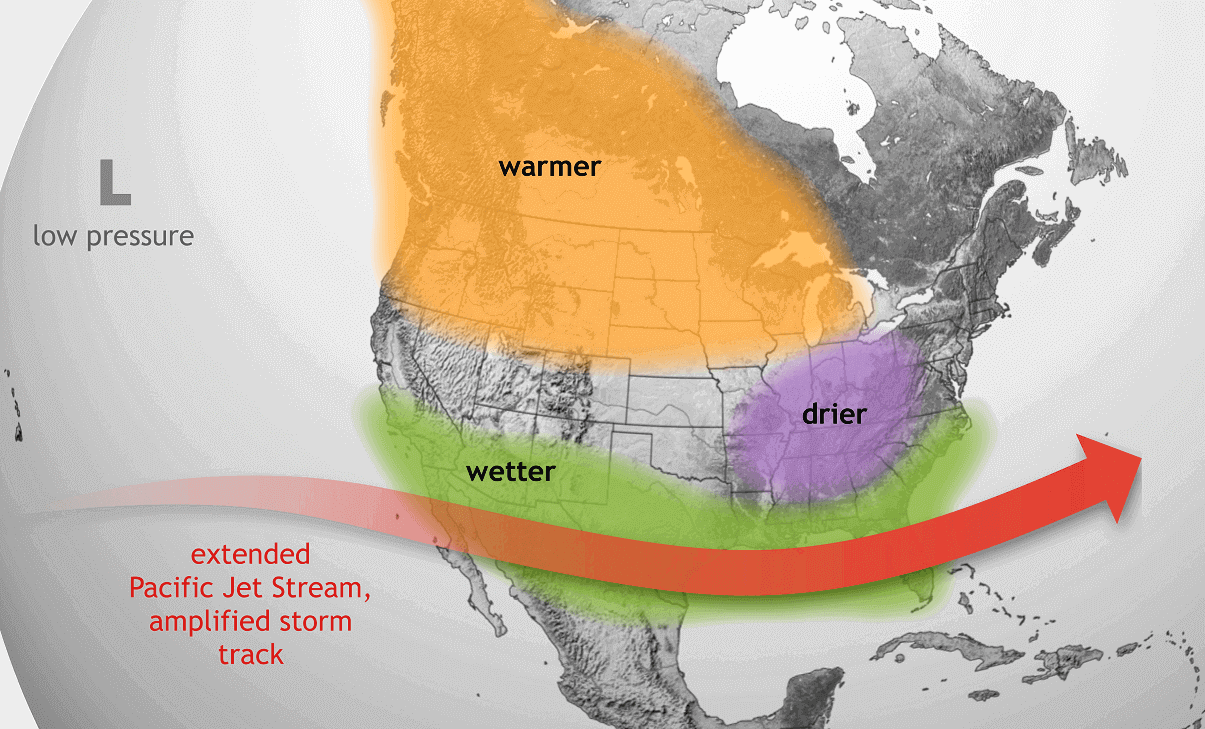
But the southerly Pacific jet stream is amplified during an El Nino, bringing storms with lots of precipitation and cooler weather to the southern United States.
The image below shows the average winter pressure pattern for El Nino winters during the satellite era. You can see the strong low-pressure area in the North Pacific, typical for an El Nino. A high-pressure zone is focused over Canada, with a low-pressure storm track and precipitation spanning the southern United States.

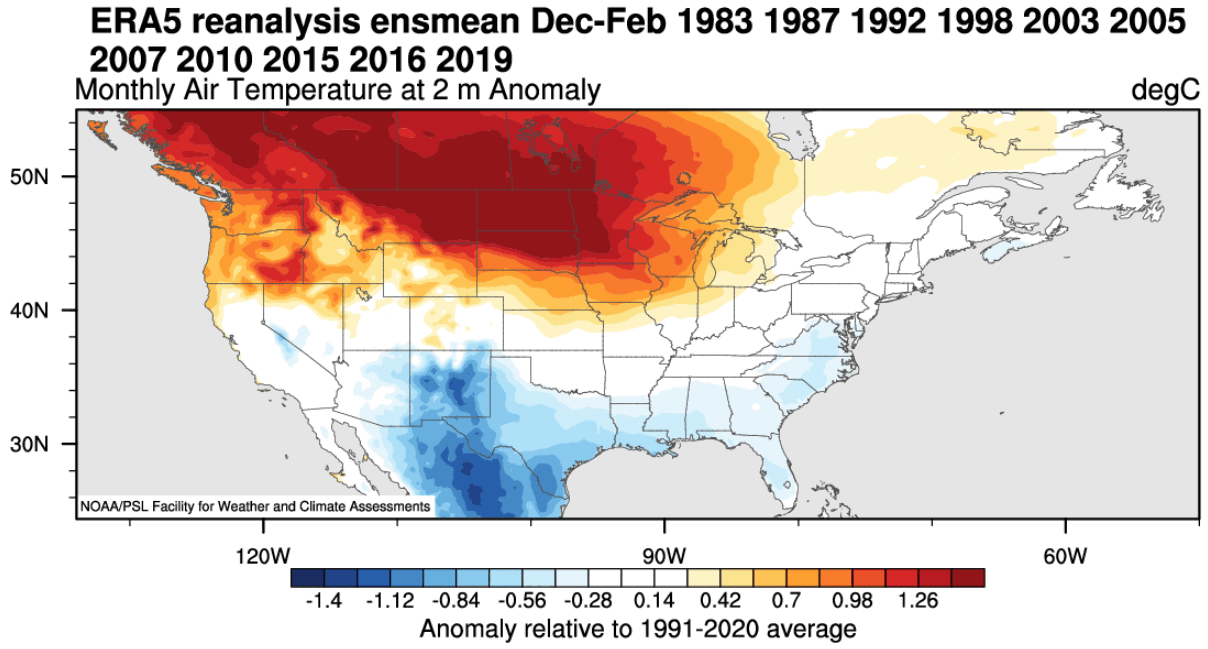
Below are temperature anomalies for the same winters. You can see the average El Nino winter having colder temperatures in the southern half of the United States and parts of the eastern United States. The northern half of the country is warmer than usual, with the anomalies spreading into southern Canada.
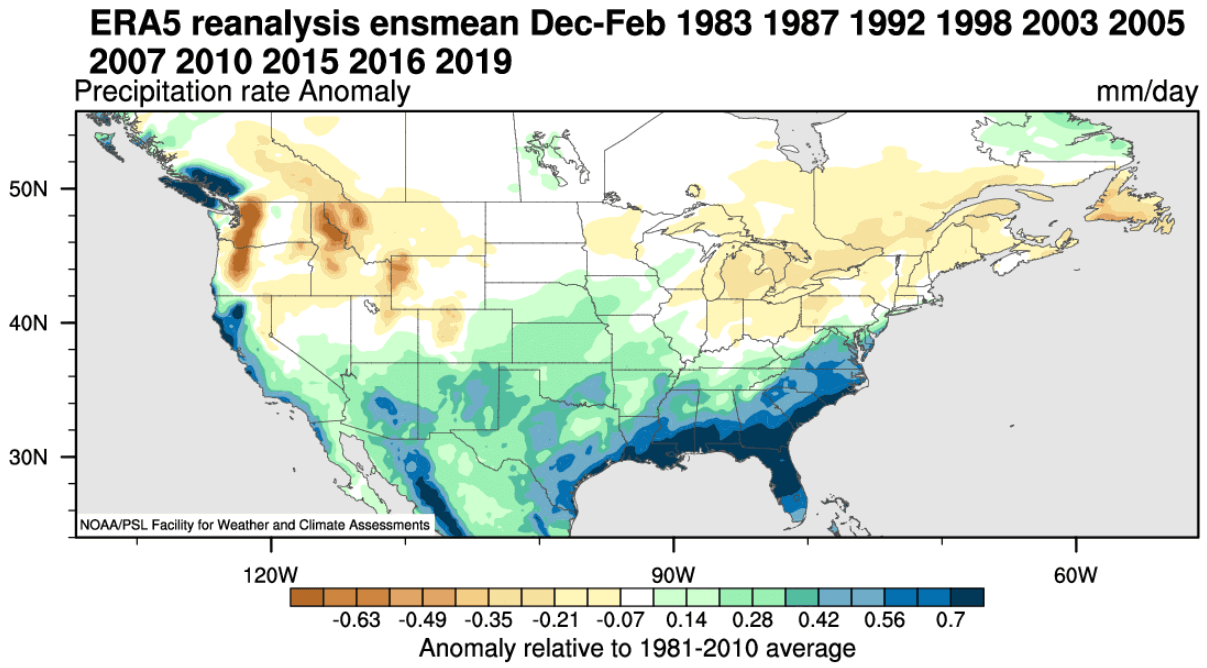
Precipitation-wise, an average El Nino winter brings more precipitation to the southern half of the United States, especially in the southeast, due to the stronger subtropical jet stream. However, drier winter conditions prevail in the northwestern United States and around the Great Lakes, opposite a La Nina’s influence.
An El Nino event also changes the snowfall patterns, as seen in the image below. There is typically less snowfall in the northern United States during the El Nino winters. But more snowfall is seen in the central and southern United States during an El Nino. And also over parts of the east.
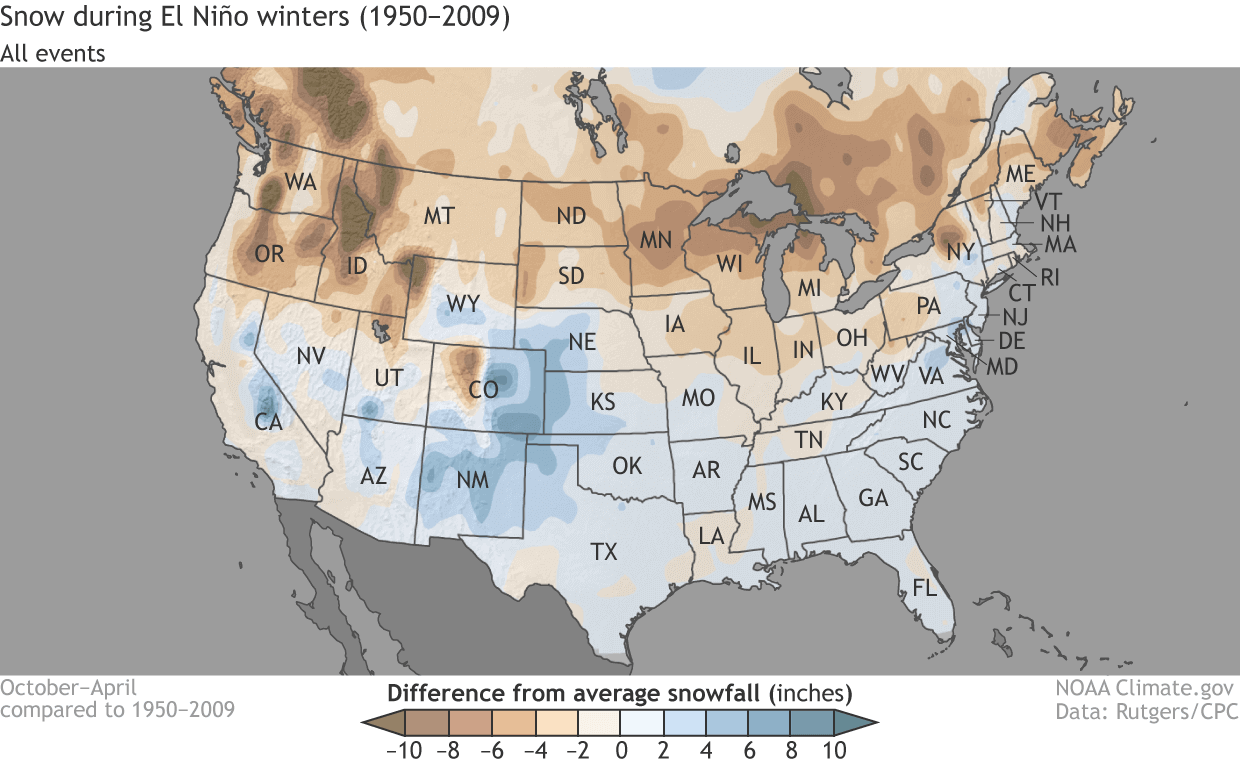
This is mainly due to low-pressure systems trailing across the southern United States. With cooler air available and more moisture, the chances of snowfall increase in the southern half of the country. But a lot depends on the availability of the cold air from the north.
After passing Canada and the United States, the jet stream moves into the North Atlantic, where it can take different paths toward Europe.
But the ENSO effects are much less direct in Europe than in North America. That is why we focus more on North America to track direct (and more predictable) weather changes.
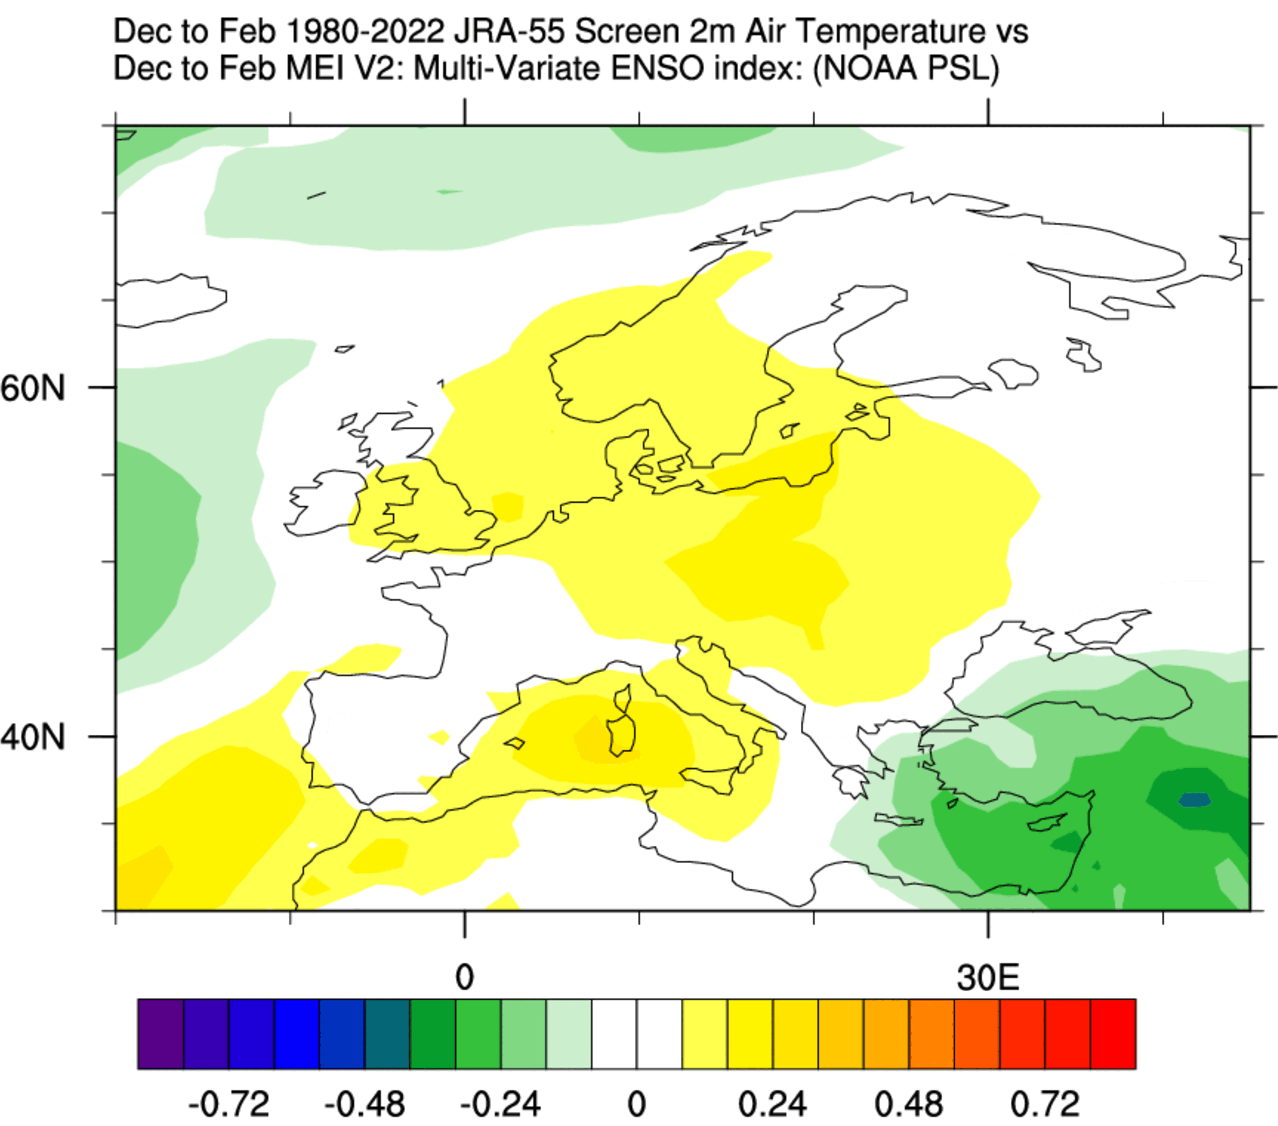
But still, looking at the historical connections of ENSO to Europe, we produced two graphics below. First is the Winter pressure anomaly signal. It shows a high-pressure tendency over most of Europe, with the subtropical ridge expanding during an El Nino winter season.

The following temperature is, of course, warmer than normal over much of the continent. But the signal has a weak strength, as the ENSO influence loses most of any direct influence this far out. So while there is a signal in the average, it cannot be used for any direct weather pattern forecasts over Europe.
As El Nino changes the weather globally, hardly a corner of the world does not feel its effect. But the weather changes in parts further away are less predictable. That is because local weather systems play a specific role, as well as other global weather drivers.
We will keep you updated on global weather development and long-range outlooks, so bookmark our page. Also, if you have seen this article in the Google App (Discover) feed, click the like (♥) button to see more of our forecasts and our latest articles on weather and nature in general.
Don’t miss: