A cold ocean anomaly is returning to the far North Atlantic, in the same region where past large-scale cooling events have appeared. Latest ocean analysis shows the cold “blob” expanding again, with forecast data suggesting it can persist into Winter 2026/2027.
This matters because the North Atlantic is not isolated from the atmosphere. Cold anomalies in this region often precede (or indicate) larger pressure and jet stream changes. And past events have been followed by a specific winter pressure anomaly pattern over North America.
At the same time, a powerful Super El Niño is developing in the tropical Pacific, adding a much stronger global forcing into the seasonal pattern. Together, the Atlantic cold blob and Super El Niño signals are already giving strong early hints for Winter 2026/2027 pressure and temperature across the United States, Canada, and Europe.
Atlantic System: The Ocean Currents and Weather
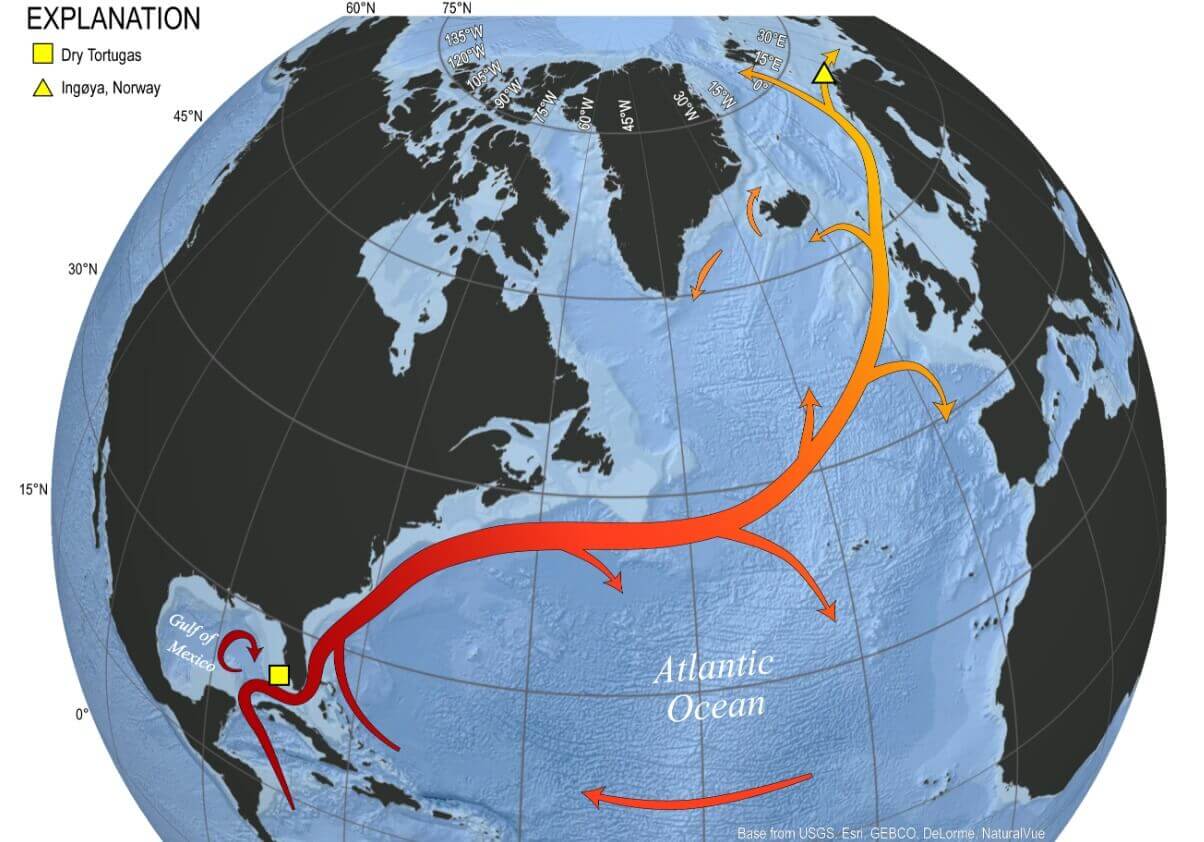
The North Atlantic Ocean currents are a part of a large system called AMOC. This powerful ocean system brings warmer waters up from the tropics into the North Atlantic Ocean and is also known as the Gulf Stream in its middle part. It extends all the way up the eastern coast of the United States, where it turns towards the northeast and flows all the way to the Polar Circle.
The image below shows a general outline of the Atlantic Ocean current and its flow across the North Atlantic. The cold anomaly areas that we usually observe develop in the northern parts, inside or around the subpolar gyre area, east of Newfoundland.
This strong current of warm water has a direct influence on the climate in the eastern United States and Europe. For example, it keeps temperatures warmer in the winter and cooler in the summer across the entire East Coast, more notable in the state of Florida.
This ocean current system is a key part of the weather and climate in the Northern Hemisphere. It transports a huge amount of warm water and energy from the tropics to the north. But in recent years, all data indicates that the AMOC system is slowing down or collapsing.
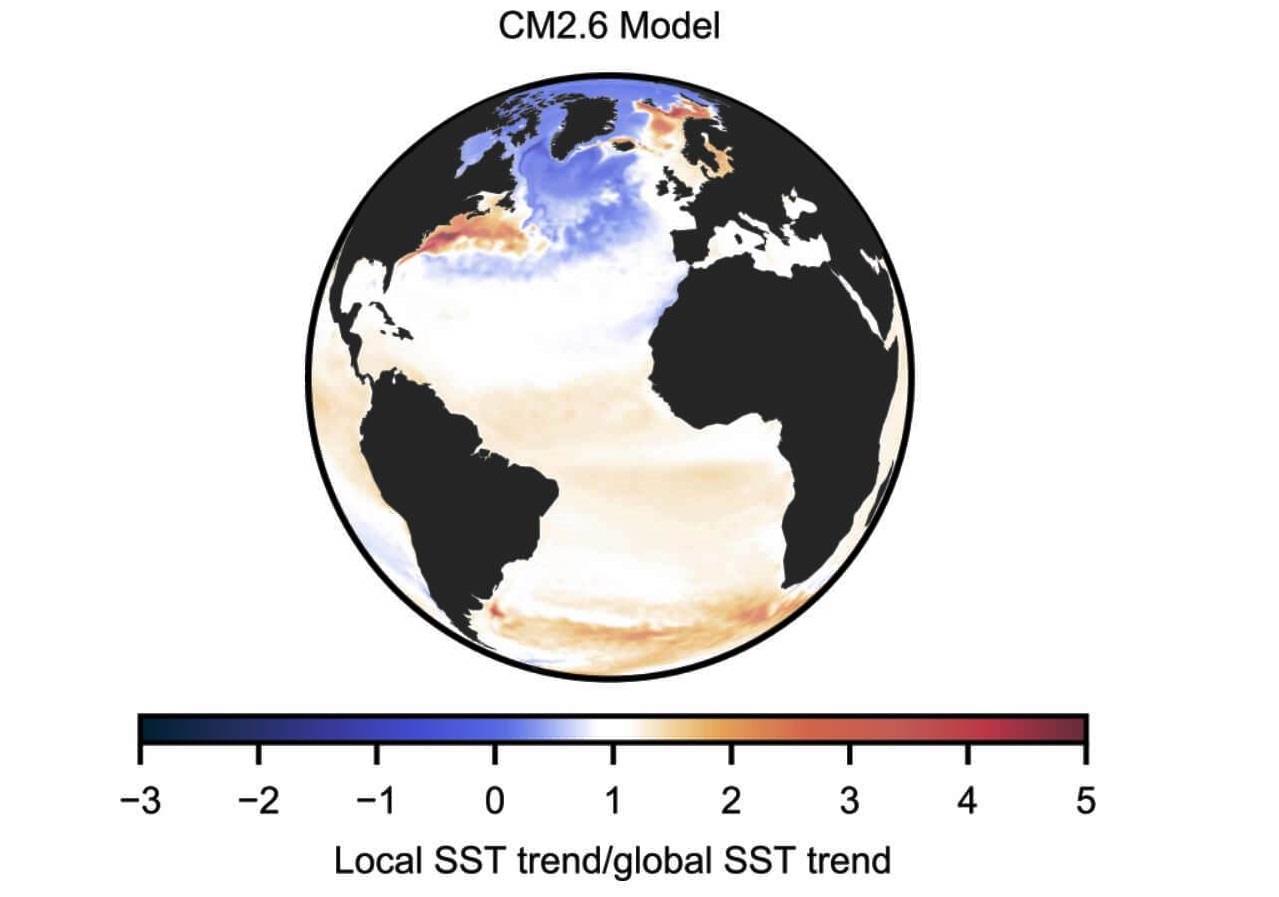
The image below is a computer model simulation that shows what would happen if the AMOC were to weaken. We can see the warming of the ocean region along the east coast of the United States and strong cooling of the North Atlantic.
If we look at the actual observation image below, it shows the real ocean temperature trends over time. It looks nearly identical to the model simulation of a weakening AMOC. This supports the fact that the AMOC is indeed weakening, even faster than first anticipated.
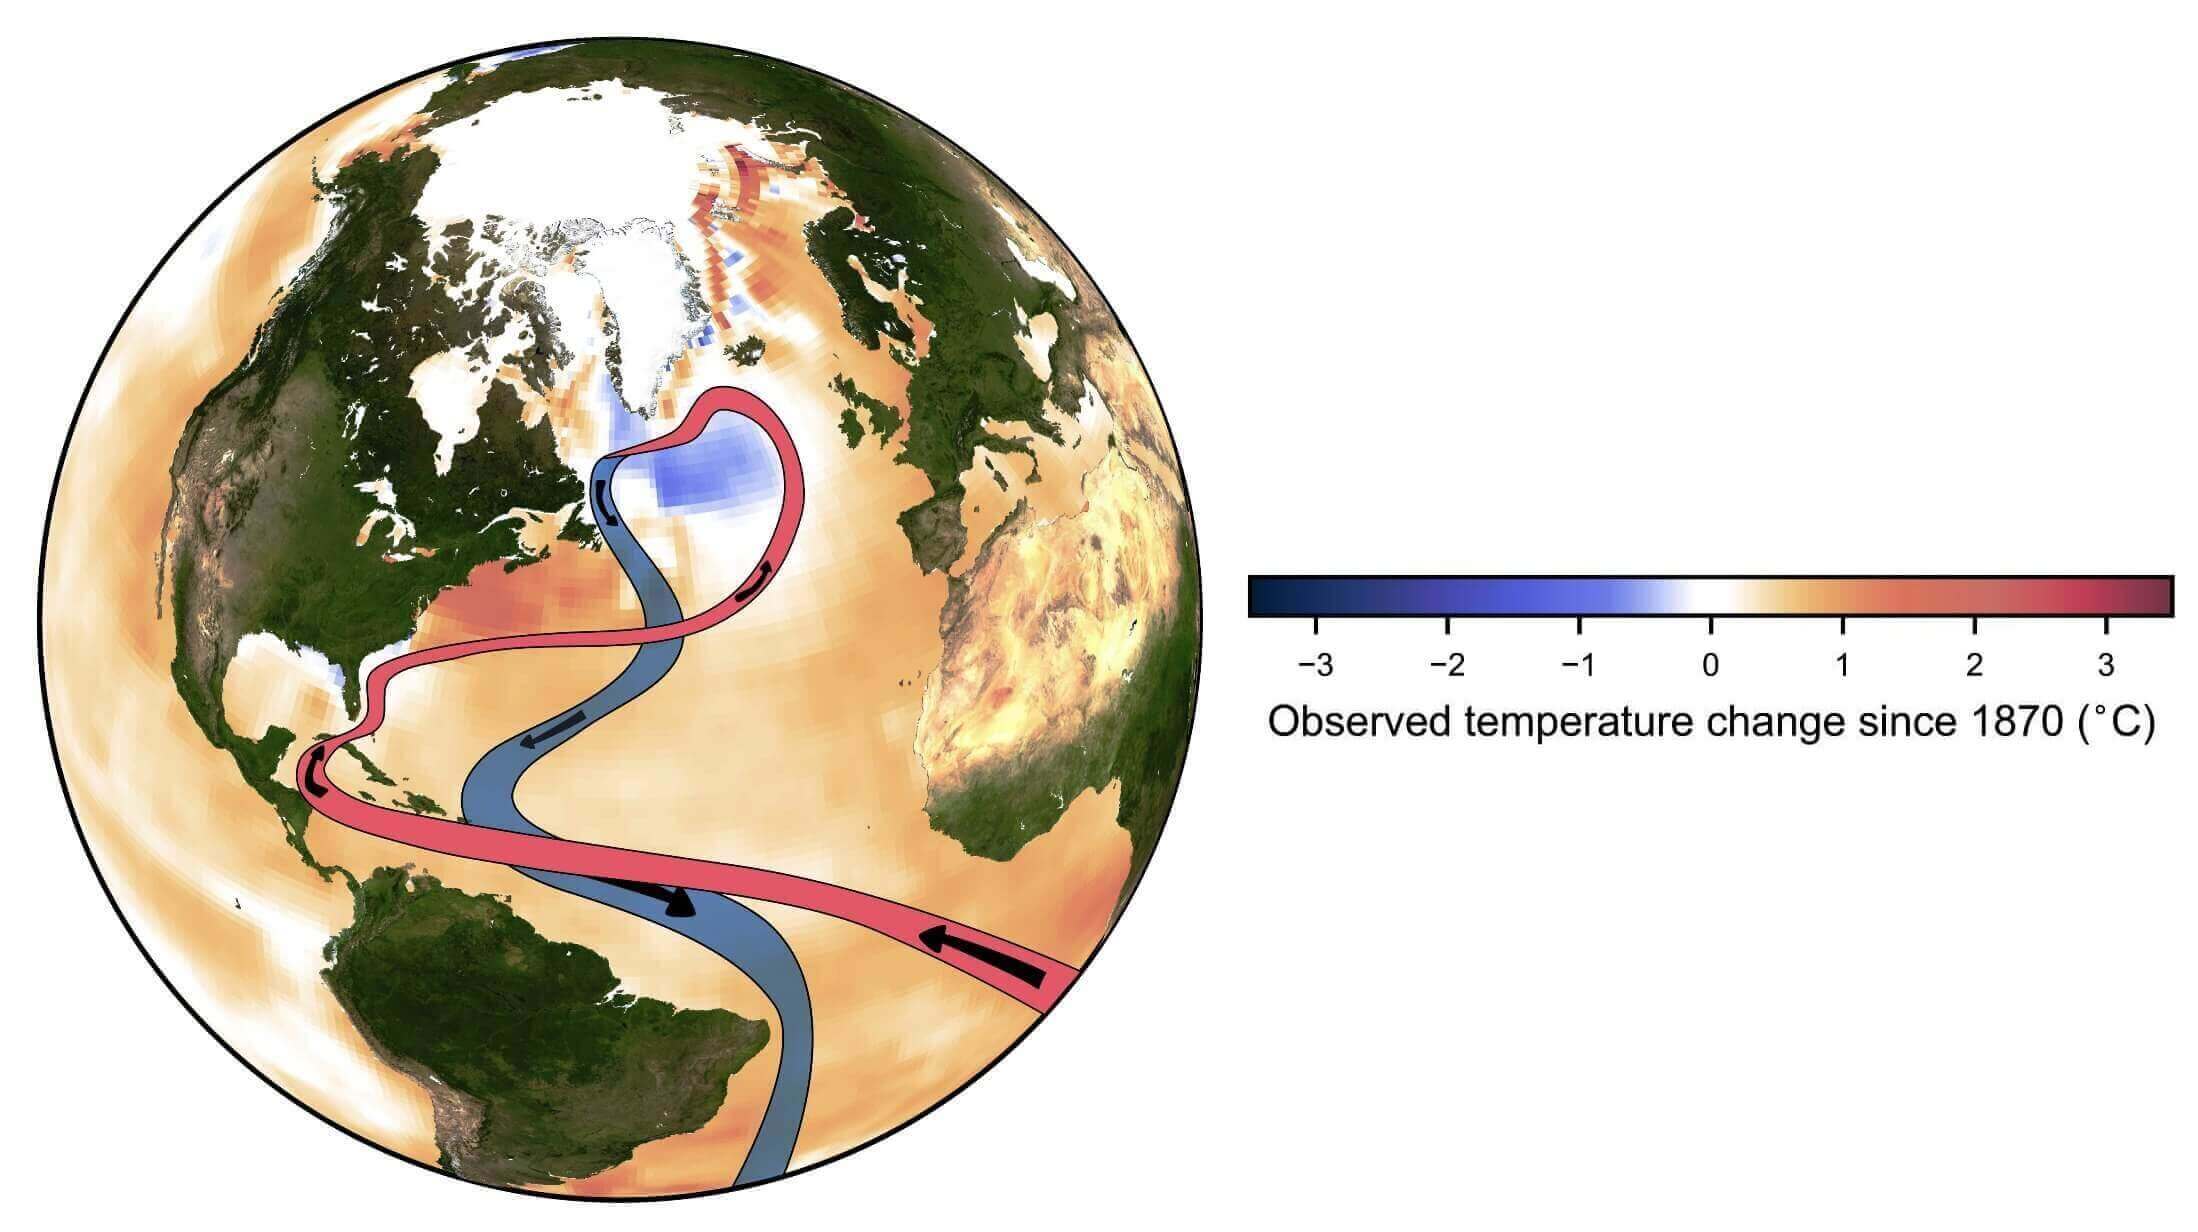
This temperature signature of the warm Gulf Stream area and cold North Atlantic is one of the strongest indicators of the AMOC weakening. Instrumental direct observations have also objectively confirmed that the North Atlantic circulation is indeed on the decline.
This brings us to the present day, where we are observing a new cooling trend in the northern Atlantic. Data shows the formation and growth of a new “cold blob” pattern, forecast to last into 2027. And yes, the “cold blob” name is actually often used by scientists and is also found in media and scientific literature.
Cold Blob Returns: North Atlantic Anomaly Grows Larger
As indicated by the trend, the cooling usually occurs in the northern parts of the Atlantic, in the area where the ocean currents start to sink. But as the cold anomalies are closer to the surface, the cooling is also related to persistent weather patterns.
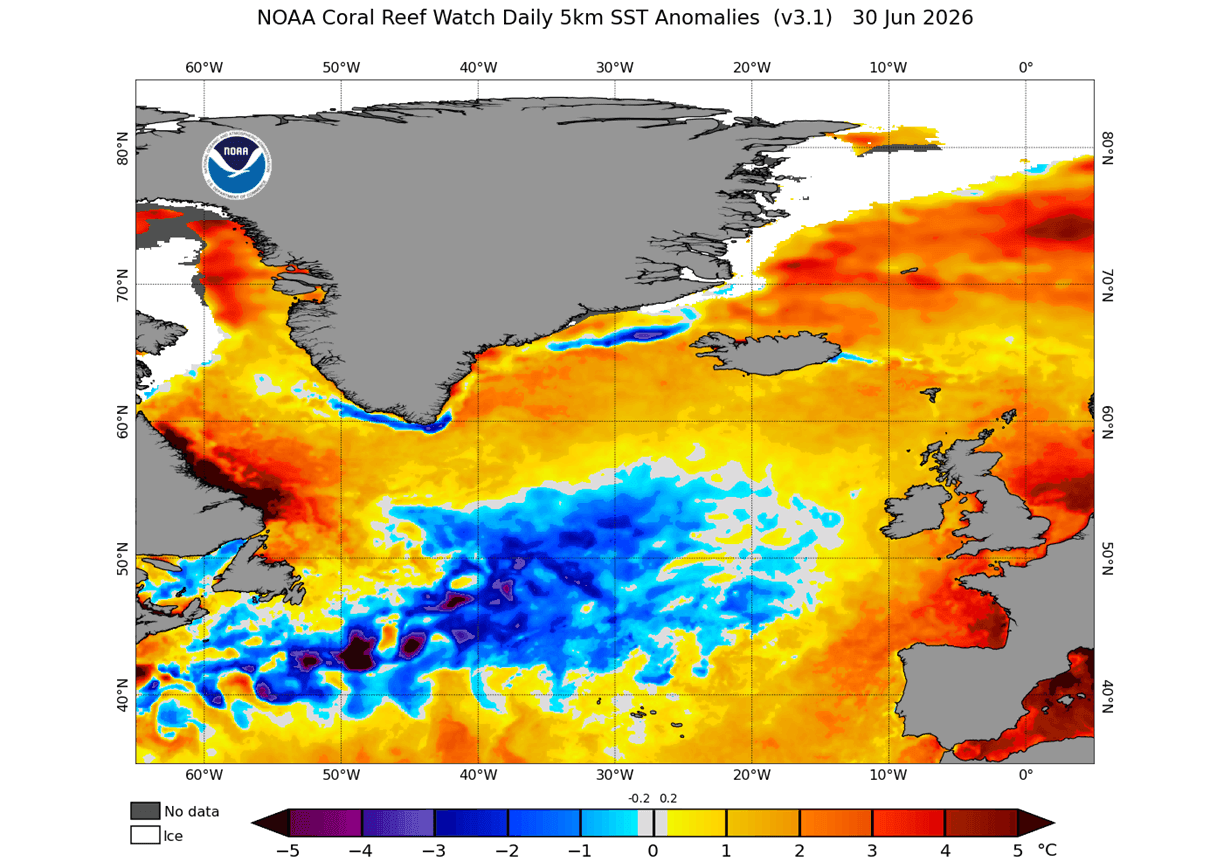
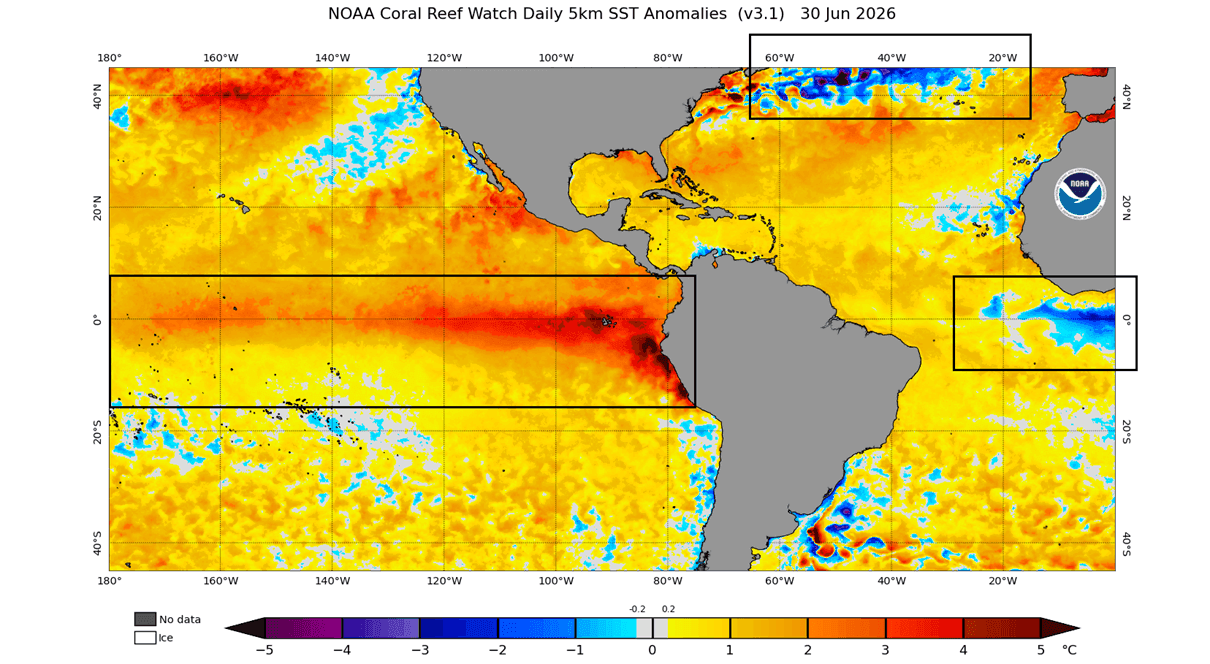
Below is the latest surface temperature anomaly of the far North Atlantic by NOAA CRW. You can see a very clear cold ocean anomaly, stretching back towards the Gulf Stream area. This anomaly is much larger than last year, continuing the long-term cooling trend of the subpolar North Atlantic.
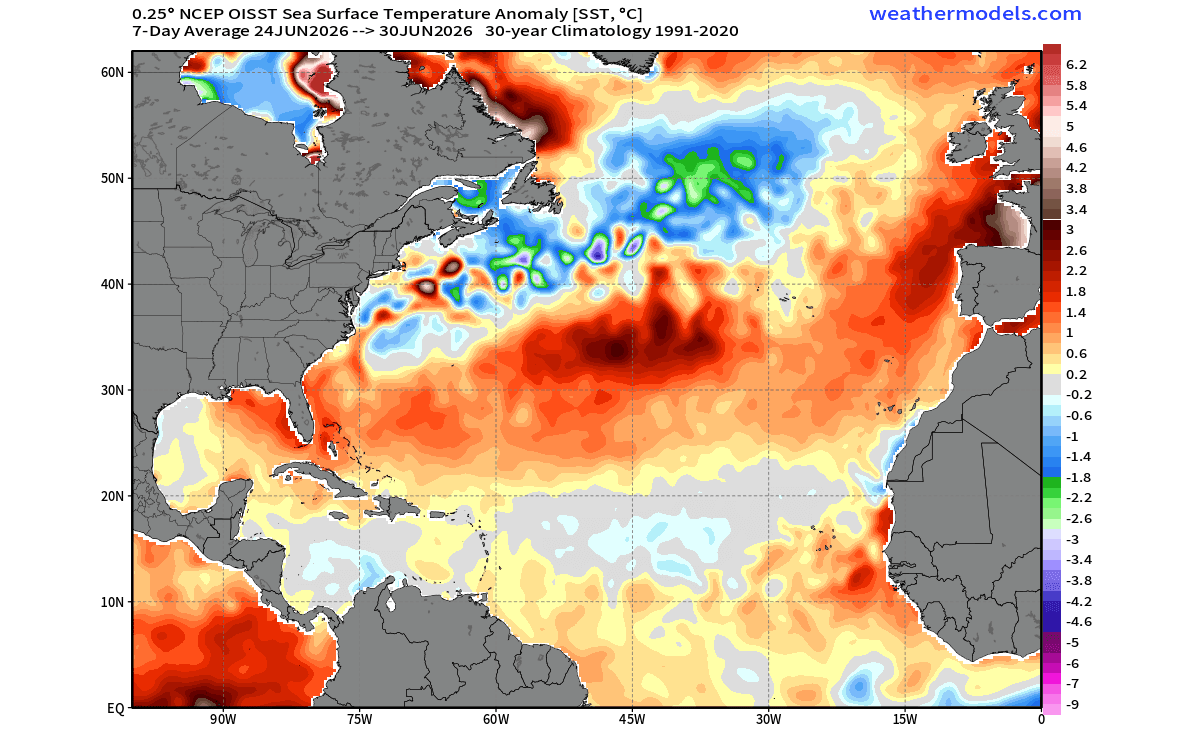
Below is another surface temperature anomaly analysis, but it is a 7-day average for the last week of June. You can see that the main cold area is linked back into the Gulf Stream and towards the east coast of the United States. It is much more organized and has a more stable-looking structure.
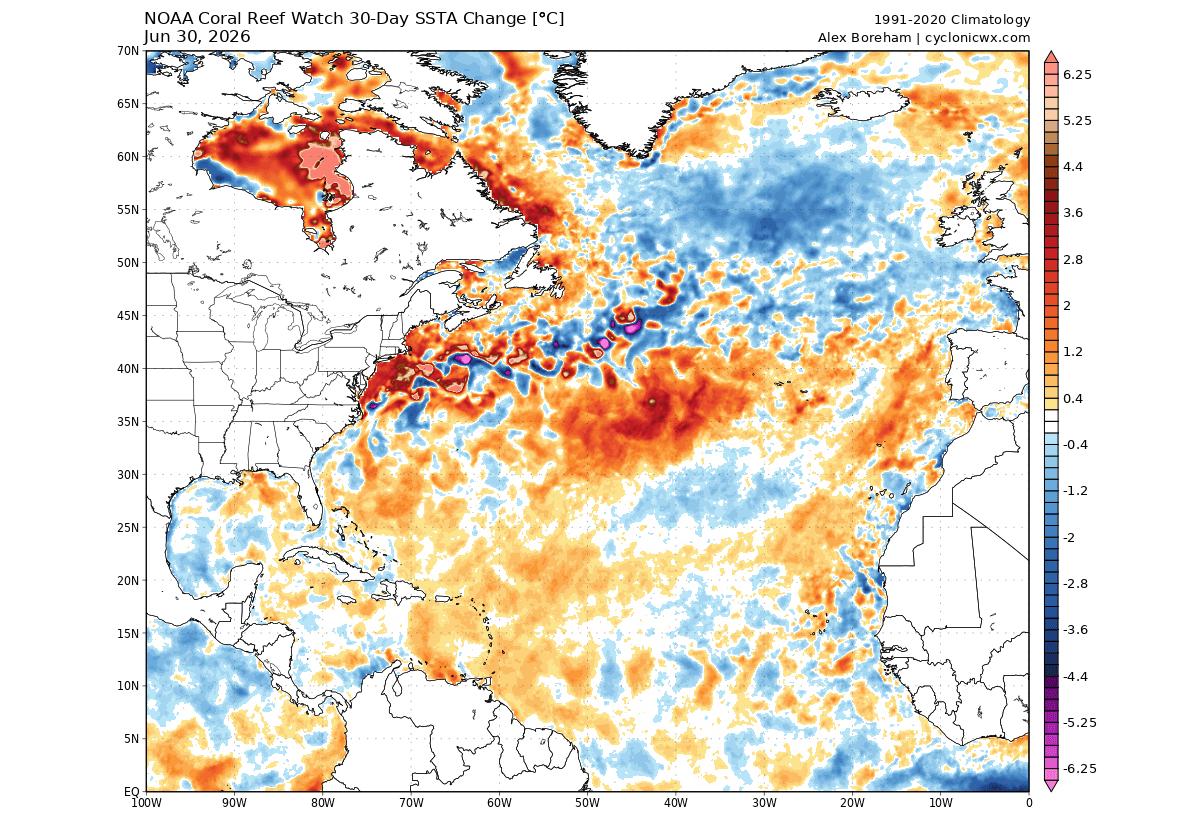
Looking at the 30-day temperature change, you can see a cooling trend in the far northern Atlantic. But interestingly, you can also see how the warm anomalies of the Gulf Stream stand out back towards the United States, with cooling patches within the stream flow.
Below is an even more dramatic analysis image. It shows the 1-year difference in surface temperature for the last week of June. This shows that the North Atlantic is much colder currently than it was this time last year. What stands out most is the Gulf Stream area, which shows several degrees lower temperatures compared to last year.
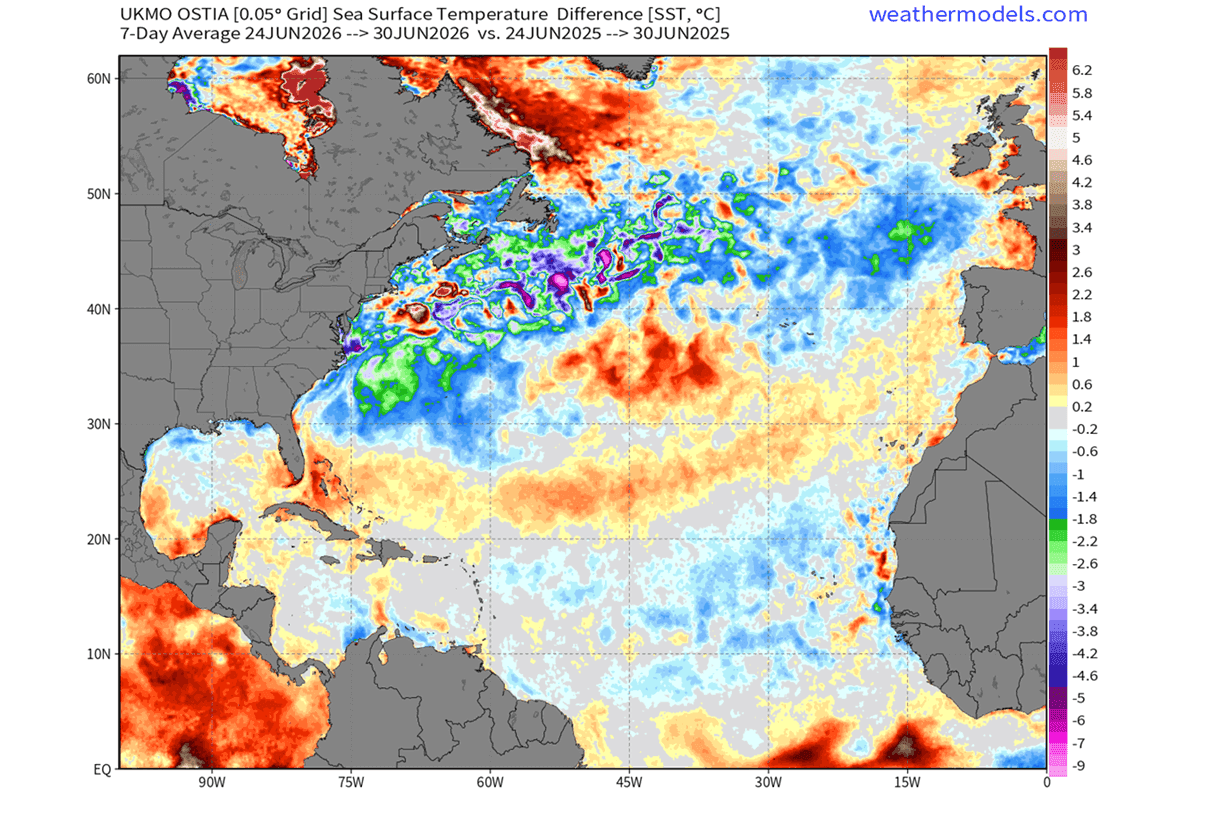
The main cold blob area shows ocean temperatures 0.5 to 2 degrees lower than this time last year, which is a significant change.
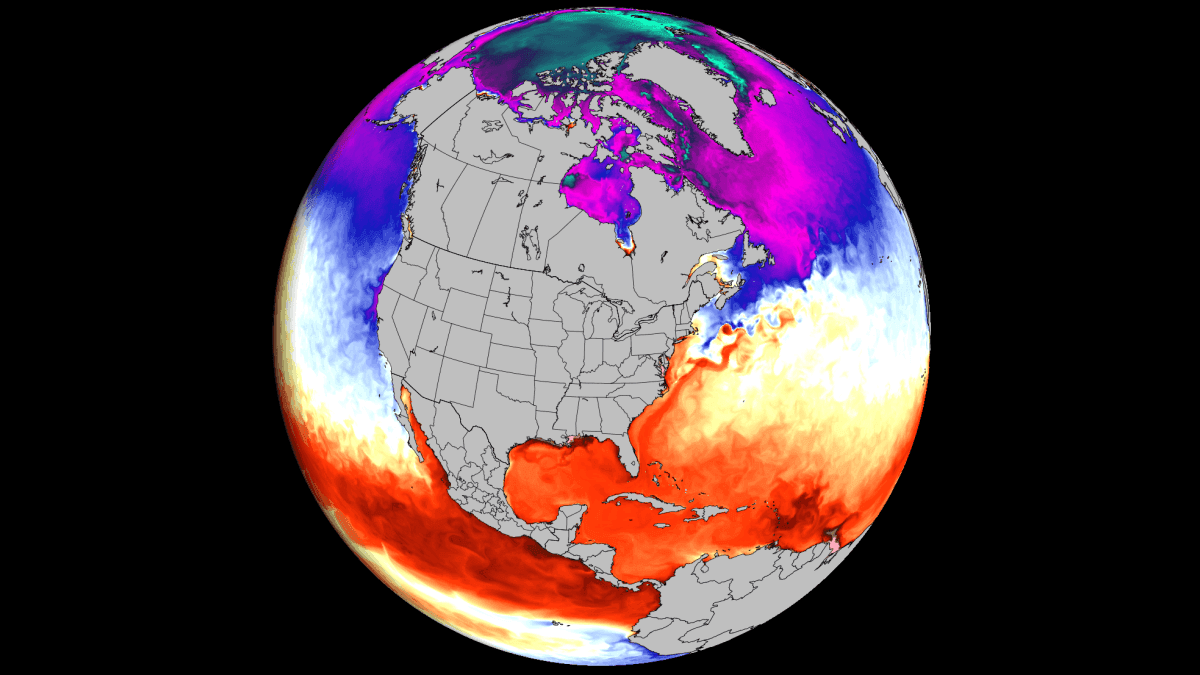
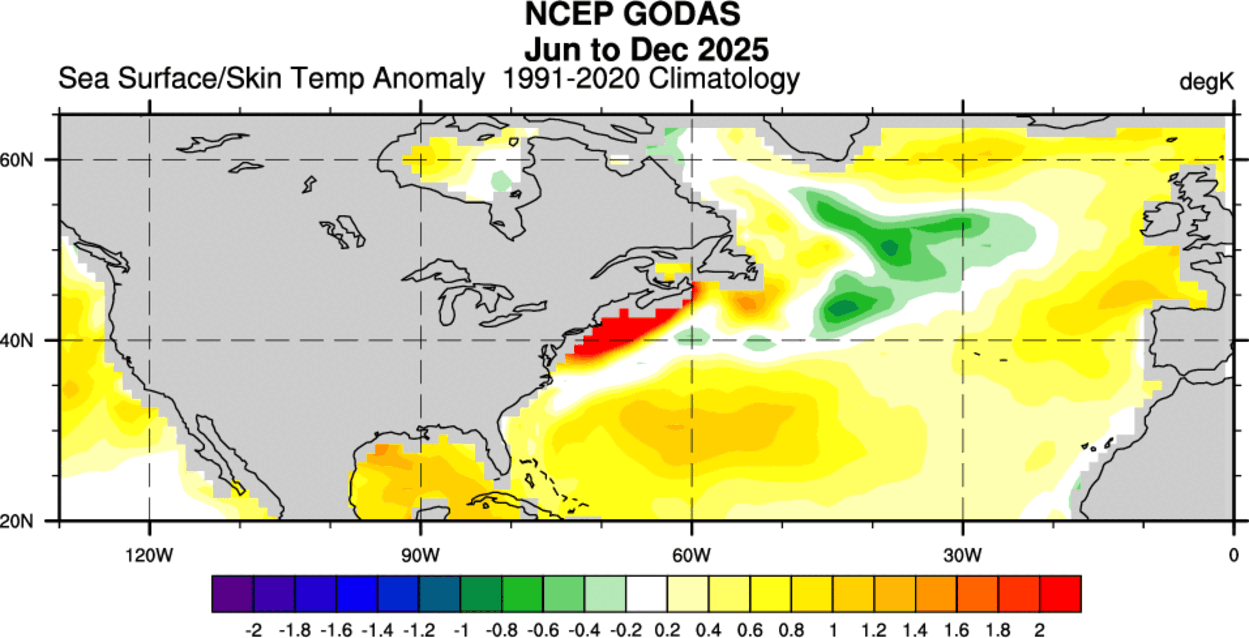
If we take a broader global look in the image below, the cold North Atlantic area shows a stark contrast versus a powerful Super El Niño emerging in the tropical Pacific Ocean. Below you can also see the cold anomaly in the tropical Atlantic, which we will talk about in a future article.
As the Ocean and the Atmosphere are strongly connected on a planetary level, this tri-headed pattern signals strong seasonal weather dynamics on the horizon.
Seasonal Forecast: The Cold Atlantic Signal Persists With a Super El Niño
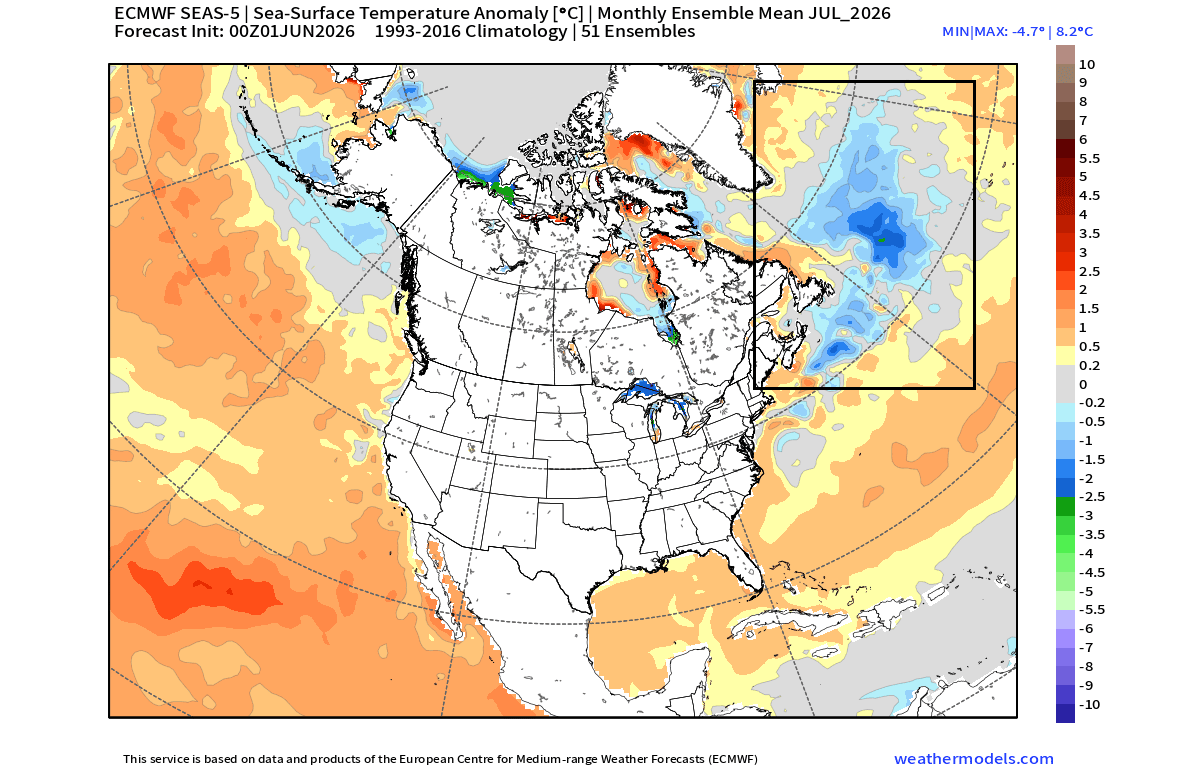
Using the latest long-range predictions, we can look at how this cold anomaly is forecast to develop as we approach Winter 2026/2027. Below we can see the July 2026 forecast, which shows the sustained cold anomalies in the far northern Atlantic. It also shows the cold connection to the Gulf Stream flow, while warm anomalies build in the Pacific, creating a unique atmospheric setup.
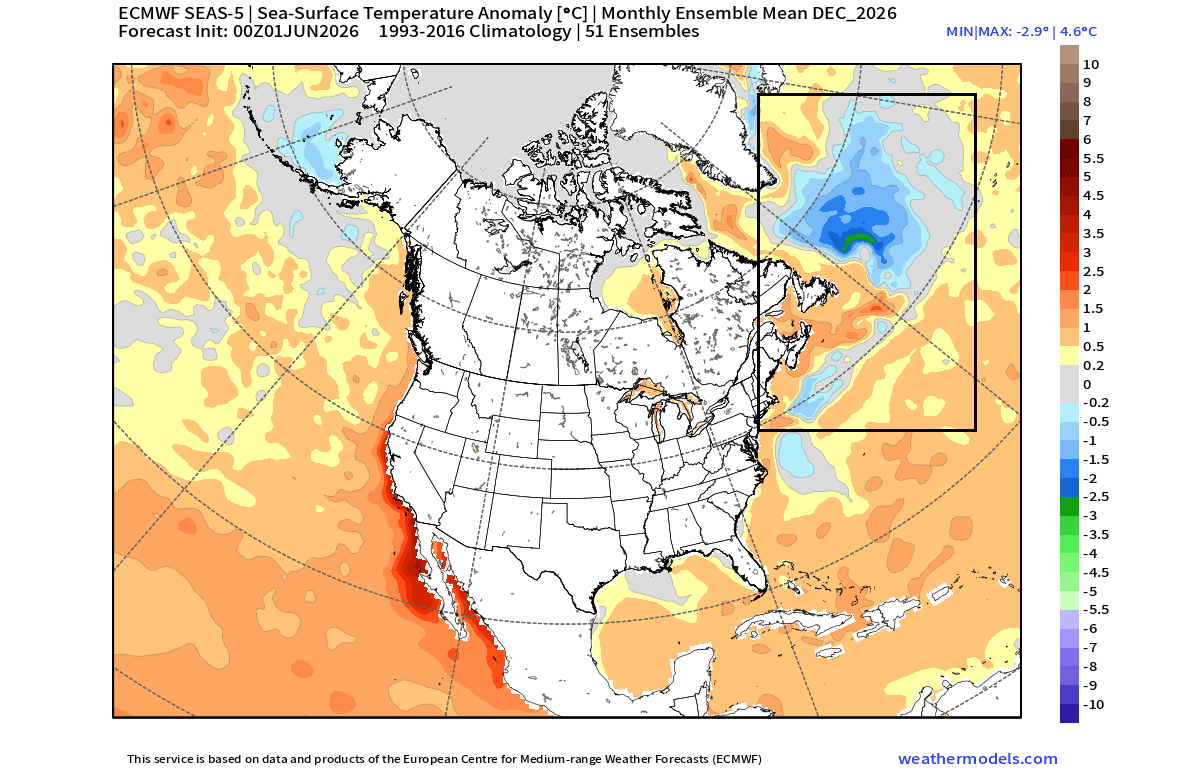
Looking at the December forecast, you can see that the cold anomaly is still present, with a similar size, and still shows the cold tail into the Gulf Stream. This means that the cold anomaly is not just a weekly passing event, but a long-term feature that can be used as an indicator in long-range weather trends.
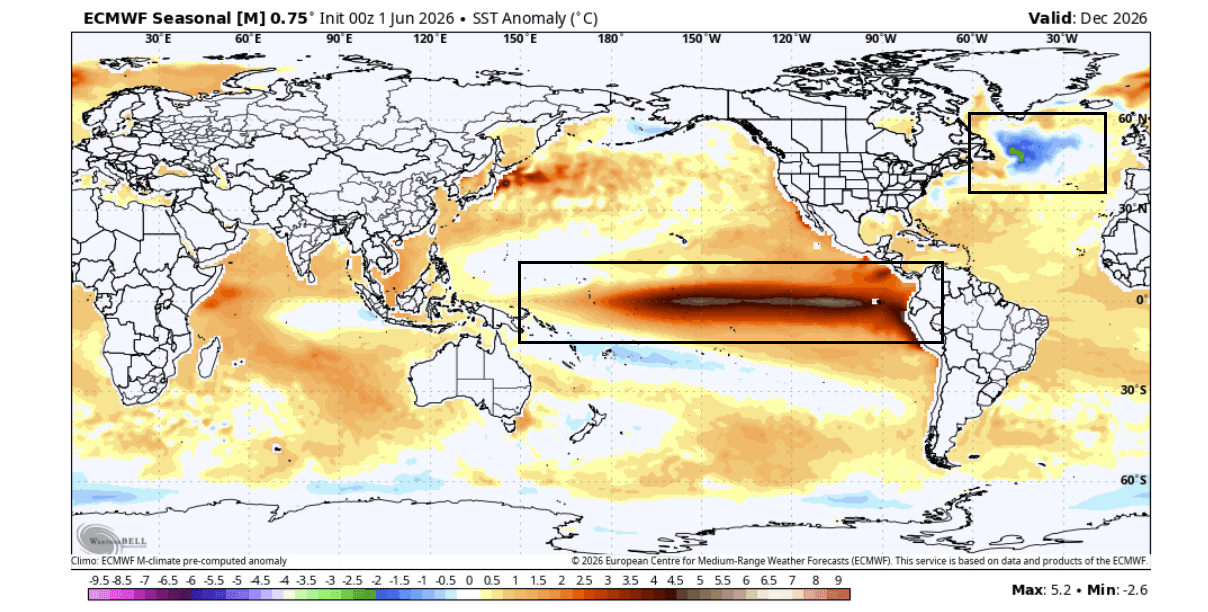
Below is also the December forecast, but for a global look, which really shows the strong contrast between the Super El Niño in the Pacific and the cold North Atlantic. Oceans serve both as indicators and also as influencers, so this is a rare and important setup for the seasonal weather development.
To show the whole forecast period, we produced a video from the ECMWF forecast. The video shows the whole forecast period from June to December 2026. You can see how the cold anomalies are sustained and even get stronger later in the year, and how the Super El Niño reaches peak strength in the Pacific.
This development can be analyzed by the data from past decades to find a connection between the ocean and the atmosphere on a seasonal scale.
North American Pattern: Where Ocean and Atmosphere Collide
As usual, we tend to use the reanalysis tools from NOAA PSL, which allow us to correlate and inspect various oceanic and atmospheric data for several past decades.
Below is an obvious connection that we have found, which shows the proper ocean anomalies, such as the cold northern Atlantic and the warmer anomalies off the west coast of the United States. The atmospheric pattern we found the connection to is called the Pacific-North American pattern, or PNA.
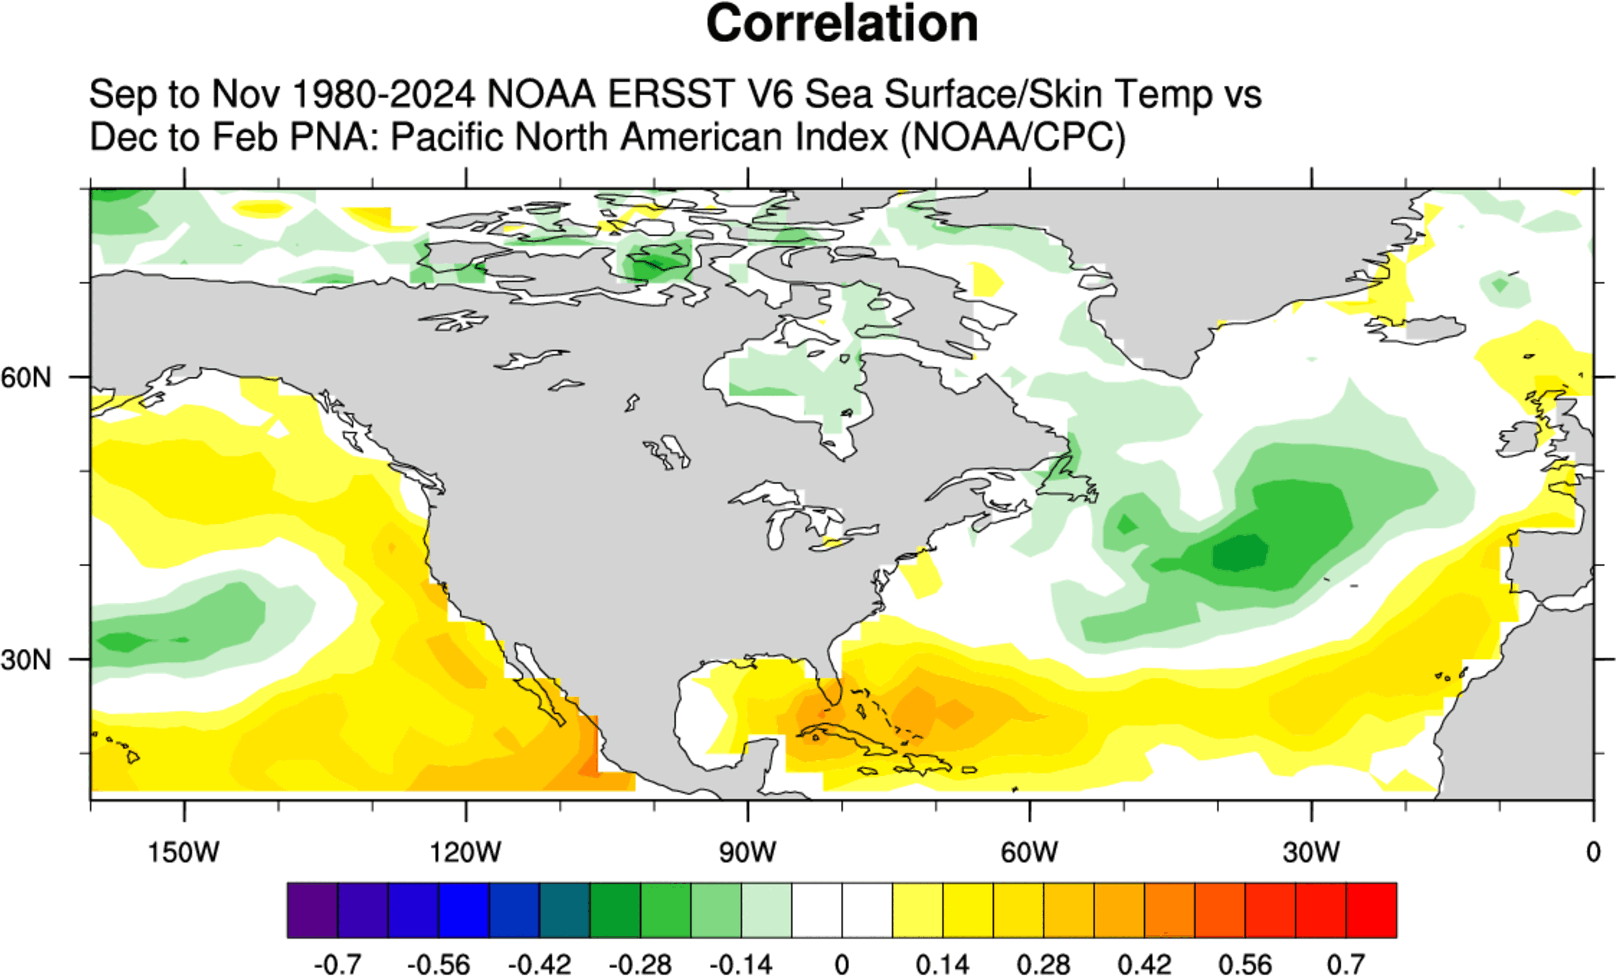
This basically tells us that a Fall cold blob anomaly in the Atlantic corresponds to a positive PNA pattern in Winter. This does not mean that this pattern happens because of the cold Atlantic area, but just hints at an existing link, usable for seasonal predictions.
As mentioned, PNA stands for the Pacific–North American pattern. It has a positive and negative phase, and it explains the pressure anomalies between the North Pacific and North America. Below is the Winter pressure anomaly during a positive PNA phase, from NOAA Climate.
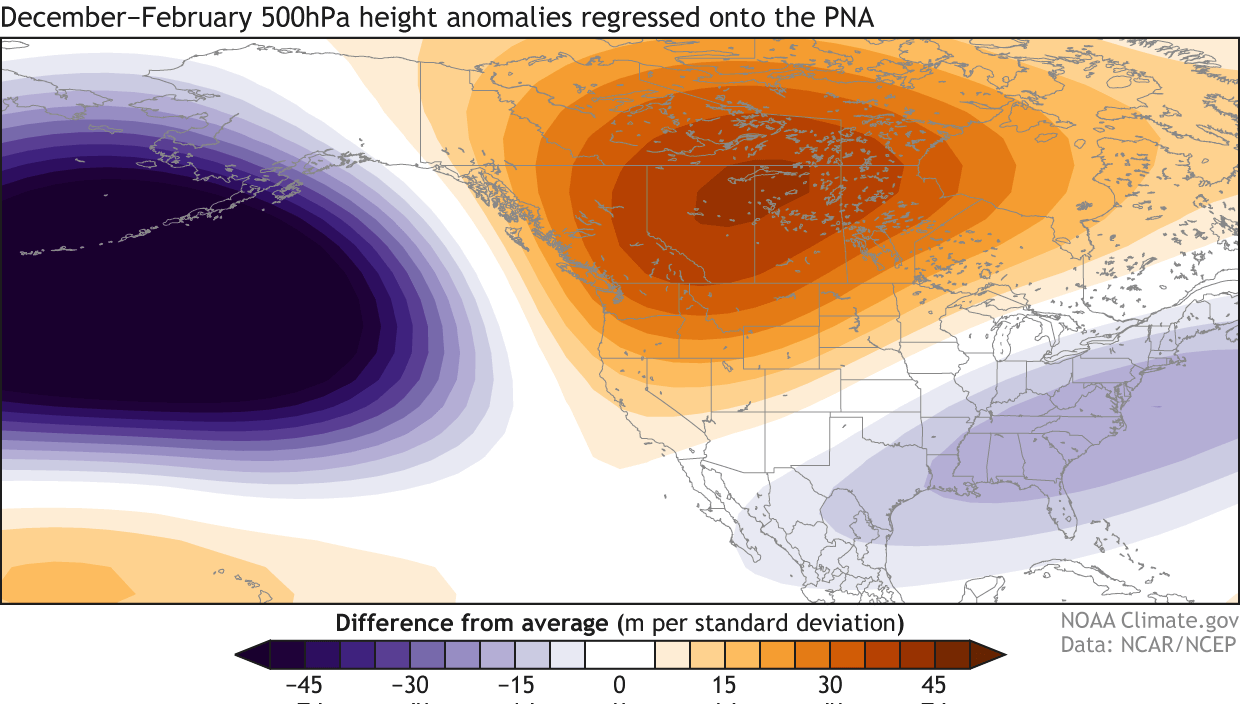
As you can see, a positive PNA pattern indicates a high-pressure system over the northwestern United States and Canada. That creates a low-pressure area over the central, southern, and eastern United States, which can lead to a more northerly flow in these regions.
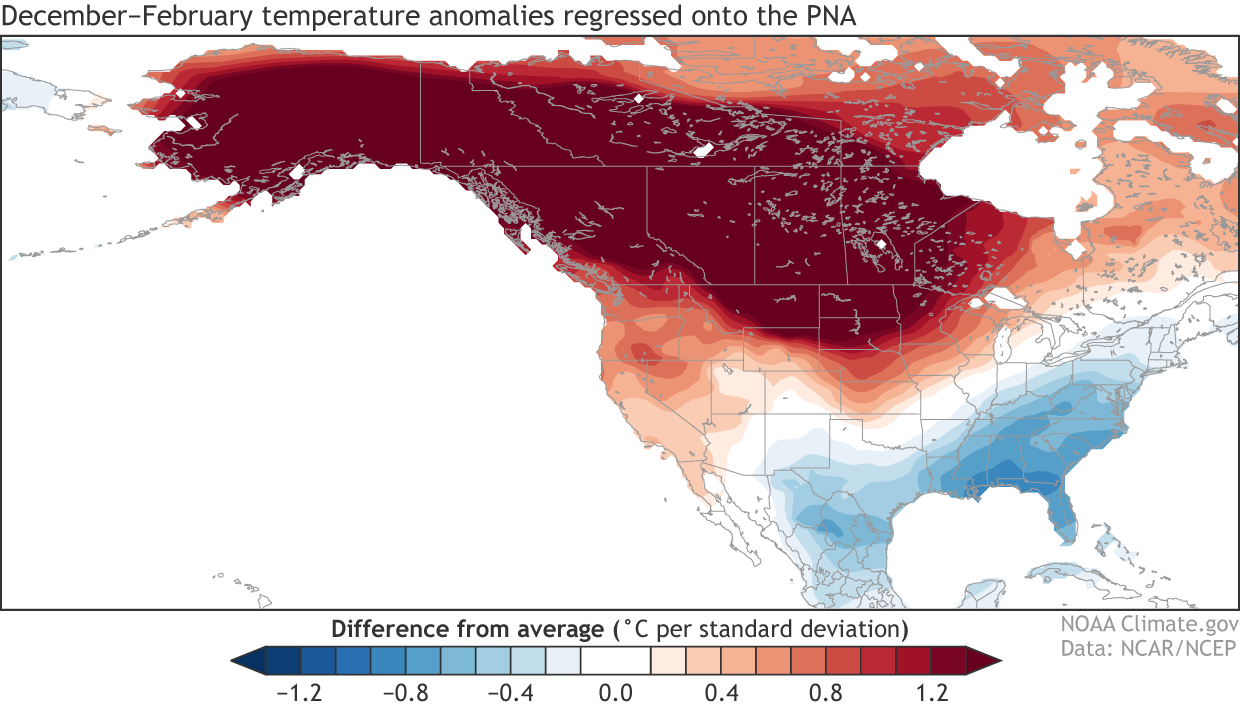
You can see this in the positive PNA temperature analysis below: there are strong warm anomalies under the high-pressure area over the northern United States and western Canada. But you can see colder-than-normal winter temperatures over the southern and eastern parts of the United States.
To summarize, we have observed that historically, a cold anomaly in the far North Atlantic has often been followed by a positive PNA pattern during Winter over the United States and Canada. Not meaning that the cold anomaly itself is responsible for a colder winter over the eastern United States, but it can be like an indicator of what is to come.
But this year, we have a far stronger driver on the rise, the Super El Niño. Below is the analysis of the winter period during the last 4 Super El Niño events. You can actually see a very similar pattern to the +PNA above. A strong low-pressure area in the North Pacific, a high-pressure area over Canada, and a warm ridge over Europe.
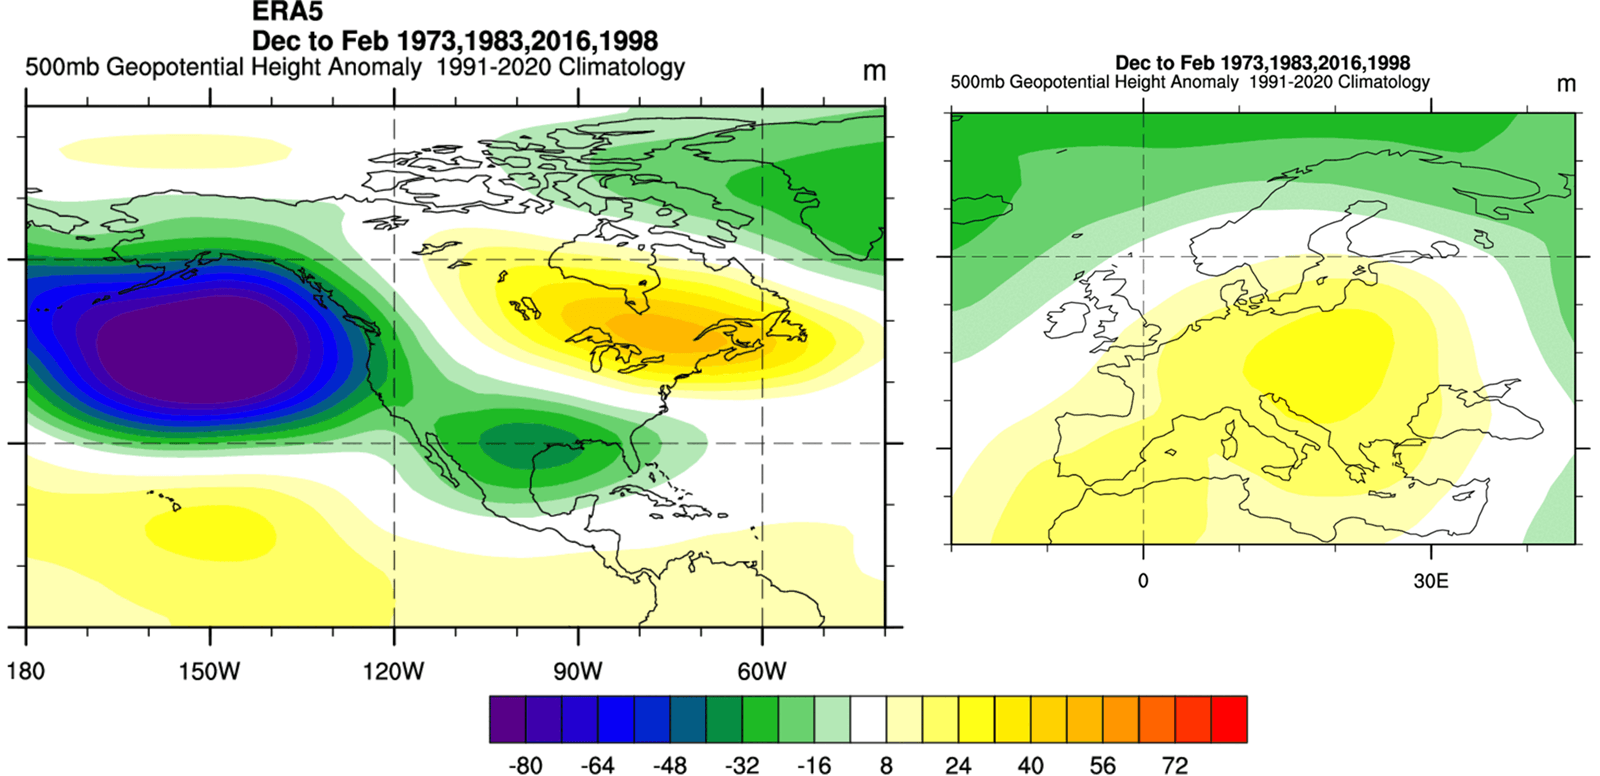
We can also see the low-pressure area over the United States, which gives the overall pattern a close positive PNA look. The exception is that the high-pressure area over Canada is located a bit further east in a Super El Niño.
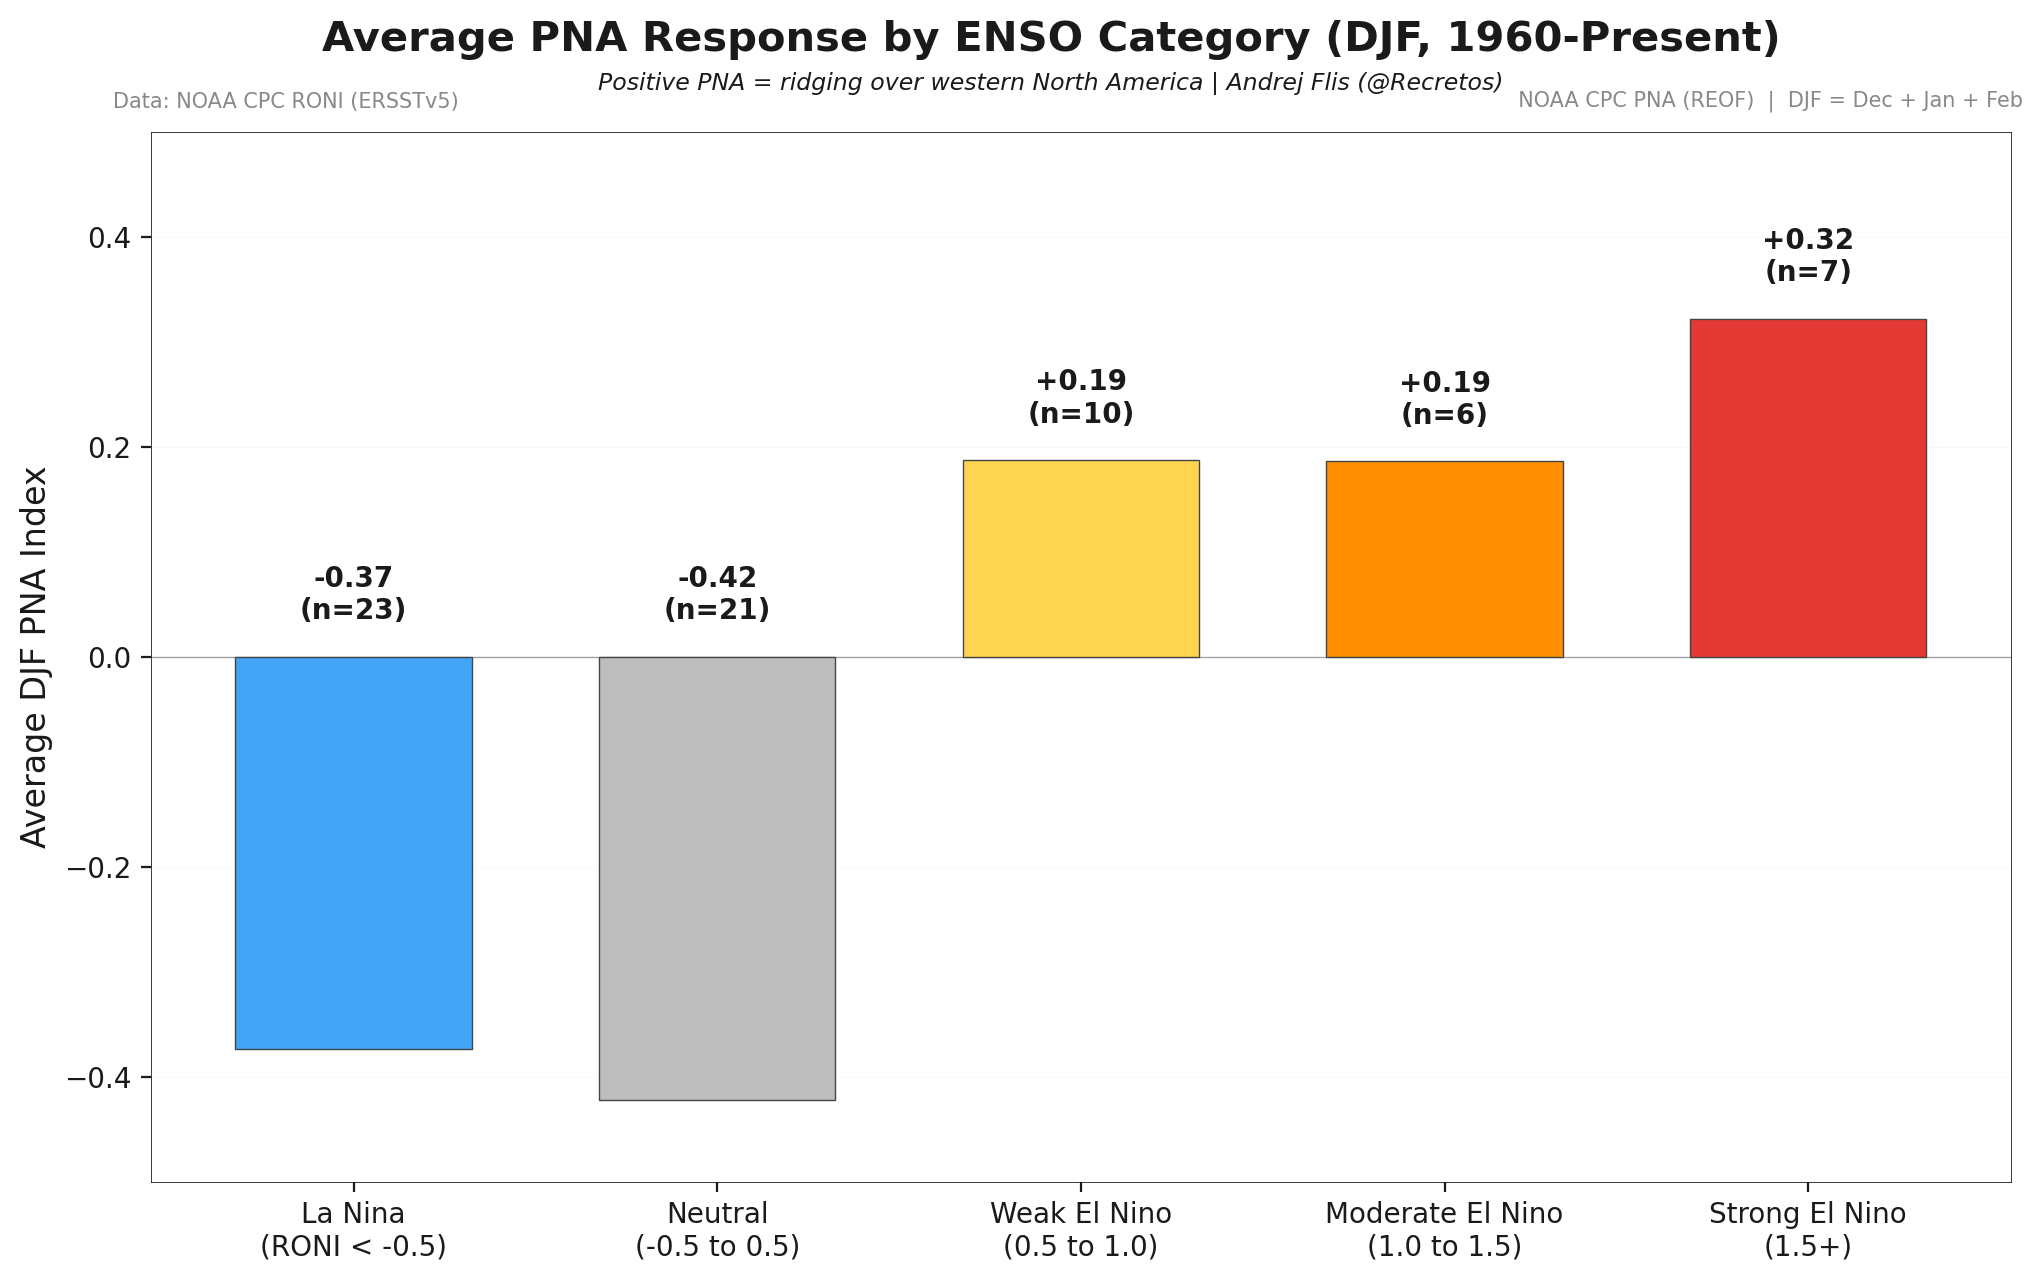
Below, we made an image that shows the relation between the ENSO phases and the PNA index for North America. It shows a very clear indication of how a stronger El Niño favors the development of positive PNA, as seen above.
This confirms that the Atlantic cold anomaly might just be a side effect of a changing global weather system, shifting into Super El Niño mode.
Ocean anomalies are often more of an indicator of large-scale changes in the atmosphere. And as we can see, it all comes together when we compare several past atmospheric and oceanic patterns, giving a very strong indication of just how connected this global system is, already hinting at the long-range development months ahead.
Winter 2026/2027: Early Signals Point to Strong Atmospheric Anomalies
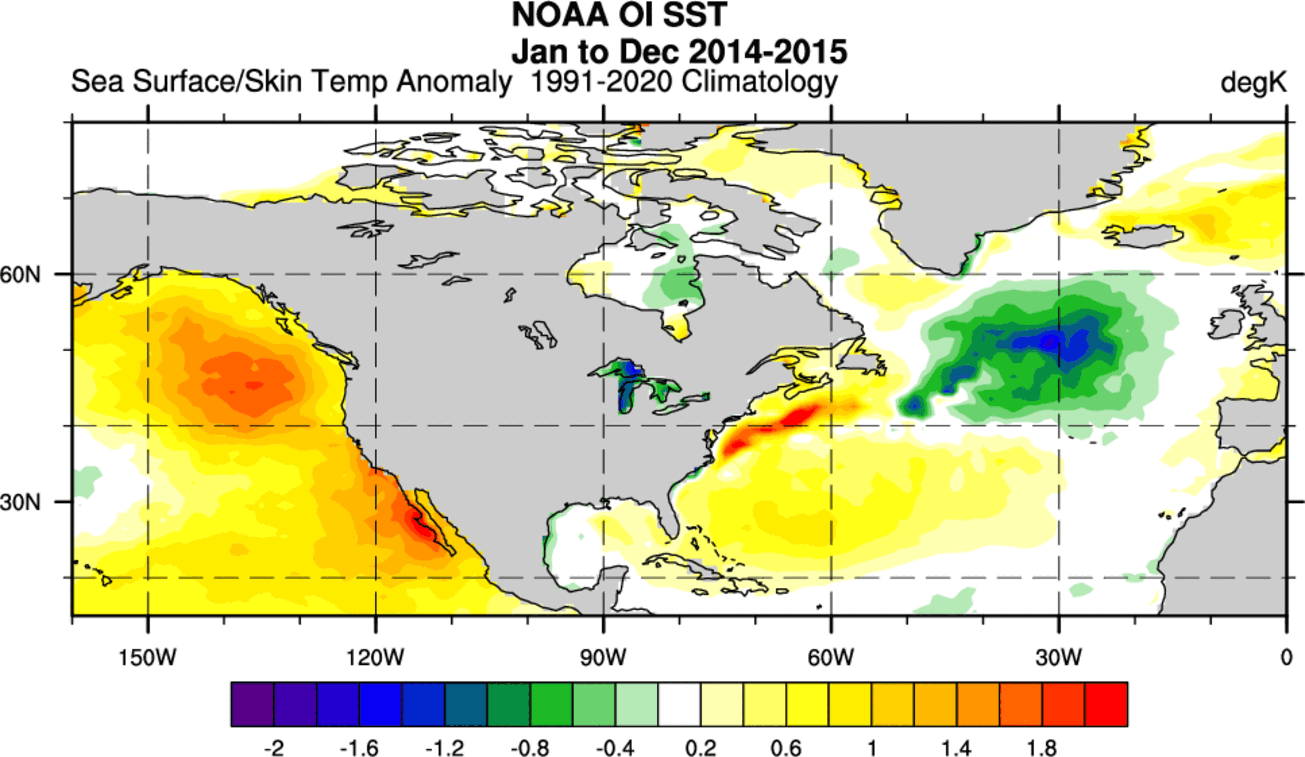
For deeper winter indications, we can go just a decade back to the 2014-2015 period. Here, we observed one of the strongest cold blobs in the North Atlantic in recent history.
The image below shows ocean temperatures in that period, and you can see a very familiar pattern. A cold anomaly is present in the far North Atlantic, with warmer waters off the west coast of the United States and Canada. This is the exact pattern that was indicated for a positive PNA winter development.
Below is the Winter pressure analysis for winters during that period. As you can see, it shows a positive PNA signature, with higher pressure over the western and northwestern United States and western Canada. A low-pressure area was present over the eastern United States, the Midwest, and eastern Canada. This is a multi-year winter, so individual patterns can vary.
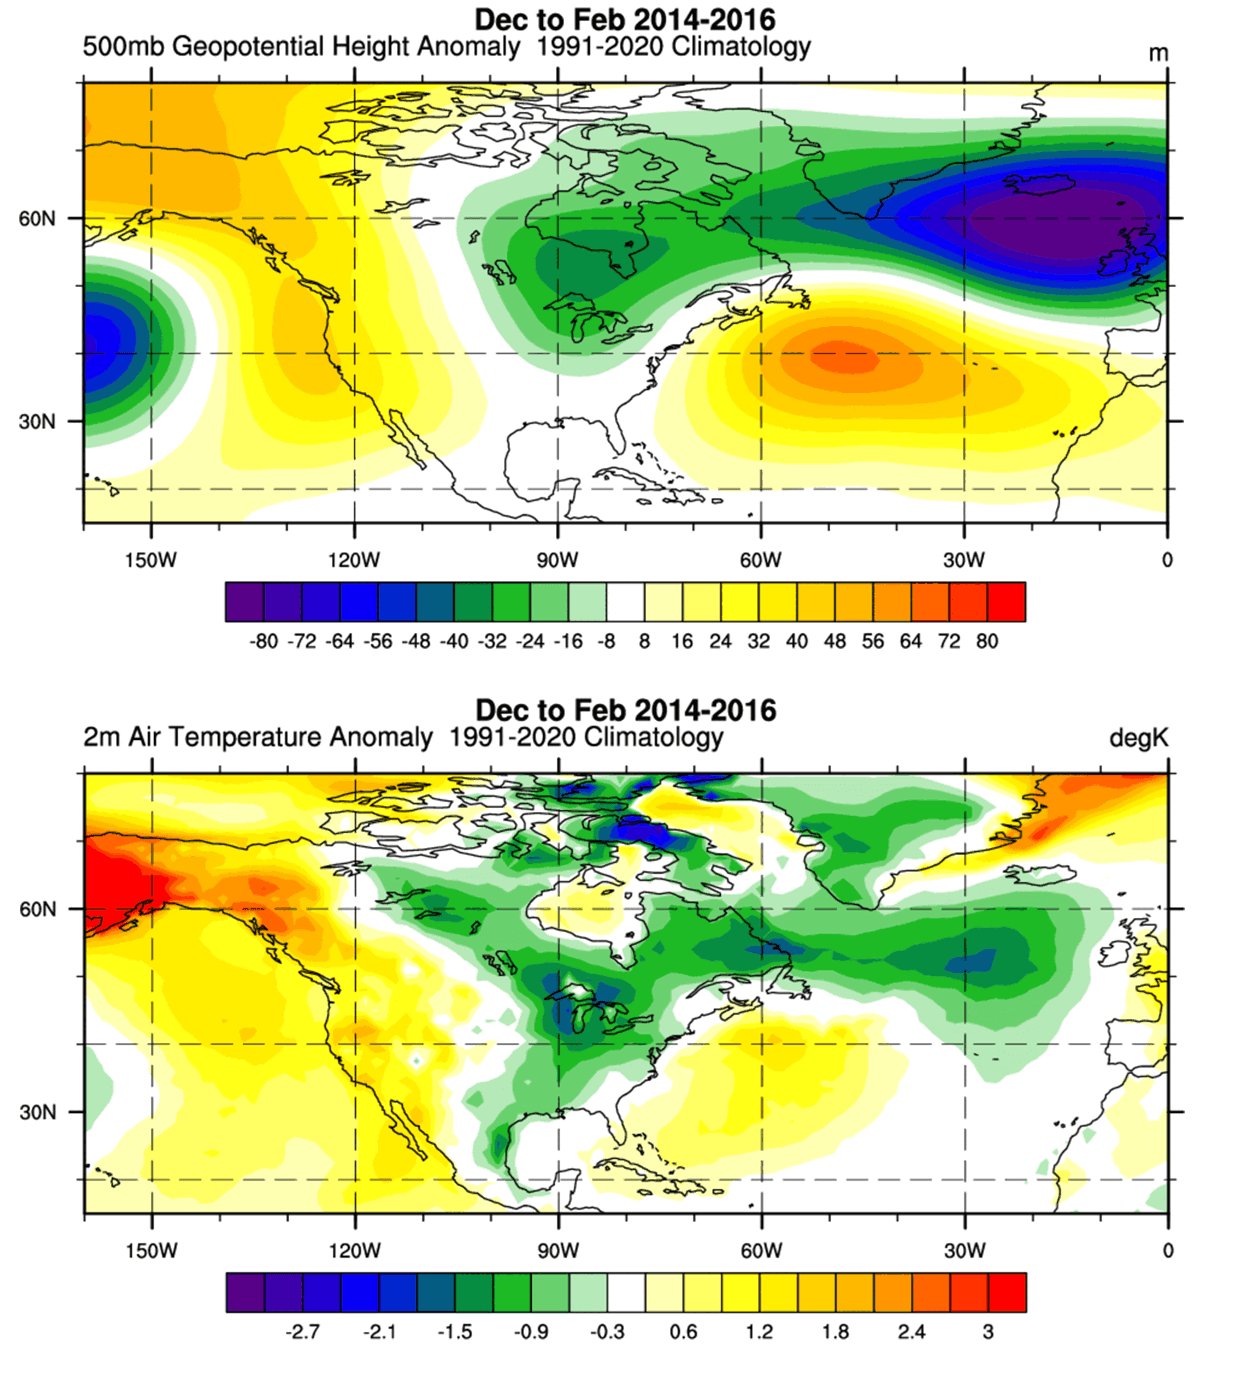
Above is the resulting winter temperature pattern that shows colder-than-normal temperatures across the Midwest, the entire eastern United States, and eastern Canada. This is due to a Polar Vortex core over the east, which creates a northerly flow across the eastern half of the United States and Canada.
We did a very similar analysis this time last year, because we were observing a similar Atlantic cold area and the warm Pacific pattern. Below is the final analysis for the second half of last year, and it shows a similar signature that we observed in 2014-16 and now, but with weaker cold anomalies.
If we look at the actual pressure and temperature anomalies for the past winter, they were strikingly similar to the 2014-16 period. A low-pressure system over northern Canada and the eastern United States, with a blocking high over Greenland, and a major low-pressure area over western Europe.
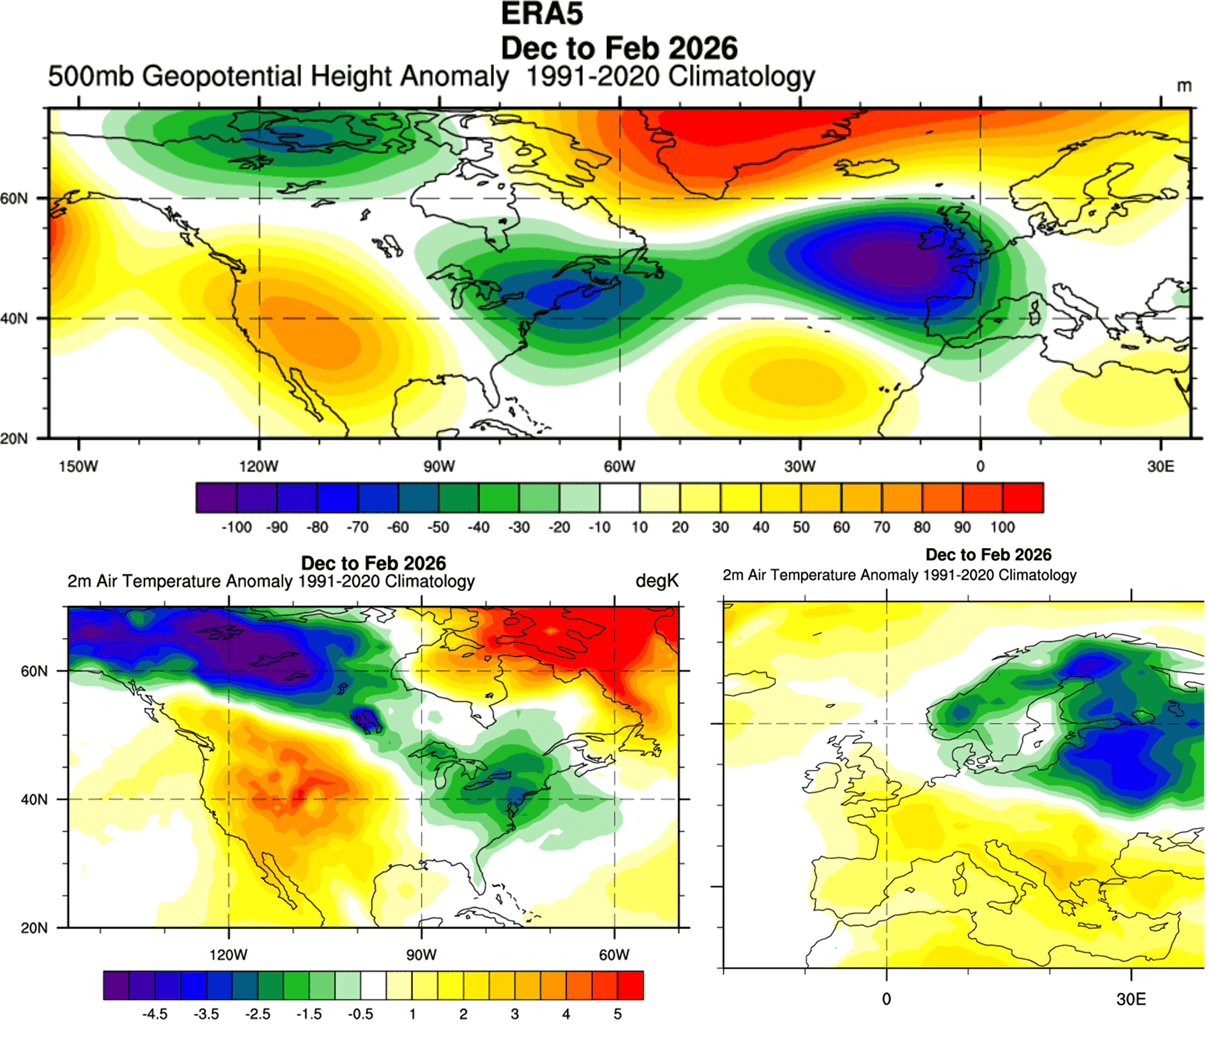
Temperature-wise, this created a cold corridor from western Canada into the eastern United States, driven by a local Polar Vortex core over the east. Over Europe, we saw warm anomalies over the central, western, and southern parts, and cold anomalies over the northern parts.
We can now look at the latest long-range predictions to see what they show for the early Winter weather patterns. These same forecasts all predict the cold Atlantic blob anomaly, and also the El Niño and Pacific pattern, so we should have a very good idea already, despite reaching far ahead.
Below is the December 2026 pressure forecast from the ECMWF model that we used above for the ocean temperatures. We also added the CanSIPS model to compare different predictions. You can see that both forecasts show a strong positive PNA pattern, with a high-pressure system over Canada, a deep low in the North Pacific, and a low-pressure zone over the central and southern United States.
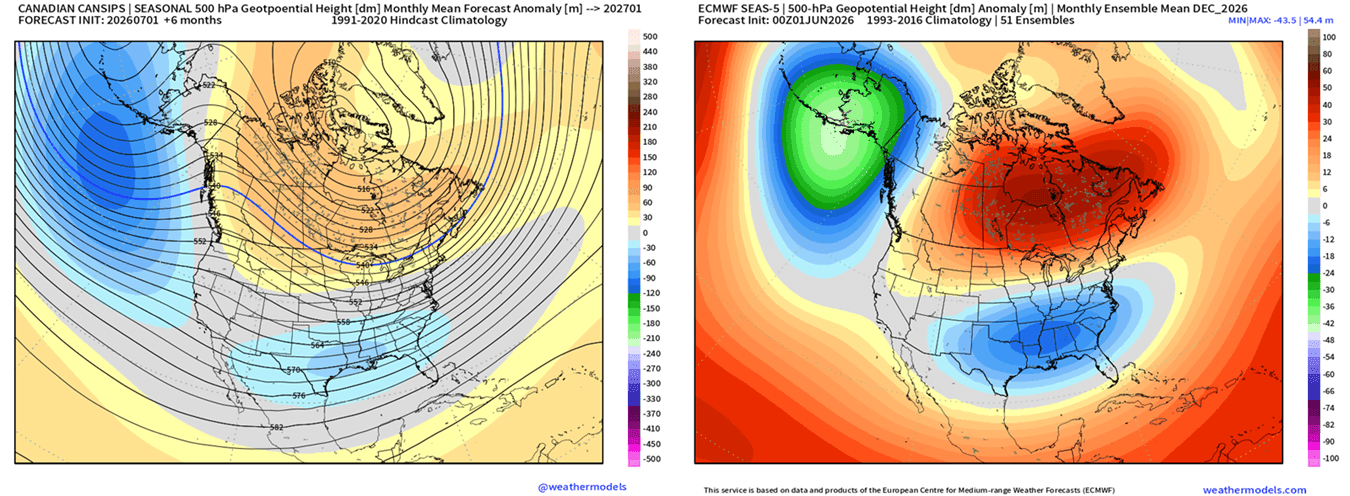
These are at the extended long range, but they both show almost an identical pattern developing for early Winter 2026/2027. It actually makes sense because if we have strong global drivers like a Super El Niño and a strong contrast with the Atlantic cold anomaly, it is easier for the models to pick up these long-range seasonal signals early.
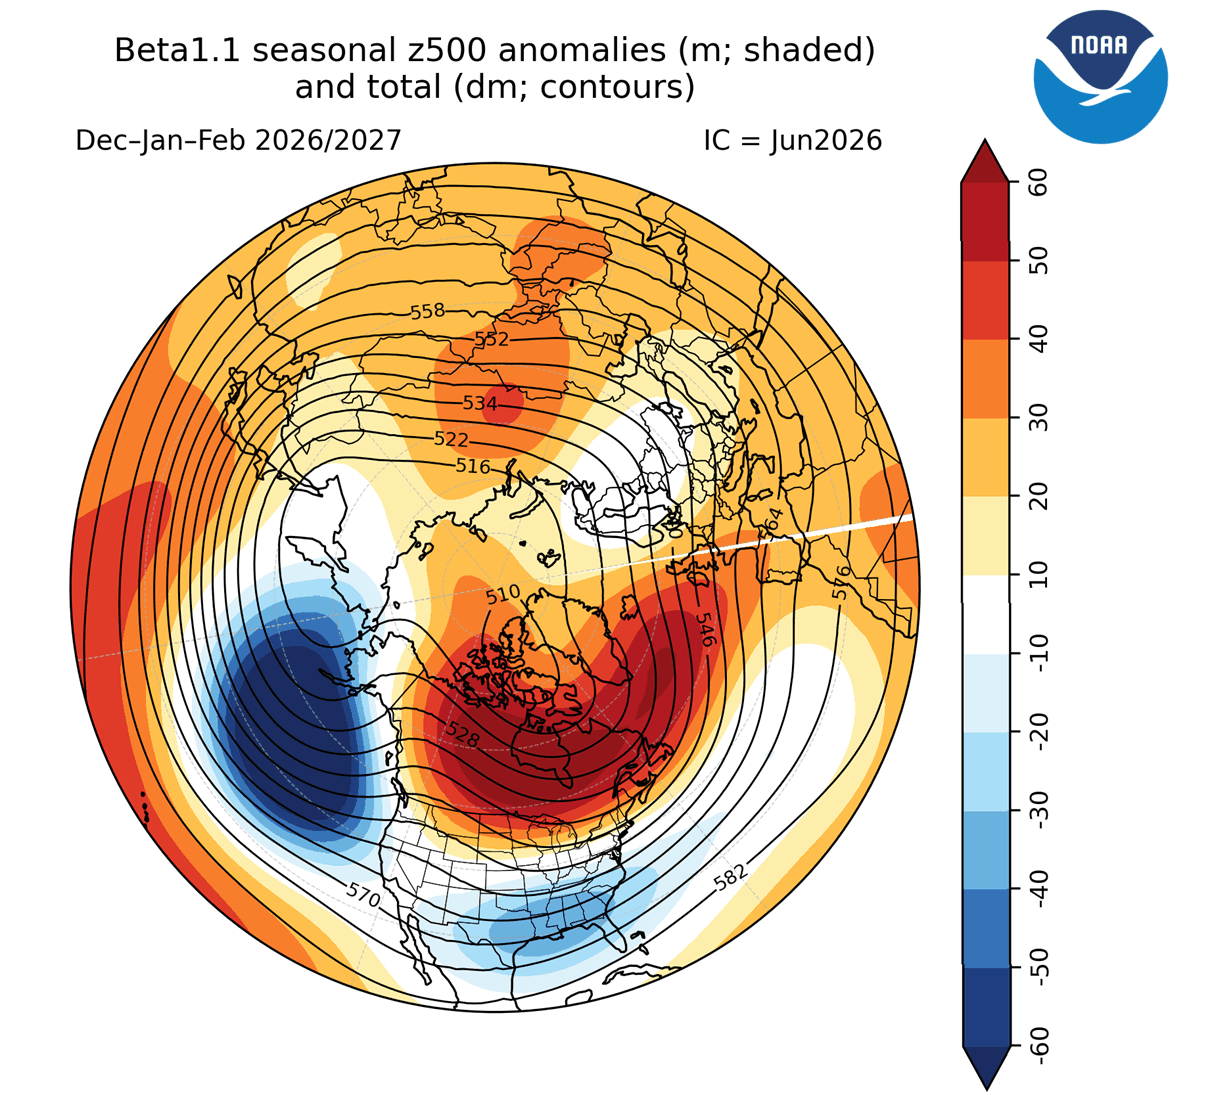
We can add another model into the mix, the CFS from the United States CPC center, which covers the whole Winter 2026/2027 period. Below is the pressure forecast that again shows an identical pattern to the two predictions above, with a clear Super El Niño pattern and a positive PNA over North America, with a ridge into Europe.
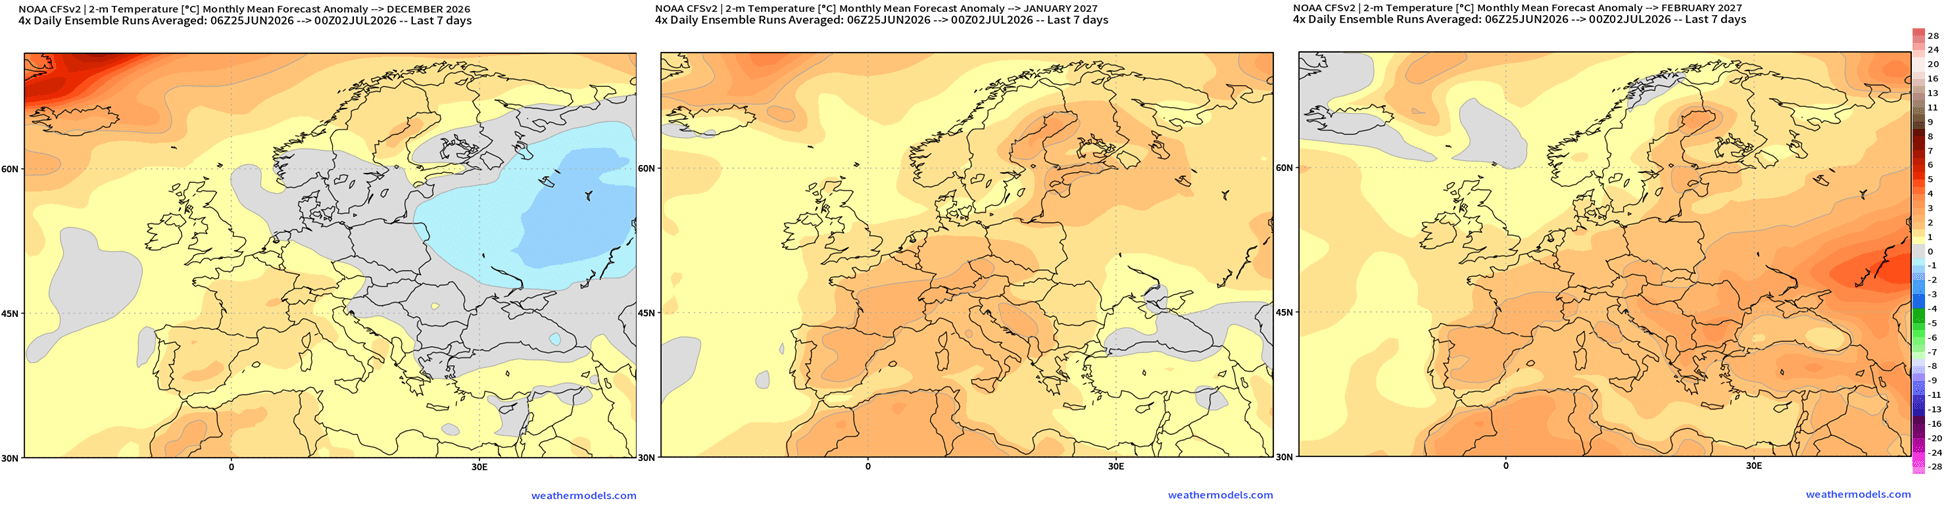
Below is the CFS temperature forecast for each winter month, with December on the left and February on the right. We can see the clear El Niño pattern bringing warm anomalies to the northern United States and Canada. But we have a growing cold-air anomaly over the central, southern, and eastern United States.
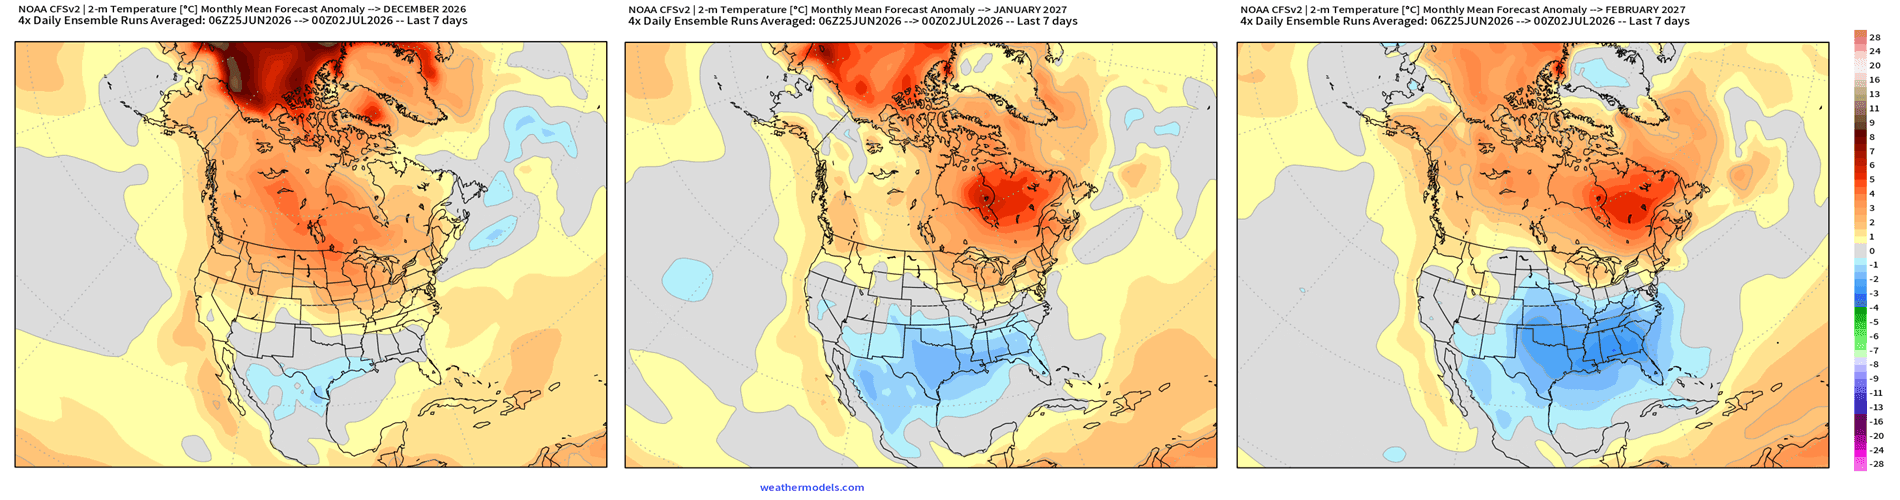
This shows an evolving winter pattern, often seen with El Niño events. And with a potentially historically strong El Niño developing for 2026/2027, we see all model predictions showing very convincing winter scenarios unusually early.
The same model also shows an evolving Winter temperature pattern over Europe, but in an opposite direction. The deeper we go into Winter, the more warm anomalies we see. This is likely due to the rising high-pressure ridge from the south, typical for Super El Niño winters.
All in all, the prediction of the cold North Atlantic ocean anomalies, Super El Niño, and the resulting Winter weather patterns over the United States, Canada, and Europe, fits perfectly with past events. This further confirms our research of a connection between those regions and the resulting weather patterns over North America and Europe.
So in the end, we can look at ocean anomalies also like control lights on the dashboard of your car, where they indicate something is going on. Just like that, we can also look at what nature is trying to tell us, and what weather has occurred and resulted from past such events, and can occur again.
Forecast and analysis images in this article are from cyclonicwx, weathermodels.com, and WeatherBell (using a commercial license).
Make sure to bookmark our page, so you don’t miss any latest weather forecasts and updates. Also, if you have seen this article in the Google App (Discover) feed, click the like button (♥) there to see more of our forecasts and our latest articles on weather and nature in general.
SEE ALSO: