Latest data shows that Arctic sea ice is now at a record-low level for mid-June, entering the main melt season with a weak Polar ice cap. The latest forecast shows reduced extent and fragile concentration areas on the Atlantic side of the Polar region, where the next weather pattern will accelerate melting and also bring lower temperatures into North America.
This comes as a powerful Super El Niño is rapidly developing in the tropical Pacific. Strong El Niño events can reshape global pressure patterns, helping to direct warmer air into the polar regions, influencing how quickly the Polar ice cap melts through summer and early Fall.
This connection matters, as it shows early signs of seasonal weather development. Low Arctic sea ice and a strong El Niño can both affect the Polar Vortex, raising an important merged early signal for the Winter 2026/2027 weather pattern across the United States, Canada, and Europe.
Polar Analysis: Sea Ice Drops to a mid-June Record Low
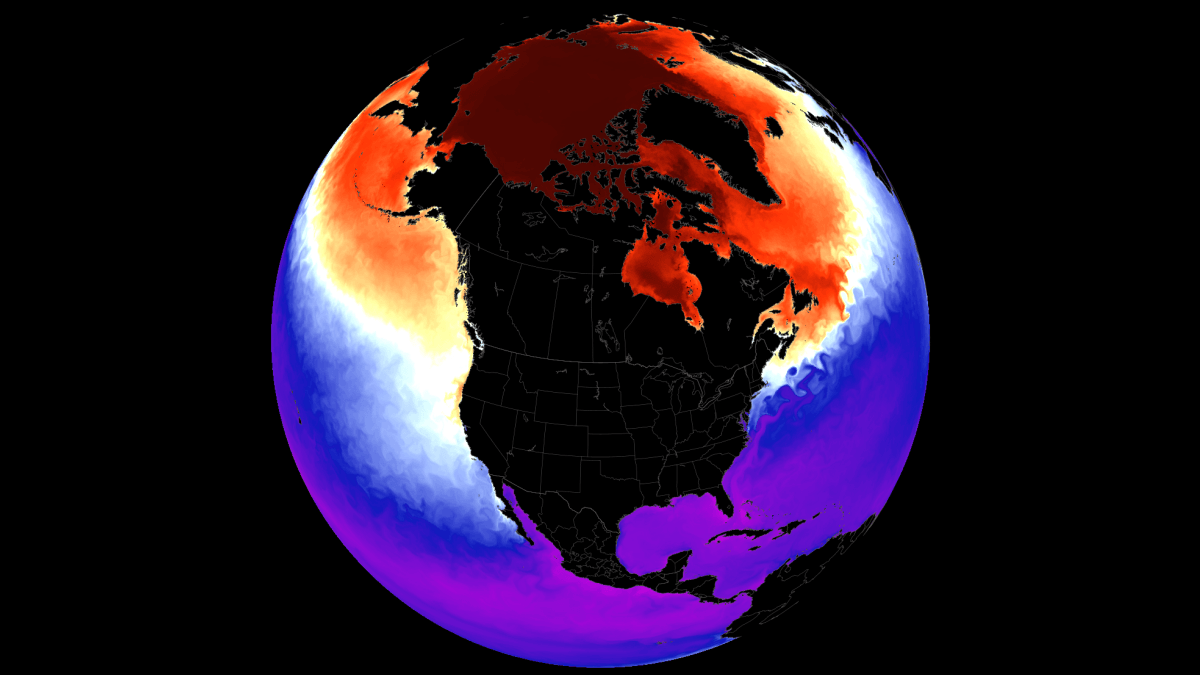
The Arctic region is actually a large ocean, and it has no true large landmass. It is the smallest and shallowest of the world’s oceans, and it is also the coldest. Given its large size and location, it plays a significant role in seasonal weather development, impacting the Polar Vortex and the hemispheric flow.
In the image below, you can see the Arctic Ocean, its usual warm and cold surface currents, and sea ice extent during its average maximum and minimum area. The dark red area marks the record low extent, reached in mid-September 2012.
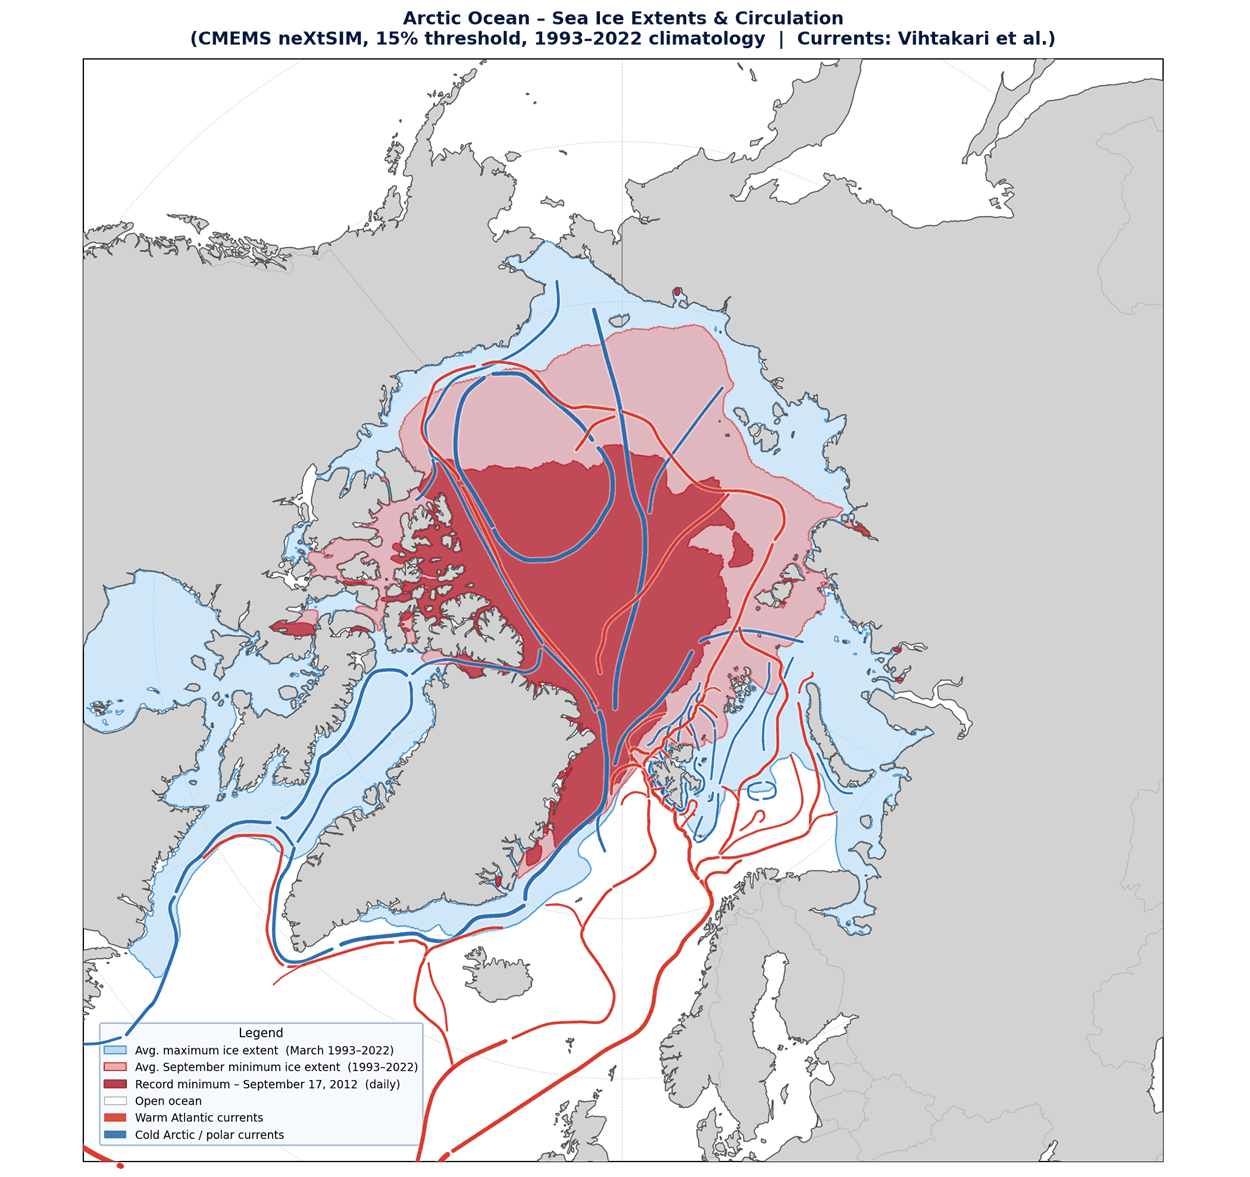
This gives a great perspective of how large the polar icecap is, making it easier to understand how it has an important seasonal weather development.
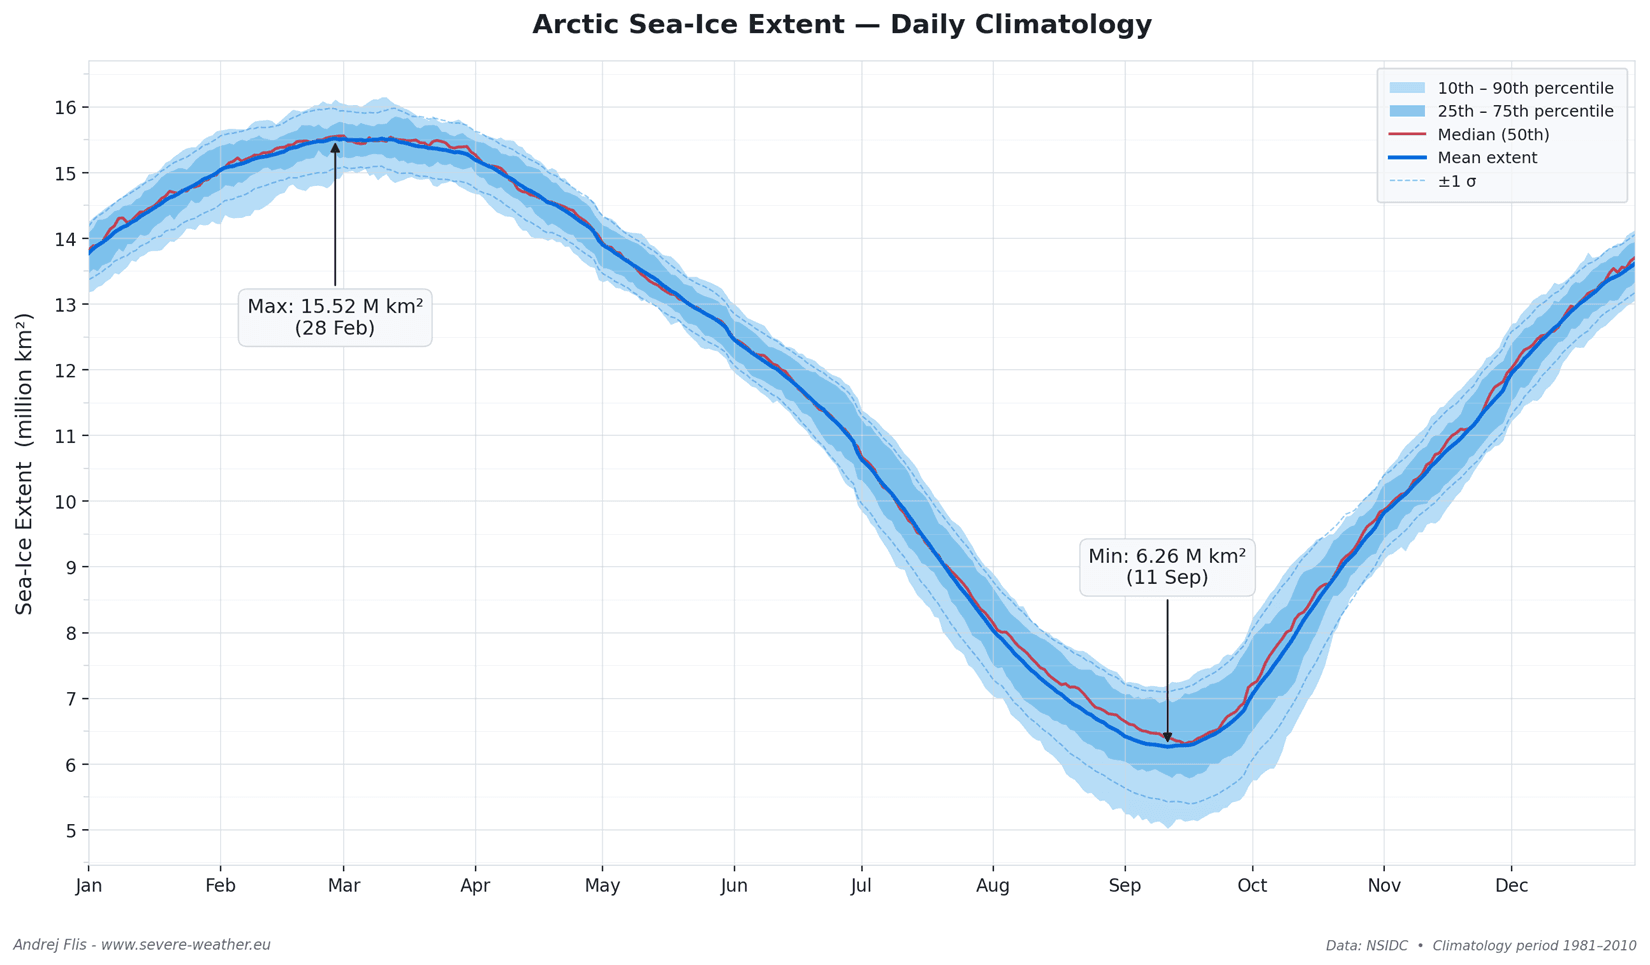
The Arctic sea ice has its own seasonal cycle, as seen in the image below. You can see the seasonal change in sea ice extent over a single year. The melt season usually starts in late March and lasts into early meteorological Fall, reaching an absolute minimum in mid-September.
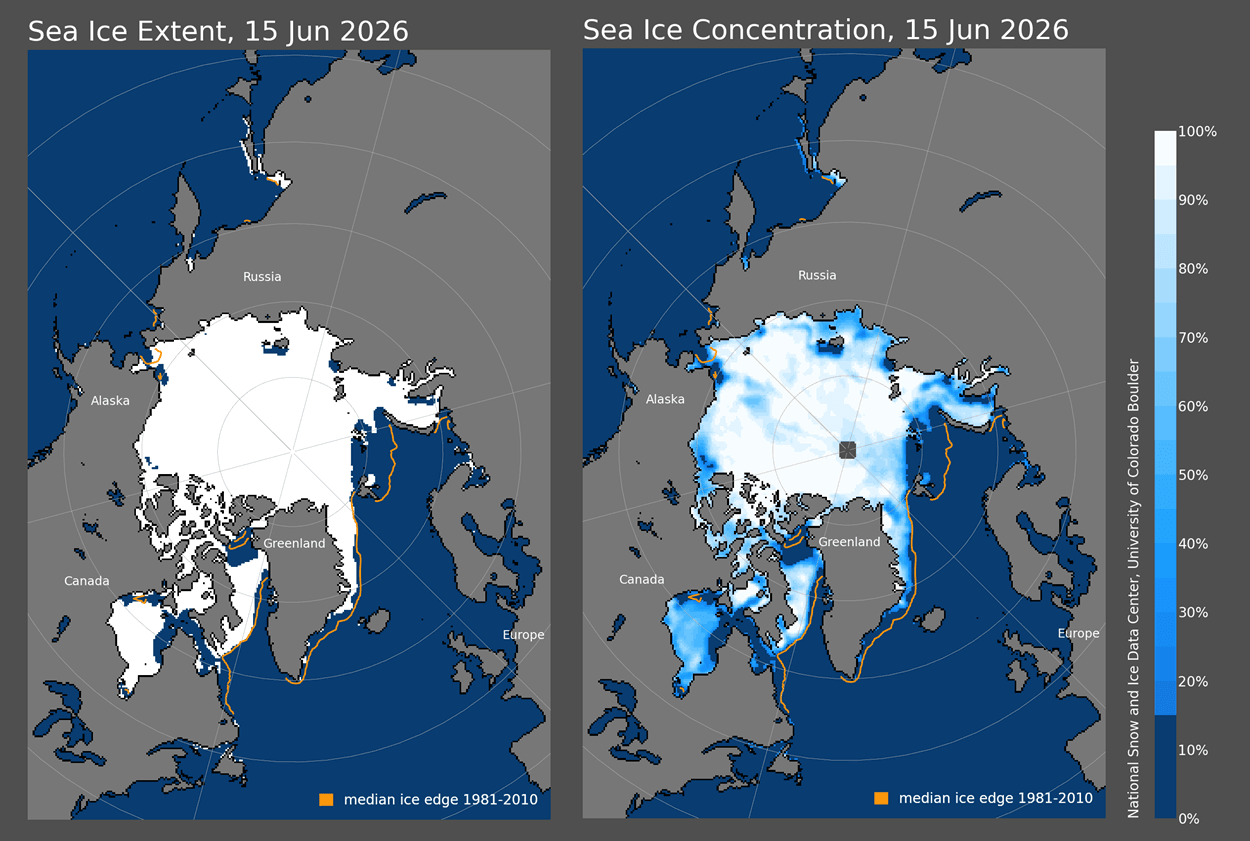
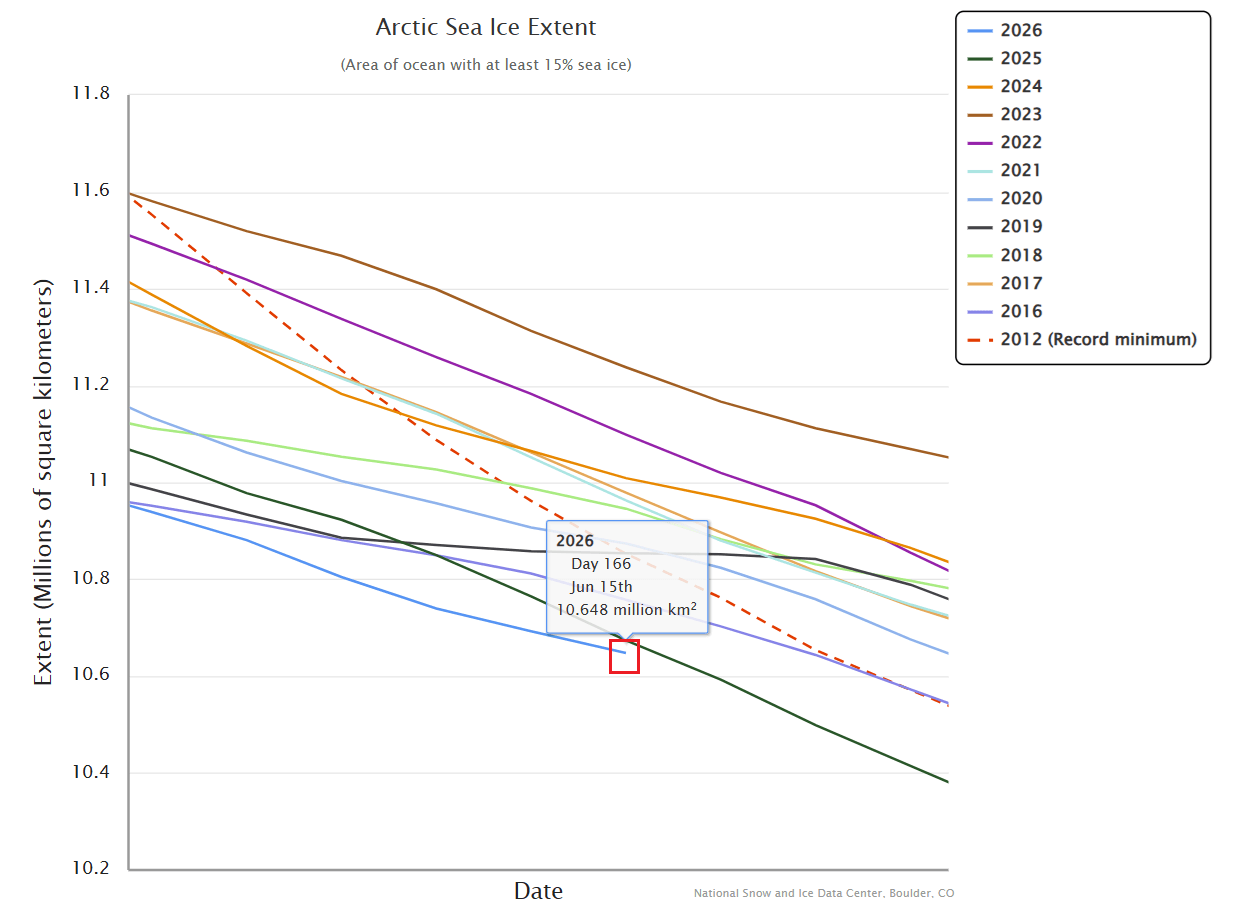
Below is the latest sea ice analysis, showing the extent and concentration. The extent is already behind the orange “normal” area, but the concentration reveals quite weak areas on the Atlantic side. This can melt rapidly in a favorable weather pattern, creating a noticeable drop in overall area coverage.
If we look at the latest graph, you can see a big difference compared to 2025 (green line) and especially versus the last 10 years. In the mid-June period, we are currently at the record low extent for this time of year, running also behind the absolute record low year of 2012. Image by NSIDC
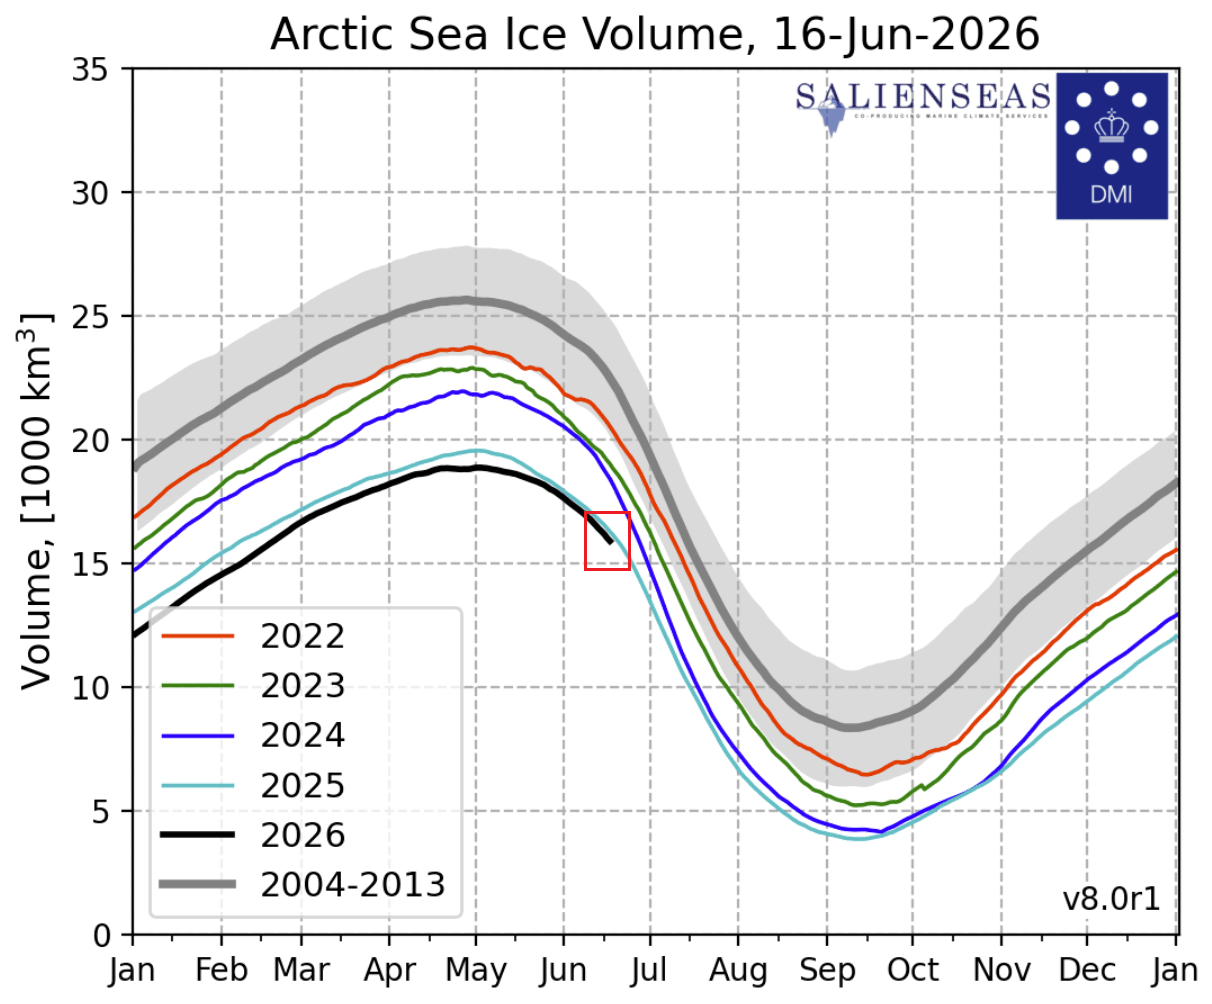
Since we have the data on sea ice thickness, area, and concentration, we can calculate the total volume of the ice cap. Below is the latest volume graph, which shows a different cycle, with the volume peaking later, usually in late May, because the polar regions are still cold. The 2026 sea ice volume is currently lower than last year, and is projected to also be significantly behind all recent years.
This is quite an unstable ice cap, and with certain weather patterns, it can be hard to withstand rapid melting, potentially reaching a new record low in September. The latest forecast shows a weather pattern that will accelerate the melt process and also bring a cold air anomaly into the United States and Canada.
Atmospheric Flow: Arctic Melt Links to North American Weather
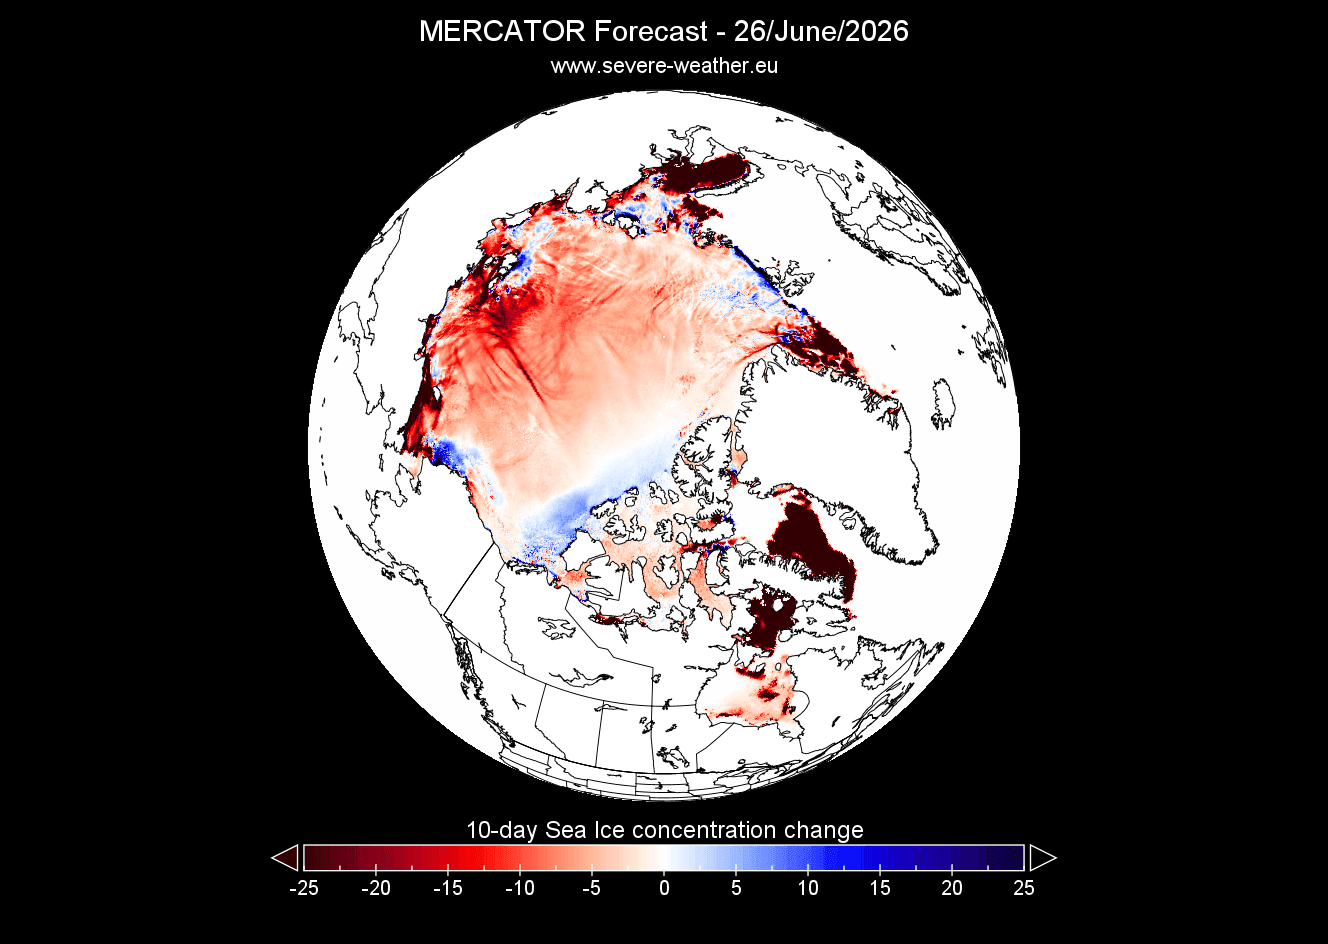
Below is our latest graphic, which shows the sea ice concentration change. Specifically, it shows the forecast change in sea ice concentration over the next 10 days. It shows a strong melt process in the Atlantic areas and the Kara Sea region.
This amplified melt comes from the overall weather pattern, which is also sending a cold temperature anomaly into the United States and Canada. Below is the 500mb pressure anomaly forecast, which shows an interesting circulation. There is a small Polar Vortex core over the pole, with a ridge on each side, and a resulting low-pressure area over the eastern United States.
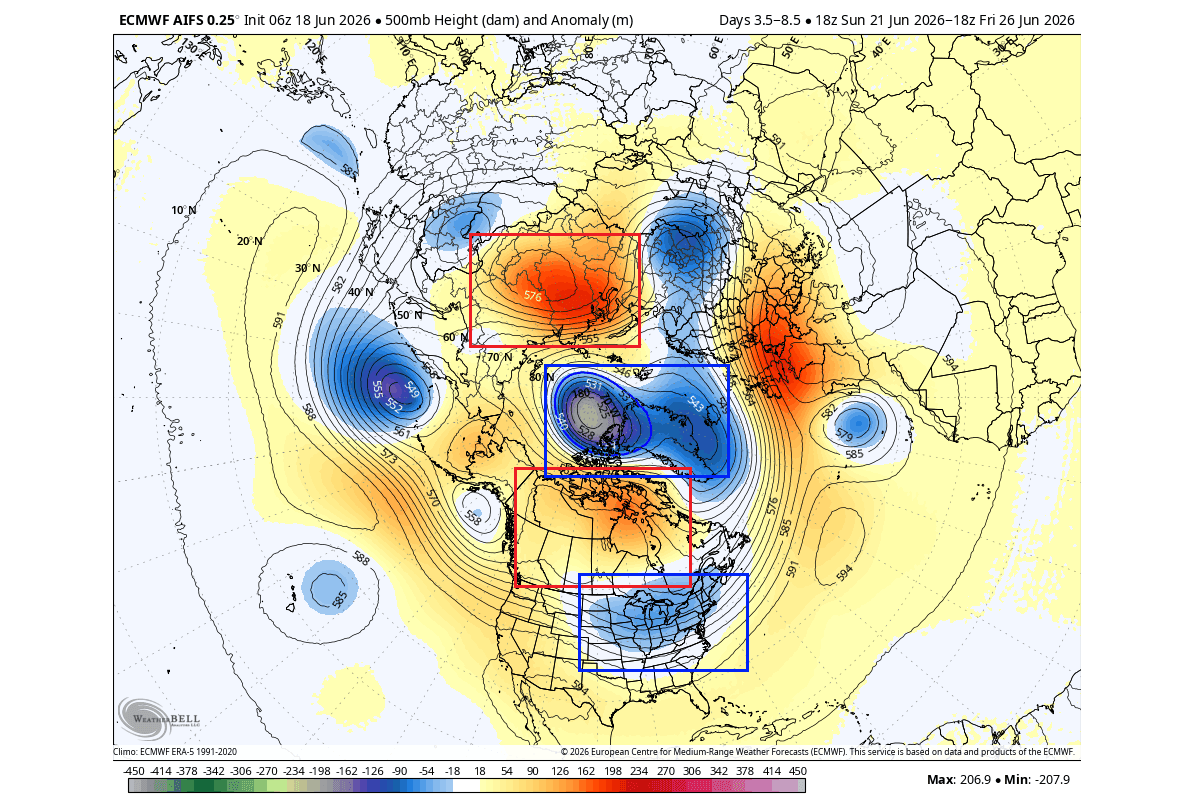
The high-pressure ridge over Canada helps to sustain a low-pressure zone over the eastern United States, creating a more northerly flow. That is evident in the 5-day temperature anomaly forecast below, for next week, with below-normal temperatures across much of the northern, central, and eastern United States and southern Canada.
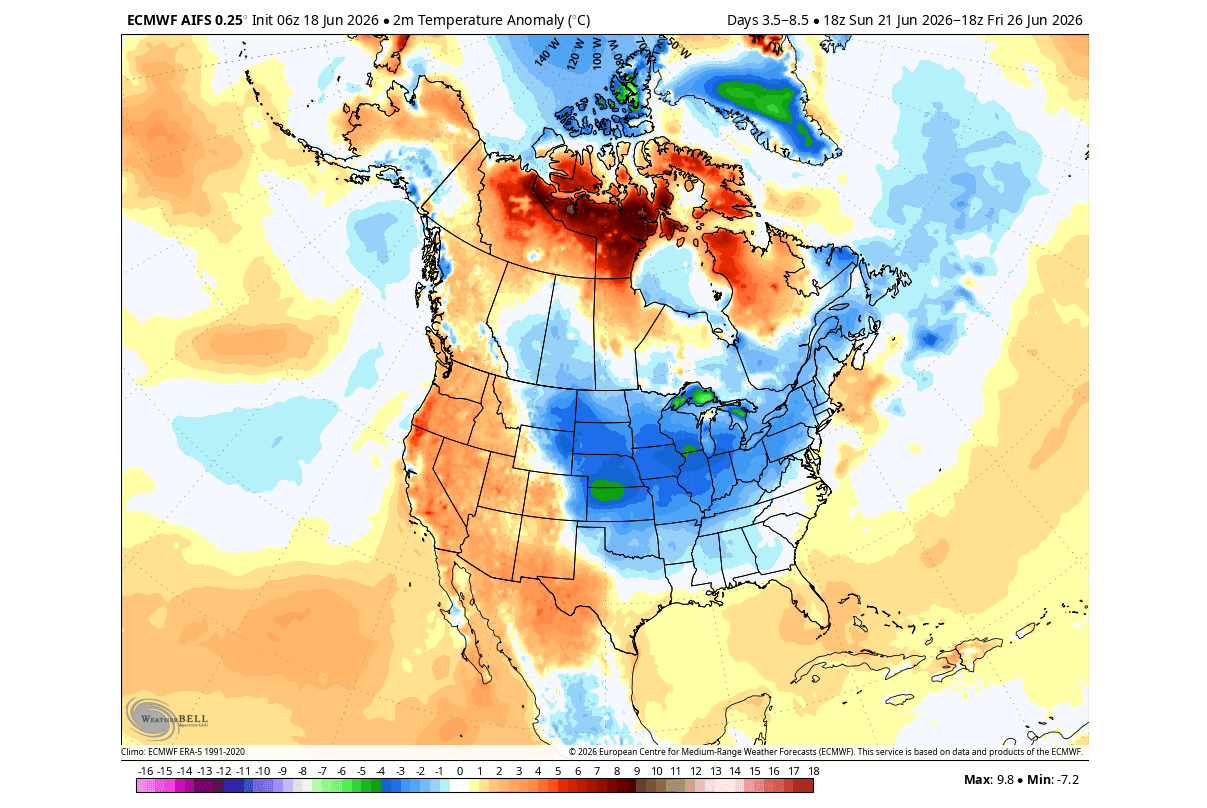
A warm anomaly is forecast over the Canadian Arctic Archipelago and into the Labrador Sea. That will impact the melt intensity in that area, as evident by the sea ice concentration change forecast above.
The true impact on the Polar regions is also seen in the ECMWF forecast below. On the left, we see the zonal wind forecast, which reveals a strong flow into and around the Polar Circle. This is from the proper positioning of the pressure systems around the Polar Circle.
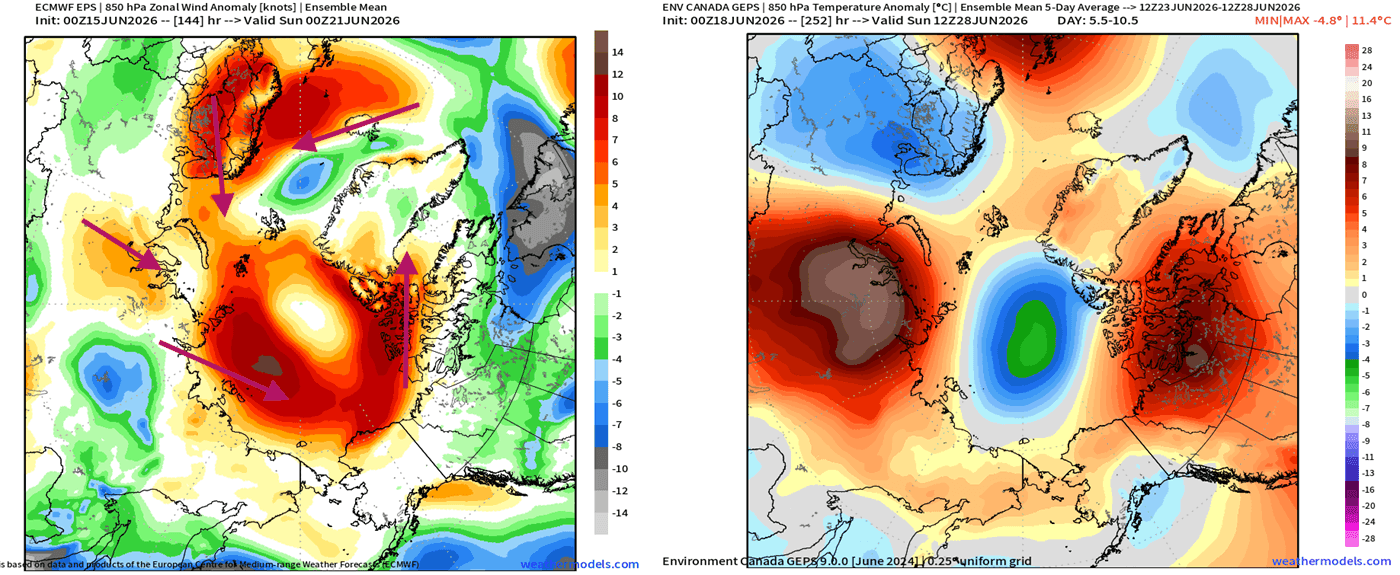
On the right, we see the 850mb (1500m/5000ft) level temperature anomaly, which we use to identify air mass movement and flow. And as you can see, there are two large warm air mass anomalies entering the Polar Region, and one from the Atlantic area. This will boost ice loss in the coming week.
But on a seasonal scale, there are more problems ahead, as a Super El Niño is emerging in the Pacific, and is likely to have an important impact on overall sea ice melt this season, and thus on weather circulation.
El Niño 2026/2027: The Pacific Signal Rapidly Strengthens
El Niño is a warm phase of the ENSO system. This region of the equatorial Pacific Ocean alternates between warm and cold phases around every 1-3 years. El Niño significantly alters tropical pressure and circulation patterns, affecting global weather, especially during a strong event.
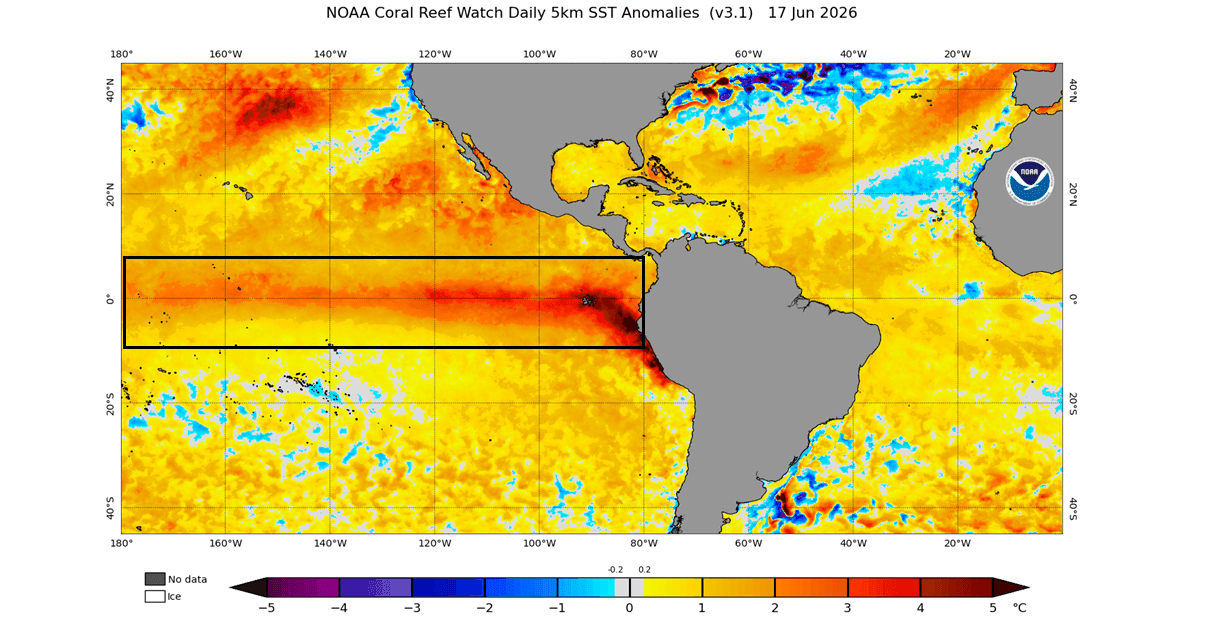
The latest surface analysis below shows the main ENSO region with an already strong warm anomaly. This is the rising El Niño event, which is rapidly evolving, and is expected to reach very strong territory by Fall and Winter.
El Niño is driven by the warmer subsurface ocean waters, also known as the Kelvin Wave, which rises to the surface as a warm anomaly we see. This is visible in the video animation below, which nicely shows the Kelvin Wave development below the surface, revealing clear eastward movement and eventual rise to the ocean surface in the tropical Pacific.
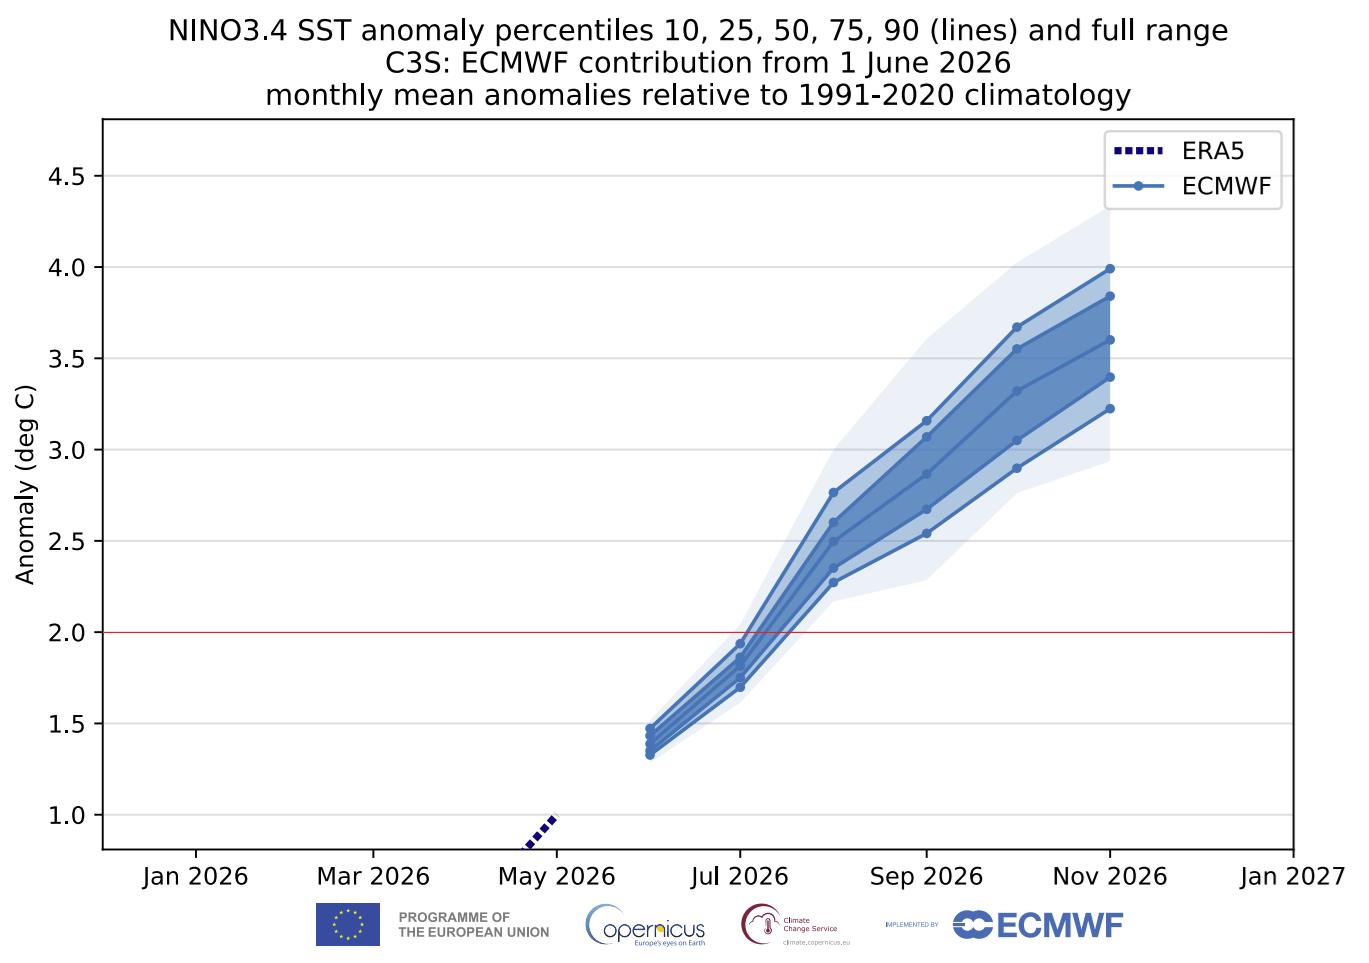
Below is the latest ECMWF ensemble model forecast for the upcoming seasons. It shows a very strong El Niño developing into 2027, easily exceeding the +2 degrees threshold and pushing it into the Super event category. But it goes beyond that, potentially signaling one of the strongest El Niño events in recorded history.
The full idea of this event is seen on the latest NMME forecast for the September-November period, which shows a significant El Niño anomaly across the tropical and northern Pacific. The anomaly values peak across the whole ENSO region above +4 degrees, consistent with the strength of a Super El Niño event.
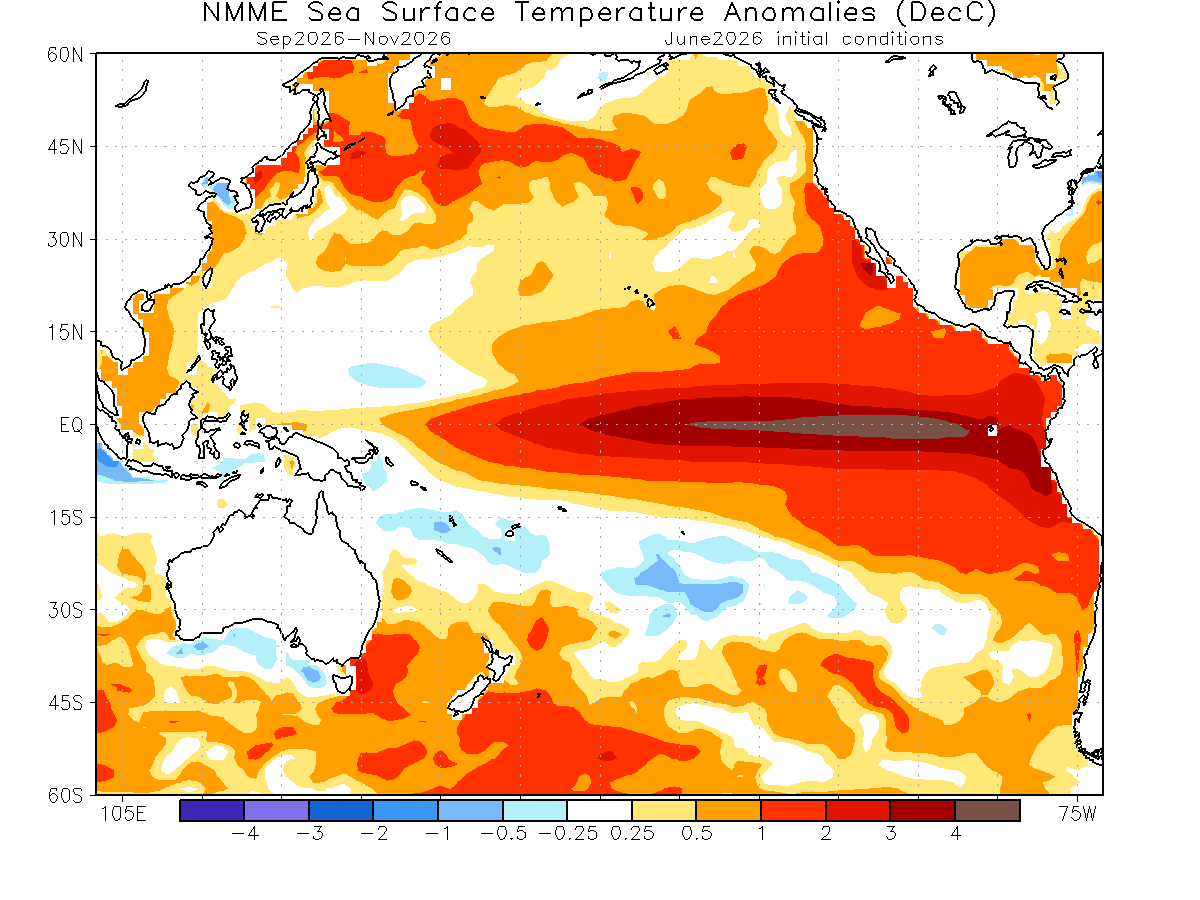
A Super El Niño is officially recognized when sea surface temperature anomalies in the Niño3.4 region exceed a threshold of +2.0 or higher above the long-term average. This is used to identify events of high intensity in which atmospheric coupling is strong enough to shift global weather patterns into a high-impact state.
Below is the NOAA CPC strength probability, which shows the likelihood of a strong El Niño event, peaking in late Fall and early Winter. We can see a very high chance for a Super El Niño event, which is expected to impact the Polar Region too, apart from the usual global disturbance.
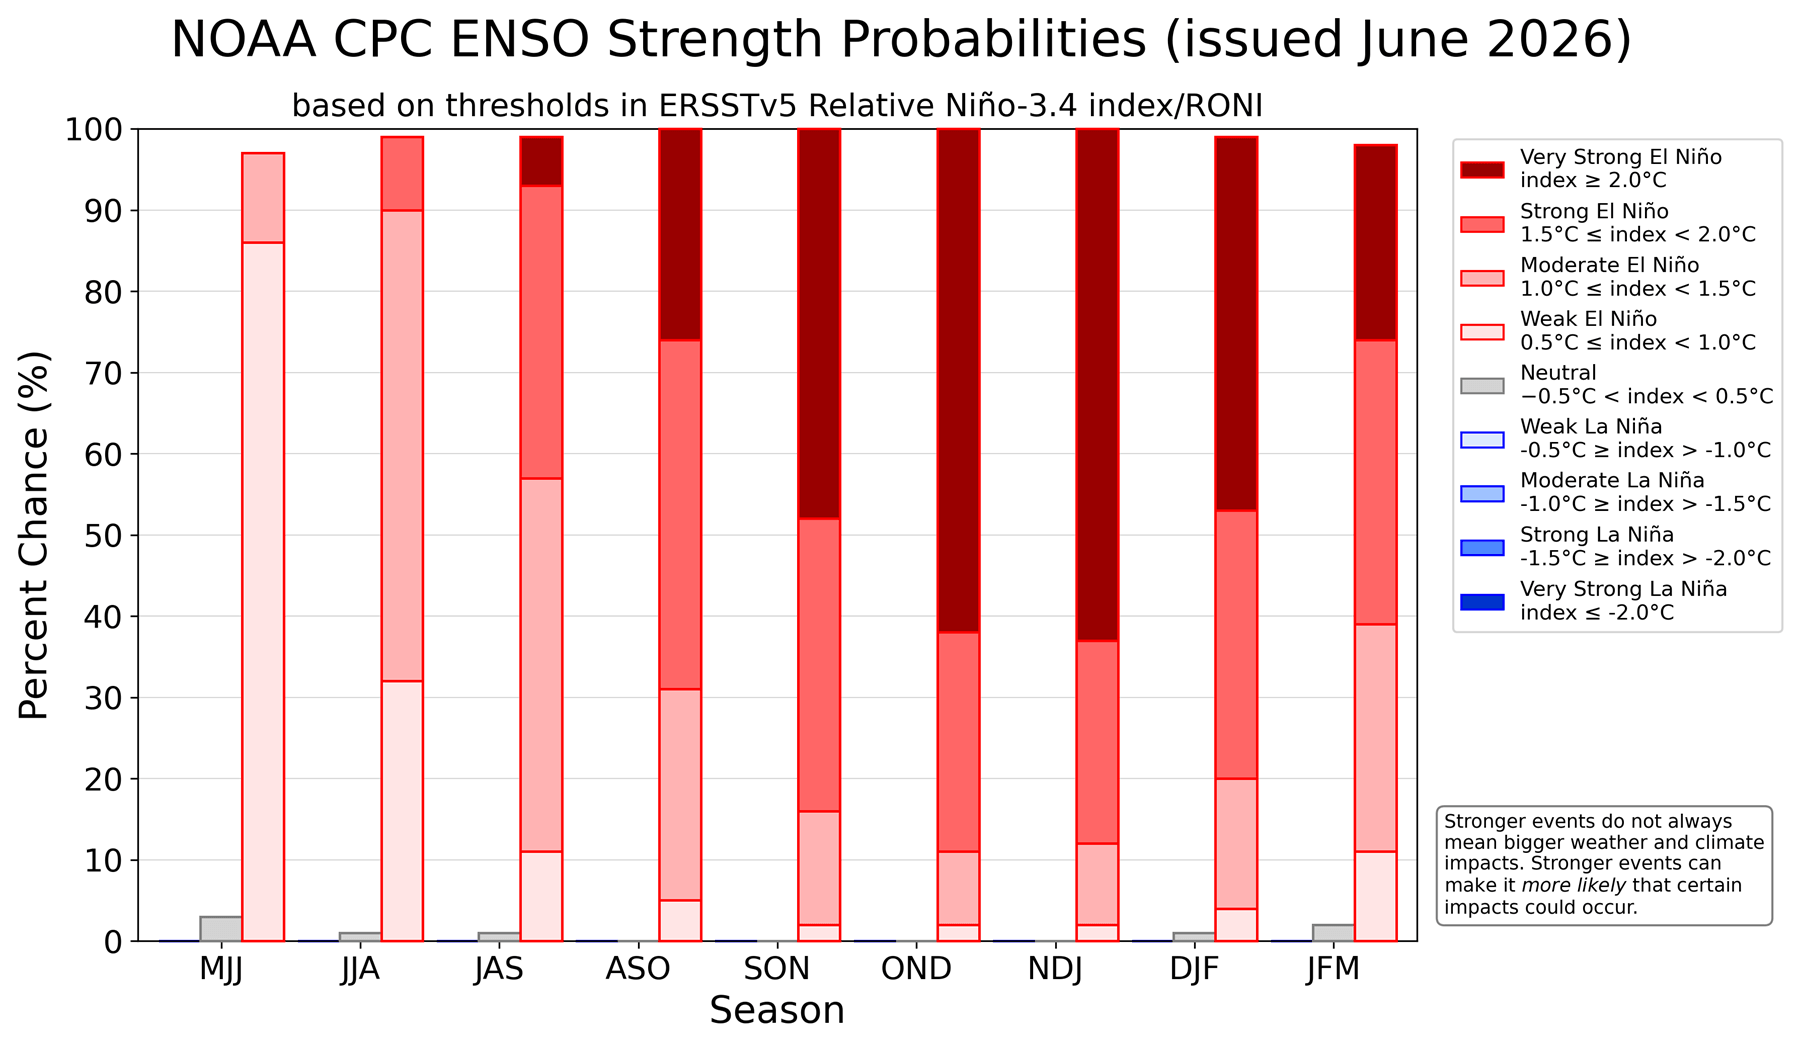
The known impact of a Super El Niño is also on the Arctic sea ice, driven by shifts in global pressure patterns and the resulting warm-air and cold-air transport over the polar regions. But that has a return effect in late Fall and Winter.
Atmospheric Bridge: A Super El Niño versus the Polar Ice Cap
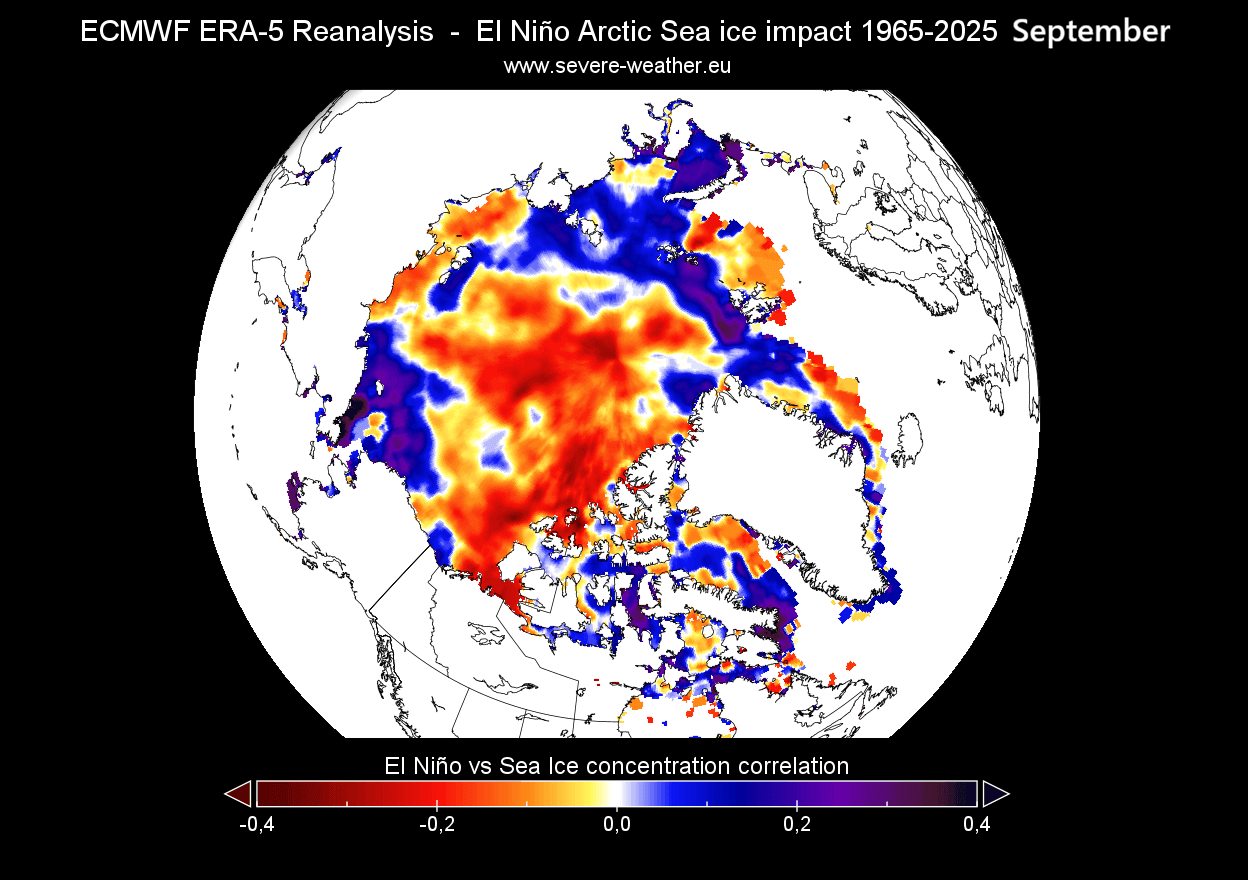
Below you can see the typical El Niño sea-ice impact during September, when sea ice is at its lowest. What it shows is increased melting in the Beaufort Sea and the central Arctic Ocean, the areas that are the actual edge of the September extent in recent years.
In the image below, there are two side-by-side plots. On the left is the historical Pressure pattern that tends to bring the lowest sea-ice extent in September: two strong low-pressure areas sit on each side of the Arctic, acting like pumps to push warmer southerly flow into the Polar Circle.
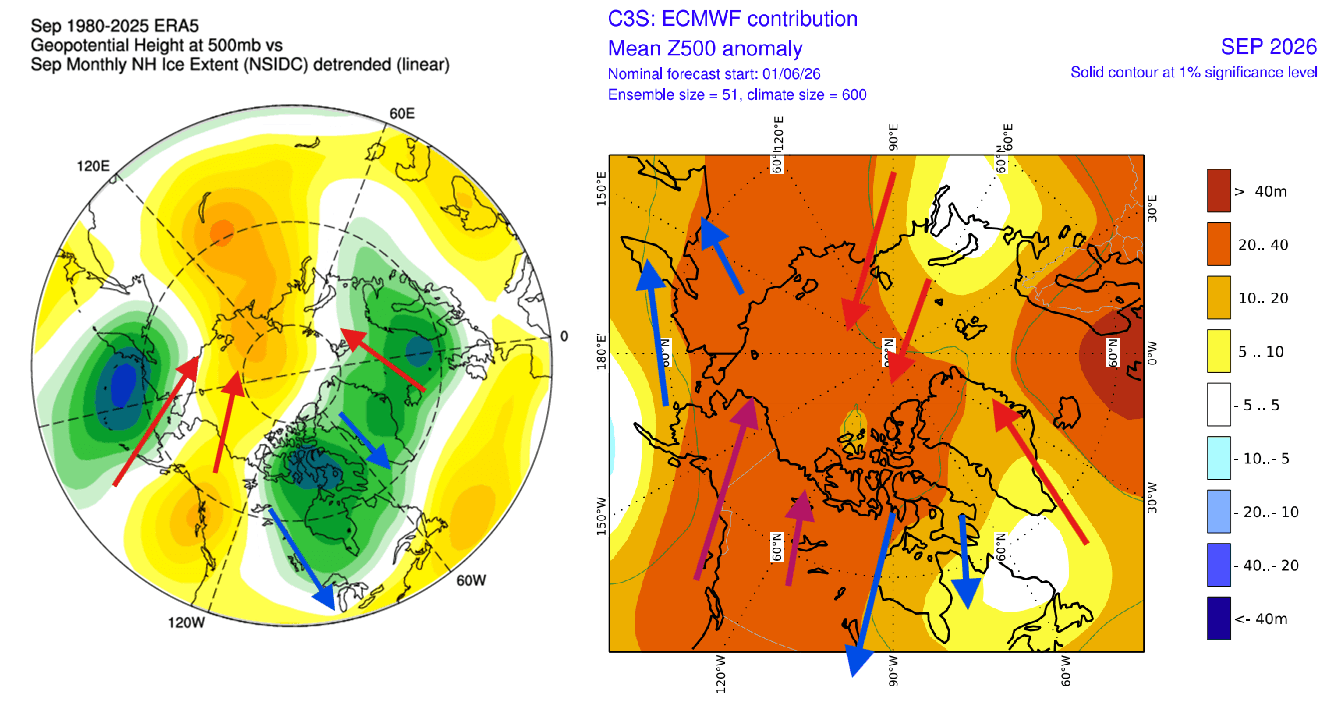
On the right, we have the latest ECMWF forecast for September. It shows almost an identical idea, with a warmer flow on both sides of the Arctic Ocean. Just like the analysis on the left, we see a high-pressure zone over the western Arctic and a low-pressure zone over the Atlantic side.
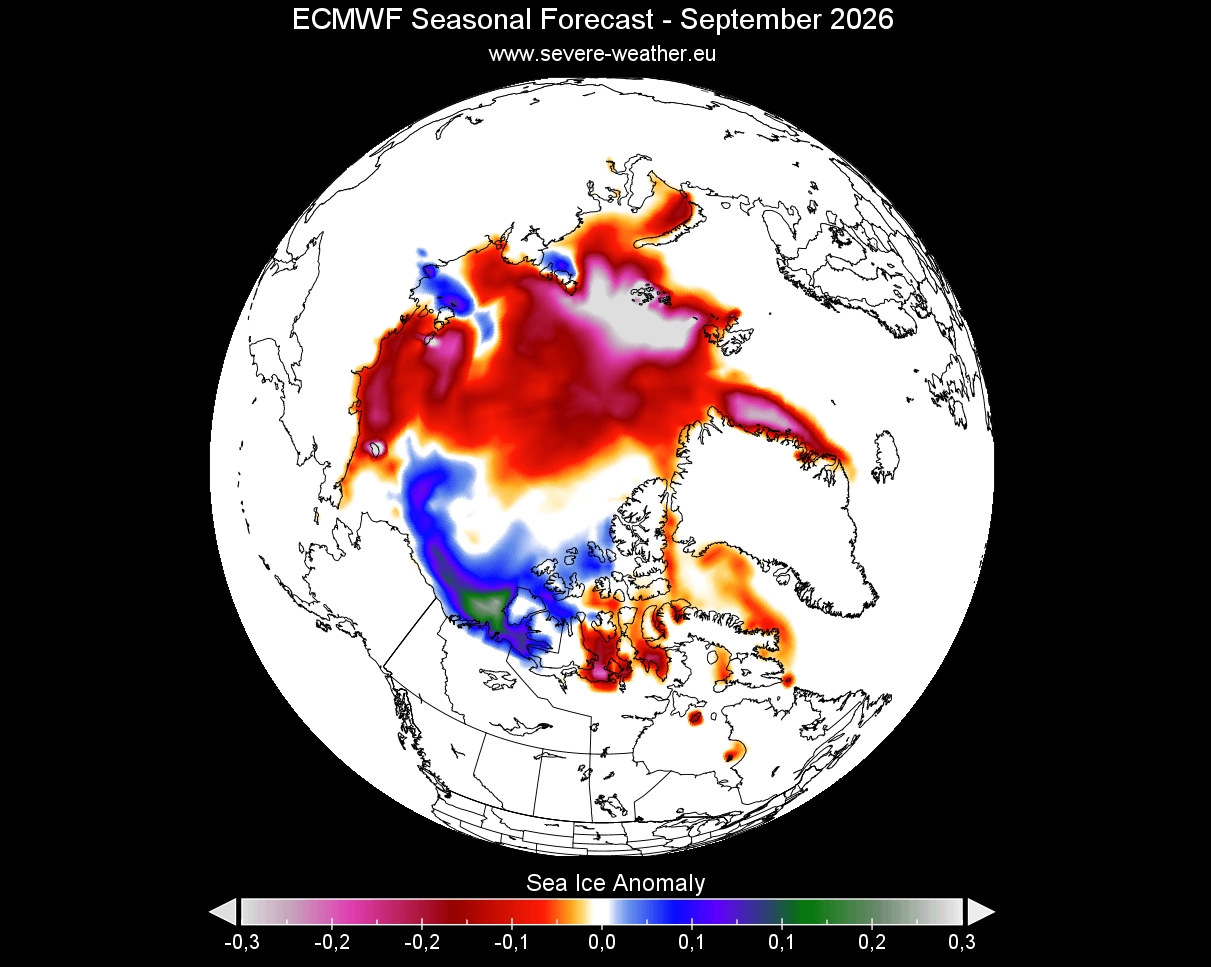
If we look at the ECMWF forecast of the September sea ice anomaly, we can see a strong melt season over most of the Arctic region. This is especially significant in the outer regions, as expected. The only area of relief seems to be over the Beaufort Sea.
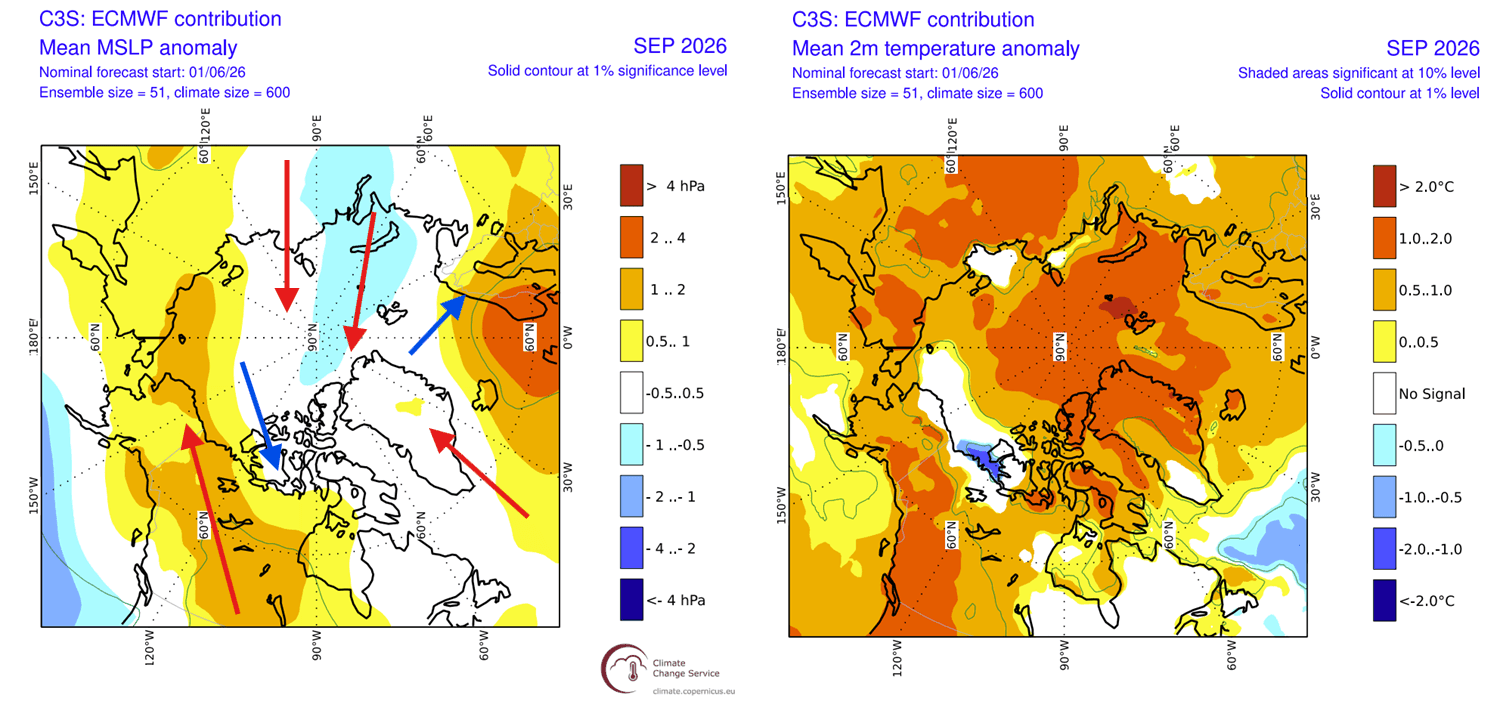
The sea-level pressure (MSLP) forecast also explains why current predictions support a strong melt season. You can see a low-pressure area indicated over the North Pacific and one over Siberia. This helps drive warmer airflow into the Arctic, as confirmed by the temperature forecast on the right side, with a strong anomaly into the Polar regions.
There is one final missing ingredient that links together the El Niño, the Polar ice cap, and the Winter weather: the Polar Vortex.
Polar Vortex: Where Sea Ice and El Niño Connect for Winter
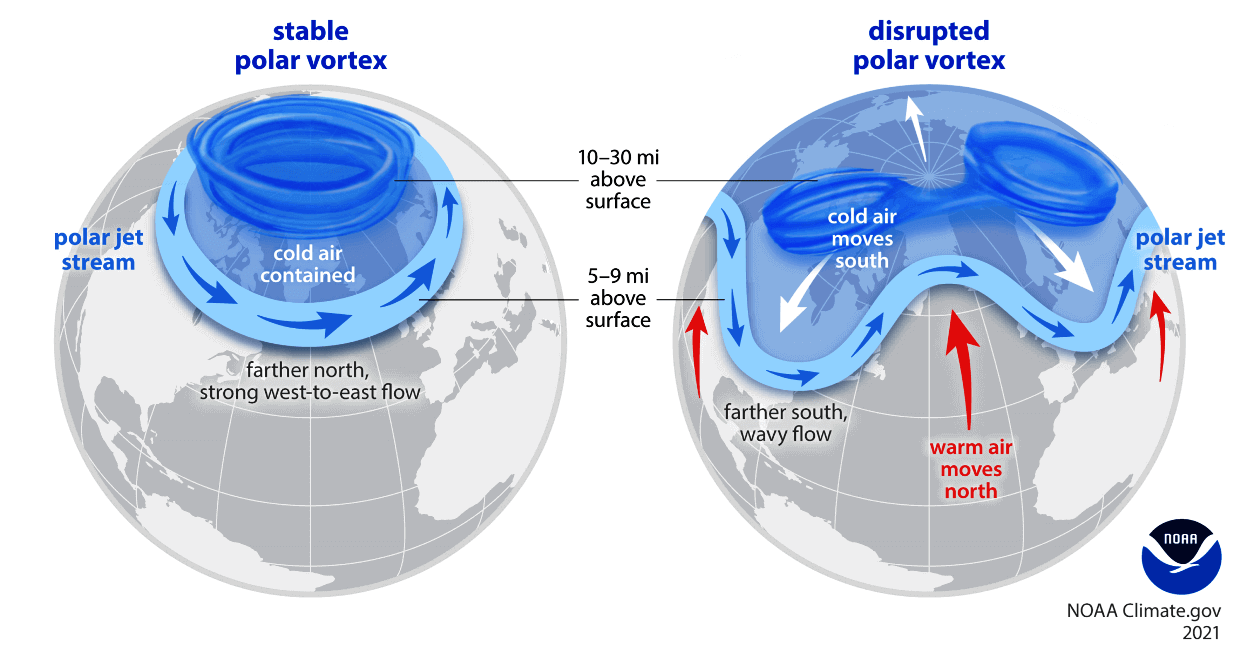
Polar Vortex is the broad winter circulation over the northern (and southern) hemispheres. You can imagine it as a spinning wall over the polar regions, rising from the surface into the stratosphere (over 50km/30 30miles high), trapping the cold polar air inside.
A strong/stable Polar Vortex can lock colder air into the polar regions, preventing it from spilling out into lower latitudes. This creates milder winter conditions for most of the United States and Europe.
But when the Polar Vortex is disrupted or collapses, it can no longer contain cold air, releasing it outward toward the mid-latitudes. This allows the cold air to spill into the United States and other mid-latitude regions. Below is an example of how a disrupted Polar Vortex releases cold polar air into the United States and Europe.
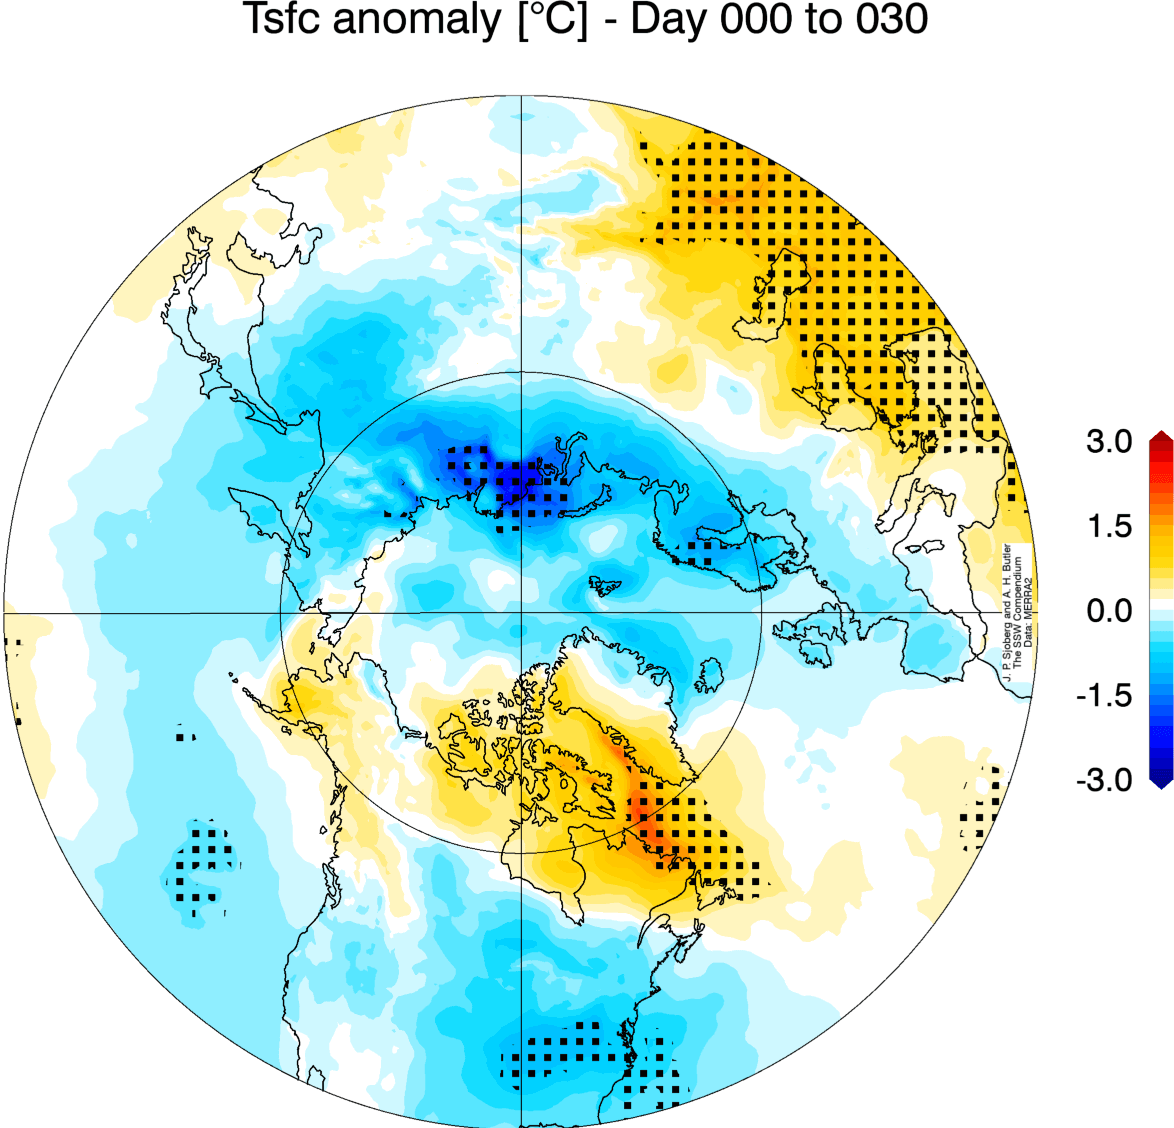
Below is the average temperature of 0-30 days after a Polar Vortex collapse, also known as a Stratospheric Warming event. This shows that most of the United States and parts of Europe are typically colder than normal after an strongly disrupted Polar circulation. But note: Each stratospheric warming event is different and does not automatically mean a strong winter pattern.
We saw an example of this event in late January, seen in the 3D analysis below. High-pressure areas with stratospheric warming waves compressed the Polar Vortex, elongating its structure. This caused the lower parts to push the lower core into North America, allowing a strong northerly flow with an Arctic airmass to spill into the United States, Canada, or parts of Europe.
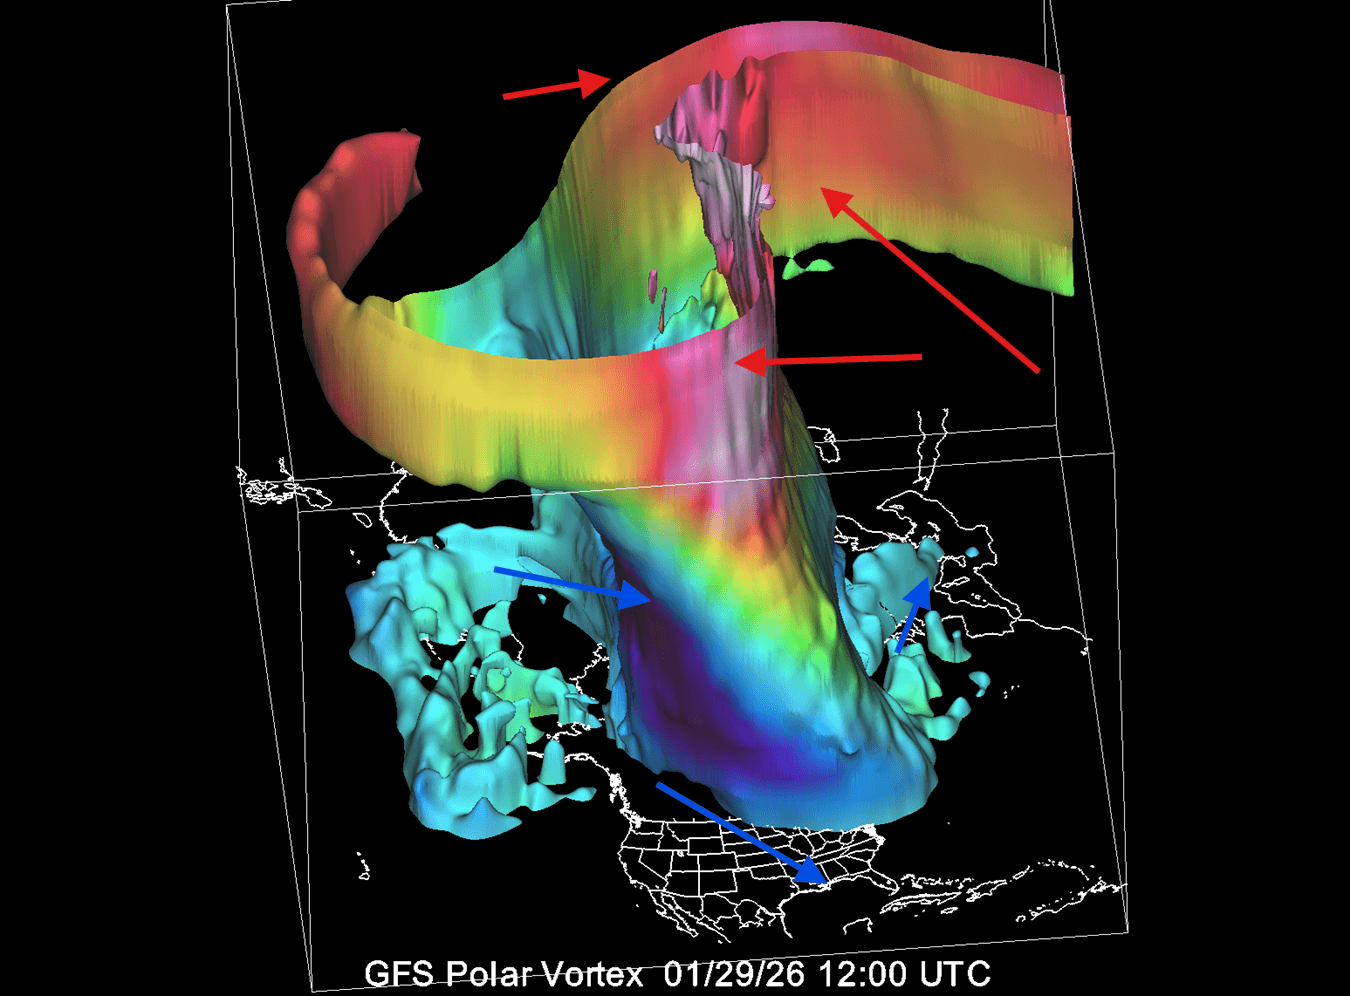
We have seen several such cases during the past winter, resulting in unseasonable cold events across the United States and Canada.
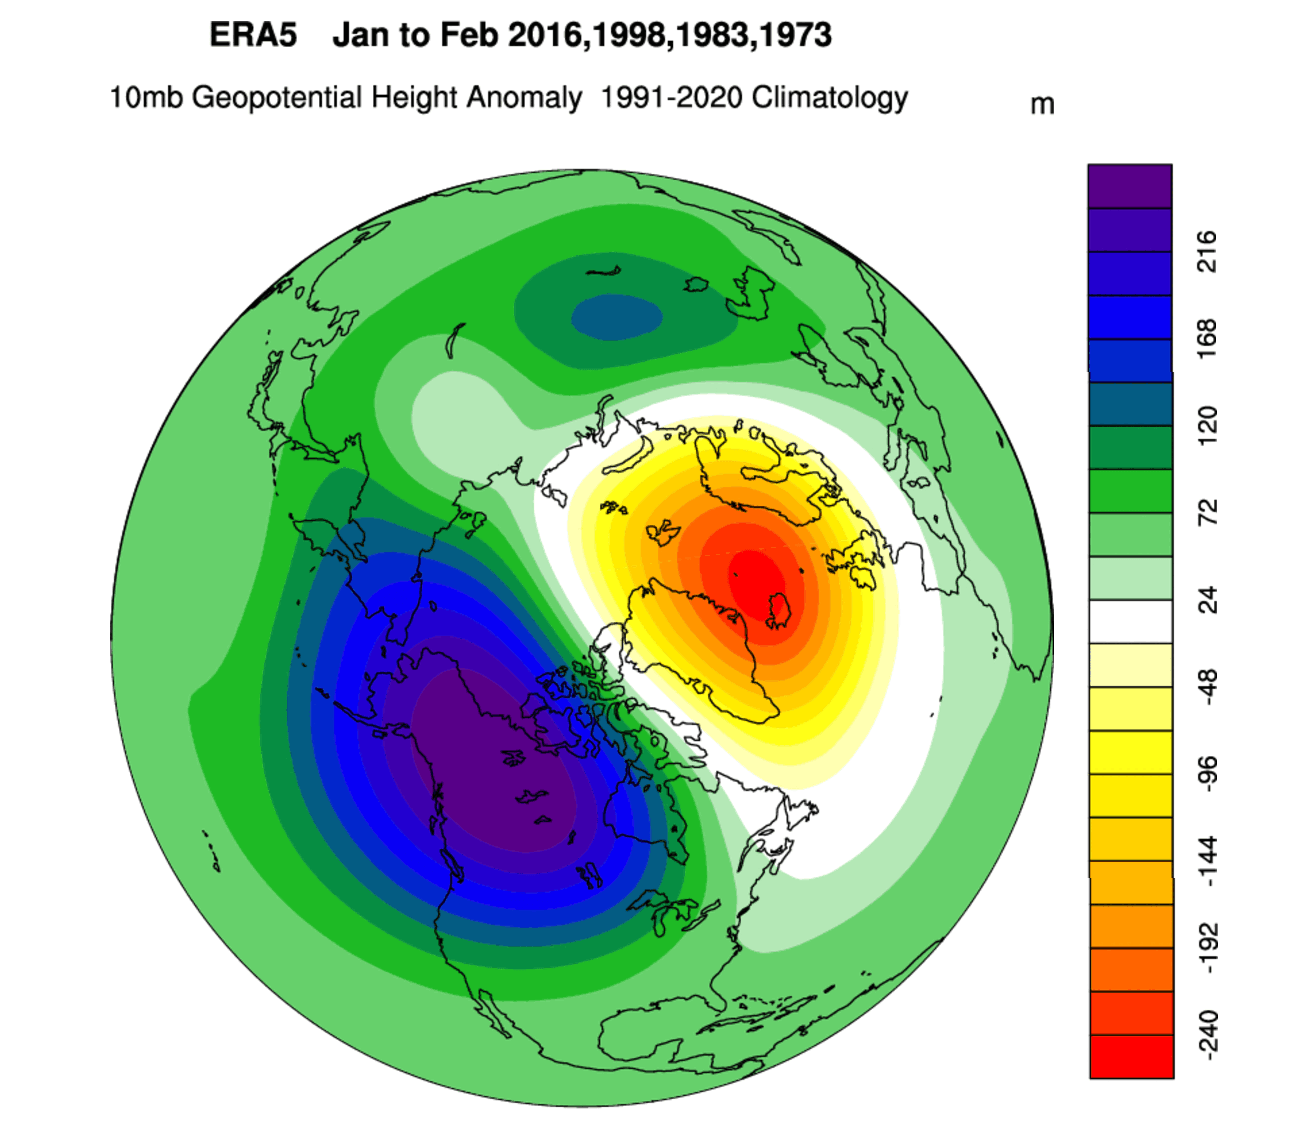
Below is a long-term analysis of the stratospheric pressure anomaly during Super El Niño winters. You can actually see that in Super El Niño winters, the Polar Vortex is weaker, and its core is disrupted by a stratospheric high-pressure area. This is one of the disturbances that can affect the weather lower down in the Atmosphere.
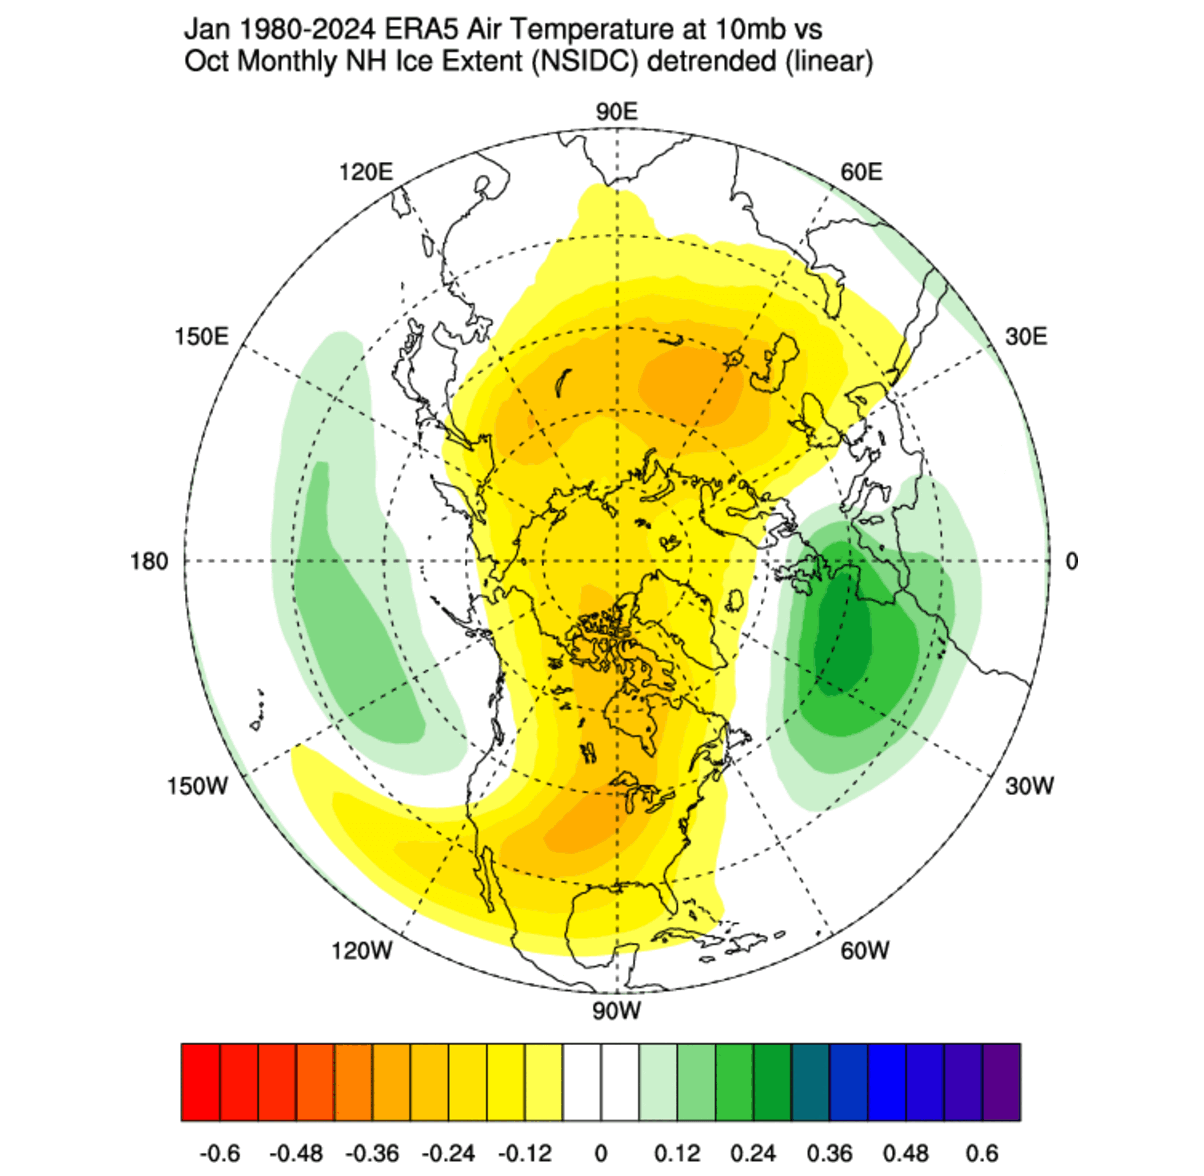
In the image below, you can also see the signs of connection between low sea-ice Fall and the following mid-winter stratospheric temperatures. It is clear that the lowest sea-ice years favor a warmer stratosphere, increasing the likelihood of a Stratospheric Warming event and a disruption of the Polar Vortex.
This confirms that low sea ice extent combined with an El Niño can trigger a response in the Polar Vortex. It usually makes it weaker, which can result in a colder winter in Canada, the United States, and Europe.
We will keep you updated on the global weather pattern development, so don’t forget to bookmark our page. Also, if you have seen this article in the Google App (Discover) feed, click the like button there to see more of our forecasts and our latest articles on weather and nature in general.
Don’t miss:
NASA Detects a Major Pacific Sea Level Rise as Super El Niño Rapidly Strengthens