Early data shows that the Polar Vortex is likely to be weaker than normal in the Winter of 2024/2025. A weaker Polar Vortex usually means a weaker jet stream, which increases the chance of a more dynamic (colder/snowy) Winter pattern over the United States, Canada, and/or Europe.
We can already see how some of the large-scale global factors are developing. Knowing how they change seasonally and how they shape our weather, based on past data, can give us important insight into the future.
Based on the overall state of the major global factors, we can see how they are projected to evolve and what this means for the overall large-scale winter circulation. We will look at each of these factors, but first, we will quickly look at why the Polar Vortex is so important in this story.
POLAR VORTEX OF THE NORTH
To understand what the Polar Vortex is, its usually the best to visualize it. In simple terms, it is just a name that describes the broad winter circulation over the northern (and southern) hemispheres.
Below, you can see a 3-dimensional image of the polar vortex. The vertical axis is greatly enhanced for better visual presentation. It nicely shows the actual structure of the polar vortex, connecting down to the lower levels, the pressure systems, and the winter weather patterns.
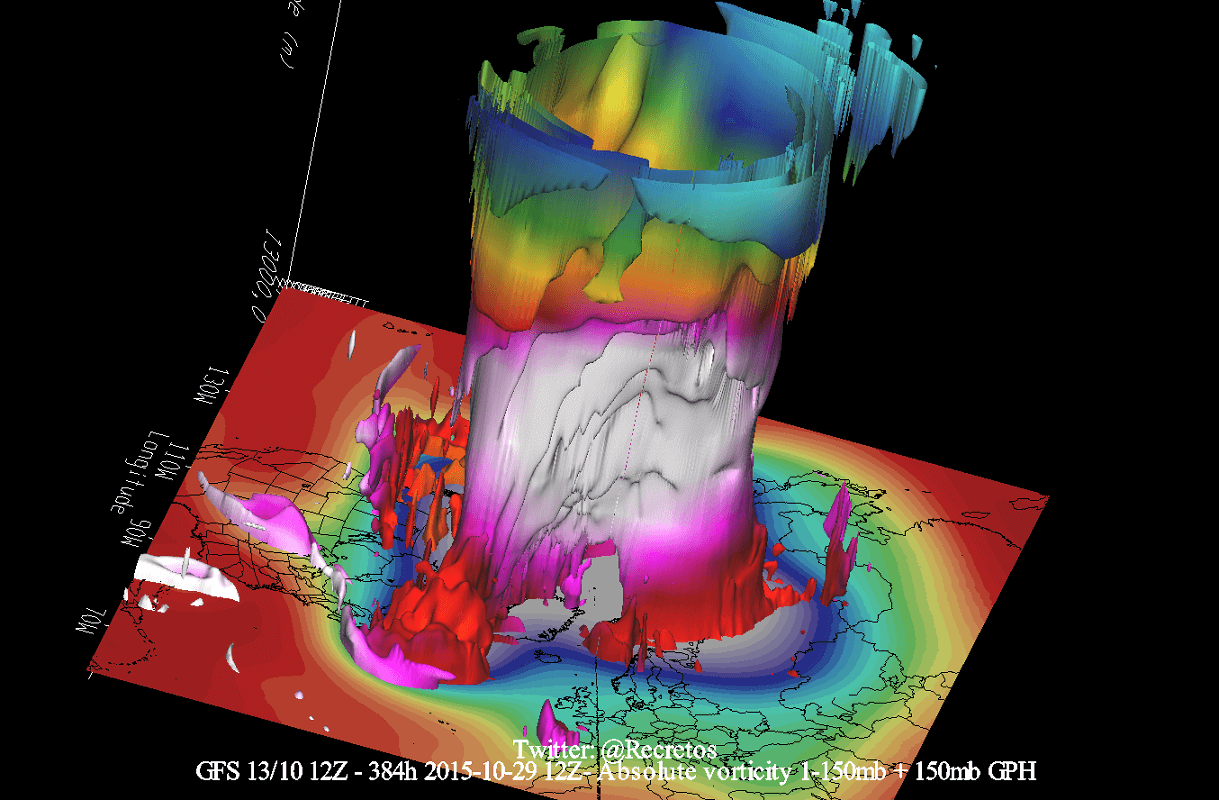
The Polar Vortex extends high into the atmosphere. The lowest level is called the troposphere, where all weather events occur. But above that, we have the Stratosphere, a deeper and drier layer that is home to the ozone layer.
For this reason, we separate the entire Polar Vortex into an upper (stratospheric) and a lower (tropospheric) part. They both play their role differently, so we monitor them separately. But it is also very important if they are properly connected. Image by NOAA-Climate.
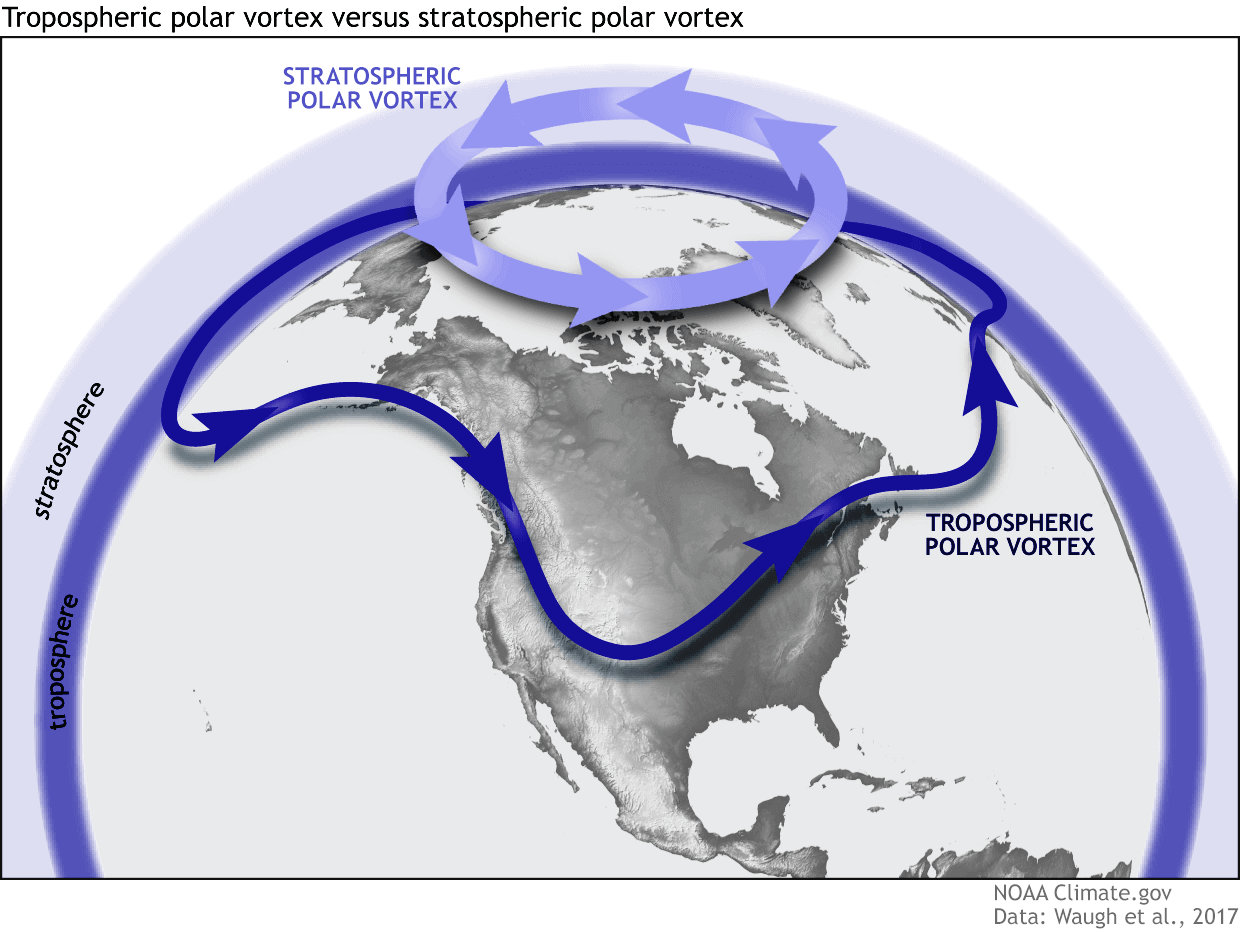
The upper (stratospheric) part is more circular and symmetrical as it spins higher above the ground, with fewer obstacles in its flow.
But, the lower structure of the Polar Vortex is much more uneven and regularly disrupted. That is due to the influence of the terrain/mountains and strong pressure systems acting as obstacles.
The Polar Vortex behaves like a very large cyclone, covering the whole north pole down to the mid-latitudes. It is connected through all atmospheric levels, from the ground up, but can have different shapes at different altitudes.
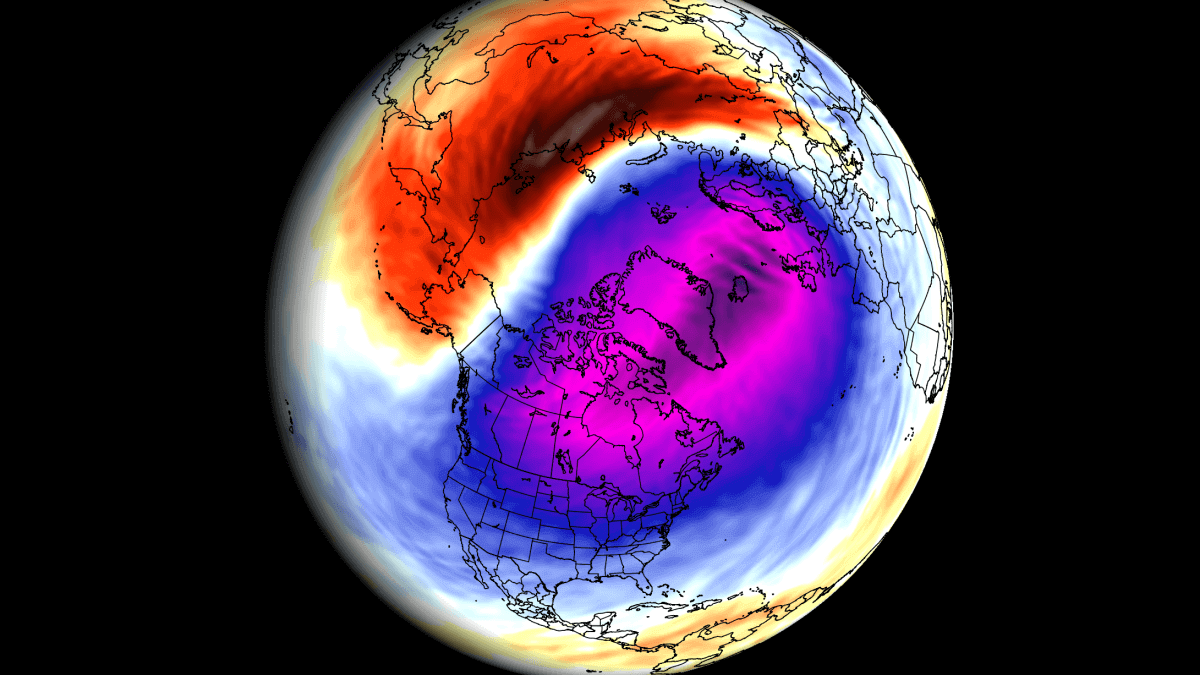
To put the Polar Vortex into perspective, we produced a high-resolution video below, showing the Vortex spinning over the Northern Hemisphere in the Stratosphere at the 30mb level, around 23km/14miles altitude.
The video mainly shows that the Polar Vortex is not just one winter storm or a cold outbreak that moves from the Midwest into the northeastern United States. It is a powerful large-scale circulation.
We must monitor the state of the Polar Vortex, as it can have a profound impact on our daily weather. We mainly separate the Polar Vortex into two different modes:
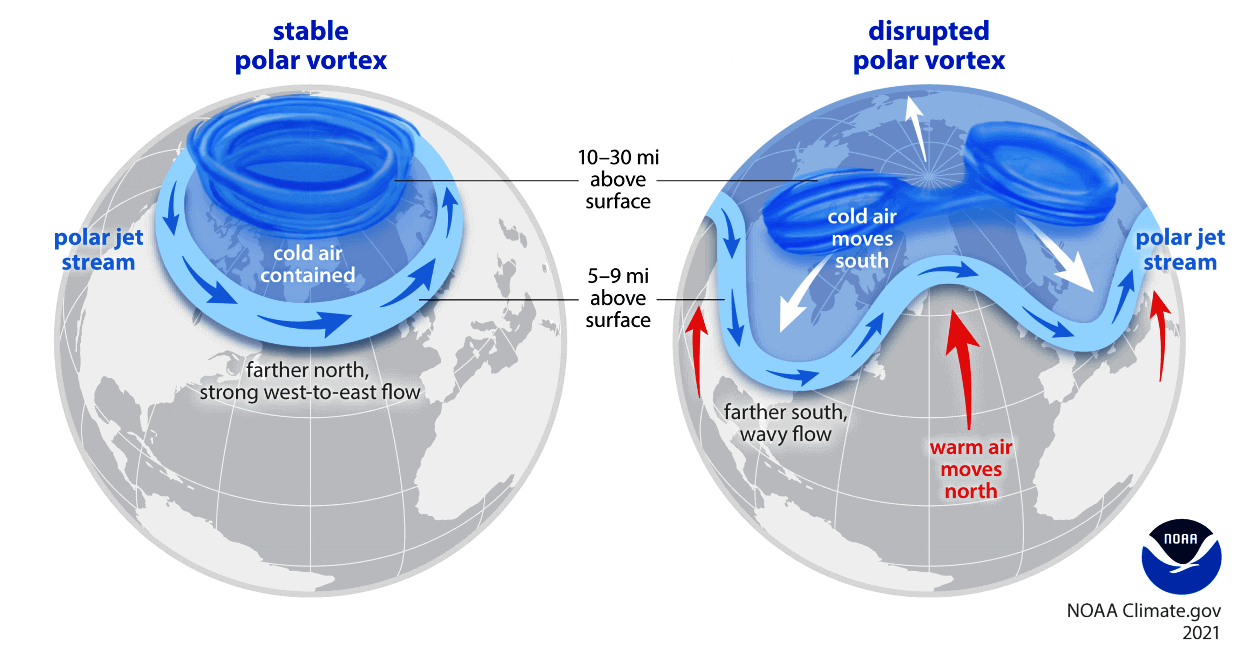
A strong/stable Polar Vortex usually means strong polar circulation and jet stream. This contains the colder air into the Arctic Circle, creating milder conditions for most of the United States.
In contrast, a weak/disrupted Polar Vortex creates a weak jet stream pattern. As a result, it has a harder time containing the cold air, which can now escape from the polar regions into the United States. Image by NOAA.
So, if you want a colder and snowier Winter, your best bet is a weak Polar Vortex. In nature, a weak Polar Vortex essentially means a breakdown of the stratospheric Polar Vortex.
That is usually achieved by increasing the pressure or temperature in the polar Stratosphere. We call such events “Sudden Stratospheric Warming”. As the name suggests, it is a rapid temperature increase in the Stratosphere.
But not every disruption event is a major Stratospheric Warming event. Even smaller disruptions can influence the Polar Vortex and the winter weather at the surface. And there are many ways that the Polar Vortex can be weakened.
This year, we are looking at three factors that have a known impact on the Polar Vortex:
- ENSO – La Niña
- QBO – Stratospheric winds
- Solar Cycle/Maximum
We will quickly cover each factor, starting down low on the ocean, going up into the atmosphere, and finishing even higher with the Sun and its importance.
STARTING AT THE SURFACE
The first factor is the ENSO, which is short for “El Niño Southern Oscillation.” This region of the equatorial Pacific Ocean changes between warm and cold phases. Typically, there is a phase change around every 1-3 years.
The cold phase is called La Niña, and the warm phase is called El Niño. We are currently coming off a warm phase, with the cold La Niña being forecast to emerge in the coming weeks.
Below is the ocean temperature forecast for late summer and early autumn from the NMME model. You can see an area of cold anomalies over the tropical Pacific, which is the forecasted La Niña. It is expected to last into the winter 2024/2025.

Historically, a La Niña winter has around a 60-75% chance of producing a Stratospheric Warming Event (SSW). It has produced them in the past and also in the more recent winters. The image below shows the typical SSW event frequency by month and by the ENSO event.
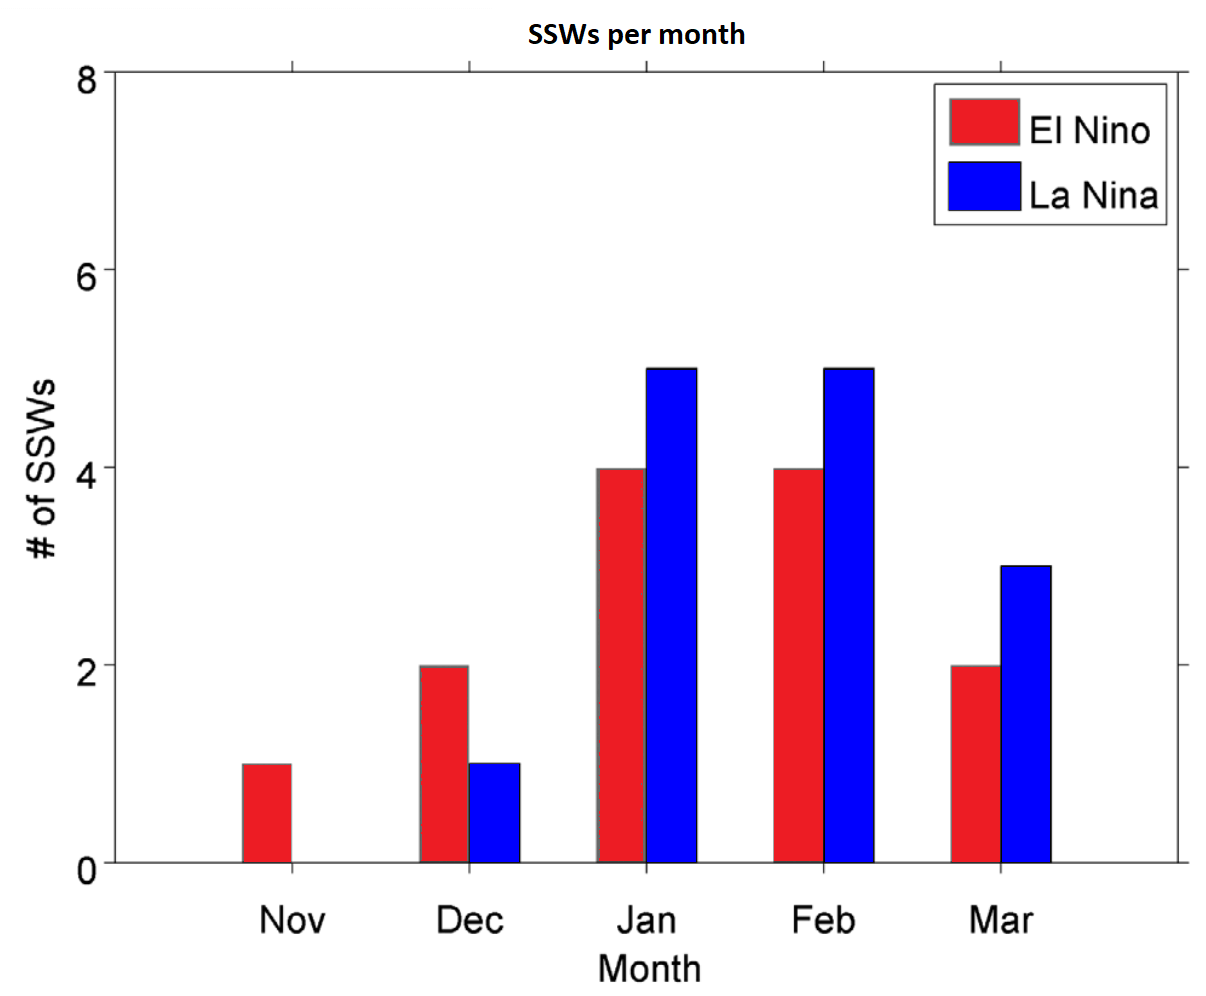
As you can see, a La Niña phase has a higher chance of producing a Polar Vortex collapse event. It also produces one a bit later in Winter, compared to an El Niño. Overall, this means that a La Niña event is not favorable for a strong Polar Vortex, at least on average.
Below is an image that shows typical winter pressure anomalies over the western hemisphere for each ENSO phase. The third example shows the best pressure pattern to weaken the Polar Vortex and start a warming event in the stratosphere.

As you can see, the typical La Niña pattern is overall a bit more favorable for a weakening event of the Polar Vortex. This means that it can be easier for winter weather patterns to be disrupted and bring colder weather and snow to the United States and Europe.
This is just the first factor that currently hints at the potential of a weaker winter circulation. For the next one, we have to go up into the atmosphere.
ATMOSPHERIC WIND ANOMALY
Just like in the ocean, we again have a region that alternates between a positive and a negative phase. But instead of temperatures, we are now dealing with winds or their direction. This is called the Quasi-Biannial Oscillation, or simply QBO.
The QBO is a regular variation of the winds high above the equator in the Stratosphere, alternating between easterly and westerly (zonal) winds. Strong winds in the stratosphere travel in a belt around the planet at the equator. And around every 17 months, these winds completely change direction.
Below, we have a graph that shows the zonal wind anomalies over the Equator for the past 40 years at around 24km/15mi altitude. It nicely shows just how regularly this wind shift really is. It is like watching a heartbeat of the atmosphere.

Looking more closely at the past 3 years, we can see how each phase descends over time. A negative/easterly phase was active in 2021, and a westerly in 2022/2023. It was followed by another negative QBO phase last winter. Currently, a new westerly phase is descending from above. The image below is from NASA analysis.

A radiosonde analysis from Singapore also shows the wind direction above the tropics. It reveals the easterly winds around the 15-50mb level, confirming the west QBO phase is currently active. It is in the early stages, and will continue to strengthen as it descends down.

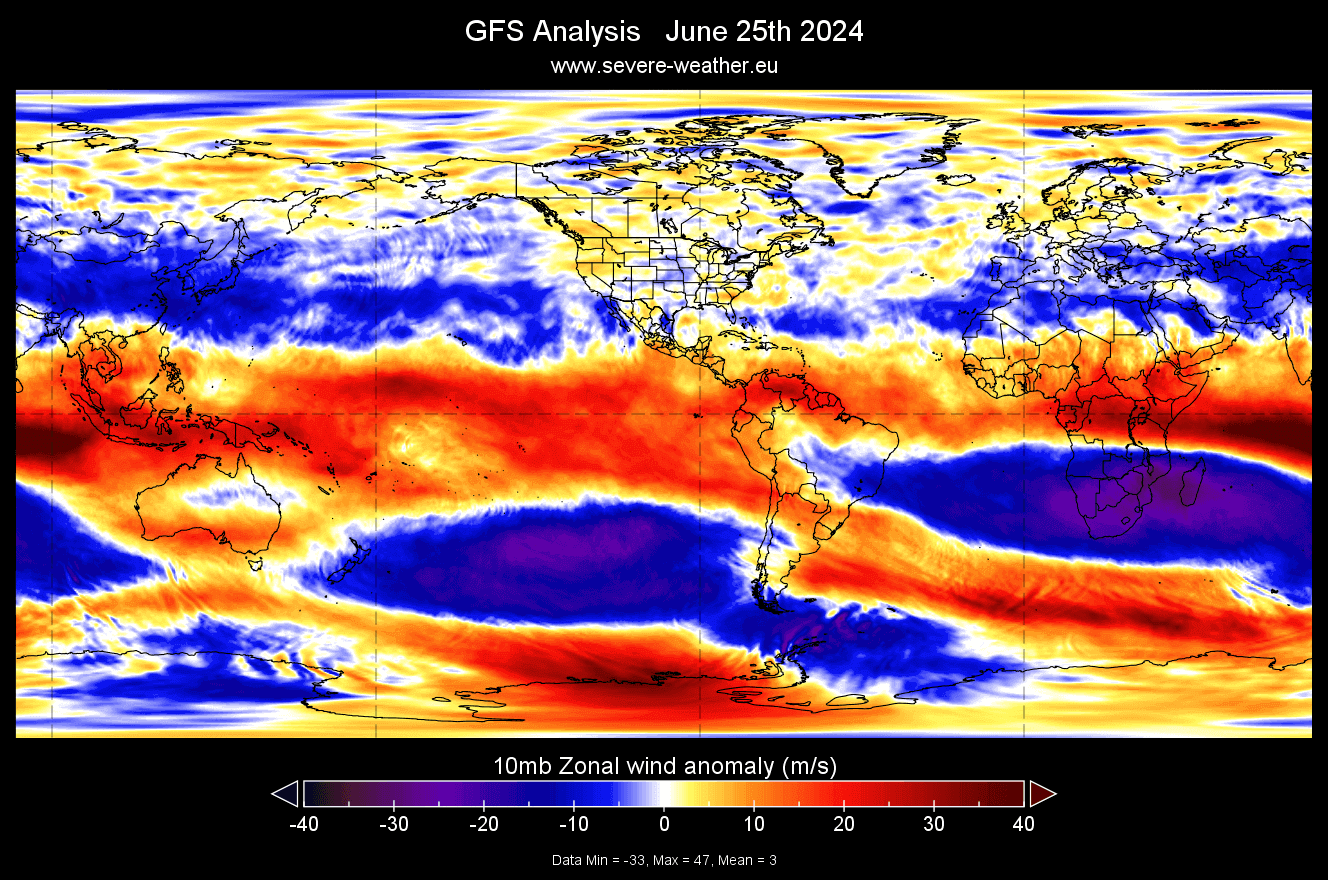
Looking at the latest zonal wind analysis at 10mb level (32km/20miles), we can see the westerly winds over the equator. This is the west/positive phase of the QBO that is expected to evolve further and descend as we head into late fall and winter.
There is more than one reason why/how QBO can influence our Winter weather. One very important aspect is, of course, the polar vortex, which is why we even talk about the QBO in this article. The image below shows the connection between the QBO and the polar vortex in the December-January winter period.

It might seem complicated, but its not. The main takeaway is that the QBO is deeply connected into the atmosphere, and helps with the overall tropical forcing, including the ENSO. You could say that it can also help with the “communication” between the ocean and the Polar Vortex.
That is why one QBO phase does not mean a fixed weather situation, as a west QBO response can be different during a La Niña or an El Niño. So, it is crucial that we look at the global weather system as a whole.
Being over the Equator, the QBO is directly connected to the higher levels of the atmosphere and solar activity. For this reason, we are now heading outside of our planet to look at the latest solar activity and how it connects with everything we have talked about so far.
SOLAR CYCLE 2024
Each solar cycle lasts 11 years and is actually a cycle of the Sun’s magnetic field. The Sun goes through a magnetic pole reversal, flipping north and south magnetic poles. That causes all kinds of activity and anomalies in the Sun’s magnetic field, which can be easily observable on the Sun’s surface as an increase in sunspot numbers.
We can see an example of a full solar cycle in the image below, as the sun goes from a minimum to maximum activity and back to a minimum.

Below we can see the solar cycles through the last decades. The solar cycle is observed by the total sunspot numbers (SSN). We reached a final minimum of the solar cycle 24 in 2020, and we began a new solar cycle 25 at that point. Notice how the last two solar cycles are generally weaker compared to the earlier ones.

Looking closer at the last few years, we can see that the solar activity picked up again, now entering a new solar maximum. Compared to the forecast, the current solar cycle/maximum is stronger than initially expected. So, how does the solar maximum play into the Polar Vortex and the winter weather patterns?

In the image below, we see a simulation from a recent study. It shows the simulated QBO phases descending over time, as we showed you above. But it is nicely seen how it can change with the Solar Cycle. As the solar cycle reaches a maximum, so changes the amplitude of the QBO, which has a known connection to the weather.
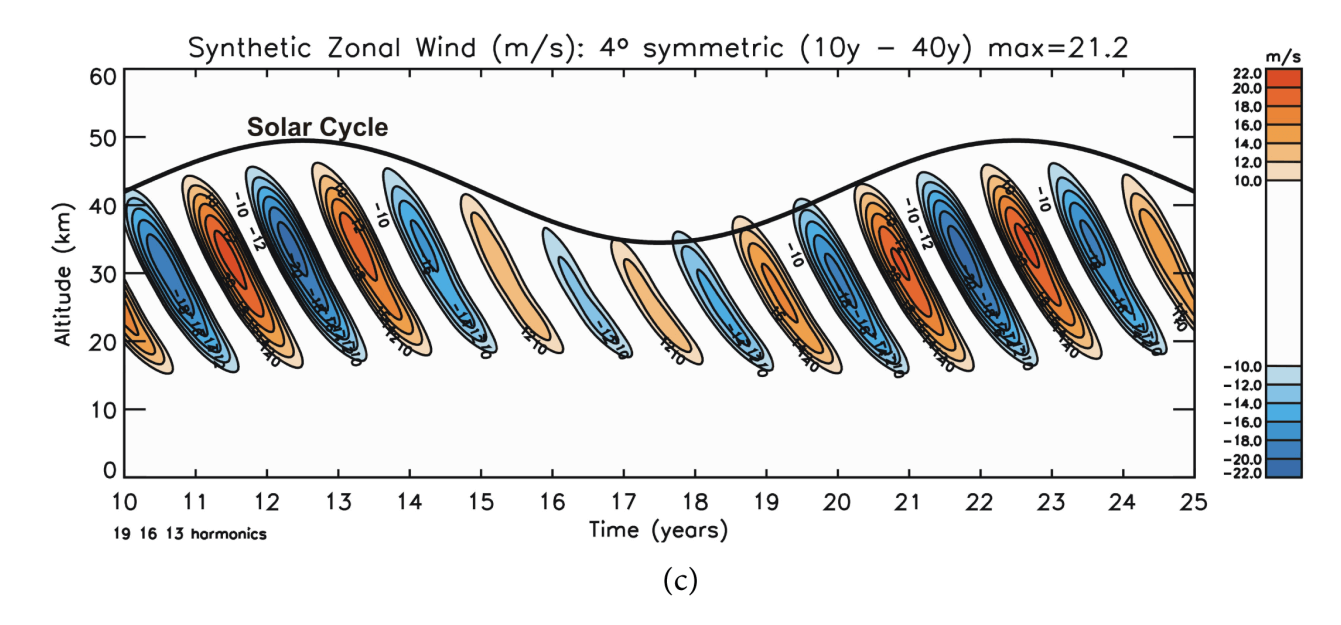
To explain in simple terms, this is beacause the QBO does reach high into the tropical atmosphere and is under the direct influence of the solar input,.
Below is an image from a study that looked into the solar cycle, QBO, and the polar vortex. It shows that the combination of a solar maximum (Smax) and a westerly QBO (wQBO) is most favorable for a disrupted or weaker polar vortex. We also have both of these conditions for the 2024/2025 weather season.

The image above by Charles D. Camp and Ka-Kit Tung from the Department of Applied Mathematics,
University of Washington, Seattle.
So, despite each of these three factors being in its own “elemental plane” of existence, they all nicely connect and work together.
The connection to our weather is through the Polar Vortex, which can be either strong, weak or even fully collapsed. All states of the Polar Vortex have a different impact on our daily winter weather.
Based on all the data and forecasts that we presented, the Polar Vortex in Winter 2024/2025 will be rather weaker than normal.
The real “prize” for winter enthusiasts is the proper collapse of the Polar Vortex, which is more likely during the phases when the Polar Vortex is already weaker than normal.
WINTER POLAR VORTEX COLLAPSE EVENT
A proper Polar Vortex collapse event (Sudden Stratospheric Warming) basically means a strong temperature and pressure rise in the Stratosphere and a resulting collapse of the Polar Vortex circulation.
One major condition must be met for a disruption event to be classified as a Sudden Stratospheric Warming event or a full collapse. The stratospheric winds, which are mostly westerly in Winter, must be reversed to easterly.
One such major event was recorded a few winters back. Below you can see the temperature in the mid-stratosphere as the Sudden Stratospheric Warming event was in progress. The temperature wave fully spread over the North Pole, splitting the Polar Vortex and breaking its circulation.

But what does such an event mean for our everyday weather at the surface? Well, you have to understand that it takes some time for the effects from the Stratosphere to reach the lower levels. That is why we usually look at the 0-30 day periods after such an event to identify the weather changes.
First we have the surface pressure changes following a Polar Vortex collapse event. The stratospheric warming effect tends to create a high-pressure area over the polar regions as it moves into the lower levels of the atmosphere.

This means that as the pressure rises over the pole, the jet stream gets disrupted, unlocking the cold air out of the pole and releasing it down towards the south.
Below is the average temperature of 0-30 days after a Polar Vortex collapse event. This shows that most of the United States and northern and central parts of Europe are typically colder than normal after an SSW event. But note: Each stratospheric warming event is different and does not automatically mean a strong winter pattern.

Looking at the snowfall after SSW events, we can see above-average snowfall over much of the eastern United States. the Midwest, and Europe. This is because of the pressure changes after a stratospheric warming, the colder air has an easier path towards the south and into these regions.

As you can see, a strong or weak polar vortex can significantly change Winter weather in the United States, Canada, and Europe. For this reason, we closely monitor the weather patterns and all activity surrounding the polar vortex.
Learn more: Recent Stratospheric Warming Event in January 2024
We will keep you updated on the global weather pattern development, so bookmark our page. Also, if you have seen this article in the Google App (Discover) feed, click the like button (♥) there to see more of our forecasts and our latest articles on weather and nature in general.