Winter in the Southern Hemisphere has brought an unusual cold weather outbreak from Antarctica into South America. Low-temperature records were broken, with snowfall returning to parts of south Brazil after decades.
The source of the cold air was Antarctica, which is quite colder than normal this season. As you will also see, the Southern Hemisphere is also colder than normal, bringing down the 2021 global temperatures to the lowest in the past 6 years. All that, while record heatwaves are raging across the United States and Canada.
COLD AIR FROM THE POLE
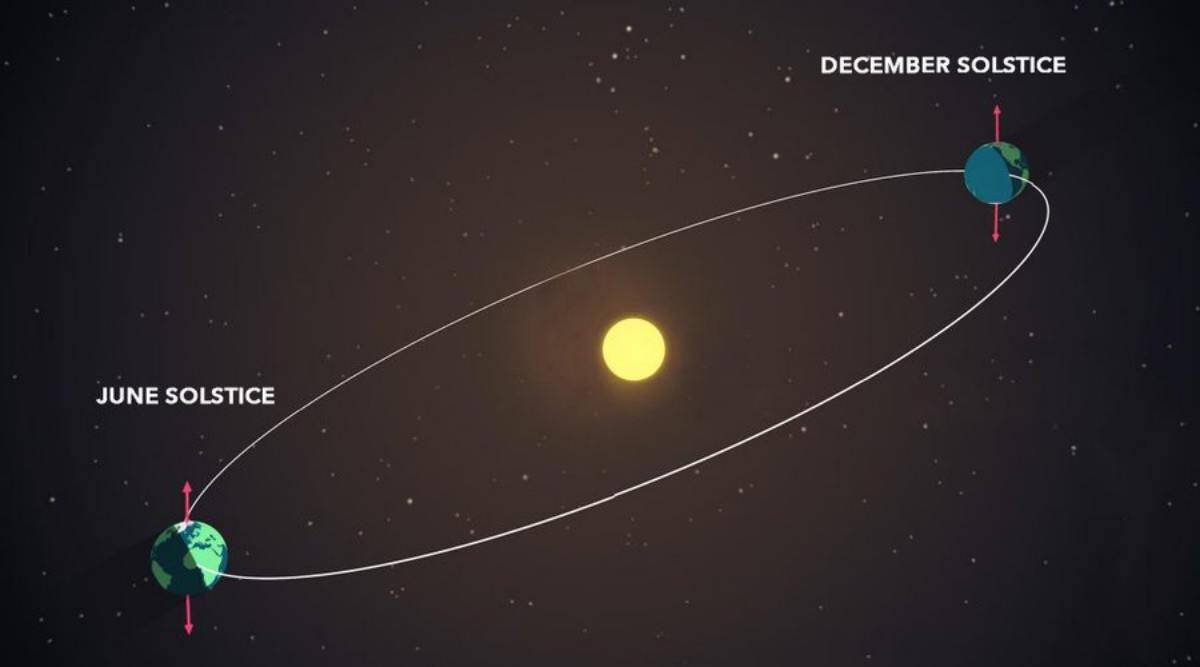
The seasons are reversed in the Northern and Southern Hemisphere. While summer is in full swing over the Northern Hemisphere, the Southern Hemisphere is in the cold winter. Astronomical summer/winter began with the solstice on June 21st. Meteorological summer/winter began on June 1st.
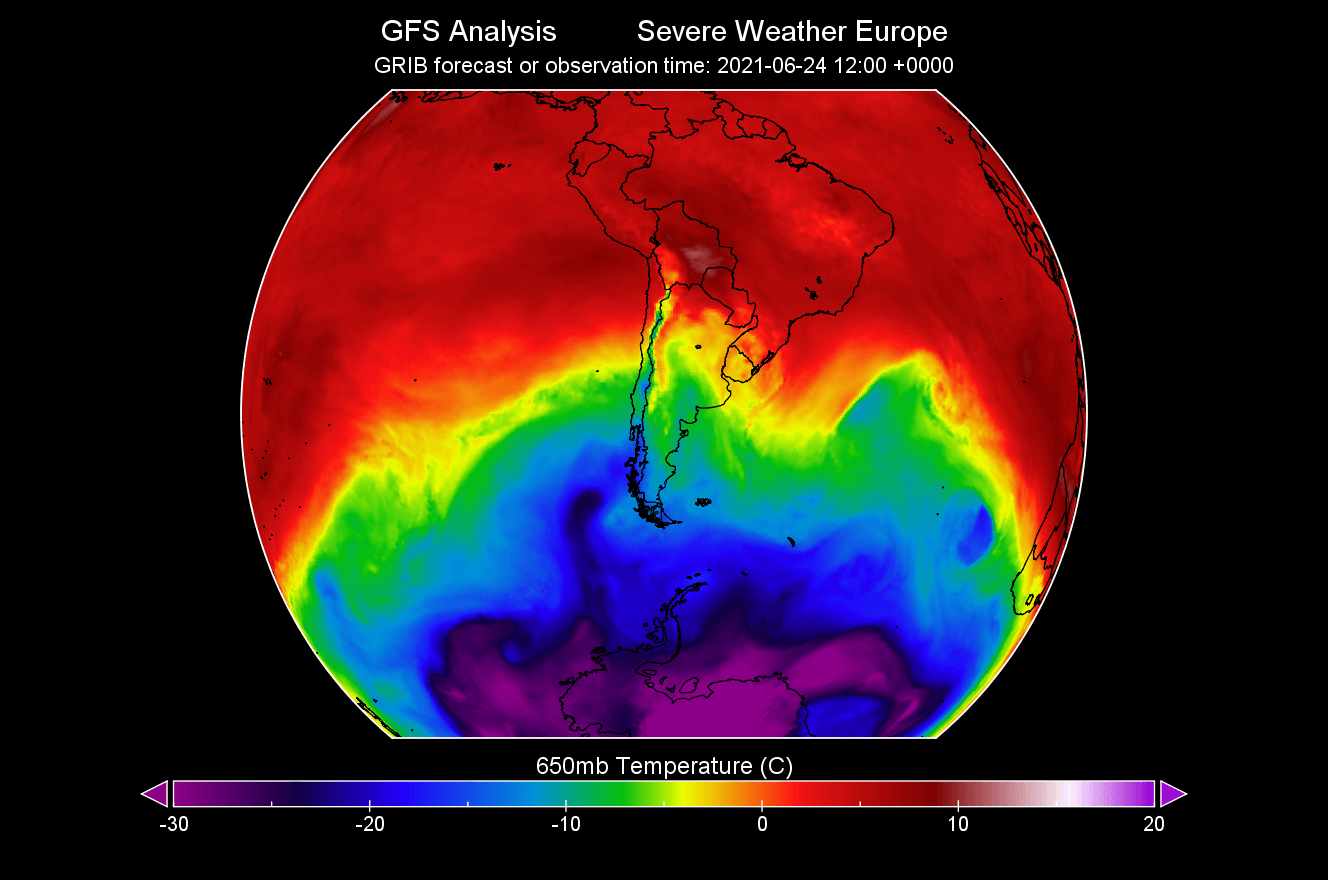
Our story begins on June 24th, when an “arm” of cold air was starting to extend out of Antarctica. You can see it on the image below, which shows the temperature at around 3.5km altitude (2.2 miles). A low-pressure system was helping to push this cold air out of Antarctica and towards South America.
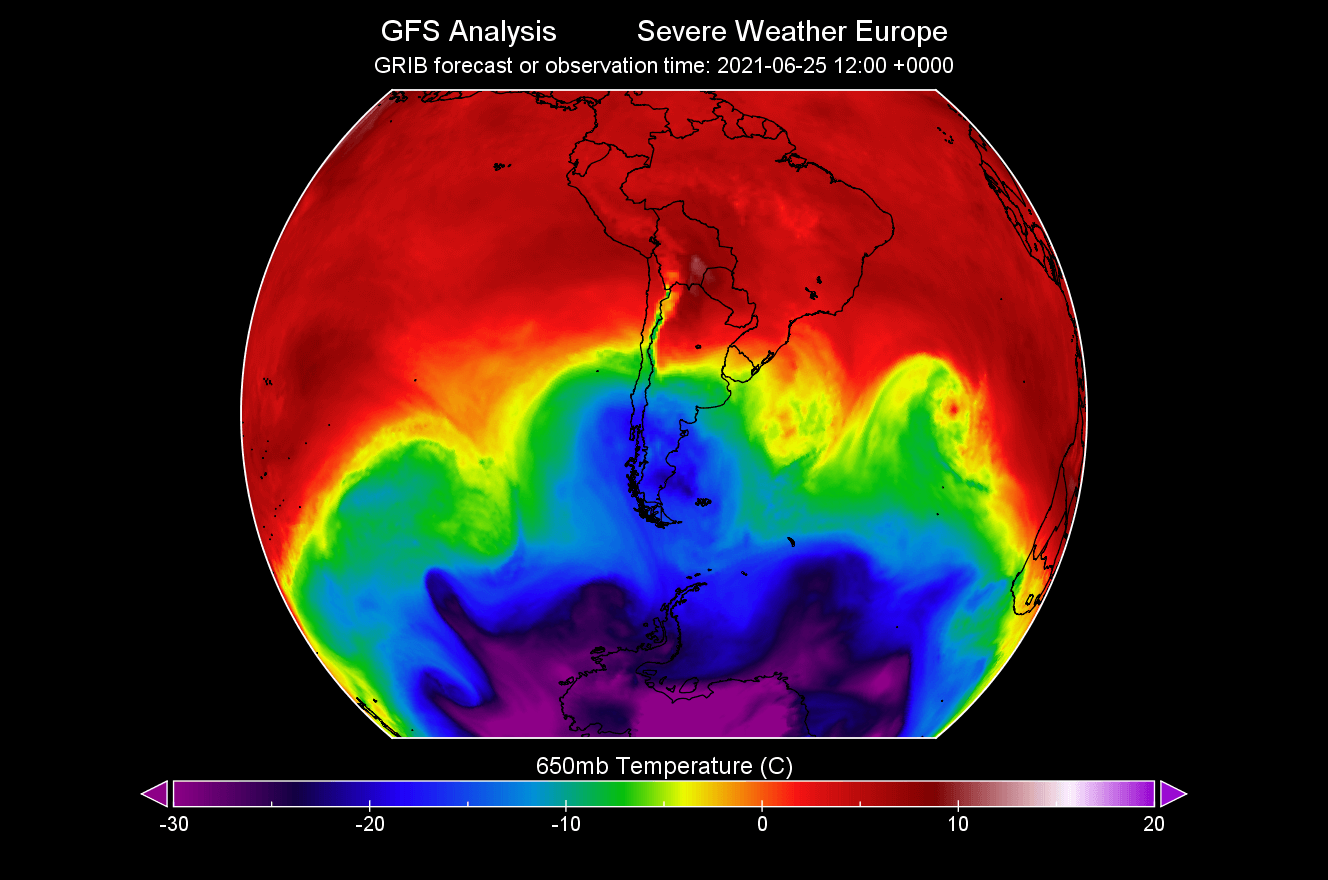
In just 24 hours, the cold air system was already over the southern tip of South America. It was being transported further north at a rapid pace, towards central South America.
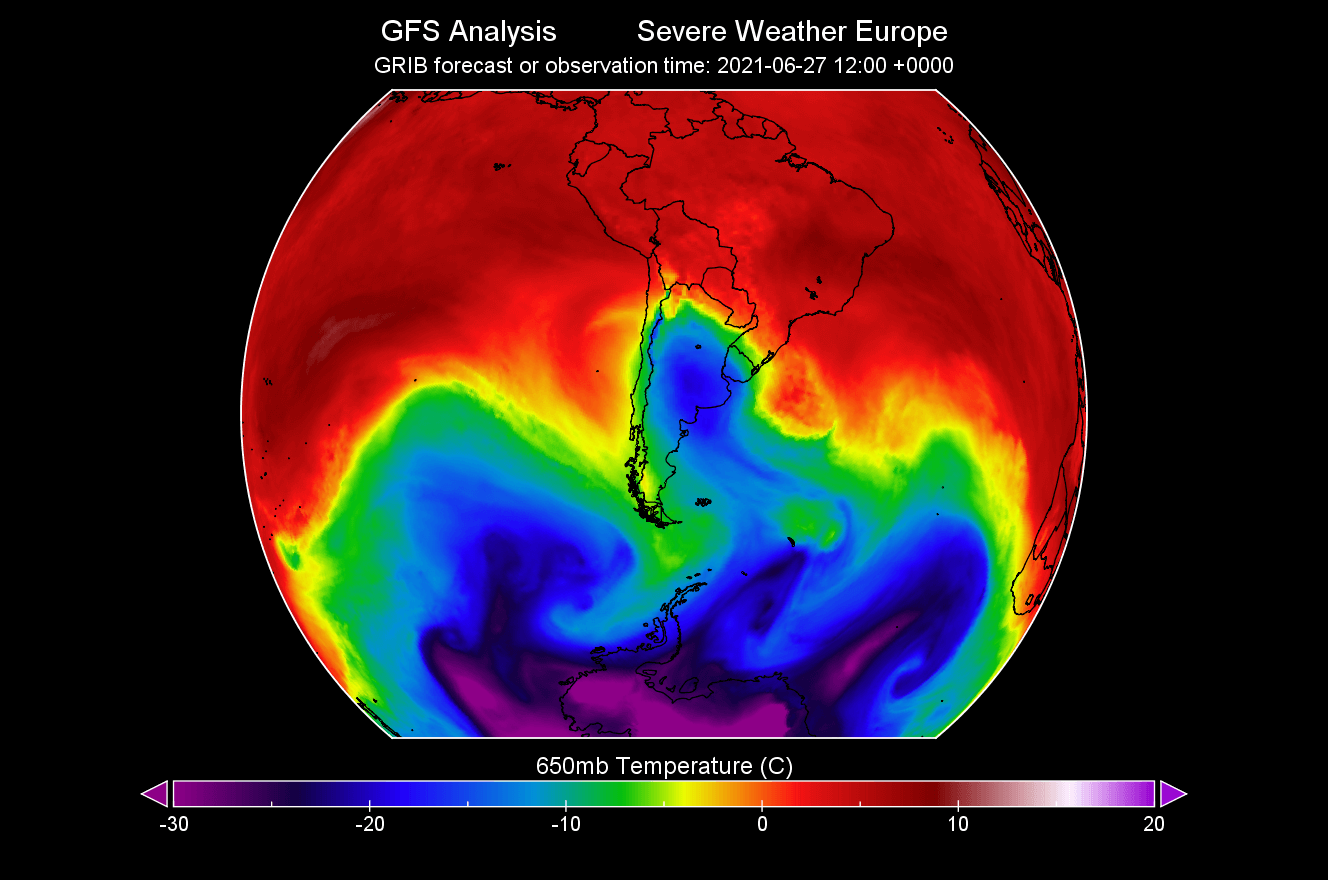
The cold weather system has reached central parts in two days. It was driven by strong southerly winds, pushing the cold weather further north, reaching unusually deep into the continent.
Below we produced a video that shows the temperature anomalies in the Southern Hemisphere in June 2021. You can see that there was a previous cold air outbreak in South America around the 17th. Cold air is not uncommon there, as it is currently winter. But such strong cold weather reaching this far into the continent is quite rare.
WINTER COLD AND SNOW
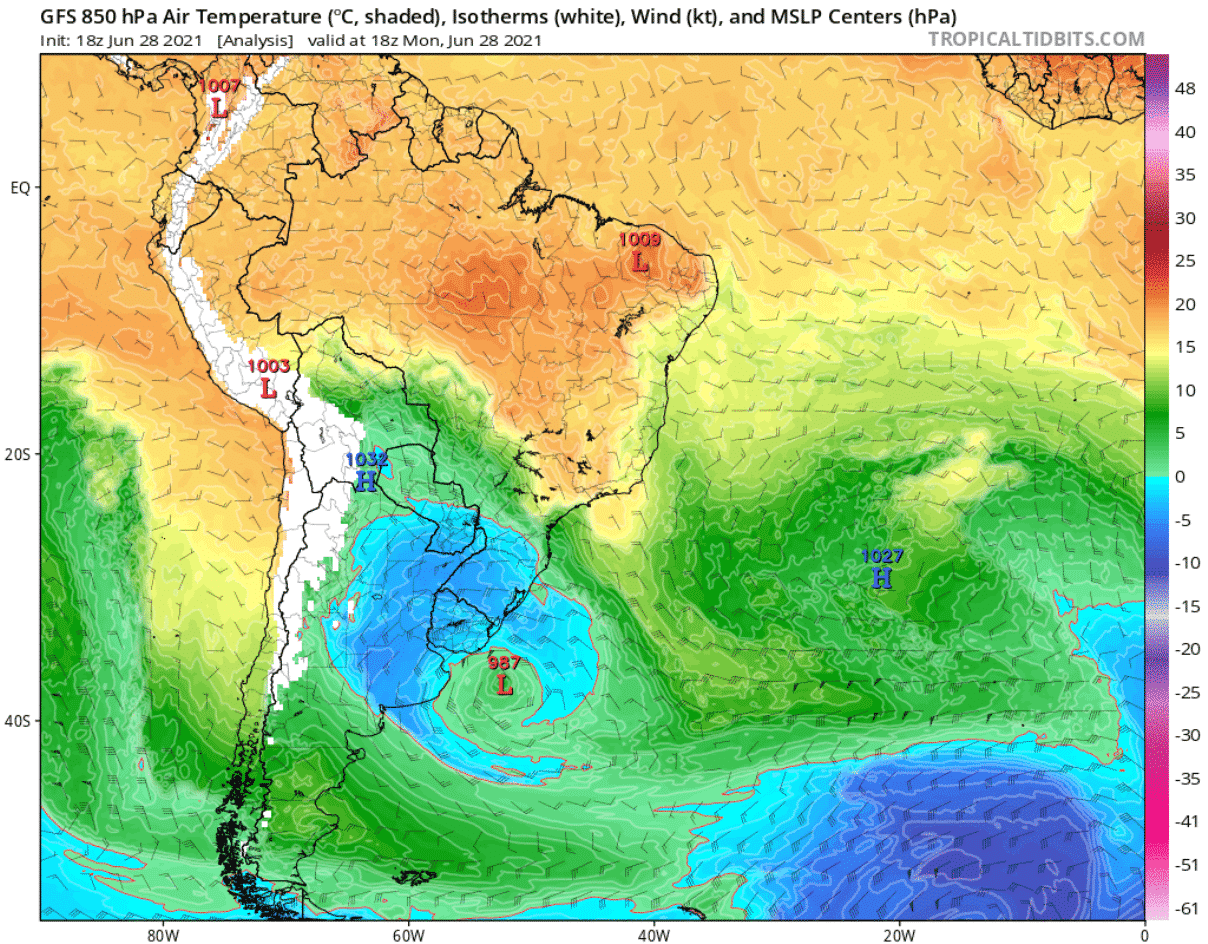
The cold southerly flow can be seen in the next image, where we have the temperature at 850mb (1.500m) and wind barbs. A low-pressure system was just present on the coast of Uruguay and southern Brazil. It acted as a “pump”, helping to quickly transport the cold Antarctic airmass towards the North.

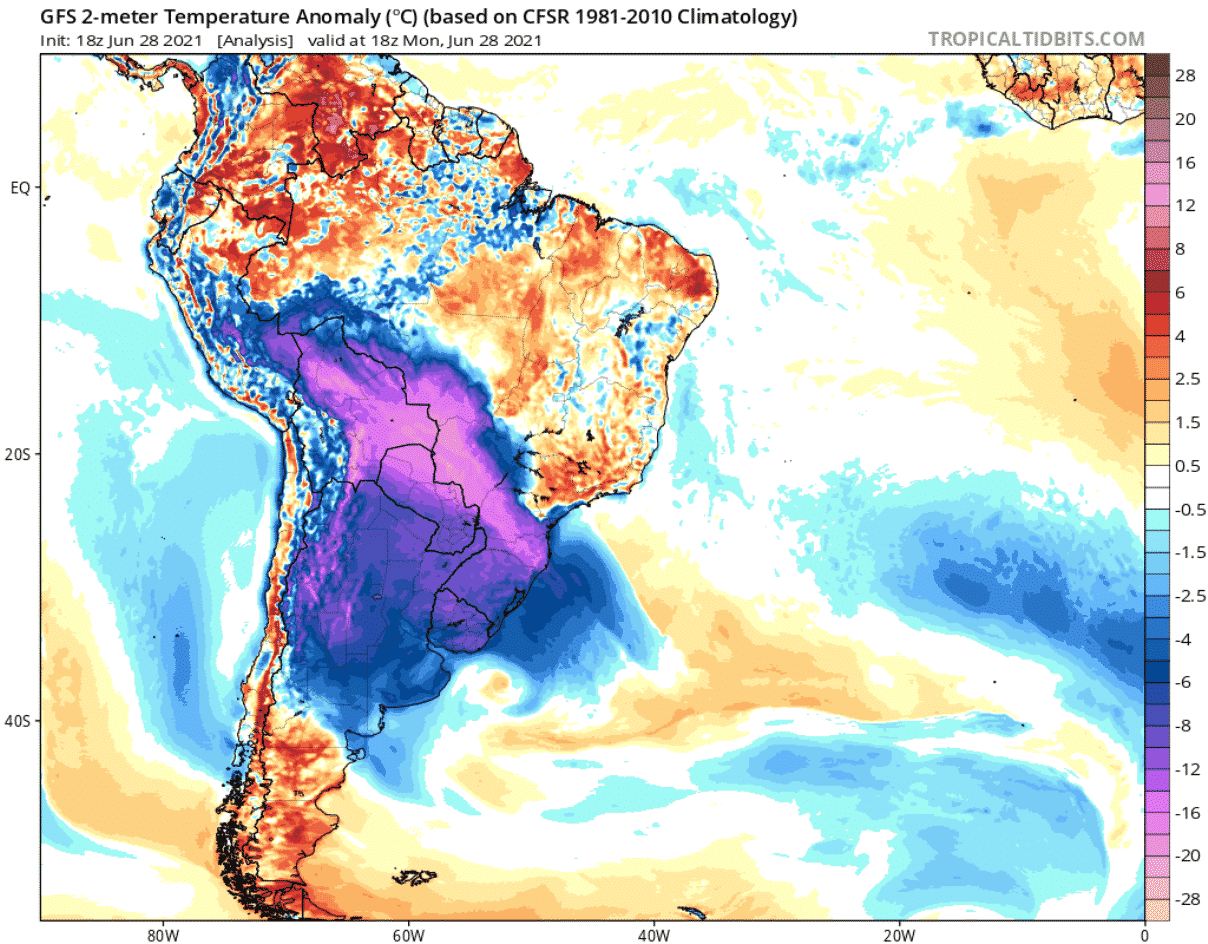
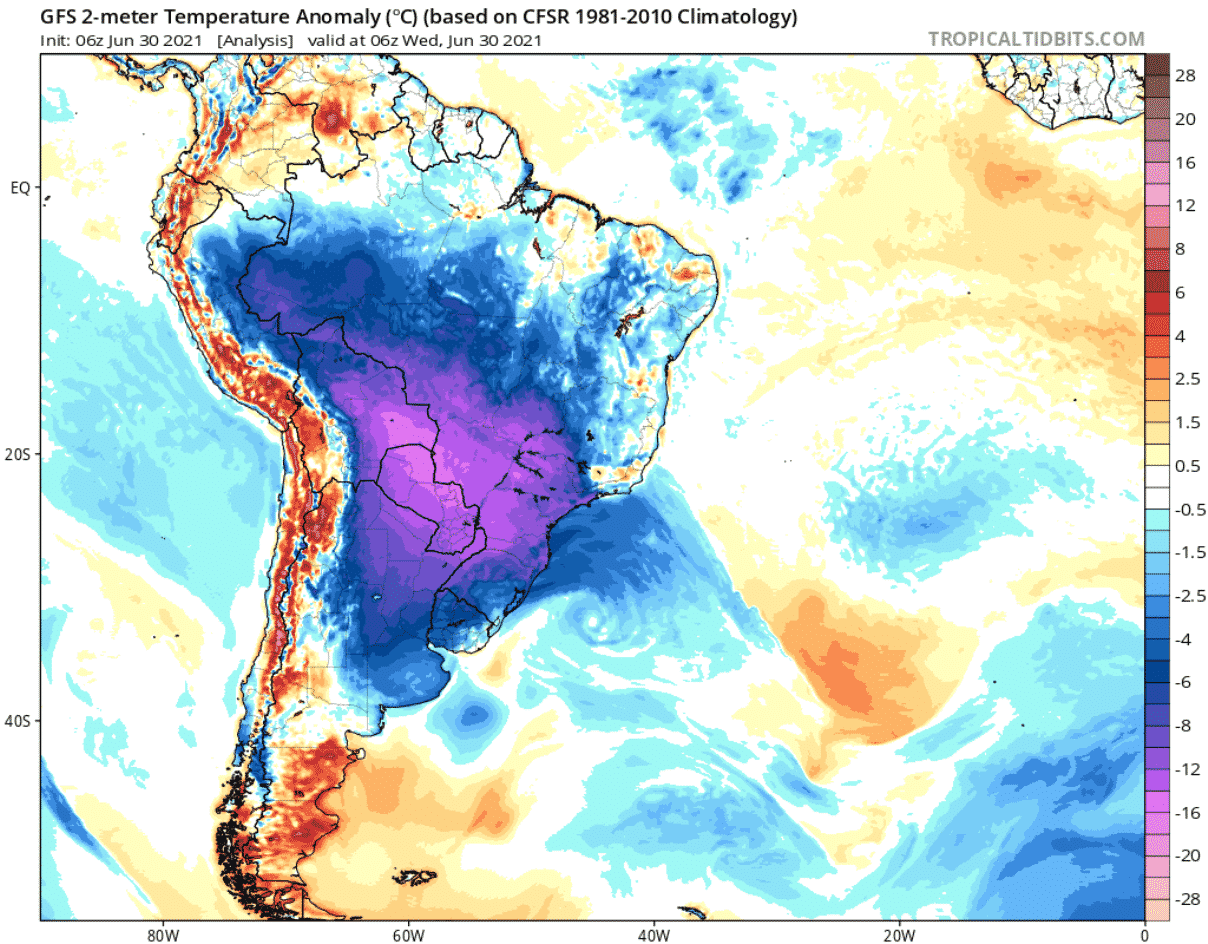
Thanks to this powerful Antarctic air mass, countries such as Argentina, Uruguay, Paraguay, Bolivia, and Brazil suffered an extreme and unprecedented cold weather outbreak, with historic snowfall across some regions. The image below shows the temperature anomalies on Monday, June 28th. A large region of the continent was experiencing temperatures over 15°C colder than normal.
At this point, the low-pressure system on the southeast coast strengthened, continuing to push the cold air further towards the north.
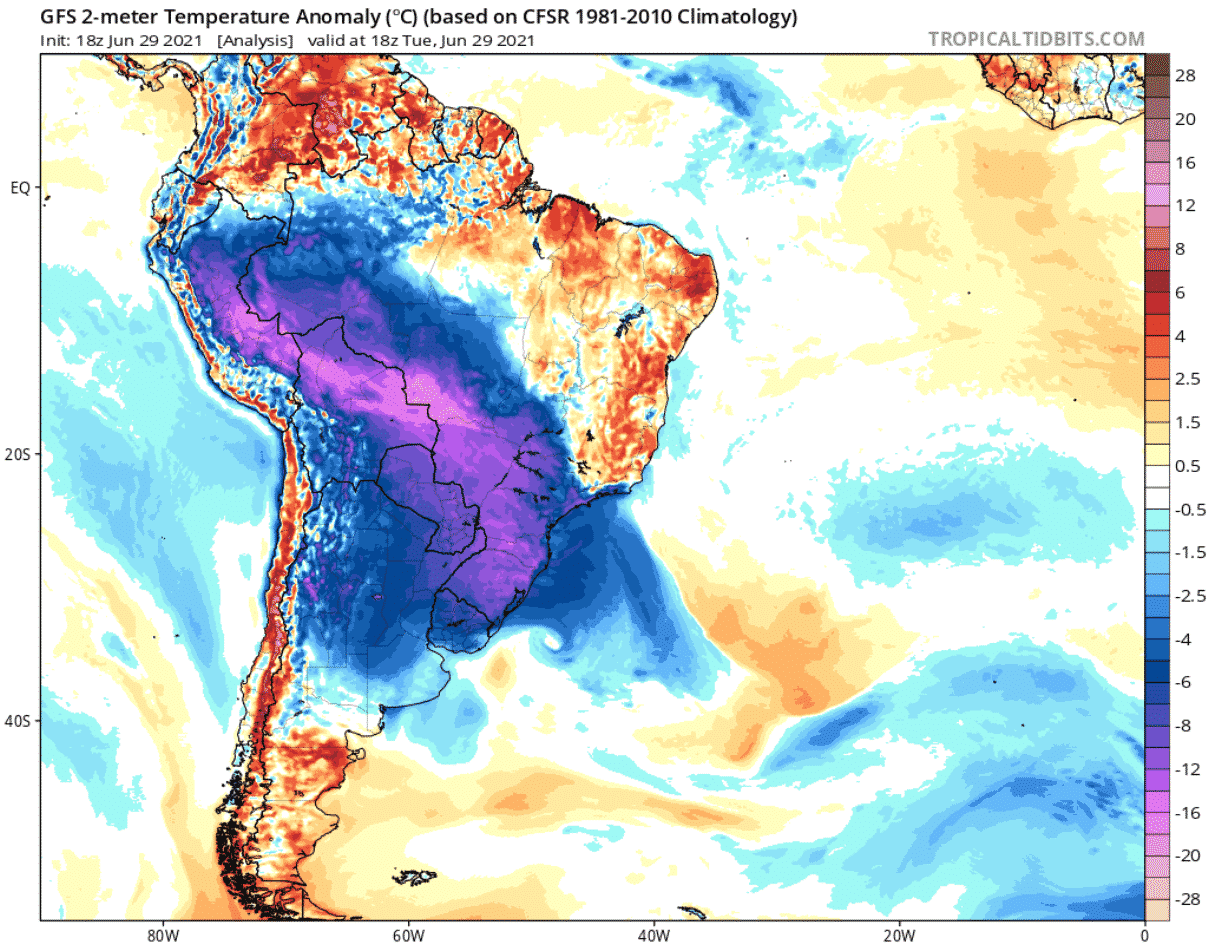
On Tuesday, cold anomalies reached further towards the north, now covering a very large part of the continent. Many low-temperature records were broken across the countries overnight.
New low-temperature records were set also in Argentina, breaking several decades-old records. Below are new record low temperatures in some places.
Mendoza Aero: -4.0°C (24.8°F)
Mendoza Obs: -4.4°C (24°F)
Saint Martin: -3.9°C (25°F)
San Rafael: -6.9°C (19.6°F)
Malargüe: -11.7°C (10.9°F)
Uspallata: -10.6°C (12.9°F)
San Carlos: -7.6°C (18.3°F)
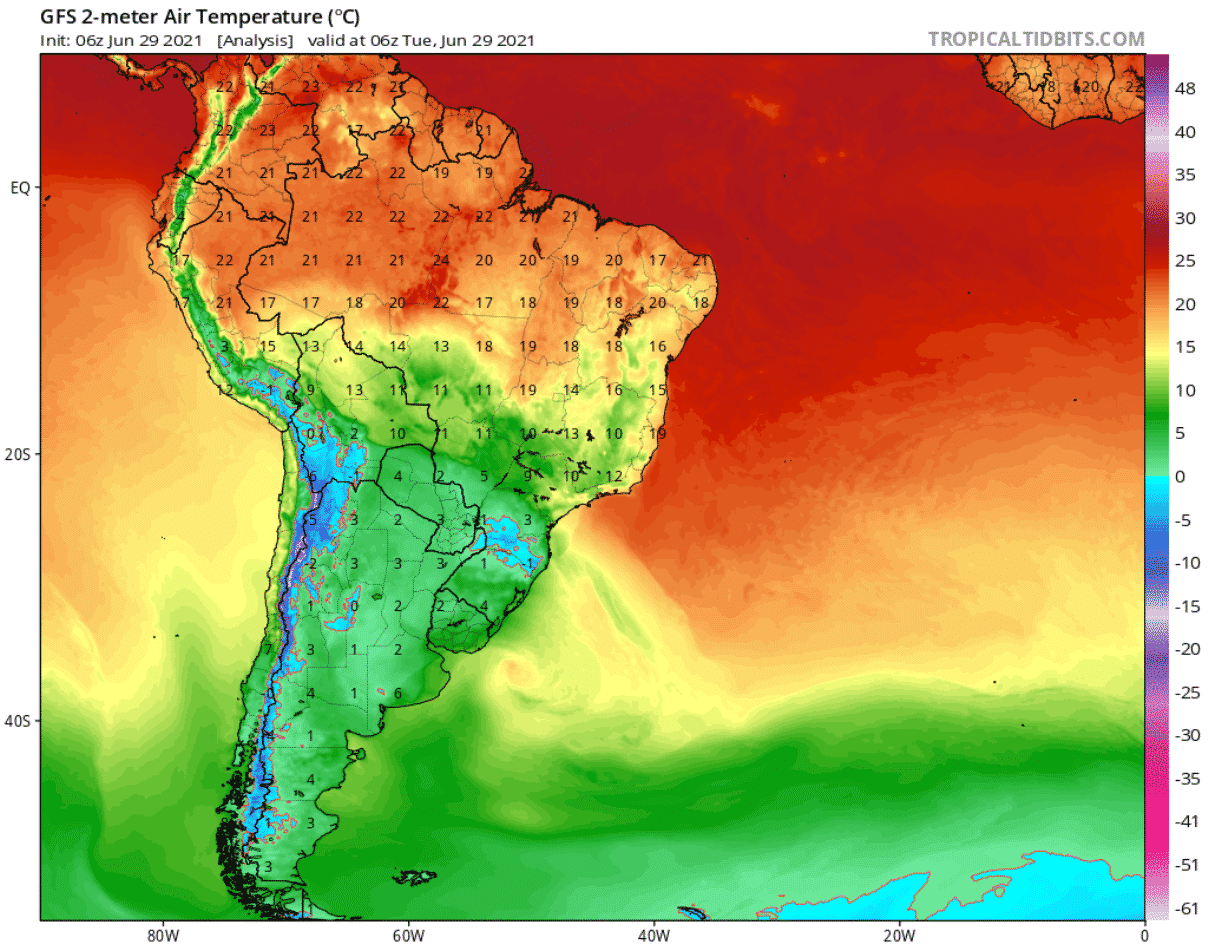
The image below shows the temperatures on Tuesday, with near freezing temperatures recorded also in the lowlands near the 20° south latitude. That is comparable to the latitude of southern Florida (USA), or Mexico, or the Sahara desert. Frost conditions and snowfall across southern Brazil were especially damaging to crops, causing major damage to food production.
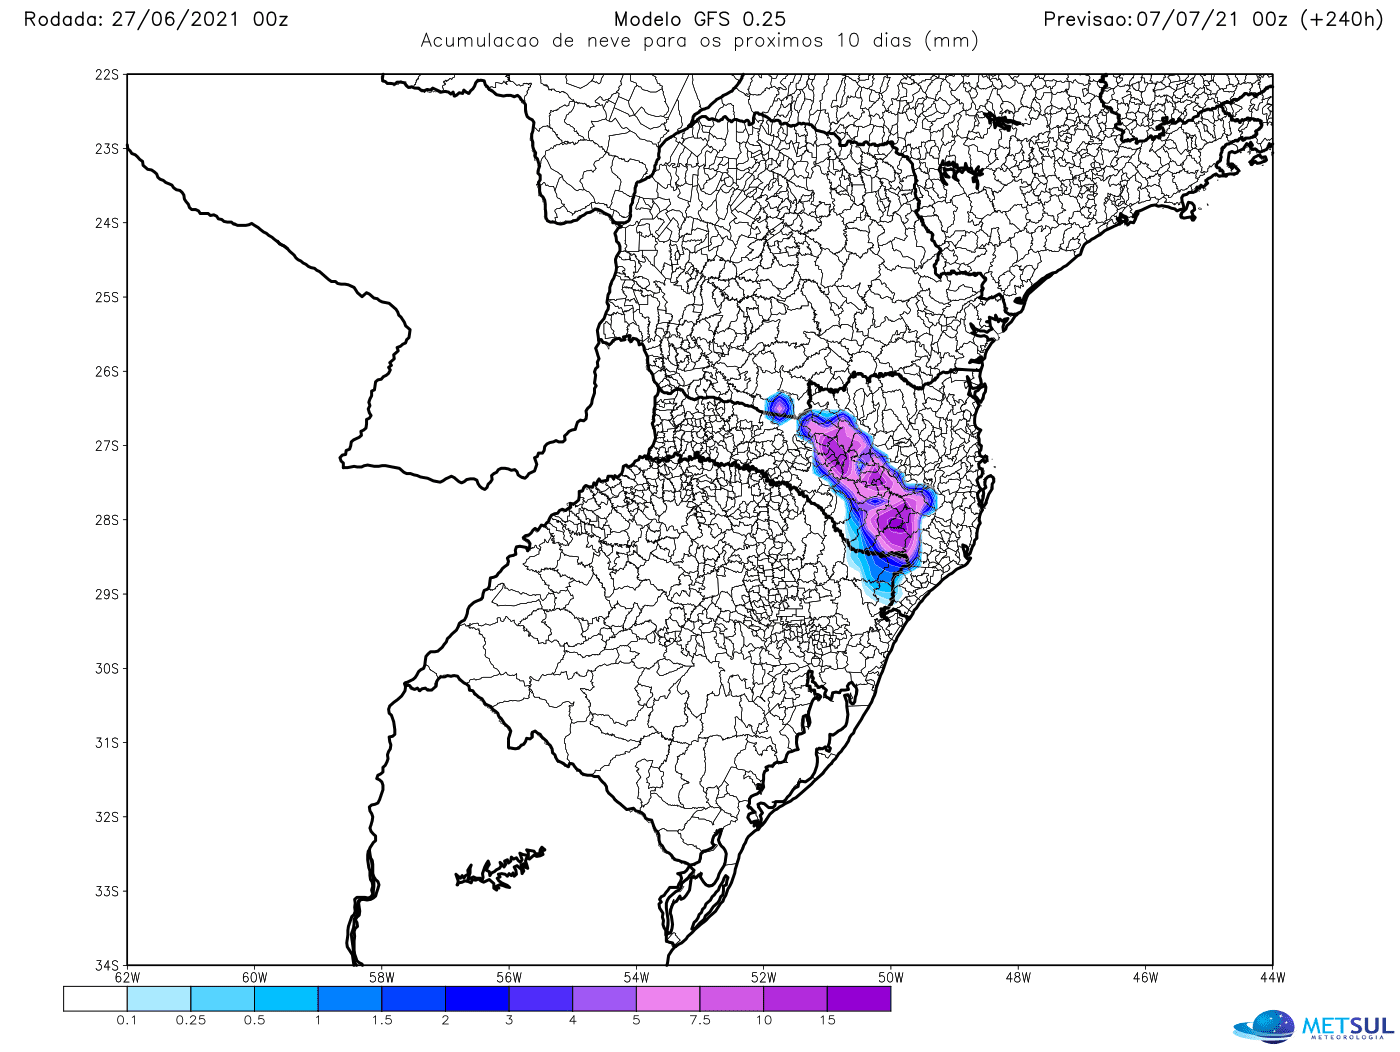
Temperatures were cold enough for snowfall in southern Brazil. Below is an image that shows the snow forecast a few days before the event. It is a rare occurrence to have snowfall in the lower levels of this region and is only possible with the strongest of cold winter outbreaks.
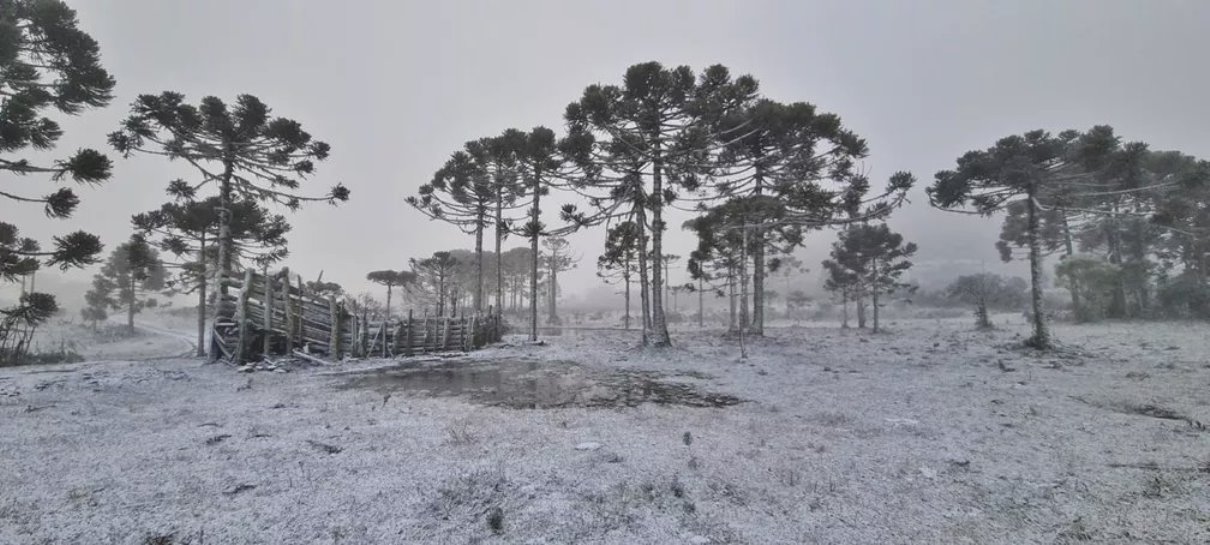
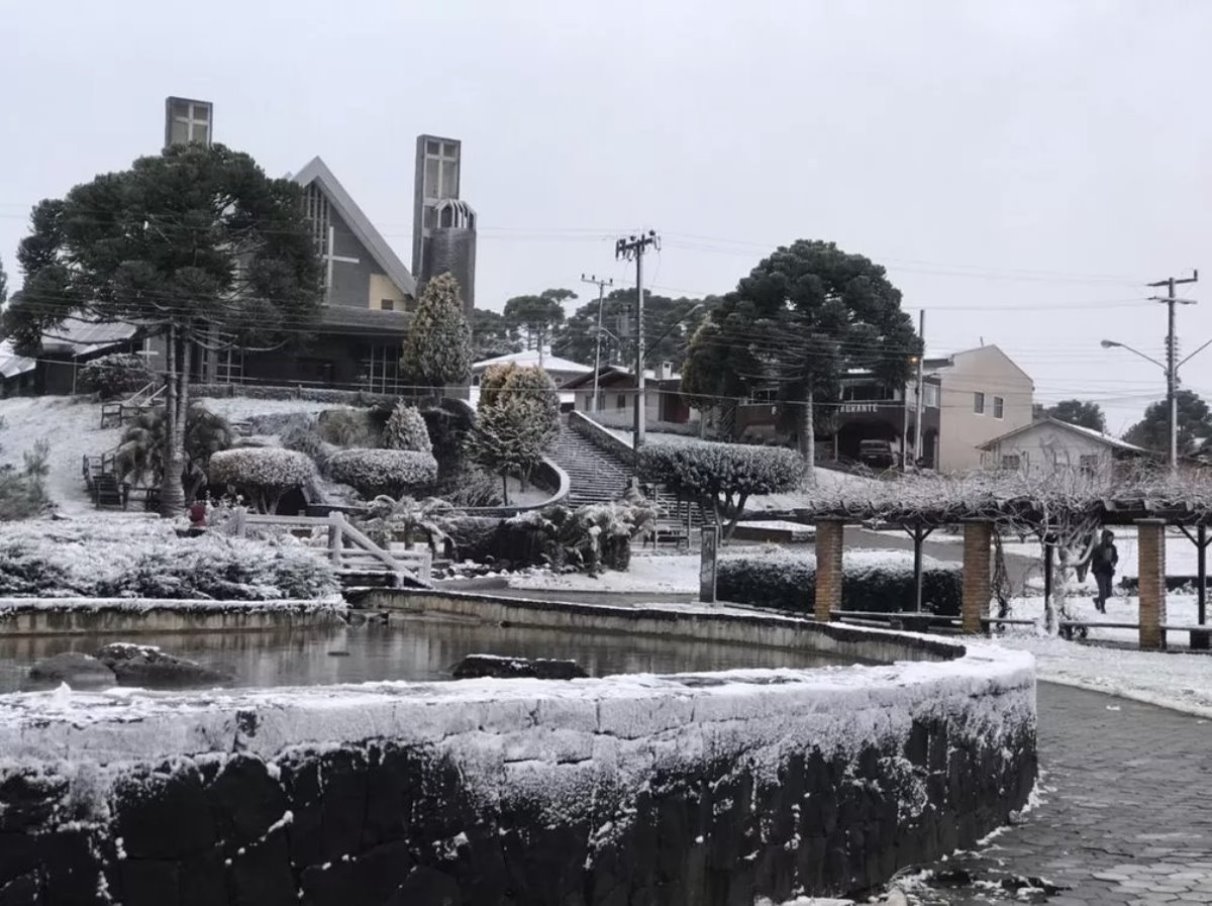
Below are two images of the historic snowfall on the lowlands of southern Brazil. In some places of the region, there was snowfall for three consecutive days. Some places have not seen snowfall in several decades, recording this as only the third or fourth snowfall event in the past century. Photos are from @GataQuadrada.
The cold air outbreak reached its peak on Wednesday, covering much of South America. Temperatures in most central regions were 8-16°C colder than normal. This was one of the strongest and most widespread cold air outbreaks in recent times.
This cold air outbreak was forecast over a week in advance. Below is an image that shows the ECMWF forecast a week before the start of the event, nicely showing the cold anomalies in the central regions.
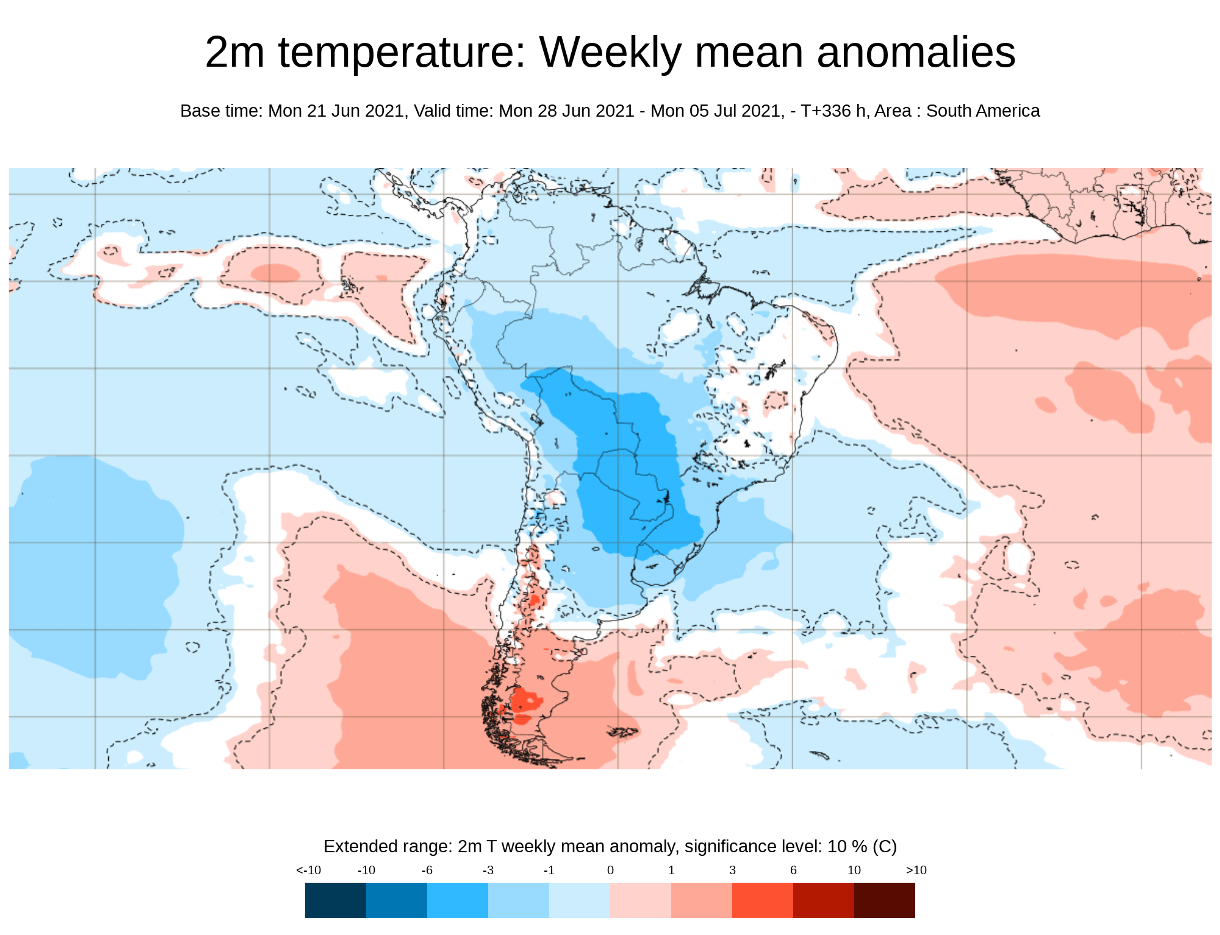
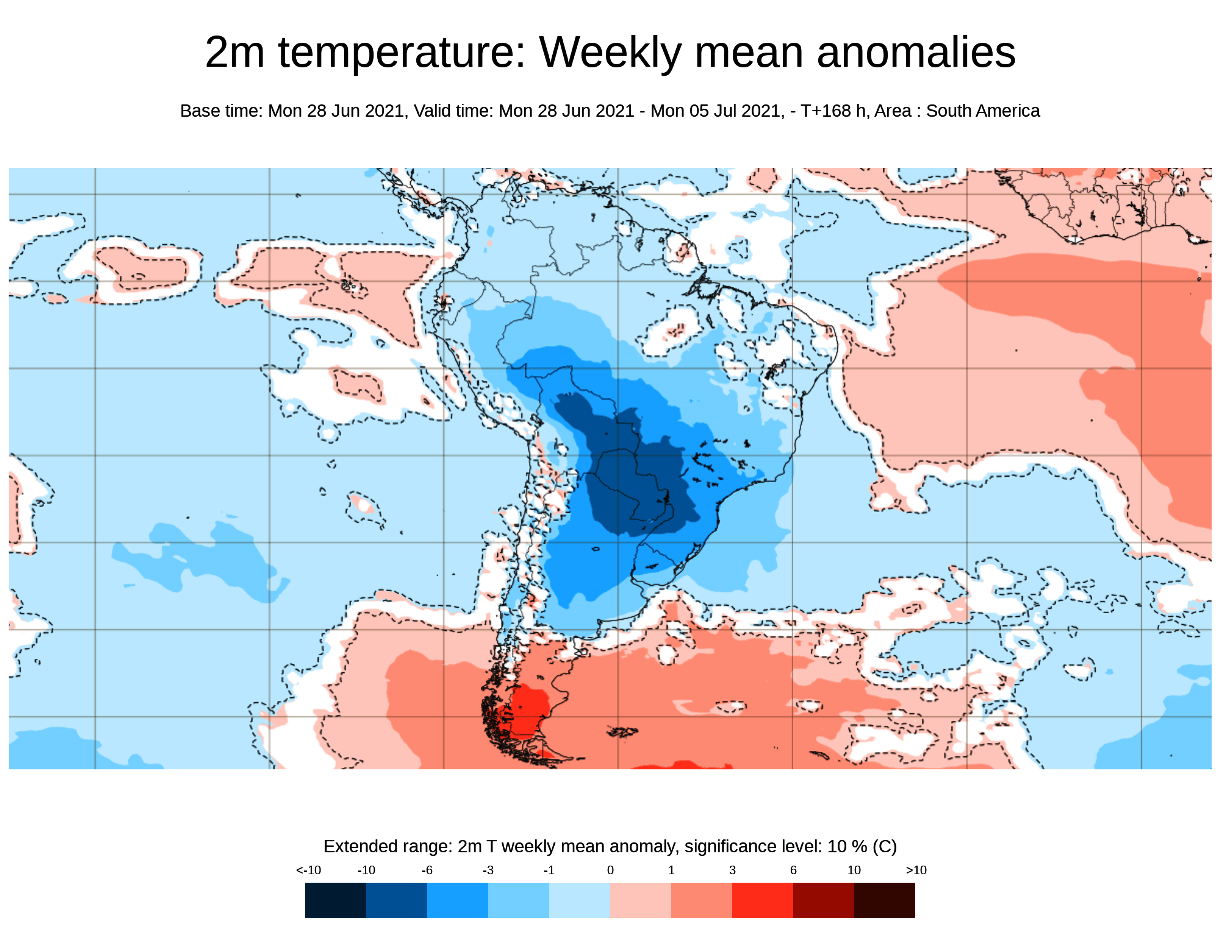
An even better forecast was released at the start of the event, now also showing proper stronger intensity. Since this is a weekly temperature forecast, early July is also included in the forecast. The cold outbreak will move out by then, so the forecast for late June only would properly show even stronger negative anomalies.
But how or why was this airmass so unusually cold? The answer might lie in its source region, which is Antarctica. This year, the south pole is running colder than normal, enabling colder airmass to reach further towards the equator on land. We will look closely at the state in Antarctica and also globally.
COOLING IN A WARMING WORLD
Below we have a global map of temperature anomalies on June 29th, during the peak of the cold air outbreak in South America. It really stands out on the map, along with the unusually strong heatwave over the northwestern Untied States and southwestern Canada. We will link our special article on this record strong heatwave on the bottom.
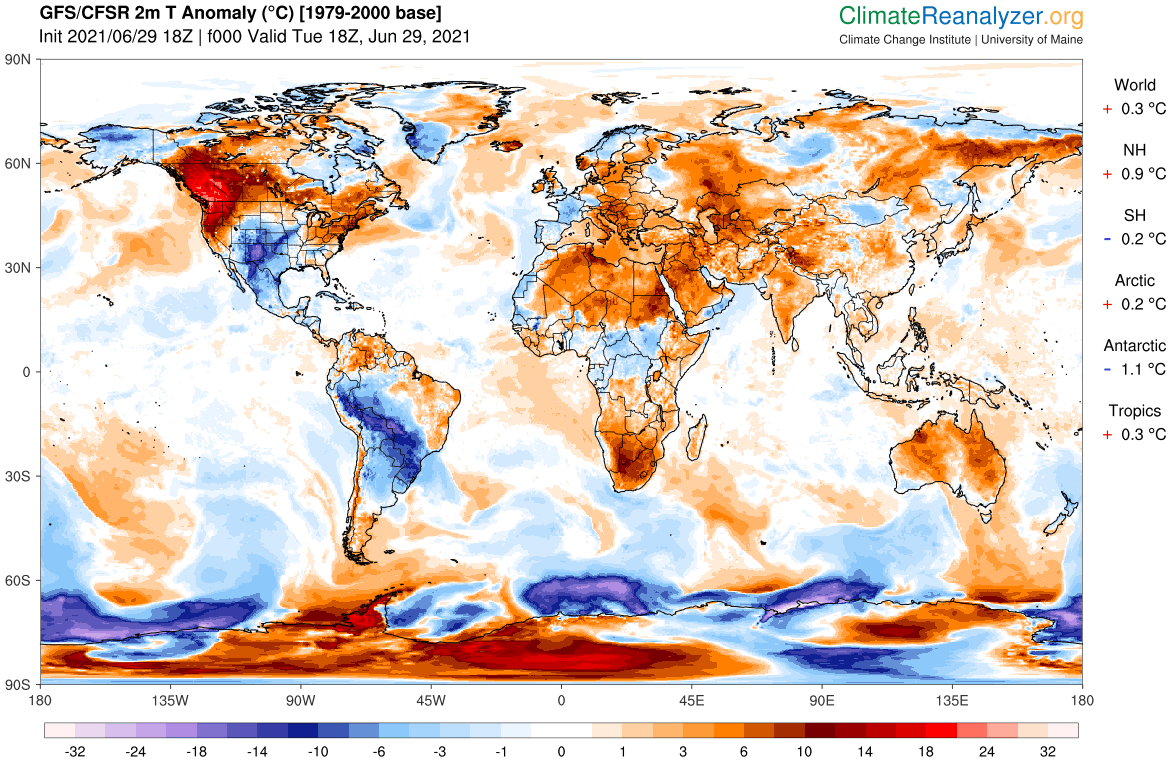
There is also a colder than normal area in the southern United States. That is a result of the pressure pattern change that moved warm temperatures towards the north, also bringing colder temperatures down to the south. Also, you can see much colder than normal regions on the south polar circle, around Antarctica.
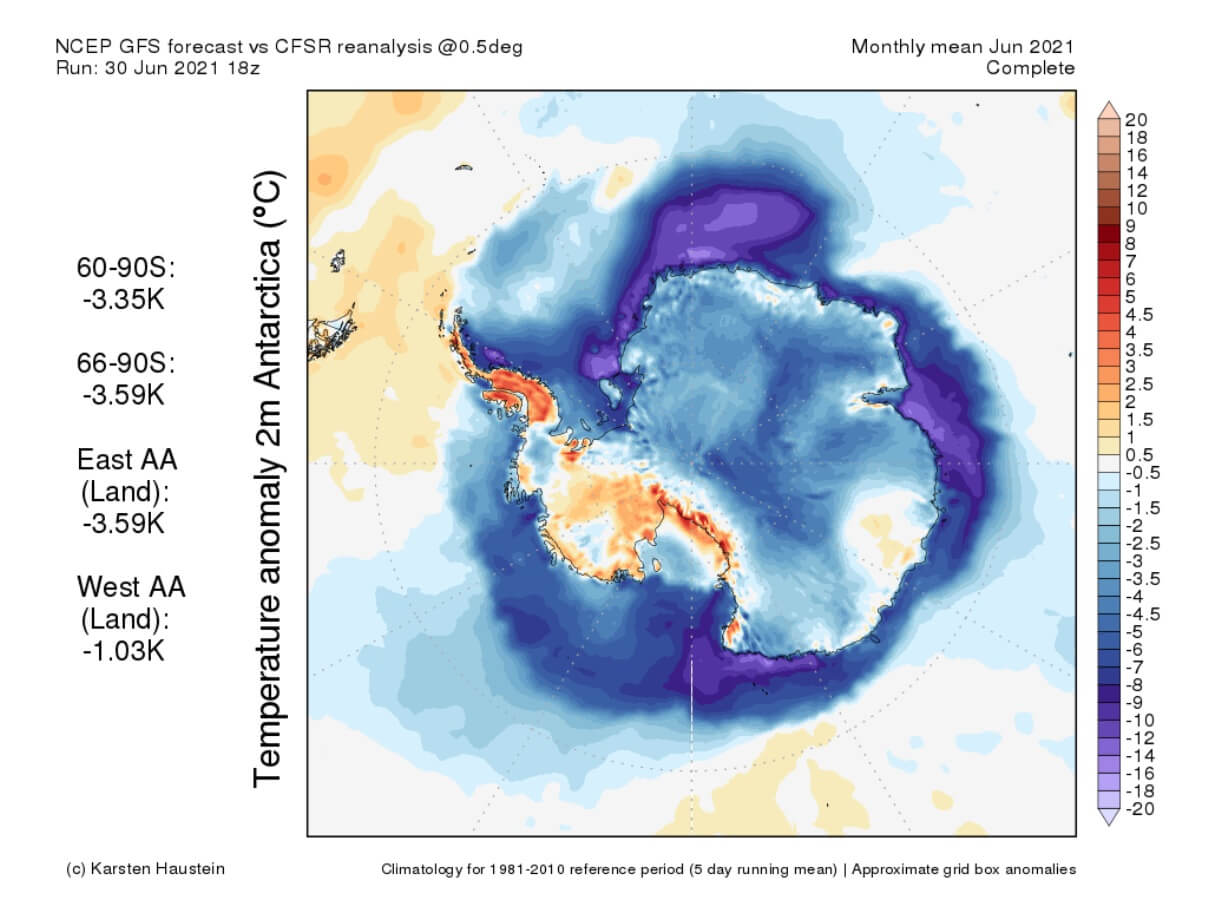
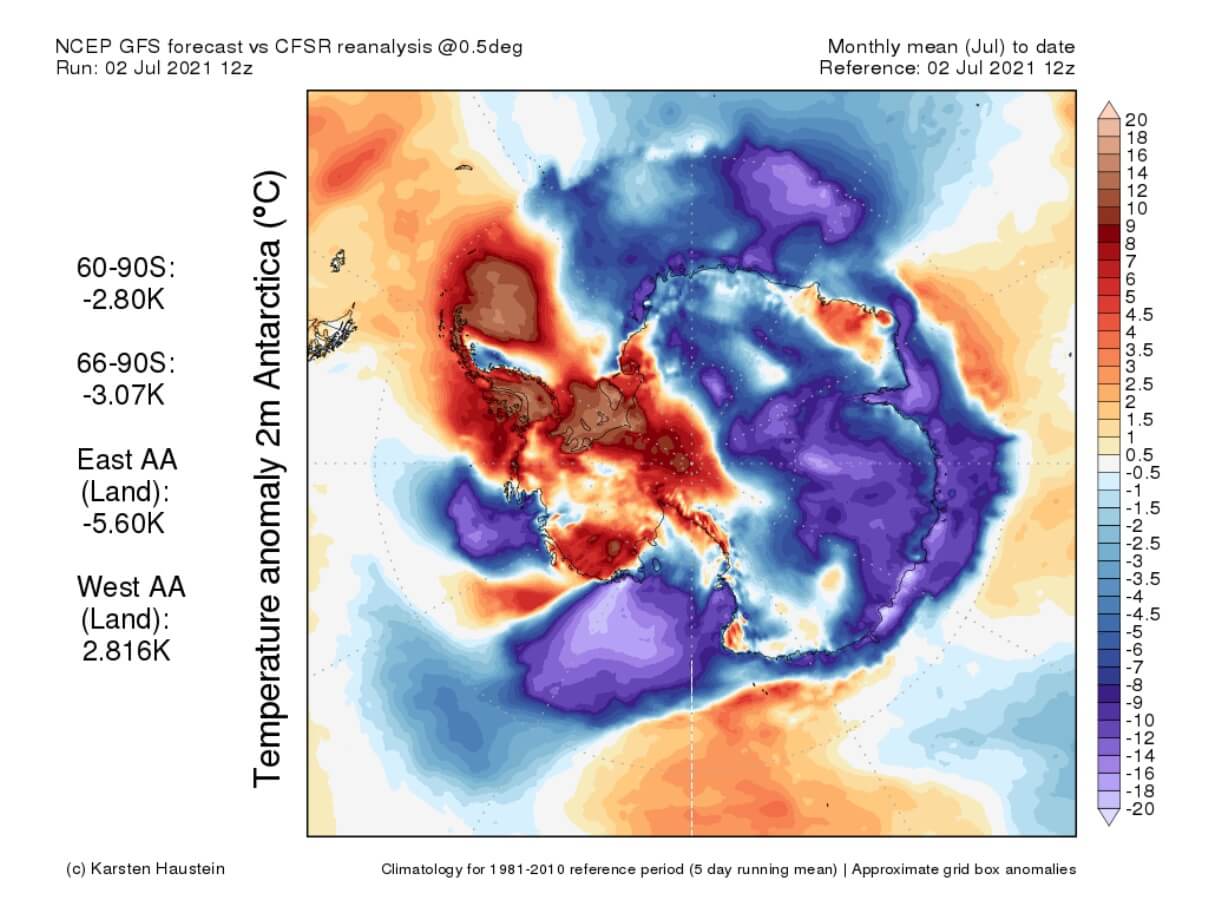
Below we have an image that shows the temperature anomalies over the south pole in June 2021. Most of the polar regions were colder than normal, which is not that common to see in recent years.
July has so far begun at a similar pace, with strong cold anomalies over much of Antarctica. A warmer than normal region stands out on the western side towards South America. That is likely due to the strong cold airmass being transported out into South America, now being replaced with a warmer airmass.
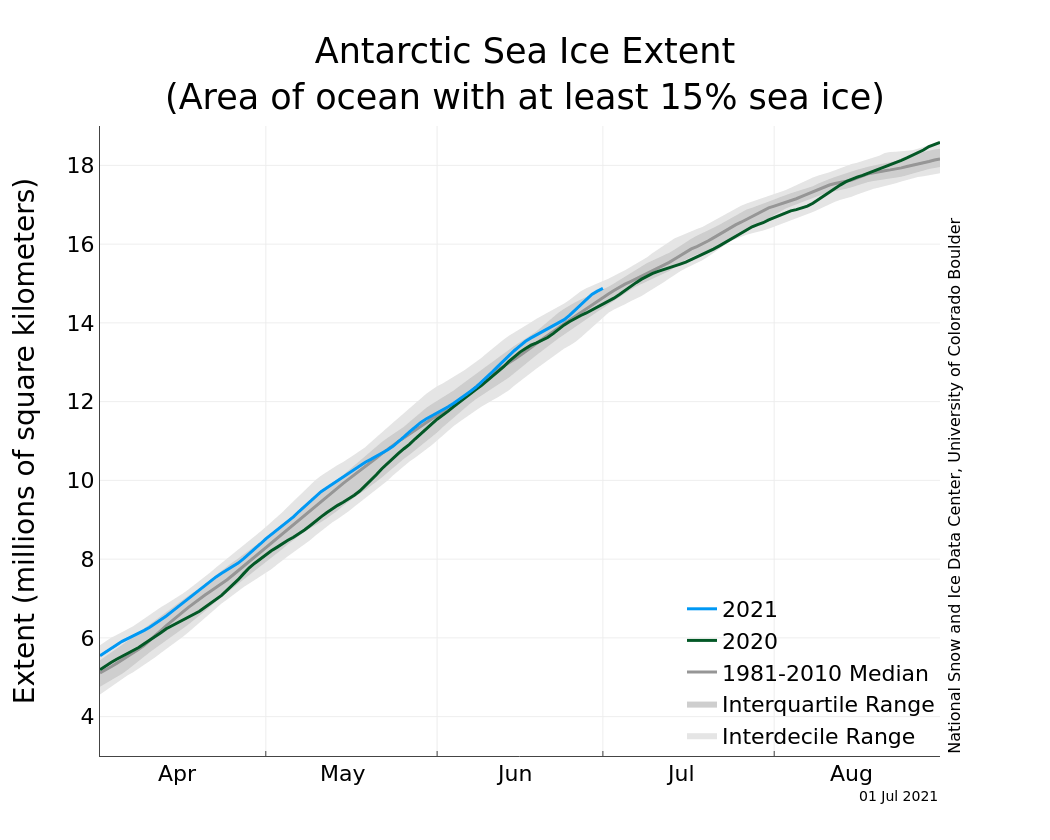
These colder conditions also have an effect on the sea ice around Antarctica. You can see on the graph below, that currently (blue line), the sea ice extent around Antarctica is running quite above the long-term average, and is still in the growth phase until September.
On the image below you can see the global temperature anomaly in 2021 so far. The cooler south pole stands out, as does the warm north pole. The global temperature anomaly so far is +0.14°C, which is lower than in some recent years.
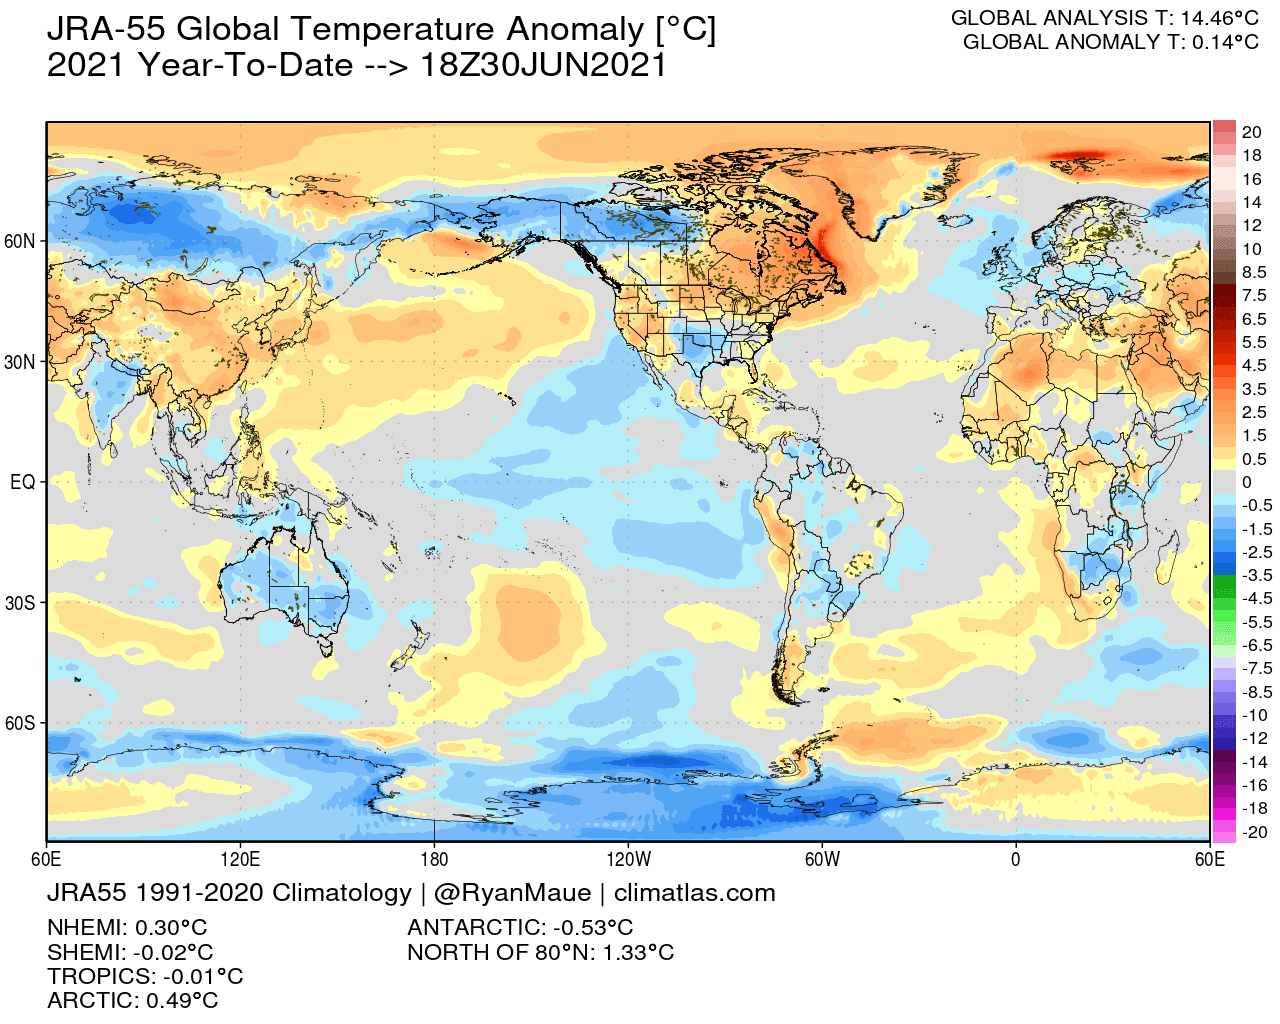
As it says on the image above, the Arctic region is running half a degree warmer than normal, while Antarctica is actually over half a degree colder than normal so far this year on average. South Hemisphere as a whole is around normal values, or slightly cooler, mainly due to the anomalies around Antarctica.
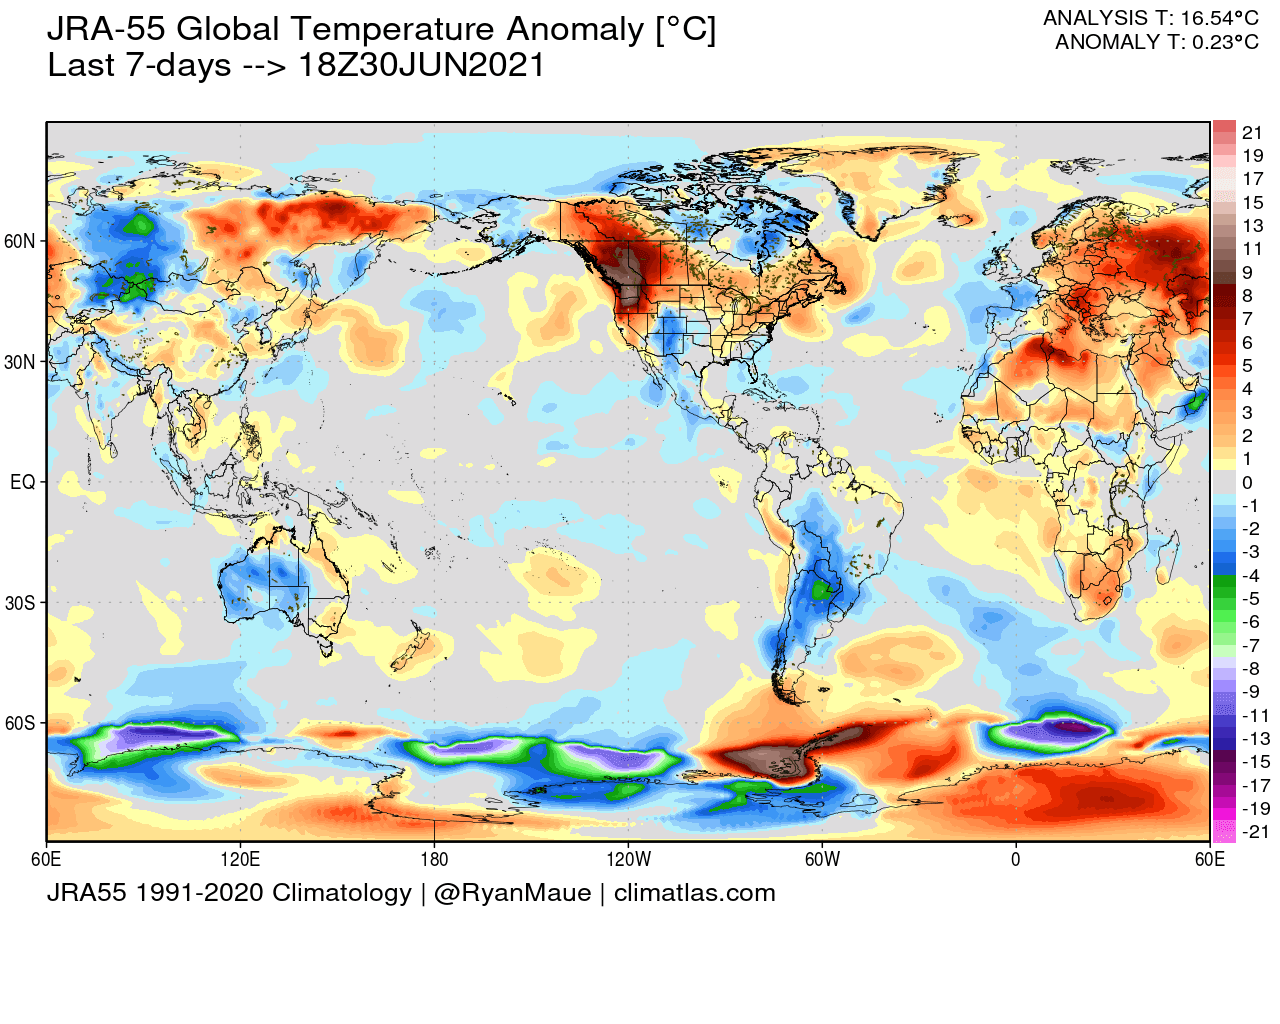
Looking at the global temperature anomalies in the last 7 days, we have a bit different picture. The powerful record strong heatwave stands out over the northwestern United States and southwest Canada. We can see the spreading cold air outbreak over South America, and warmer than normal temperatures over central and eastern Europe.
Below we have a graph, which shows the global temperature anomaly since 1990. You can see the steady growth over decades, but with frequent ups and downs over the years. 2021 is another strong dip in global temperatures, not seen since 2015.
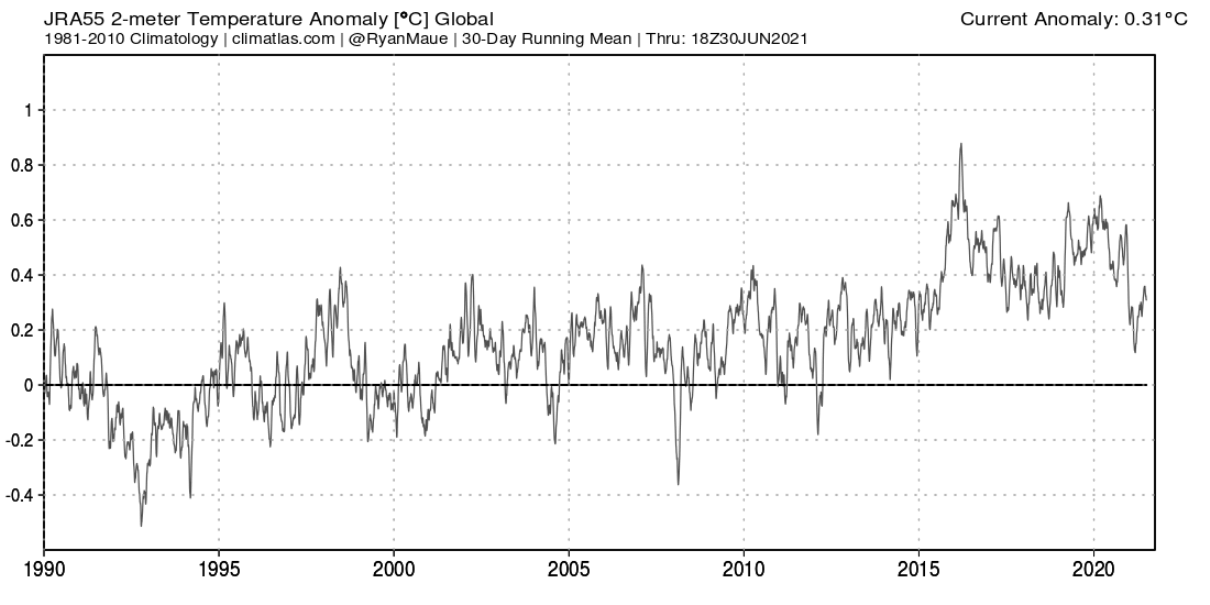
Part of the reason for this is also the cold ENSO event this winter, the La Nina, which is usually strong enough to affect the global temperatures. Normally, a dip in global temperatures follows the La Nina with some delay.
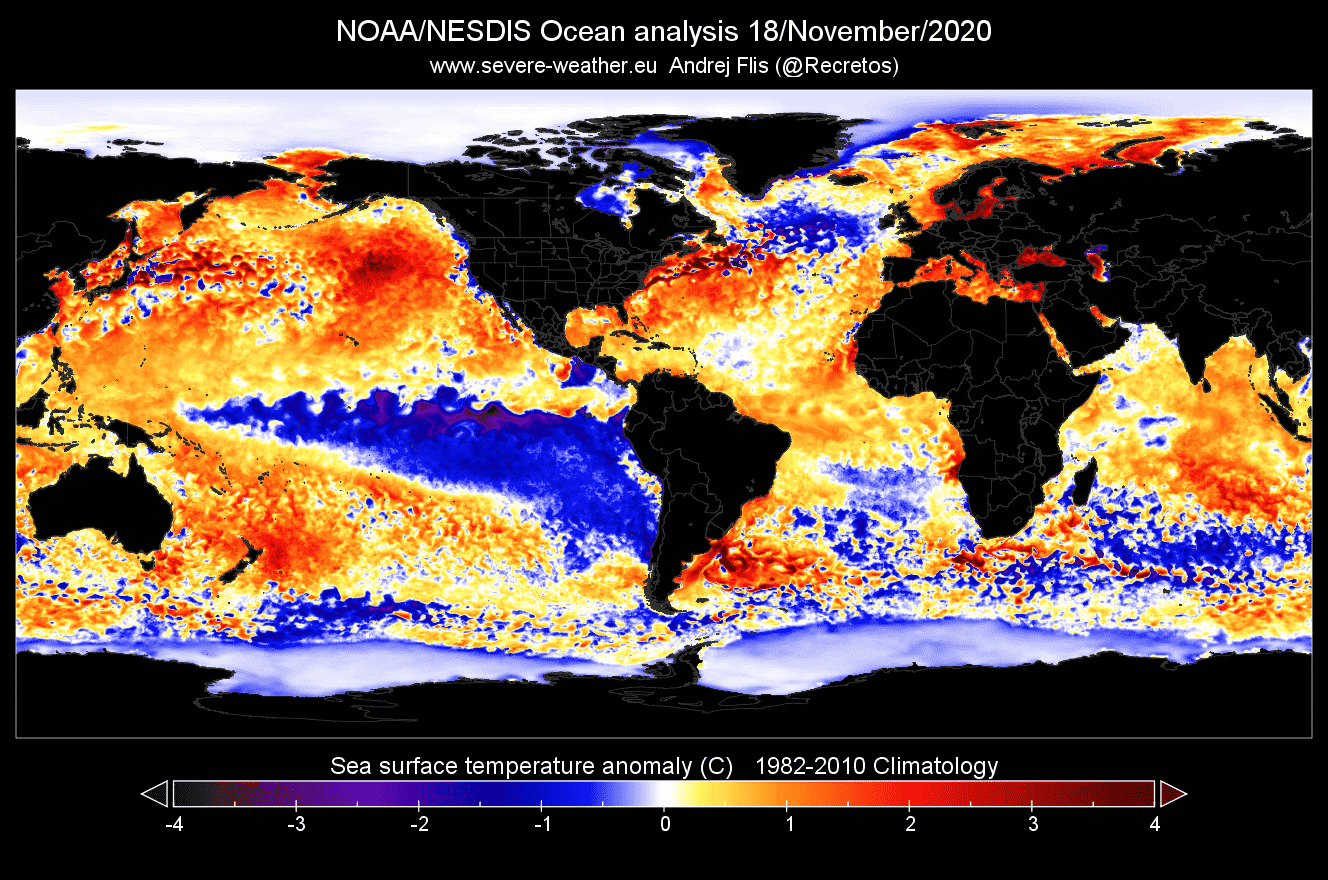
Below is the image of the global ocean anomalies, where you can see the cold ENSO phase, the La Nina in the equatorial Pacific Ocean. This has a major impact on global pressure and temperature patterns.
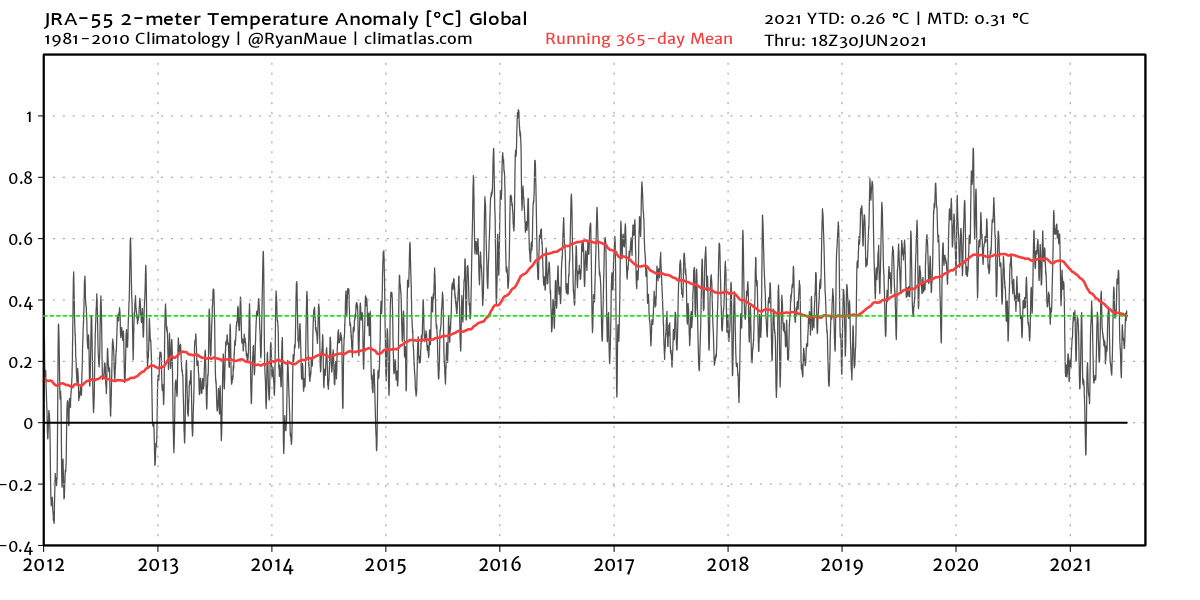
Looking more closely at the recent years, we can better see the recent temperature dip in 2021. The beginning nicely coincides with the peak of the La Nina event in late 2020. Global temperature anomalies were not seen at this level since 2014/2015.
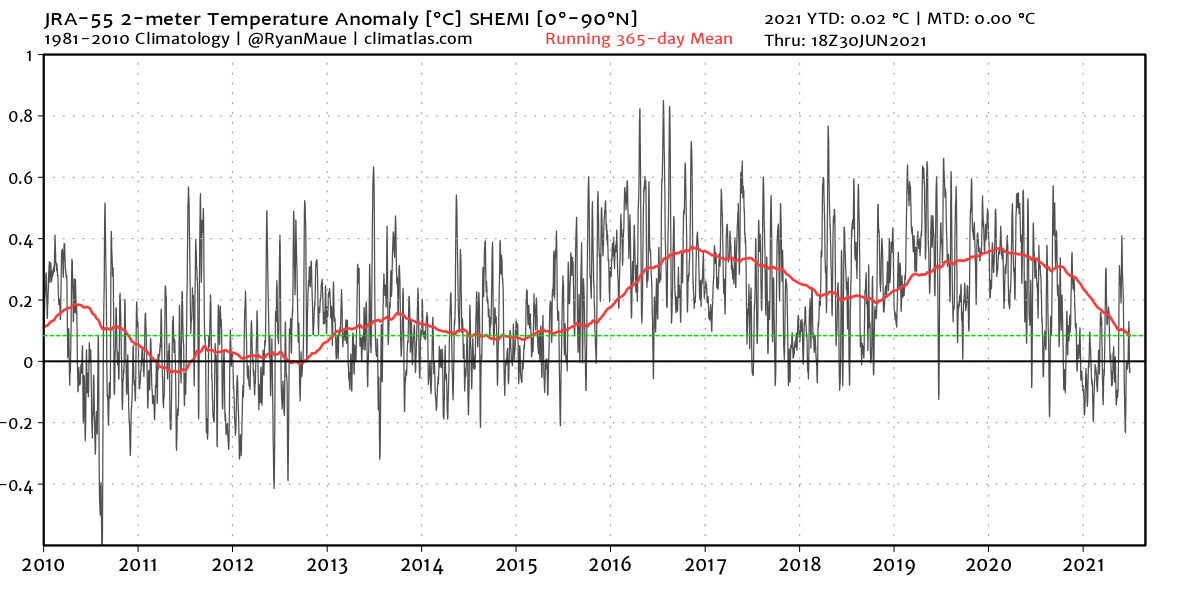
When we look more specifically at the Southern Hemisphere, we can already see that it has weaker warm anomalies than the global graph. Current conditions are around normal for the entire southern hemisphere, but also reaching the lowest point in recent years.
But when scientists talk about global warming, they do not mean these small and regular ups and downs. They actually mean the smoothed long-term trends, which are going upwards in all datasets. So the trend is going up over the years, while normal variability is causing these spikes or episodes of lower and higher temperatures.
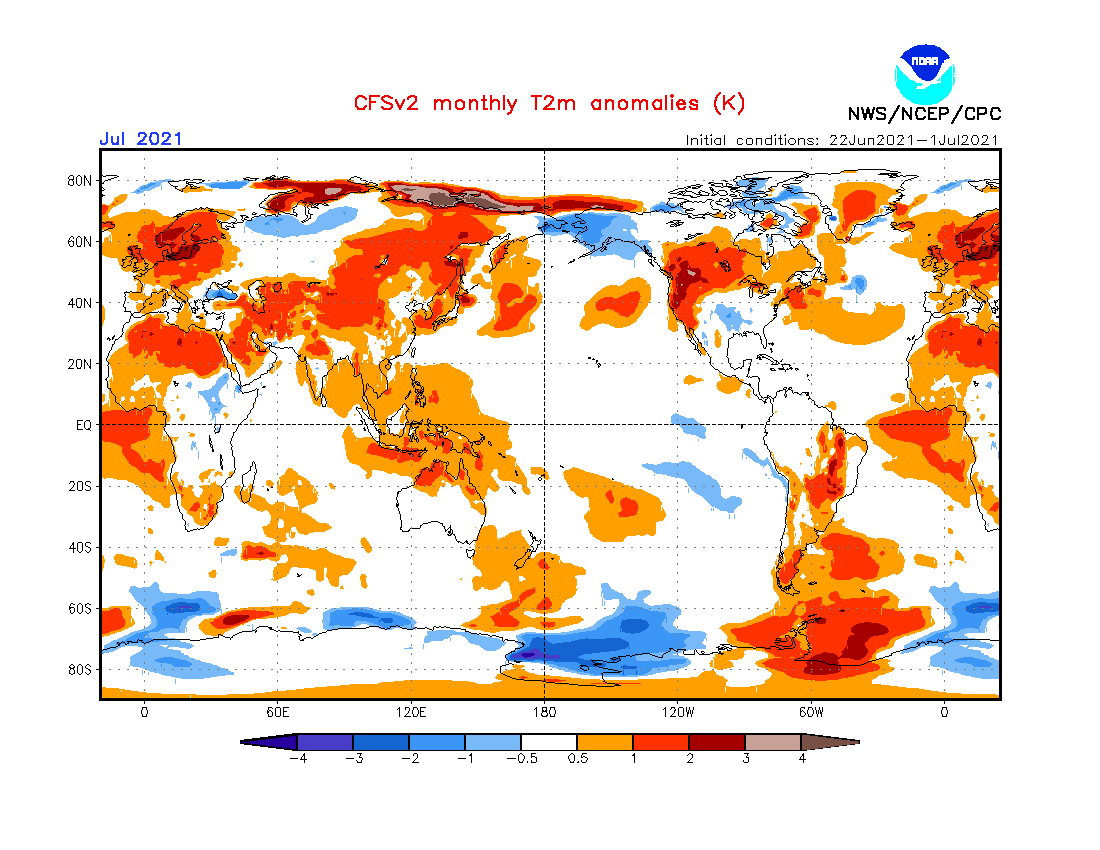
JULY 2021 FORECAST
Quickly looking ahead into the month of July, we can see the temperature forecast below. The strong heatwave in North America is set to continue for a while, along with colder than normal temperatures over the southern United States. There are currently no signs that the cold air outbreak will continue in South America, but this is a monthly averaged forecast, so many highs and lows can be hidden in the monthly average.
The pressure anomaly forecast shows a low-pressure area over the north pole and high-pressure systems below. The south pole has even stronger low-pressure anomalies because it is currently in its winter season. A high-pressure system is forecast to appear over the southeastern coast of South America, which causes northerly flow.
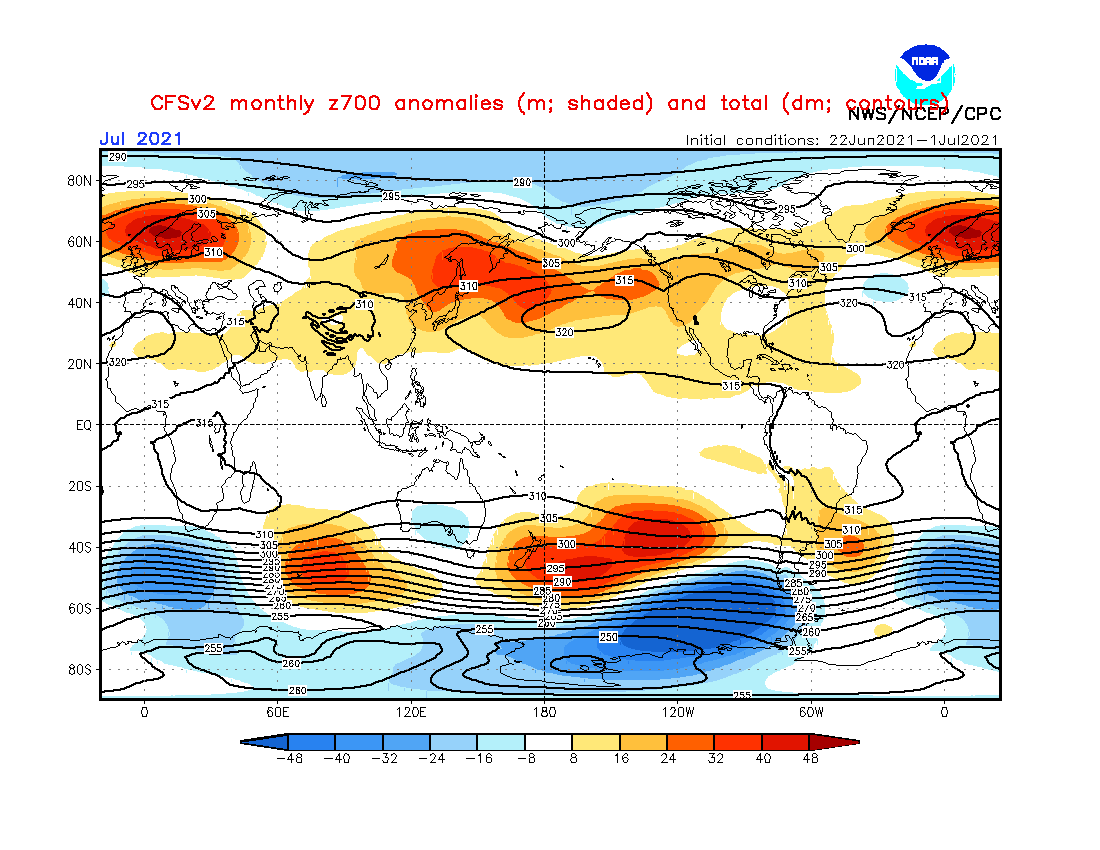
But the northerly flow in the southern hemisphere actually means warmer air, as the air is coming from (or near) the Equator. This limits the potential cold air outbreaks from Antarctica, as the high-pressure area would have to move out or weaken, to allow the cold air to move in from the south.
Another strong high-pressure system can be found over northern Europe. This will bring warmer/hot weather to northern Europe, and likely more precipitation to central and southern Europe.
We will keep you updated on similar nature and weather events around the world, so make sure to bookmark our page. Also, if you have seen this article in the Google App (Discover) feed, click the like (♥) button to see more of our forecasts and our latest articles on weather and nature in general.
SEE ALSO: