Sea ice and snow cover are increasing their extent very fast in the Northern Hemisphere. While last week’s snow extent was among the highest in 56 years in November, sea ice increase is following the 2010s mean growing rate. They will have a crucial part in the formation of the winter cold reservoir, eventually ready to run over both North America and Europe.
THE WINTER JUST STARTED
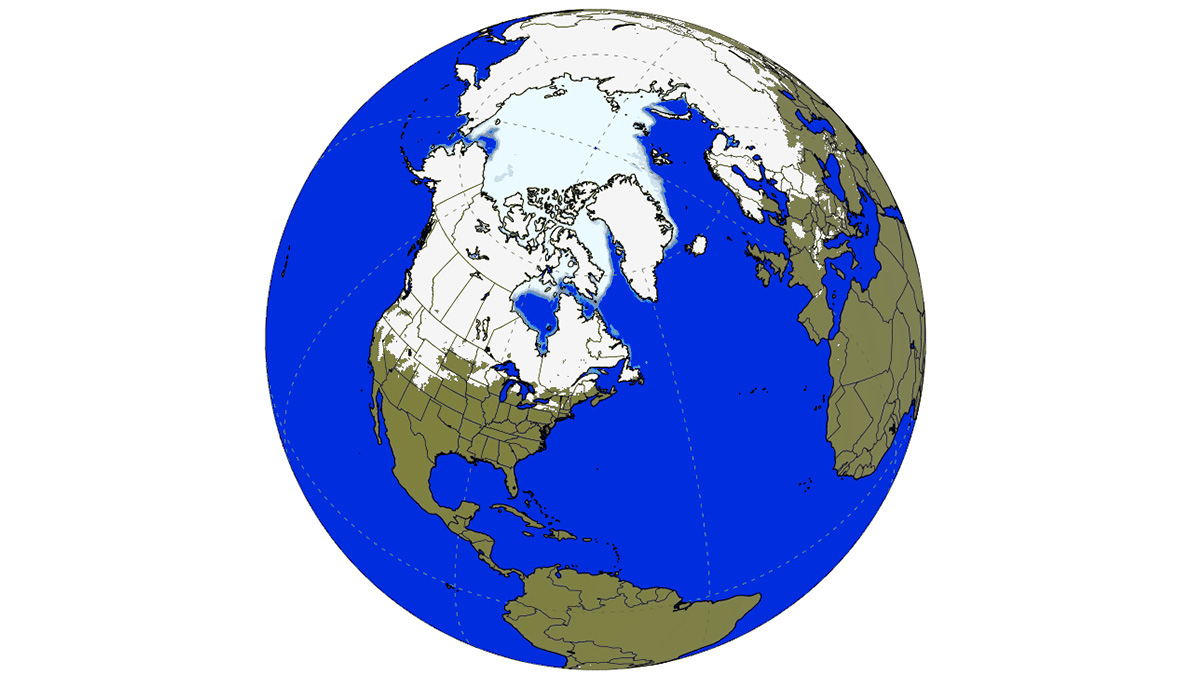
The Arctic sea ice extent is actually growing really fast in these weeks, as should be at this stage of the season. On December 1st, the Arctic sea ice extent was about 10.5 million square kilometers (3.77 million square miles), which is perfectly in agreement with the 2010s mean growing rate, according to the National Snow & Ice Data Center of Boulder, Colorado (US).
The image below shows the sea ice extent on December 1st, and it is available thanks to the U.S. National Ice Center, NOAA.

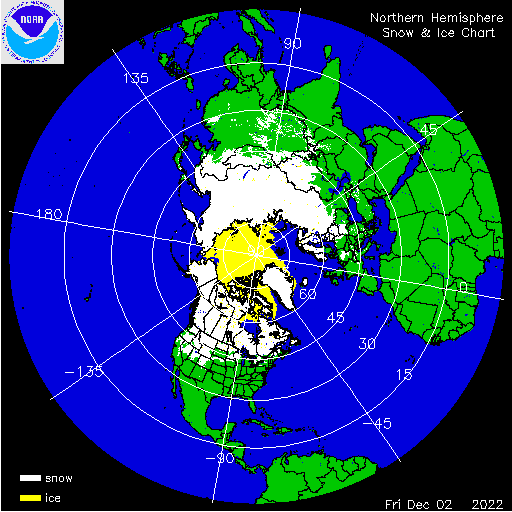
On the other hand, as we explained last week talking about snow, the Northern Hemisphere snow extent is currently very high, among the highest in 56 years, according to the NOAA/Rutgers Global Snow Lab. Snow extent covers about 40 million square kilometers in the northern hemisphere on December 1st.
The most recent snow cover information is given in the image below.
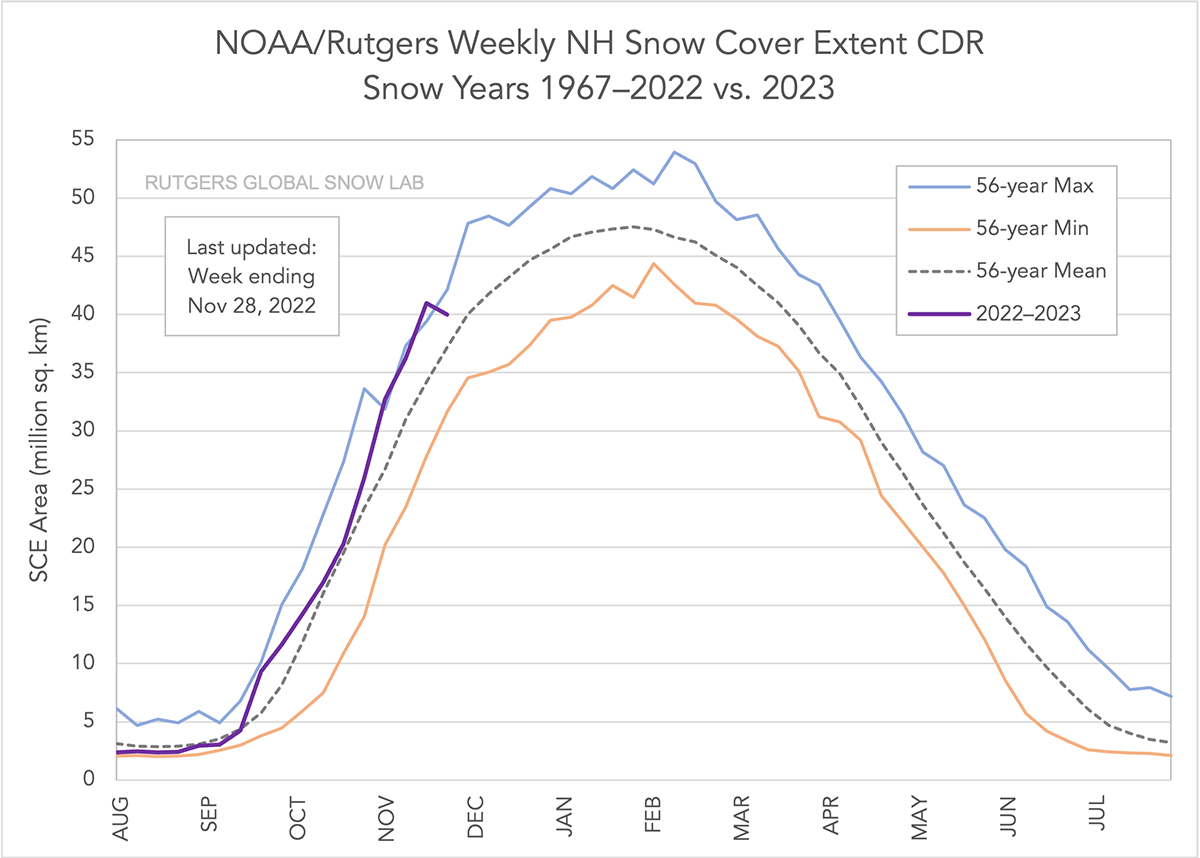
The Weekly Northern Hemisphere snow extent below for the winter season 2022-2023 in purple is plotted together with the mean (grey dashed line), maximum (blue), and minimum (orange) snow cover extent for each week. Mean weekly snow cover extent and extremes were calculated using the 56-year period from October 1966 to July 2022.
This means that, if we consider both sea ice extent and snow extent in the northern hemisphere, visible in the image below, this year we get a nice early winter picture. A lot of ice and snow are covering the sea surface and the ground, something like about 50.5 million square kilometers. This extent is roughly one-fifth or 20 % of the entire surface of the northern hemisphere, which is 255 million square kilometers.
WHAT IS SEA ICE
Sea ice means all sorts of ice that form when seawater freezes. Sea ice that is not fast ice refers to drift ice, and, if the concentration exceeds 70%, it is called pack ice. When sea ice concentration is lower than 15% this is considered open water, and the boundary between open water and ice is called the ice edge.
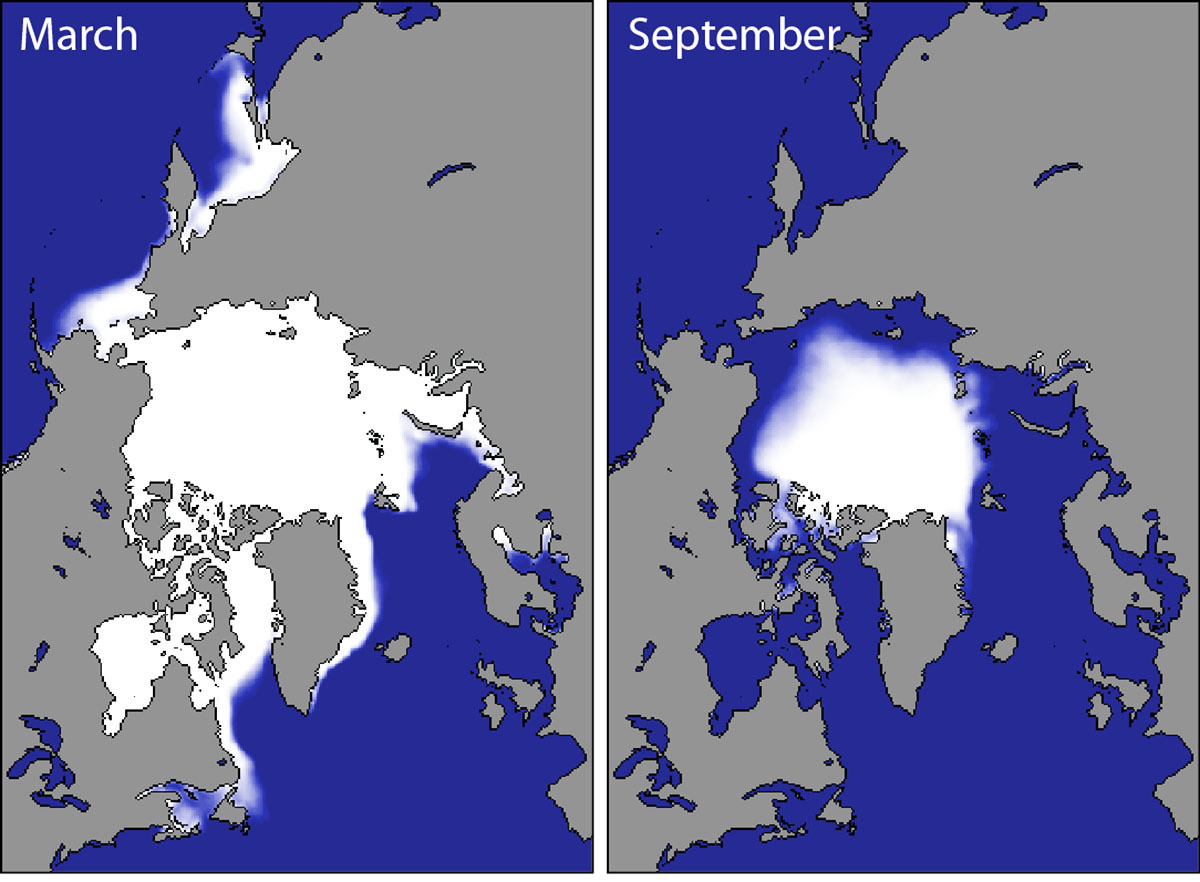
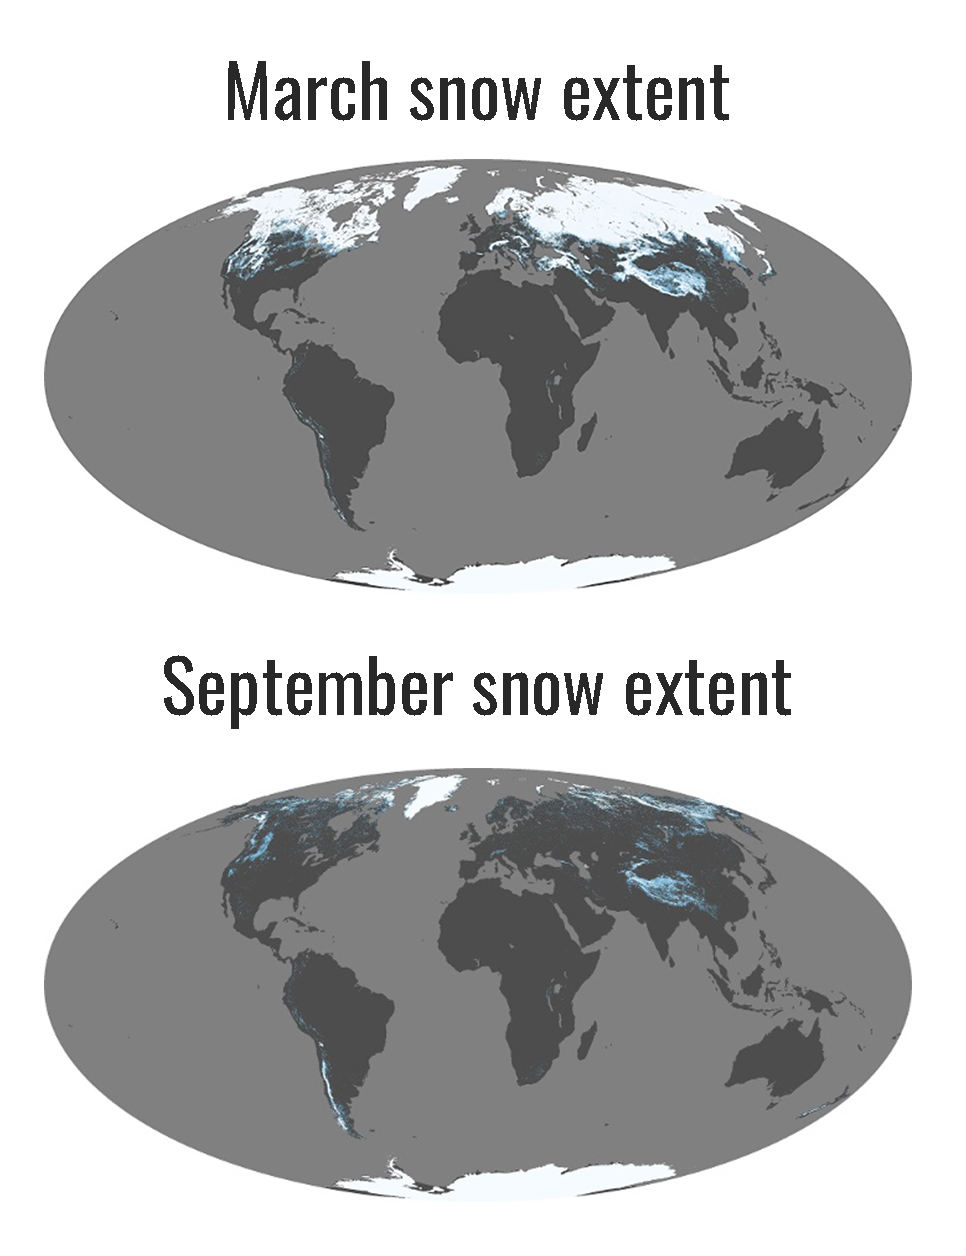
Sea ice cover in the Arctic grows throughout the winter and peaks in March. The seasonal cycle of Arctic sea ice is characterized by the maximum annual extent in March, decreasing through spring and summer to an annual minimum extent in September. In September the sea ice extension is generally only around one-third of its winter maximum.
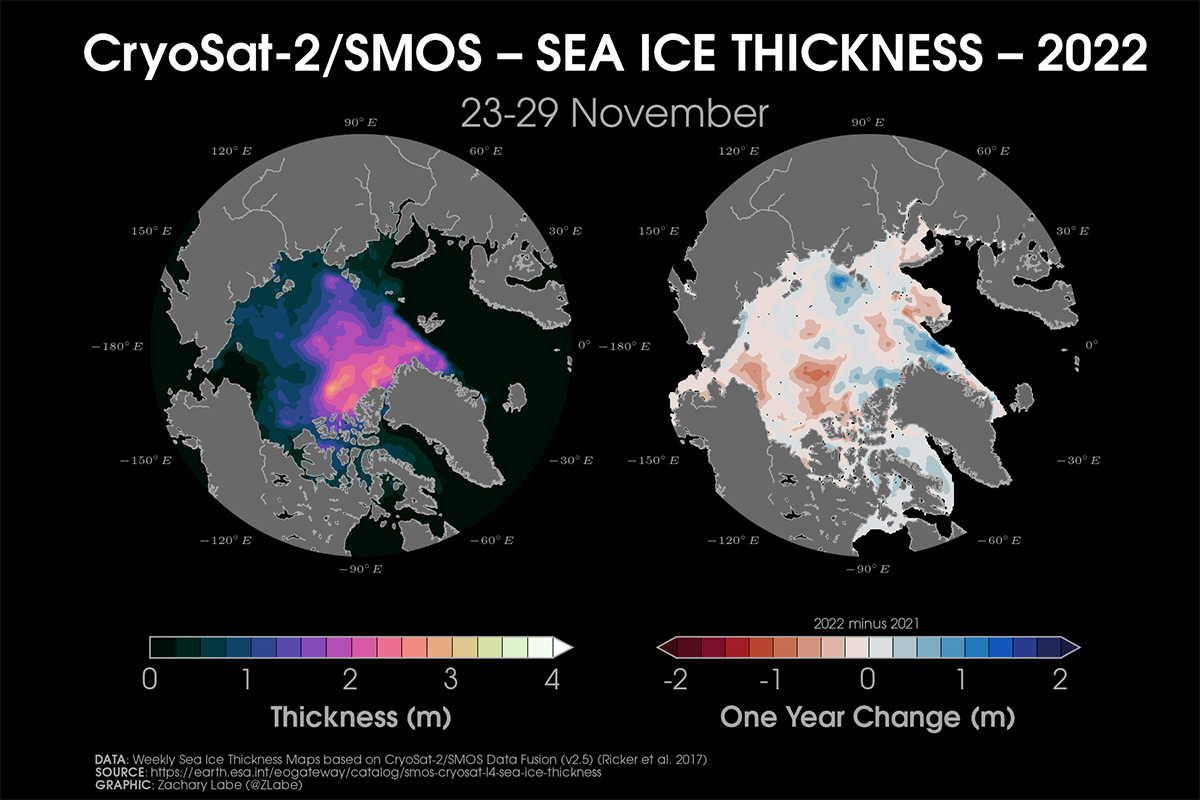
In order to get an accurate picture of the sea ice state, there is the need to determine not only its extent but also its volume. Such numbers primarily include the ice thickness, generally linked to the age of the ice. In the image below, Arctic sea ice thickness data by the Snow and Ice Data Center, University of Colorado, Boulder.
In the image below we can see the present sea ice thickness as well as a comparison with the 2021 situation in the same period.
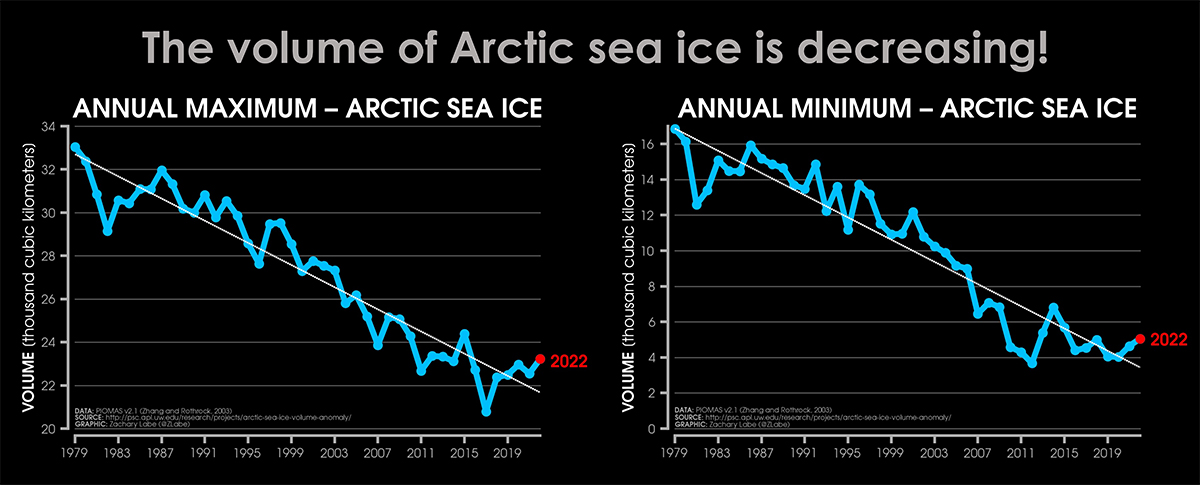
Since 1979 it has been possible to monitor sea ice by satellite. At present, We have 43 years of reliable information not only about the extent of the sea ice cover but about its volume as well. The sea ice had continuously diminished and particularly since the end of the 1990s.
Nevertheless, the winter trend is different from the summer trend.
In the image below thanks to the huge graphics by Zachari Labe, the annual Arctic sea ice volume at the end of the winter season (March maximum) and by the end of the summer (September minimum).
WHAT ABOUT THE SNOW EXTENT
Extensive snow extent early in the season is an indicator of persistent cold as we head into winter proper, mainly due to albedo and emissivity feedback.
Albedo is defined as the fraction of light that is reflected by a body or surface. On average, the Earth reflects about 30 percent of the sun’s radiation, but when fresh snow covers the ground that value nearly triples and it is close to 1.0. In fact, snow has the greatest albedo on Earth, from less than 0.60 for wet and melting snow to greater than 0.85 for fresh snow.
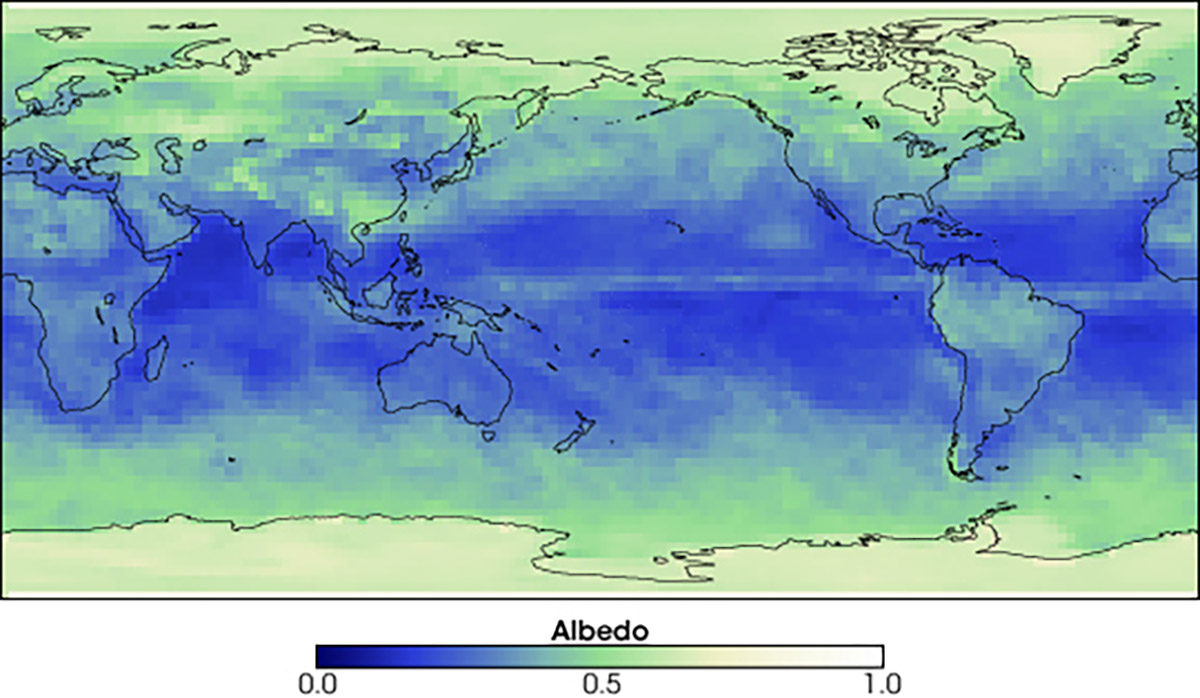
The albedo of fresh snow could be as higher as 0.95, which means it reflects back to space 95 percent of the sun’s radiation, keeping the ground and air much cooler.
It represents an important parameter in climatology since recent albedo decreases in the Arctic have increased heat absorption at the surface leading to the so-called Arctic Amplification. Practically, Arctic lands and sea are warming faster than other environments on Earth due to the positive feedback induced by the darker surface of the land and sea in summer, where there is no snow or ice on the ground or sea ice melted.

Because of the changes in the solar elevation and the global radiation with time and geographical location, the albedo effect on the surface radiation balance, thus the surface temperature, also changes spatially and temporally.
But besides albedo, snow has also high emissivity that cools the ground. Over the thermal infrared part of the radiative spectrum, snow acts almost as a “blackbody.”
The emissivity of snow varies from 0.96 to 0.99, with an average of about 0.98. Without going too much into the details, we can say that such value is generally higher than any other land surface emissivity. This means, when the ground is covered in snow in winter, the higher emissivity of a snow surface causes an increase in the outgoing longwave radiation, thus cooling the snow surface.
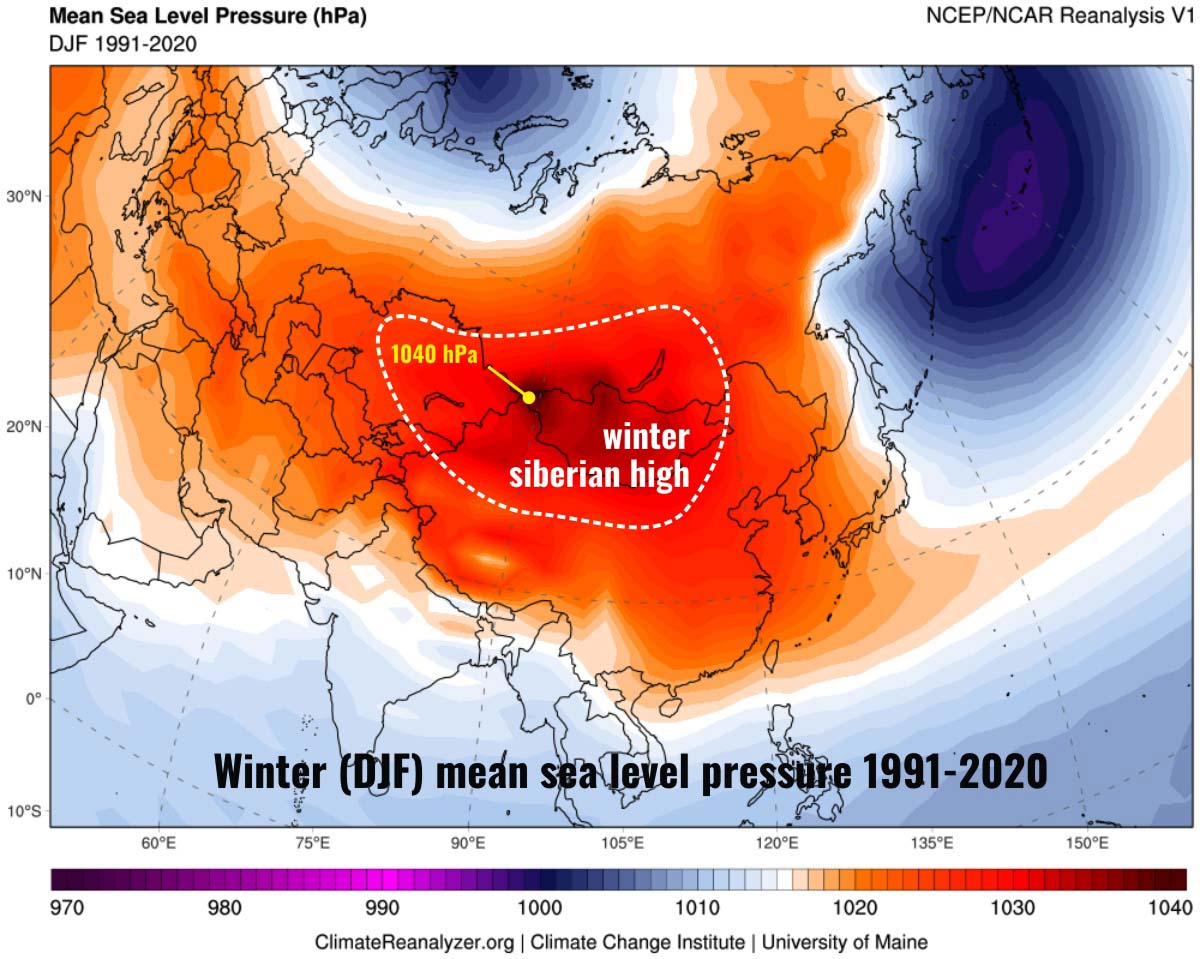
The overall impact of snow cover on the ground thermal regime depends on several factors the timing, duration, accumulation, and melting processes of seasonal snow cover. In general, cold, dry, and clear-sky conditions generate higher emissivity of snow surface resulting in surface cooling and very often the development of a low-level temperature inversion. This is the way how the well-known Siberian High forms at this time of the year.
The Siberian High is a massive pool of cold dry air that accumulates in the northeastern part of Eurasia from September until April. It is usually centered on Lake Baikal. It reaches its greatest size and strength in the winter when the air temperature near the center of the high-pressure area is often lower than −40 degrees Celsius. The Siberian High is the most important atmospheric center of action in Eurasia during the winter months.
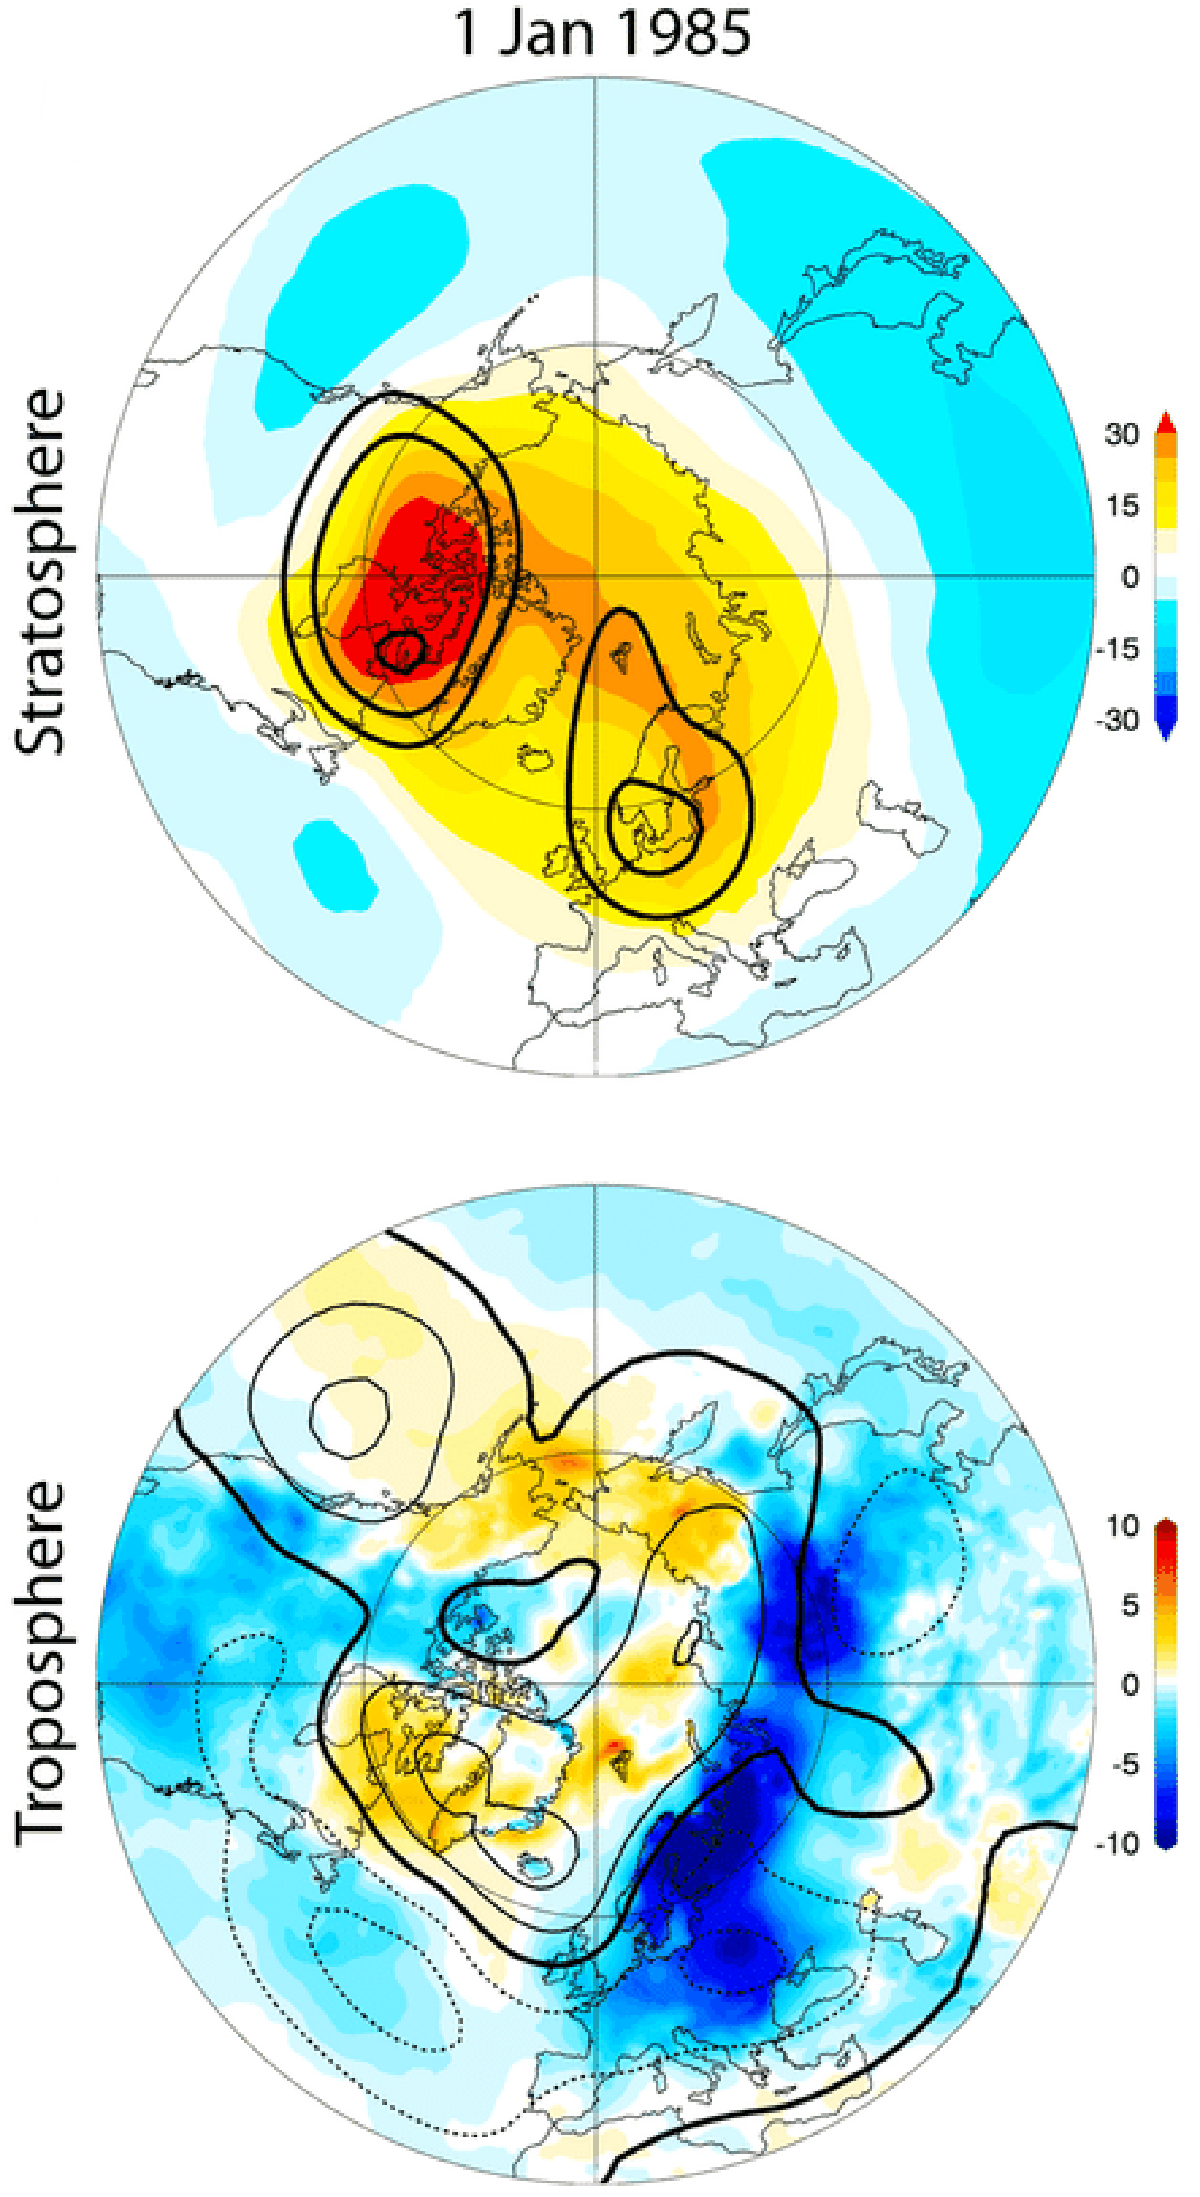
The Siberian High could strongly affect the weather in western Europe when specific patterns develop and typical retrogressive flows occur producing unusually frigid conditions over the European area. In the image below we can see a historical example from early January 1985 when severe cold outbreaks affected Europe and the Mediterranean after a stratospheric sudden warming.
The associated air mass moves in the low troposphere being formed by very cold, dry, and dense air. The Siberian High is defined as a surface anticyclones form due to downward motion through the troposphere, the atmospheric layer where weather occurs.
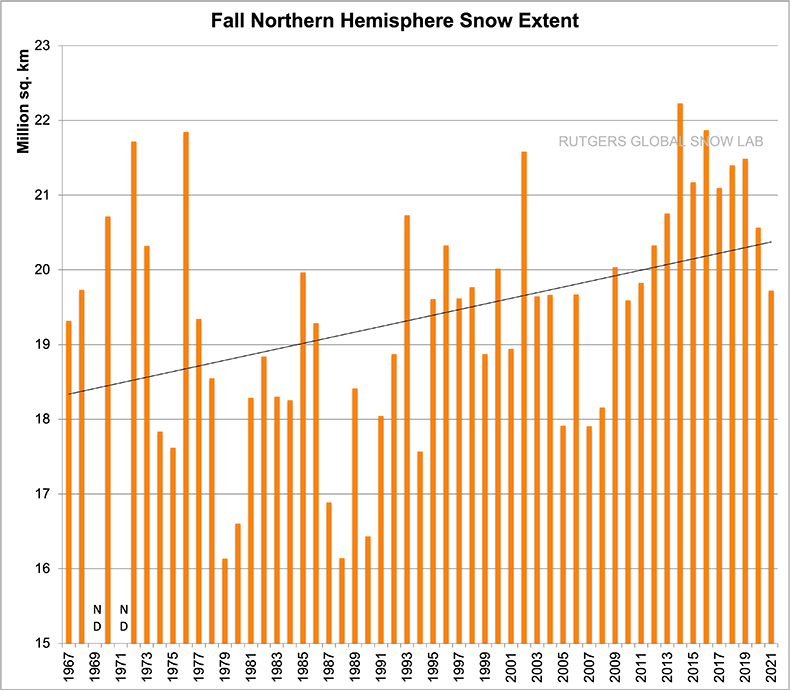
Snow extent during Fall is increasing lately, and what we are observing this year seems to fit with the recent trend in Fall Snow Extent observed both in North America, and Eurasia. As can be seen from the images below showing the snow extent in Eurasia, in the late 1960s the average was slightly above 10 million square kilometers, while now increased by about 1 million square kilometers.

In North America snow extent in Fall raised from a bit more than 8 million square kilometers to a bit less of 9 million square kilometers. Overall, the Fall Northern Hemisphere snow extent increased by about 2 million square kilometers, therefore increasing from a bit more than 18 million square kilometers to a bit more than 20 million square kilometers. Nevertheless, the annual variability is very large.
A larger-than-usual snow extent in the Northern Hemisphere at the end of the Autumn is surely a good start for the upcoming winter season. Nevertheless, several factors have to be taken into account. Snow extent is not enough to ensure a cold start of the winter season itself although it represents a useful piece of the puzzle if other events will lead to arctic outbreaks in Europe and North America.
WHAT SNOW COVER MEANS TO PERMAFROST
Permafrost is an important aspect of the cryosphere, a fundamental and integral part of the climate system in periglacial landscapes. Permafrost, by definition, refers to the ground that remains below 0°C for at least two consecutive years. More briefly, we can define it as perennially cryotic ground.
Except under very special circumstances, permafrost does not extend to the ground surface due to solar radiation and above-freezing temperature thawing the uppermost layer of ground during summer. Exceptions exist under perennial snow beds or cold-based glaciers. The uppermost layer, which freezes and thaws on a seasonal basis, is called the Active Layer.

To understand how the temperature in the ground behaves in areas interested in permafrost, we drew the sketch above. The “Y” diagram explains how the ground temperature behaves from surface to depth. Annual extremes are of course the greatest close to the surface, becoming gradually smaller and moving down.
Permafrost is a key component of the cryosphere and occupies around a quarter of the Earth’s land area in the Northern Hemisphere, as it is visible in the image below. The change in surface energy balance triggering permafrost degradation may be caused by regional changes in climate such as longer or warmer summers or increased winter snowfalls that insulate the ground from the atmosphere. Owing to its high air content, dry snow is a very effective insulator for the ground.

If the ground warms for one of these reasons, how does the permafrost react? If the ground warms up, the surface temperature extremes will rise. The same will happen proceeding in depth. As a consequence, the ‘Y’-diagram will move to the right while permafrost is warming. As you can easily see in the picture below, the Active layer will deepen and the permafrost will become thinner. This is called permafrost degradation.
So, summing up, a warmer climate in general means more water vapor available for precipitation to form, and where temperatures are low enough to form snow, this means more snow falling and covering the ground. And if snow cover is thick enough to insulate the ground, frigid temperatures will not cool down the ground and ultimately the permafrost will degrade.

BUT WHY SNOW IS CHANGING DUE TO LESS ARCTIC SEA ICE?
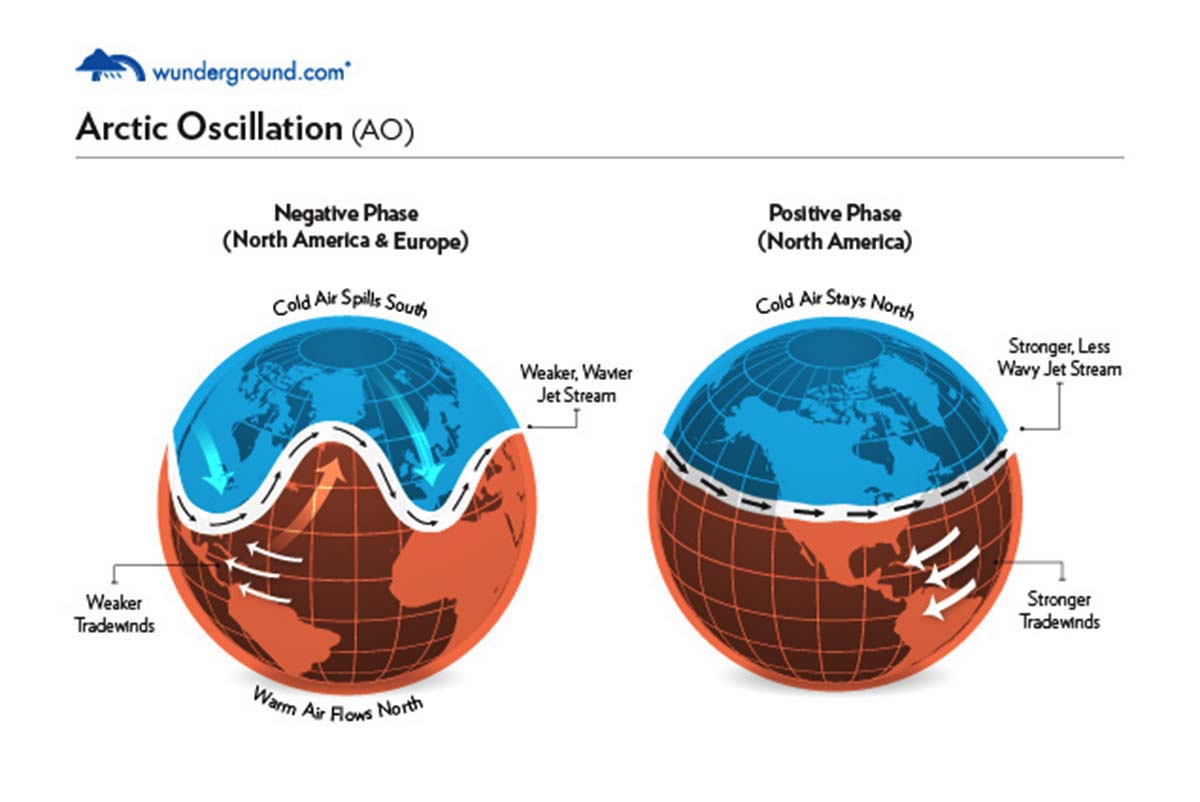
While the Arctic has been warming strongly recently, large snowfalls in recent Falls and Winters affected large parts of North America, Europe, and east Asia. Reduction in the Fall Arctic sea ice area seems to be linked to changes in the winter Northern Hemisphere atmospheric circulation pattern that have some similarity to the negative phase of the winter Arctic oscillation.
Arctic oscillation is a measure of the intensity of the polar vortex. In turn, the Arctic Oscillation (AO) has close links with the North Atlantic Oscillation (NAO) located in the North Atlantic. The North Atlantic oscillation is a teleconnection index depending on differences in the atmospheric pressure between Iceland and the Azores islands.
Figures courtesy of J. Wallace, University of Washington) from the National Snow and Ice Data Centre1.
Among meteorological enthusiasts, the polar vortex is a meteorological and climatic structure to be kept under control all the time. In particular, for example, when sudden stratospheric warming is in effect, the polar vortex is destabilized.
In a few weeks from the sudden stratospheric warming, arctic air tends to be advected at great speed towards southern latitudes. This leads to cold outbreaks with very marked negative temperature anomalies. The main issue, however, is linked to the fact that when a sudden stratospheric warming occurs, we are almost sure there will be a spill of cold Arctic air toward the southern latitudes. Anyway, it is difficult to know what the precise target of the cold will be.

In the Pacific Ocean, The North Pacific Oscillation (NPO) is an oscillation of atmospheric pressure and sea-surface temperature in the North Pacific Ocean that affects, among other things, winter temperature over most of North America. The NPO is similar to the NAO in having a low-index state and a high-index state. A low NPO index is associated with southerly winds along the west coast of North America, which tends to bring warmer air into the region. A high NPO index brings a northerly airflow, with the corresponding movement into the region of cold, sub-polar air.
The atmospheric circulation change linked to the reduction of sea ice shows much broader meridional meanders in midlatitudes and clearly different interannual variability than the classical Arctic oscillation. This circulation change results in more frequent episodes of blocking patterns leading to increased cold outbreaks over large parts of the northern hemisphere.
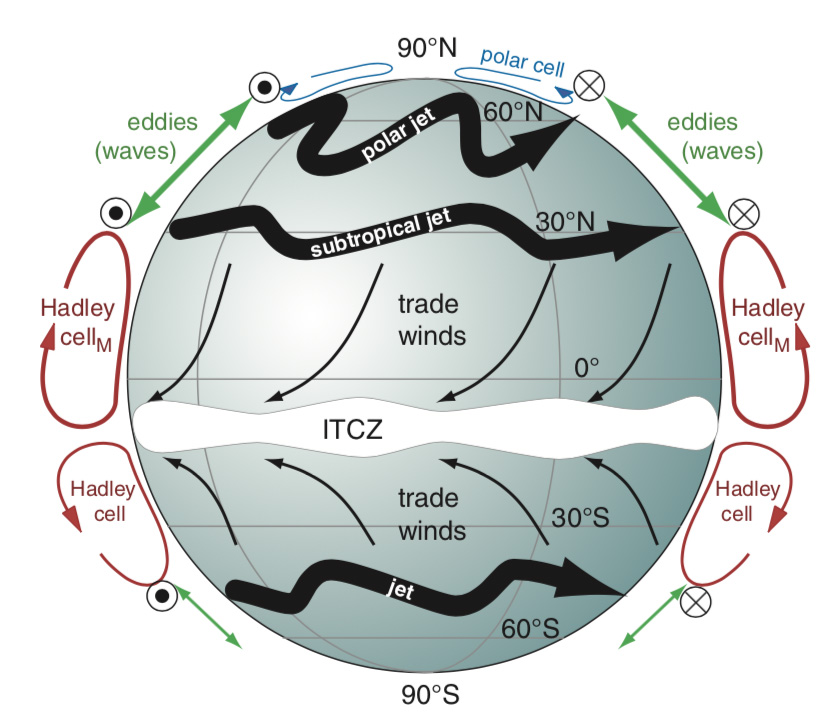
Idealized global circulation for Northern Hemisphere winter. The bulls-eye symbol indicates where a jet stream is coming out of the page toward the reader, and the “X” with a circle around it represents imagined tail feathers of jet-stream wind flowing into the page. Source: Stull, 2017: Practical Meteorology: An Algebra-based Survey of Atmospheric Science.
Moreover, the increase in atmospheric water vapor content in the Arctic region during late Fall and winter, driven locally by the reduction of sea ice provides enhanced moisture sources, supporting increased heavy snowfall in Europe during early winter and the northeastern and midwestern United States during winter. To sum up, the recent decline of Arctic sea ice has played a critical role in recent cold and snowy winters.

In the image above the time series of actual and detrended autumn Arctic sea ice area anomaly (× million square kilometers) and winter AO index in (A), while in (B) the linear regression of winter snow cover anomalies in percentage on the detrended autumn Arctic sea ice area anomaly (regions within contours denote the regression above 95% confidence level).
Scientists found that following anomalously low ice coverage in Fall, the winter sea level pressure is substantially higher over the Arctic Ocean, the northern Atlantic, and much of high-latitude continents, which is compensated by lower sea level pressure in mid-latitudes. This pattern shows some resemblance to the negative phase of the winter AO.
WHAT ABOUT EXTREME SNOWFALL EVENTS
Extreme snowfall events remain a major damaging category of extreme weather events, particularly in the northern hemisphere. Extreme Snowfall is a distinct case of precipitation since the predicted strengthening of the hydrological cycle allows for potentially more snowfall, as long as the temperature remains sufficiently cold for snow to occur.
These contrasting forces lead to a difference between forecasts of a significant decrease of mean snowfall due to global warming, and a much less noticeable decrease, or even increase, of extreme snowfalls.
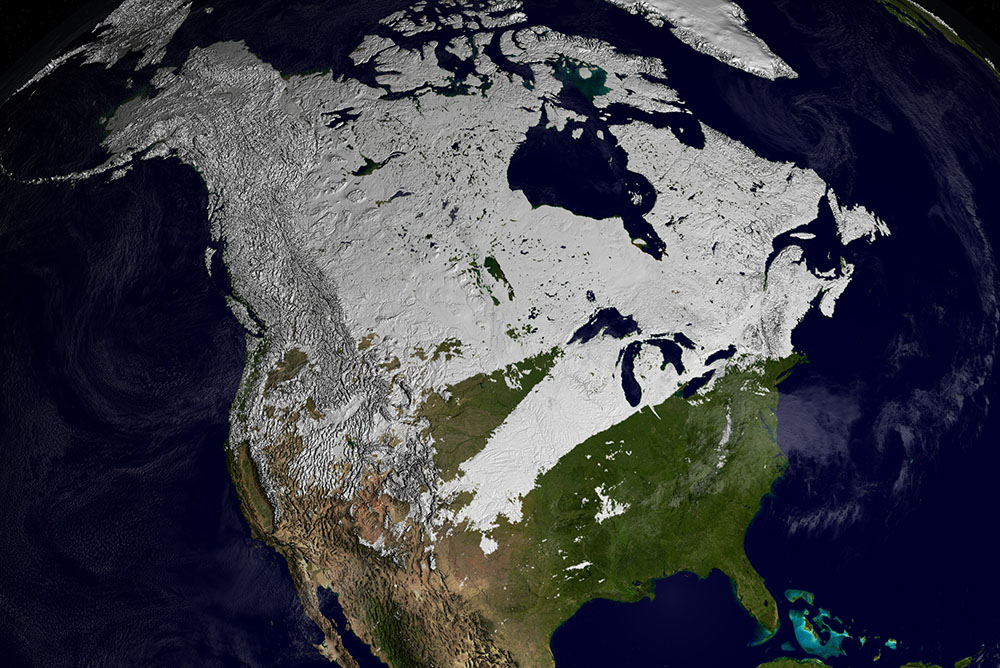
North America was covered in snow on February 2, 2002. Credits NASA
There is substantial evidence that global warming and the resulting changes in the hydrological cycle may lead to a decrease of mean daily snowfall in most areas of the Northern Hemisphere except for high latitudes. Nevertheless, under a strong global warming scenario, the forecast for extreme snowfalls increases for already snow-prone regions also in mid-latitudes.
These results have been recently presented in a scientific paper titled Regions of Intensity of extreme snowfall under future warming published in the scientific journal Nature-Scientific Reports by Quante and others. The authors stated how Due to global warming the frequency and character of precipitation are changing as the hydrological cycle intensifies. With regards to snowfall, global warming has two opposing influences; increasing humidity enables intense snowfall, whereas higher temperatures decrease the likelihood of snowfall.
Scientists show that extreme snowfall intensifies at least until the year 2050 as well as of the expected magnitude of extreme events exceeds the intensity of the historically strongest extreme snowfalls ever recorded. This is extremely pronounced for high-latitude regions. Mid-latitude regions like Western Europe on the contrary show a decreasing frequency of extreme snowfall events. Nevertheless, the most extreme snowfall events indicate that the remaining events might be more extreme than historical experienced.
In detail, Western Europe exhibits the sharpest decline in average mean snowfall ( ∼ −90 % points) and extreme snowfall ( ∼ −80 % points). Nevertheless, the few remaining extreme snowfalls do not decrease in intensity but show a slight intensification trend in magnitude ( ∼ +5 % points). See image below

In Asia, although the expected extreme magnitude increases slightly (about 5 % points) extreme snowfalls in the higher latitude region of Northern Asia will intensify greatly and even up to +50% point. By contrast, the mean snowfall decreases slightly (about −5 % points). See the map above
On the other side of the Atlantic, the east coast of the United States and Canada exhibits a much less pronounced decrease in extreme snowfalls, with high latitudes showing a substantial increase of both extreme snowfalls and their magnitude of 10-20%. All the results indicate the strengthening of extreme snowfall events in North America.

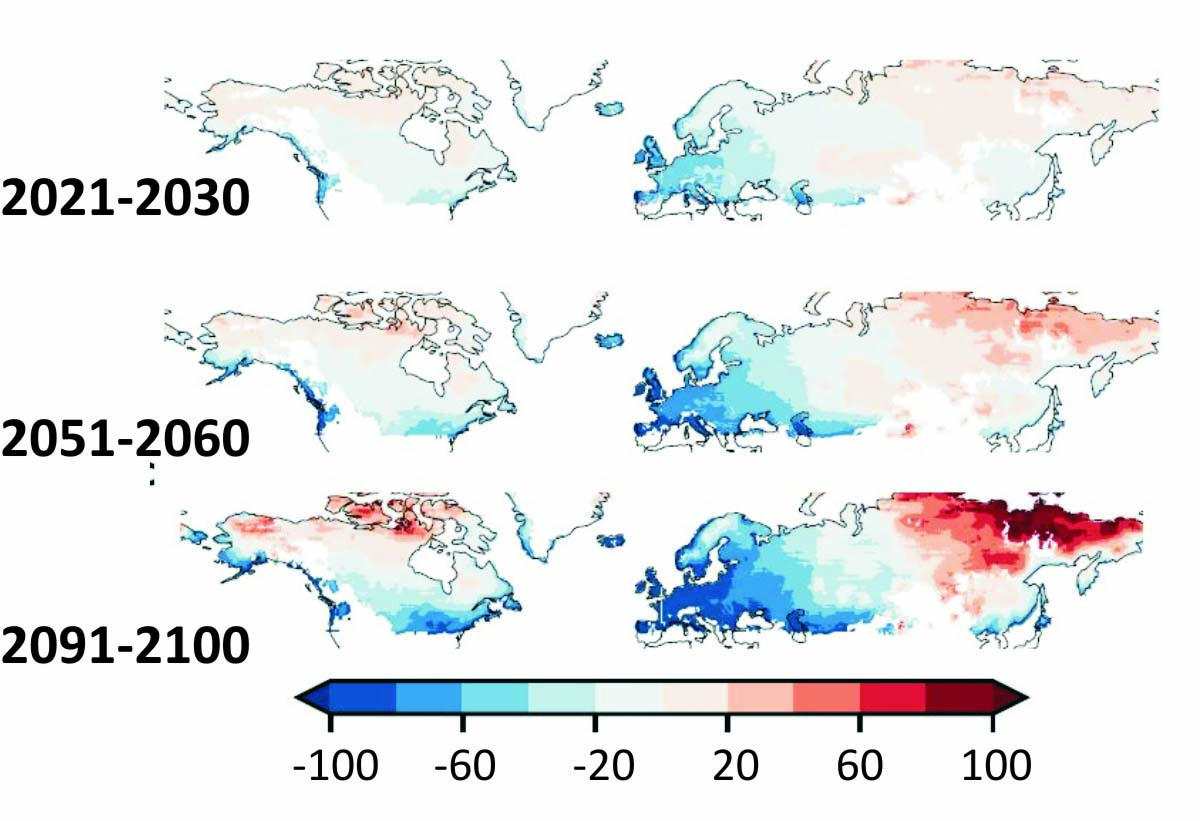
In contrast to this increase in extreme snowfall statistics, the mean daily snowfall already departs already in the near future. While snow-prone regions in high latitudes exhibit an increase of mean daily snowfall by 20% points until 2050, there will be a sharp decrease for lower latitudes of about −20 % points.
These trends continue until the end of the century, yielding decreases of up to 80% points in large parts of Europe and parts of North America, while high-latitude regions like Siberia show a similar increase of around at least 50% points.
The increase in temperatures will drastically reduce snowfall in Western Europe. The already observed and predicted intensification of the hydrological cycle does not result in an increased frequency of extreme snowfalls.
By contrast, for the east coast of North America as well as Northern Asia, sufficient temperature conditions remain for extreme snowfall to occur.
We will keep you updated on this and much more, so make sure to bookmark our page. Also, if you have seen this article in the Google App (Discover) feed or social media, click the like button (♥) to see more of our forecasts and our latest articles on weather and nature in general.