An impressive cold water anomaly in the North Atlantic called “The Cold Blob” is something likely caused by the weakening of the Atlantic Meridional Overturning Circulation, also known as AMOC. The cold blob, affecting air temperature in this crucial area of the Earth, is now slowing down Arctic glaciers from melting, new evidence has shown.
THE COLD BLOB
The cold blob in the North Atlantic represents the persistence of a subpolar cooling anomaly in the ocean’s water in that area is among the many prominent features of the global warming trend. In simple words, this cold blob means a part of the world has been able to “resist” global warming, likely because of a weakening of the Atlantic Meridional Overturning Circulation (AMOC) over the past century.
It is something that model simulations predicted and represents the same region of the world that has shown the largest cooling response to a weakening of the AMOC. But why is there this cold blob? What is the AMOC, and why is it so important for the Earth’s climate system?
AMOC, THE GULF STREAM, AND THE NORTH ATLANTIC COLD BLOB
In our planet’s climate system, the Atlantic Meridional Overturning Circulation plays a major role in regulating heat flow and determining how the climate changes and varies. As a sensitive nonlinear system, the AMOC depends on subtle differences in temperature and salinity called thermohaline variables, affecting the density across the ocean. It is among the most important parameters regulating climate transitions in the past, especially during the ancient glacial cycles and now.
Simply speaking, the AMOC (image below) carries warm water northward and sends cold water back southward deep beneath the surface. This is why Labrador is much colder than Ireland, and the western coasts of Norway are way milder than the east coasts of Greenland.
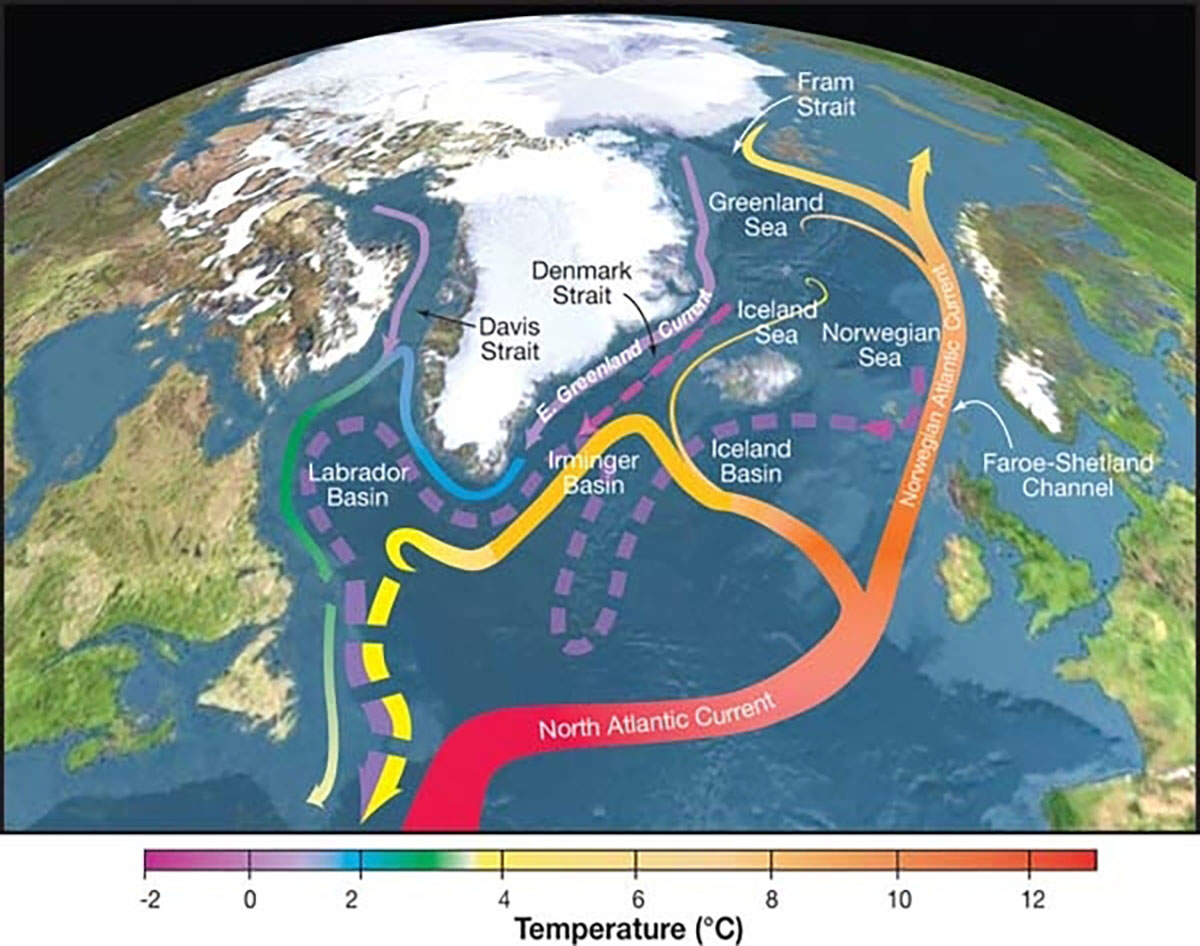
It is clear from the image below how warm water from the Gulf Stream leaves the coast of North America and flows eastwards across the Atlantic in the North Atlantic Current as it crosses the Atlantic, just where the cold blob recently formed. As a result of the warm water, heat is released into the air above. Western Europe receives the warm Atlantic air due to the dominant westerly winds that blow from latitudes between 40° and 60° North. As a result, northwest Europe experiences mild winters throughout the year.
Even though the water cools along the way, sufficient heat remains to warm the Atlantic sector of the Arctic Ocean and the eastern Barents Sea. In the winter, the warm Atlantic water also keeps the Arctic Russian port of Murmansk from becoming icebound, whereas, in the Baltic near St. Petersburg, ice covers the port for about a month each year.
Multiple studies have implicated AMOC transitions in major events in the last glacial period. For example, the phase transitions after the Last Glacial Maximum event, which occurred during the last glacial period roughly 20 thousand years ago, were also caused by subtle thermohaline density differences in the ocean.
Continuous, direct measures of the AMOC started only in 2004 when the first array of moorings was deployed across the Atlantic from Florida to Morocco. This was part of the first deployment of a huge international project called RAPID-AMOC. Since direct measures started only a few years ago, long-term reconstructions must be inferred using proxy data.
Proxy data is a way of preserving physical characteristics of the environment that can be used in place of direct measures. Many natural recorders of climate variability are used by paleoclimatologists, such as ice cores, corals, pollen, tree rings, caves, pack rat middens, ocean sediments, and lake sediments as historical data.
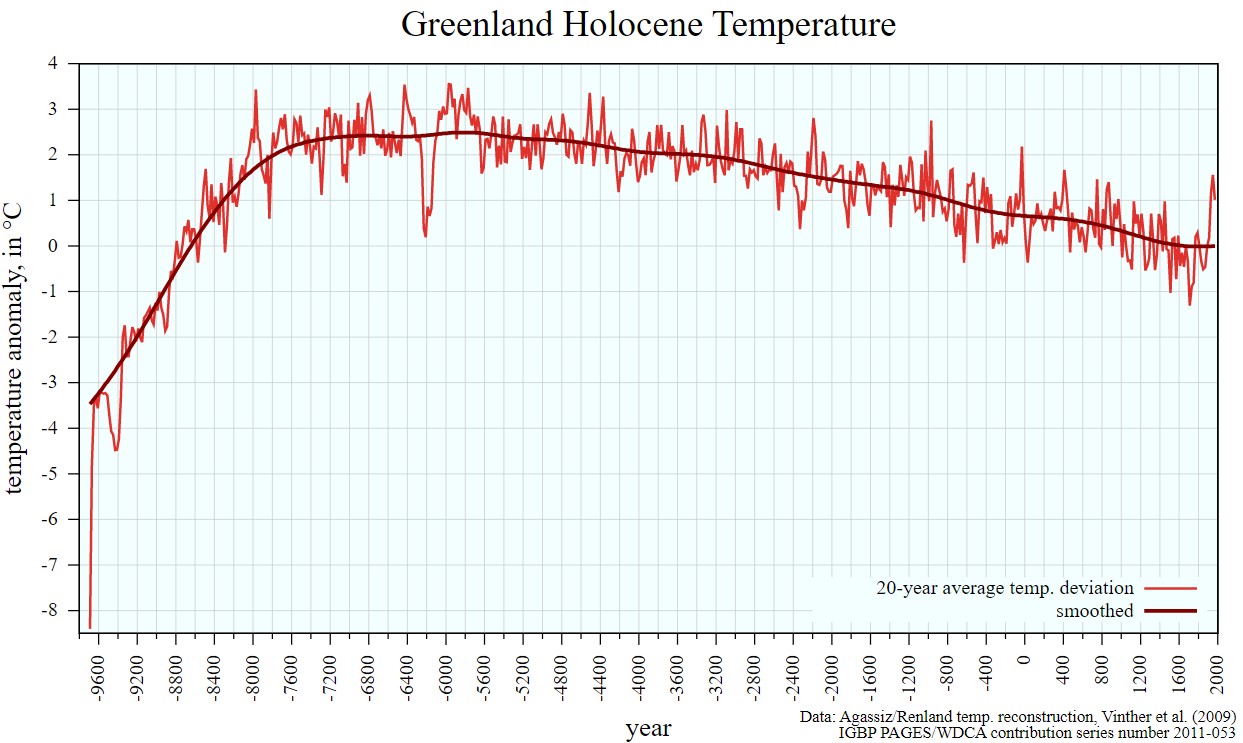
In the image above, we can see the reconstructed temperature curve for the Holocene, i.e., the last 11.7 thousand years of the Earth’s climate, inferred from ice cores in Greenland.
Nevertheless, there has been an incredible amount of research and observations conducted over the past few years, thanks to the project RAPID, that have given climatologists and oceanographers surprising results and revolutionized the understanding of the AMOC trying to understand why this cold blob formed.
The name of the project RAPID refers to ‘Rapid Climate Change.’ Rapid climate change has been brought to the public’s attention as a result of two events that took place in 2004.
First, there was a report written by the Defense Department for the Pentagon about the impact of “abrupt climate change” on the national security of the United States. Second, the movie “The Day after Tomorrow” depicted the sudden onset of an ice age as the AMOC abruptly stopped and the “great ocean conveyor” ground to a halt.
One of the main characteristics of the AMOC is the flow of warm water in the surface ocean that is pushed northward and the flow of cooler water in the deep ocean that is pushed southward. When this warm, salty water flows northward, it loses heat to the atmosphere, leading to increased density simultaneously.

In the image above, we can see the RAPID array across the Atlantic at 26 degrees north. Moorings measure temperature and salinity continuously from the seafloor to within a few meters of the surface. Based on this information, it is possible to calculate surface-to-bottom density profiles and use them to calculate transatlantic pressure gradients based on the surface-to-bottom density profiles.
In the eastern US, the Gulf Stream, which hugs the continental shelf, is mainly responsible for the northward flow at the surface. Using submarine telephone cables, the NOAA Atlantic Oceanographic and Meteorological Laboratory in Miami monitors the Florida Strait flow, measuring the water’s current.
At some point, it becomes dense enough to sink, and as it sinks, it flows back southward at great depth, mainly in the Deep Western Boundary Current at depths of 3000 to 5000 meters. As a result, the high-latitude Atlantic receives heat from the tropics by channeling it through this vertical overturning circulation. In that area, the cold blob formed.
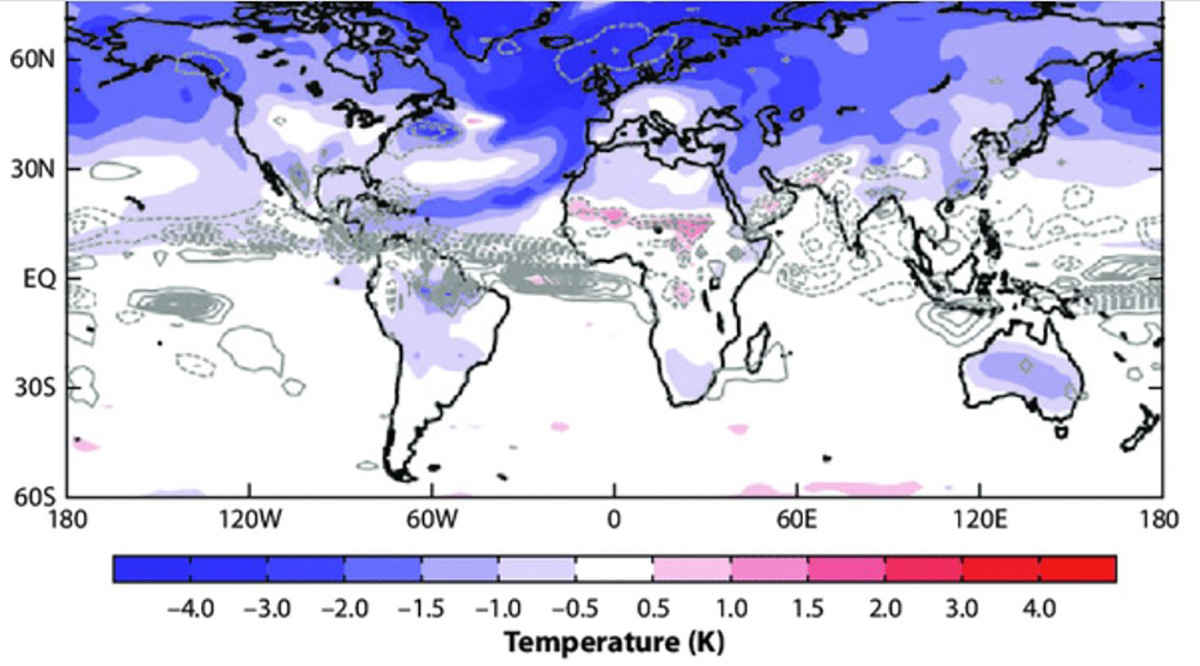
Climate impacts of the thermohaline shutdown on global climate as simulated by a coupled model that incorporates several factors.
Earlier climate simulations in the image above, done before the start of the RAPID program, showed that if the AMOC shut down, winter temperatures in northwest Europe might fall by as much as 4°C over only 10 years.
If the AMOC reaches its tipping point, it may take 100 years or even more to recover. This means the climate would drastically change in vast areas of Europe and North America, becoming cooler.
There may be a paradox in the idea that global warming may be a factor in the cooling of Western Europe. The explanation for this can be found in the delicate balance between temperature and salinity that controls how water flows vertically in the Atlantic Ocean.
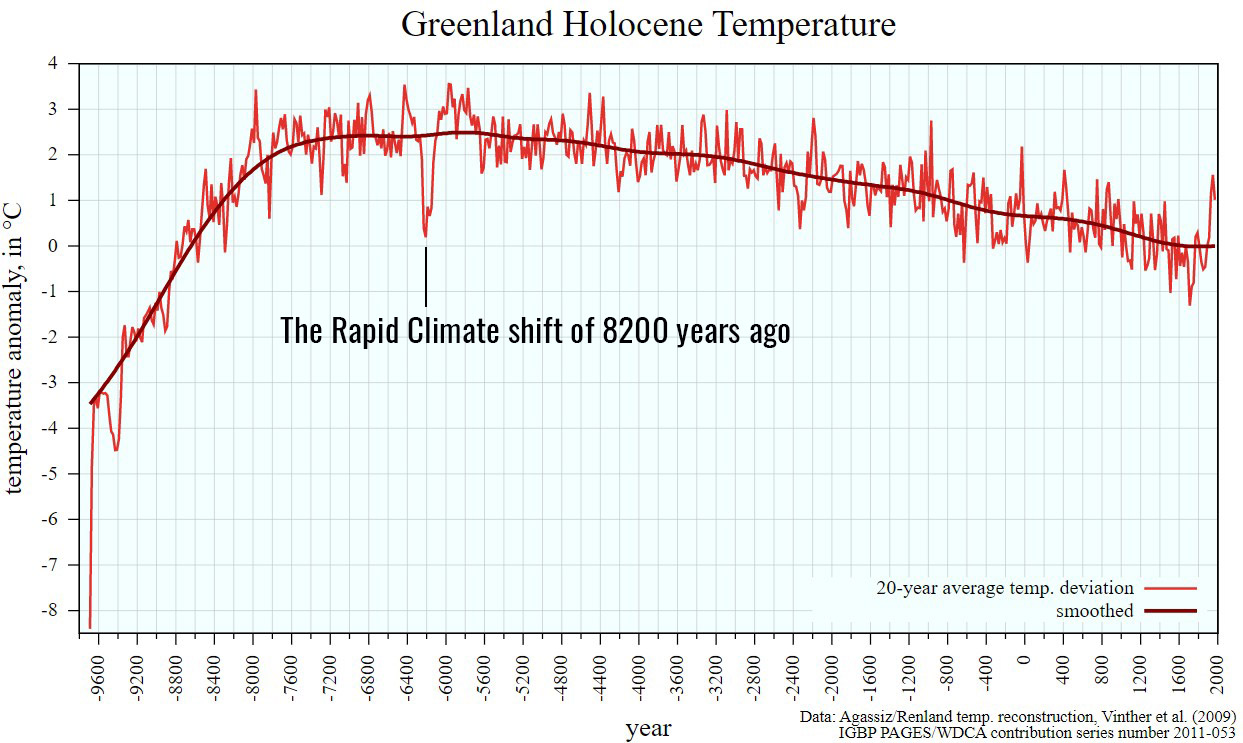
When the world emerged from the last ice age, there was a period when such temperature changes suddenly happened. This most recent event occurred approximately 8,200 years ago when meltwater from the Laurentian ice sheet in North America flooded the North Atlantic. The image above again shows the Greenland Holocene temperature plot highlighting the rapid climate change that occurred 8,200 years ago.
In the North Atlantic region, evidence of widespread cooling has been found in ice cores from Greenland, lake sediments, peat bogs, and speleothems, all of which are evidence of the event. A few dated glacier moraines related to that event in the Alps can also be found. According to the paleo record, there was a period of extremely rapid cooling of about 10-20 years, followed by a much slower recovery. The entire event lasted about 100-160 years.
We explained above that as salty Gulf Stream water cools at high latitudes, it becomes denser than the deep water below and sinks. Specifically, the formation of the North Atlantic Deep Water and its return southward are the two key factors that drive the AMOC system.
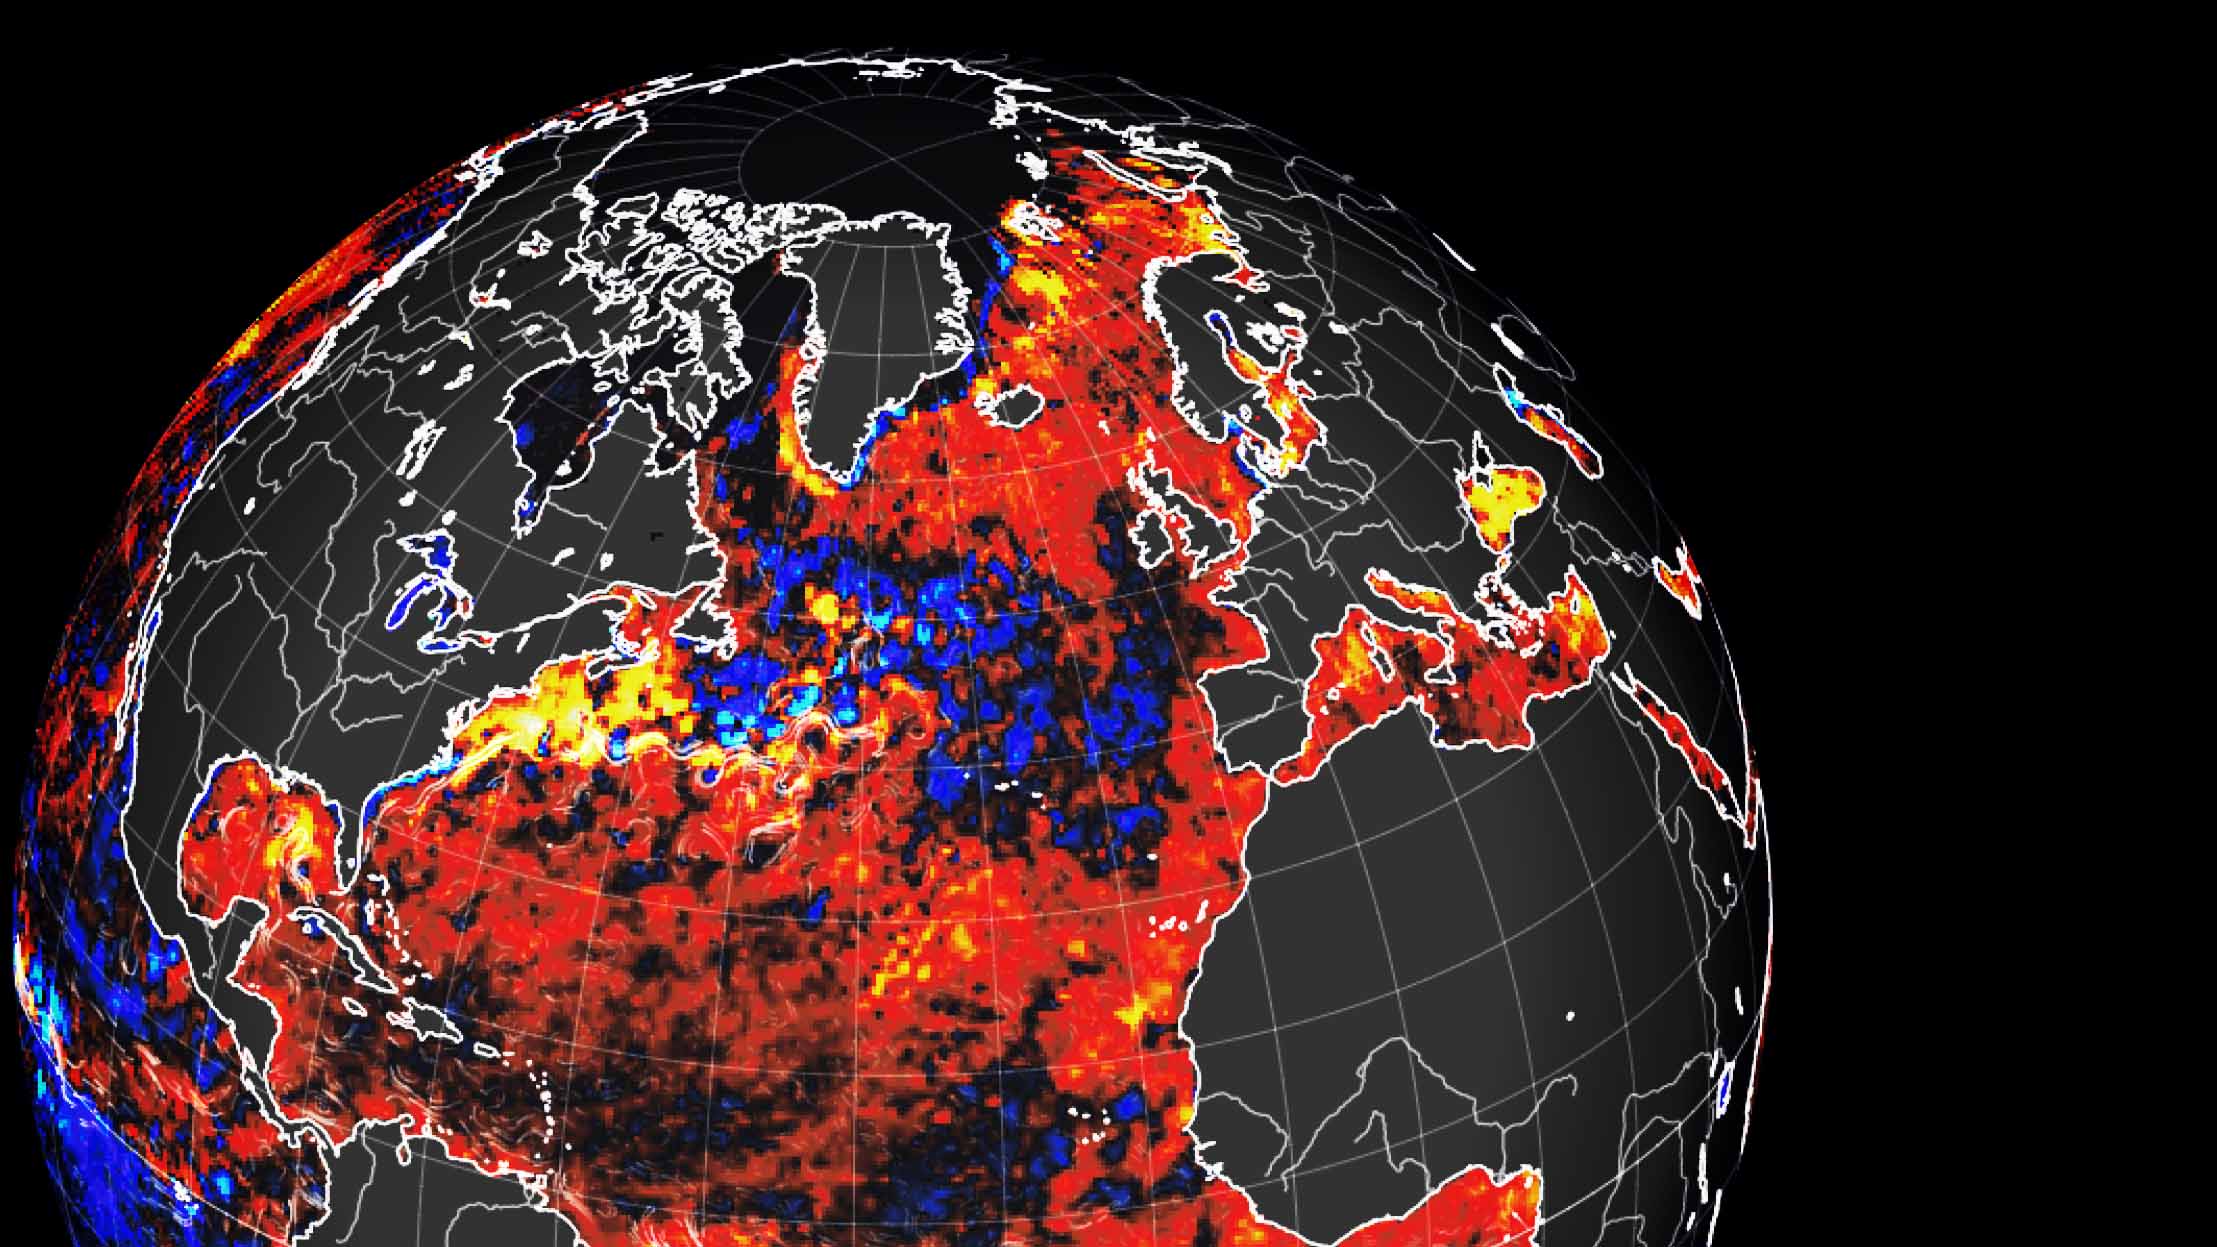
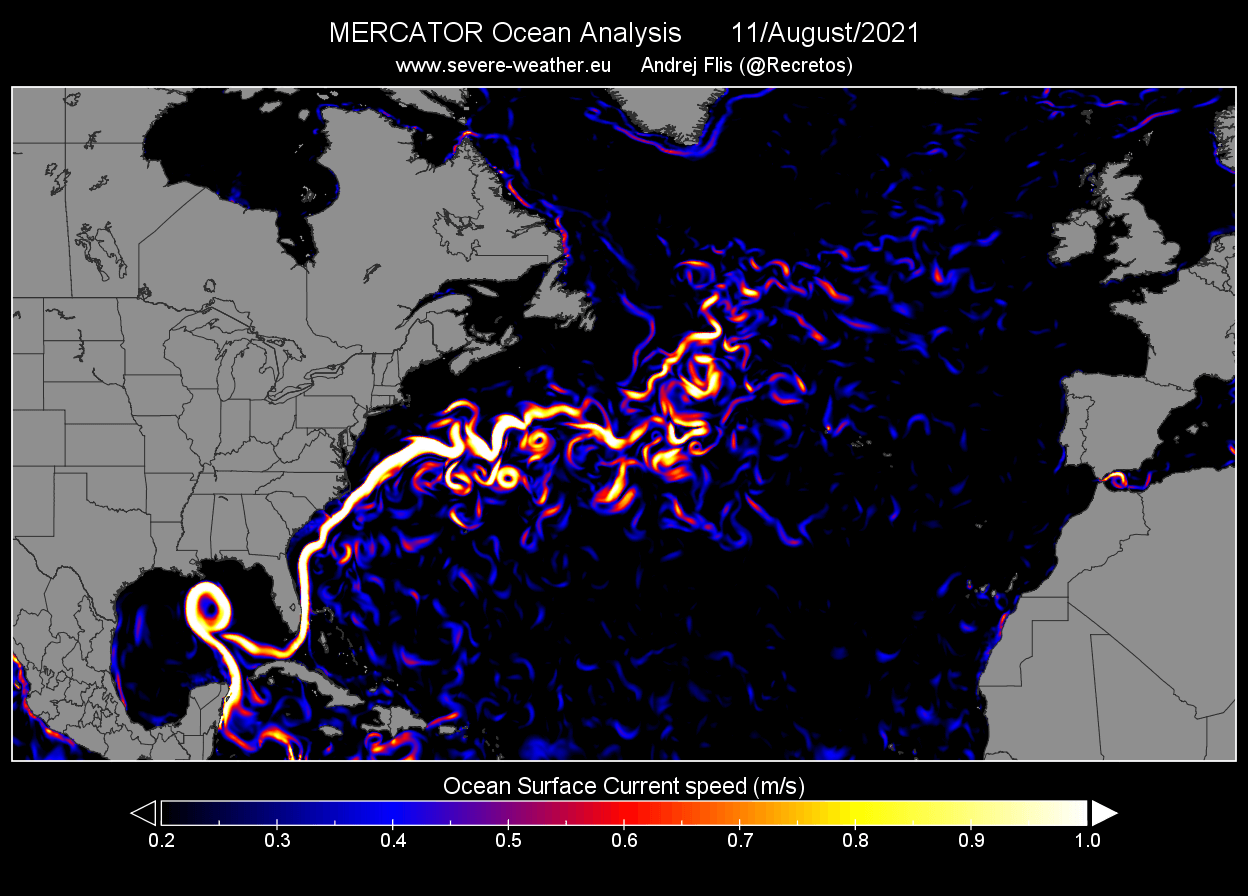
The image above from Andrej Flis shows the ocean surface current speed, where the Gulf Stream stands out and can be seen in its most raw shape and form. If you want to know more about the Gulf Stream, you can read about it on Learnweather.
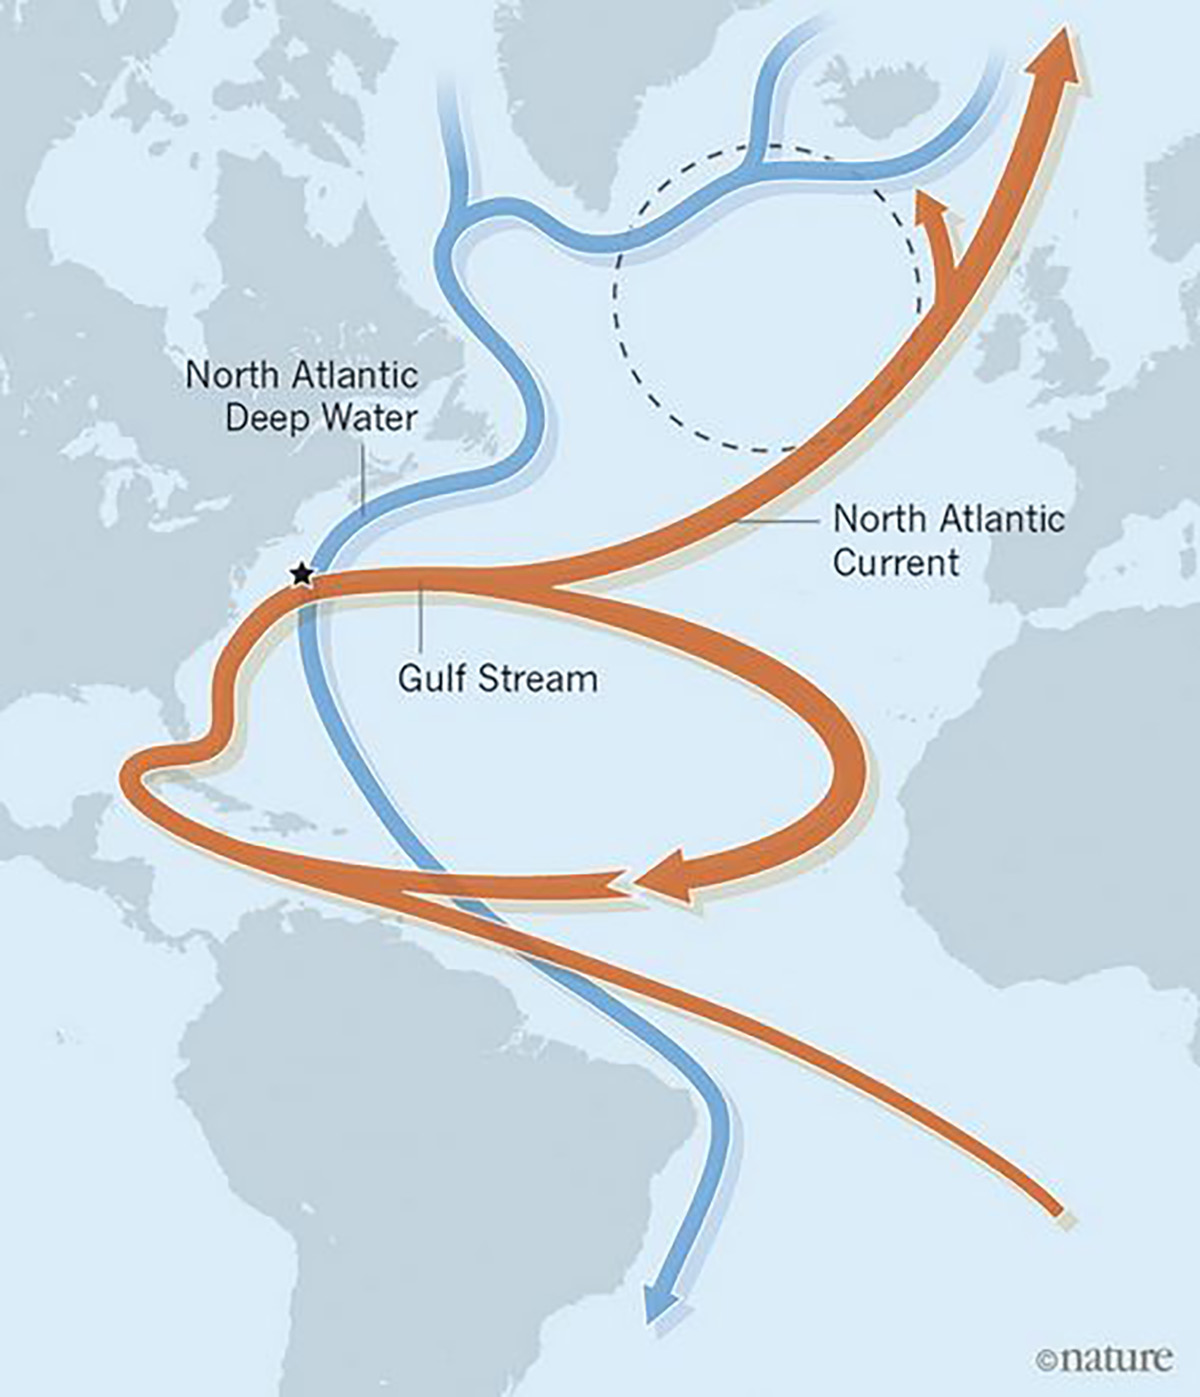
The map above shows the outline of the North Atlantic part of the AMOC, of which the Gulf Stream is a part. Four continents experience the effects of the Gulf Stream. The current, moving west from the coasts of Africa, has a significant impact on the weather patterns across the world, from Caracas to Miami and eventually to Europe. As warmer water sweeps past continents, it slowly turns into cooler water farther north as it makes its way toward the Arctic.
Before bending toward the British Isles, the Gulf Stream propels the heat of the Caribbean past Cape Hatteras, N.C.
Across the North Atlantic, one of the arms of the Gulf Stream breaks towards Iceland, transporting vast quantities of heat far northward. One estimate puts it at 78,000 times the amount of heat Scandinavia uses daily. A large swath of the world might seem very different if there were no current like this one – a heat pump on a global scale – many research scientists believe.

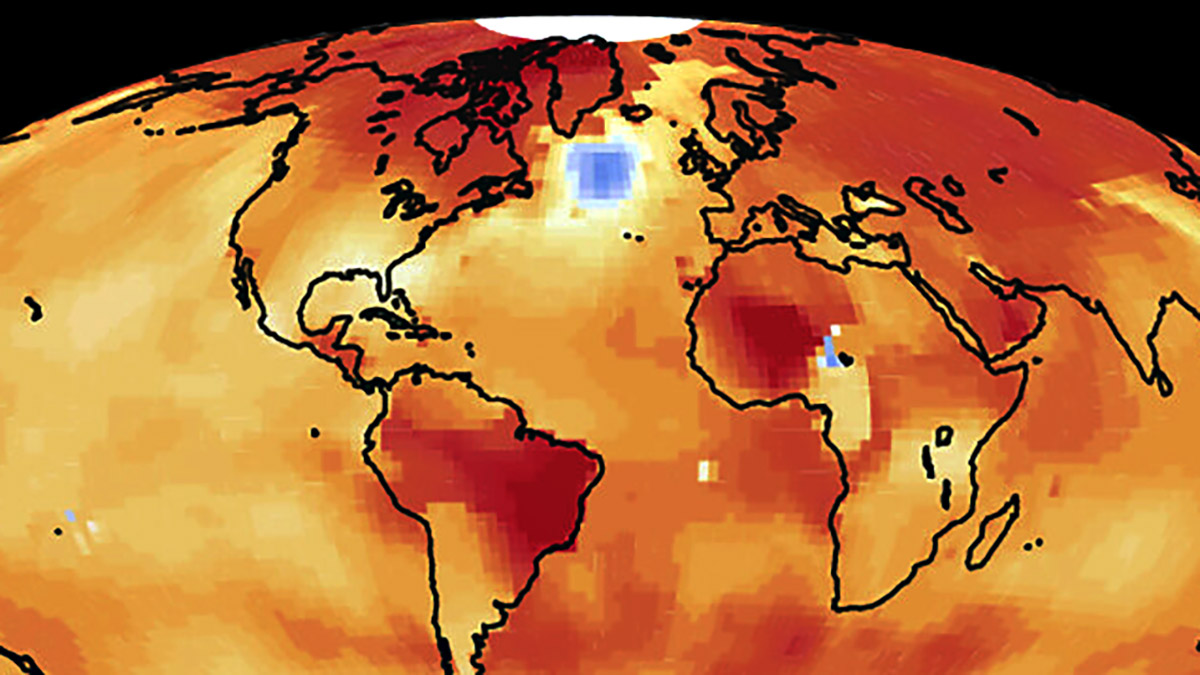
The reason for concern is that the ocean temperatures to the southeast of Greenland have been gradually colder in the past several years, despite record-warm global temperatures. The National Oceanic and Atmospheric Administration have provided temperature maps showing continuously decreasing temperatures in and around a region known as the Irminger Sea, located just north of the Arctic Circle.
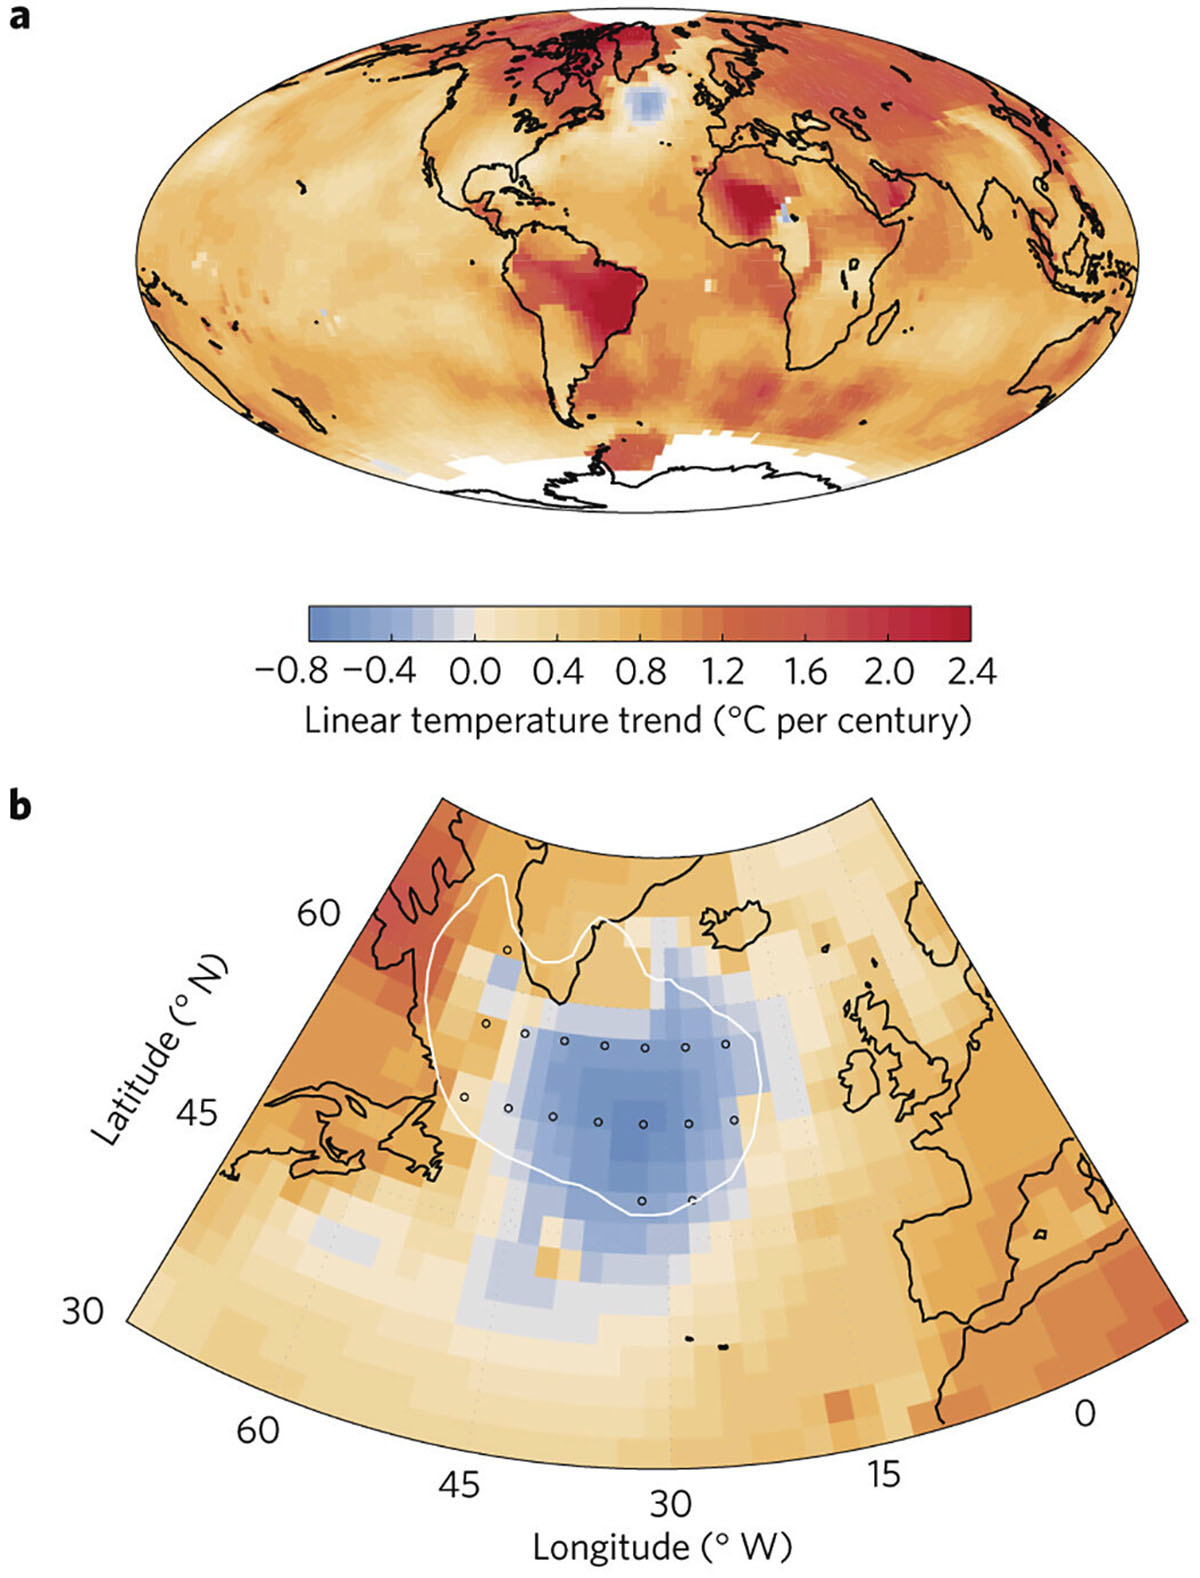
This observation is coupled with recent research suggesting that there has been a slowing down of the AMOC in the ocean. This vast and apparent anomaly is called the cold blob. In the image above, you can see the sea surface temperature trend from 1993 to 2018. Whilst the Atlantic and the Mediterranean are warming; the Irminger Sea is cooling. Instead, in the image below, we can see the linear temperature trend per century in degrees Celsius, according to a recent scientific publication by Stefan Rahmstorf and others.
The cold blob might indicate that less warm water and less overall heat, generally, are making their way northwards due to the effects of global warming. This development has long been predicted as a result of global warming.
If surface water in the North Atlantic becomes less salty, likely, it will no longer become dense enough to sink, regardless of how much it cools down. The formation of the North Atlantic Deep Water would stop. As a result, the ocean’s poleward heat transport and the flow of mild Atlantic air across Western Europe would also cause a rapid drop in the temperature there, mainly during the wintertime.
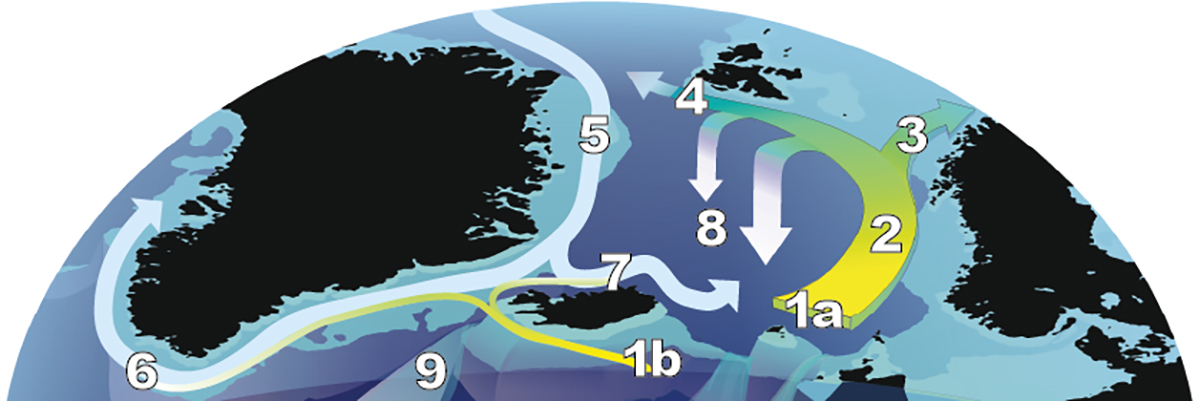
The North Atlantic Deep Water formation occurs between Greenland, Iceland, and Norway due to the cooling and sinking of warm, salty water from the Gulf Stream system as it passes through the Nordic seas. In the image above, we can see how the North Atlantic Drift Current splits from the North Atlantic Current and carries Gulf Stream Water northwards to the South of Iceland (1b in the image above) and past Scotland into the Nordic Seas (1a).
This warm water continues north as the Norwegian Current (2), which splits into two streams as it reaches the Arctic. The North Cape Current (3) flows into the Barents Sea and warms the western regions of the Russian Arctic. West Spitsbergen Current (4a) enters the Arctic Ocean through the Fram Strait between Greenland and Svalbard and then passes through Scotland into the Nordic Seas (1a).
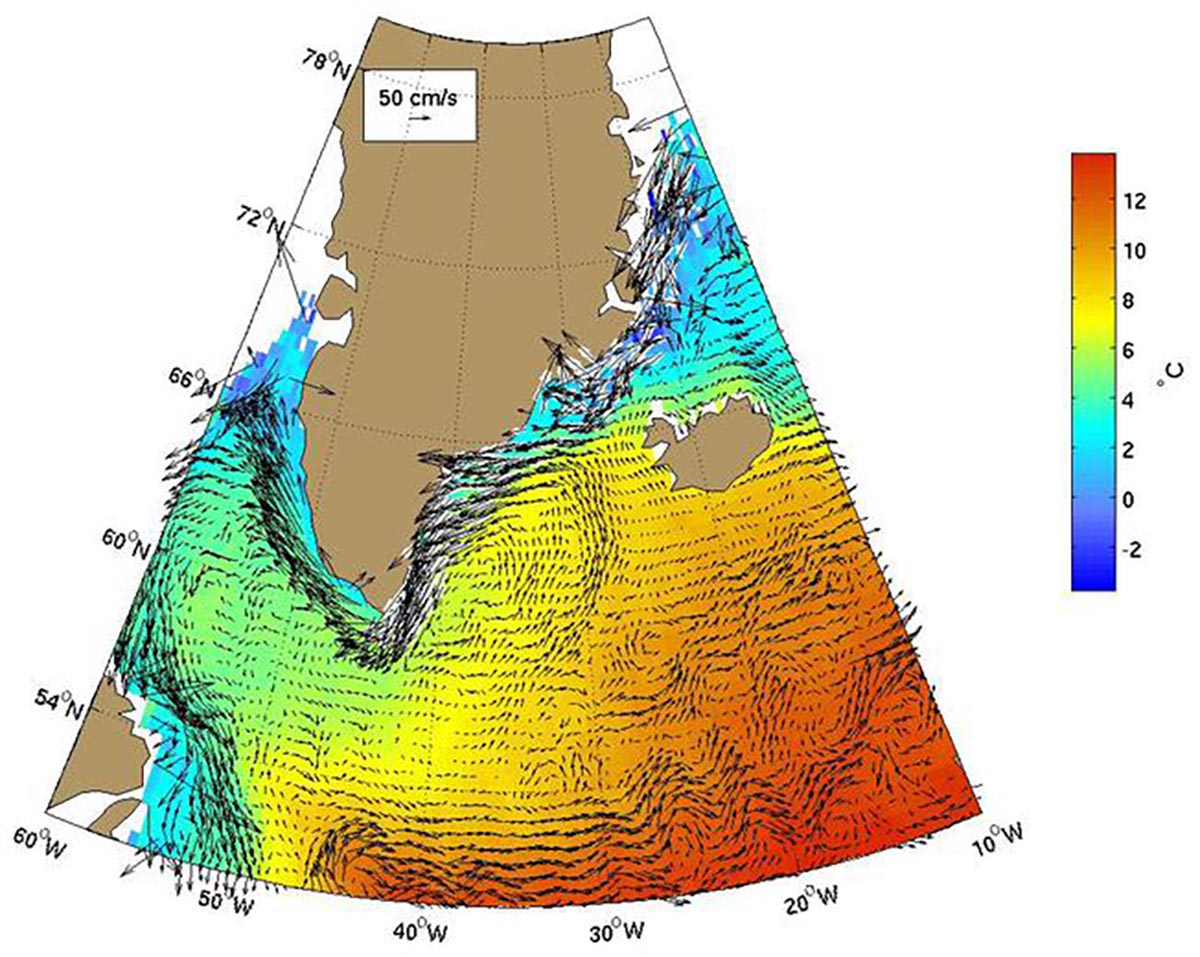
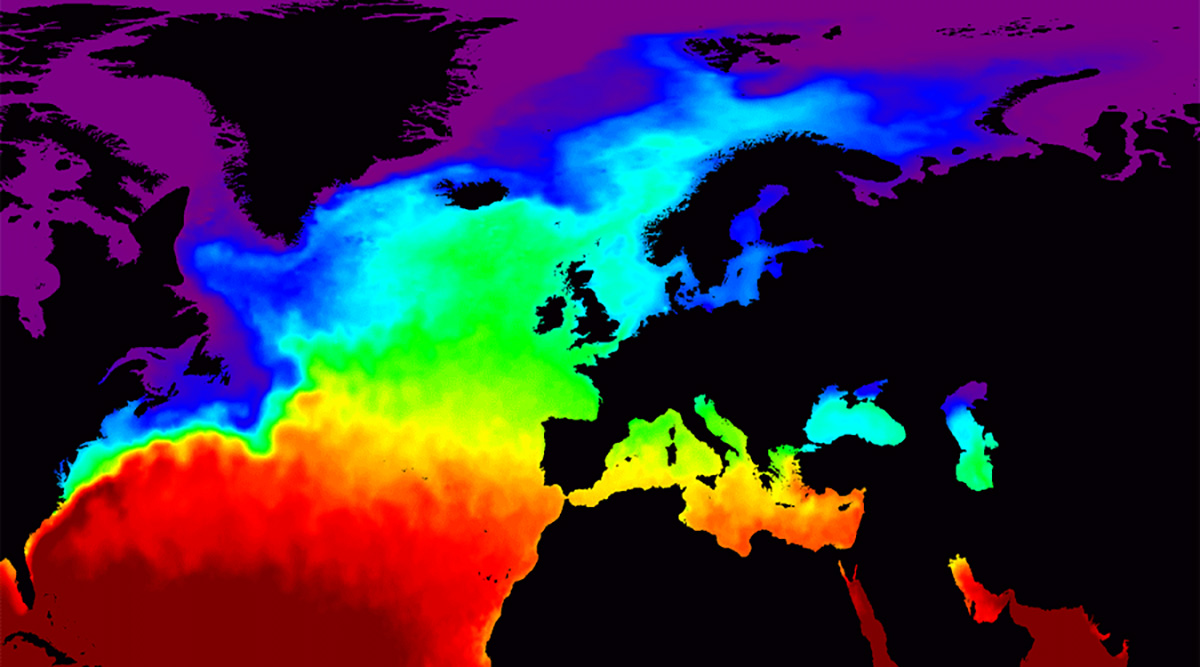
Velocity vectors and sea surface temperature of the east Greenland current
The East Greenland Current (in the image above and number 5 in the image below) flows south through the Fram Strait in the form of cold, polar surface water. Mixing with warmer Atlantic water, this water passes around the southern tip of Greenland and flows into the Labrador Sea, called the West Greenland Current (6 below), when it enters the Labrador Sea.
In the central Nordic Seas, polar ice melts, and these polar waters mix with the warm, salty Atlantic water. As a result of the heat released by the Atlantic water, the air above is also heated. Surface water becomes denser due to this mixing and cooling process, so it becomes dense enough to sink after it becomes “heavy” enough.
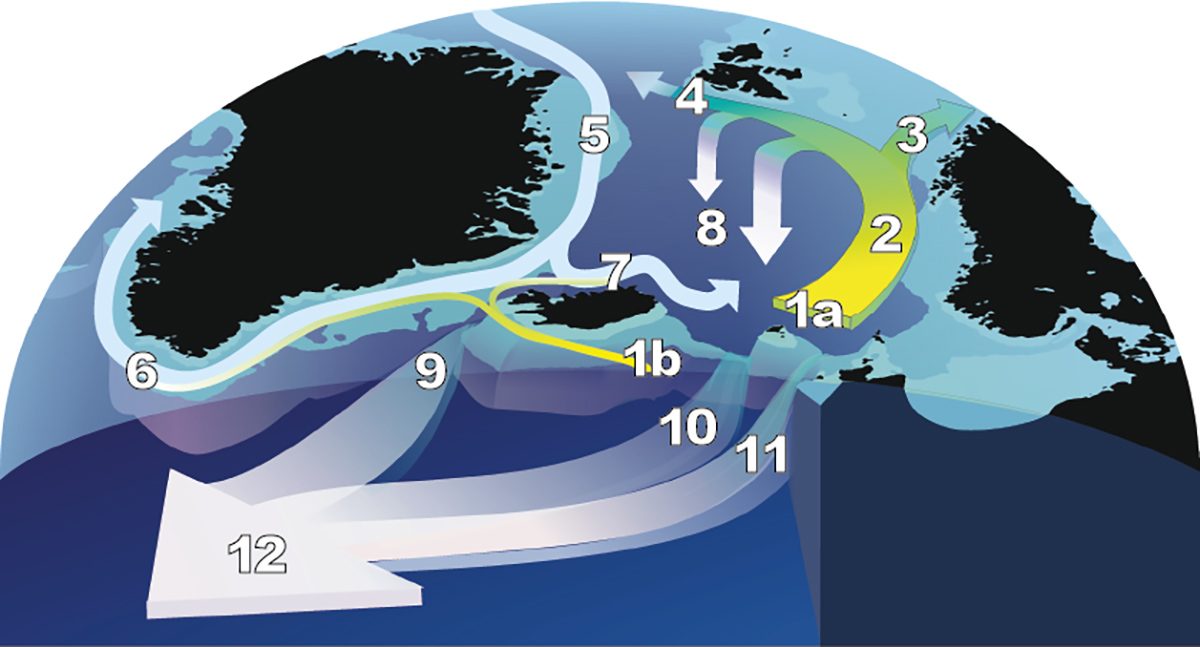
A shallow ridge separates the Nordic Seas from the main Atlantic basin, stretching from Greenland to Scotland. There are three main routes through which the North Atlantic Deep Water flows across this ridge. These are the Denmark Strait (9 above), which is 600m deep and relatively wide, and the broad, shallow (300-500m) Shetland Faroe Ridge (10). And the narrow and deeper (1000m) Scotland Faroe Channel (11).
The Nordic overflow water from Greenland – Iceland – Scotland Ridge mixes with Atlantic intermediate water as it flows down the slope from that Ridge. This is what forms the North Atlantic Deep Water (NADW), a seawater that flows southwards at depths from 3000 to 5000 meters, mainly along the western edge of the Atlantic basin (12)

A recent paper written by the two lead authors, Stefan Rahmstorf and Michael Mann, suggested that the Northern Hemisphere has experienced an “unprecedented” slowdown in the overturning circulation of the hemisphere since 1975, which appears to have been caused by global warming.
In their paper, they argued that there is a long-term cooling trend in this broad region, independent of any short-term changes in atmospheric circulation but depending on oceanic processes. Similarly, they have also suggested that the cold blob may be construed as an indicator that this trend is rising.
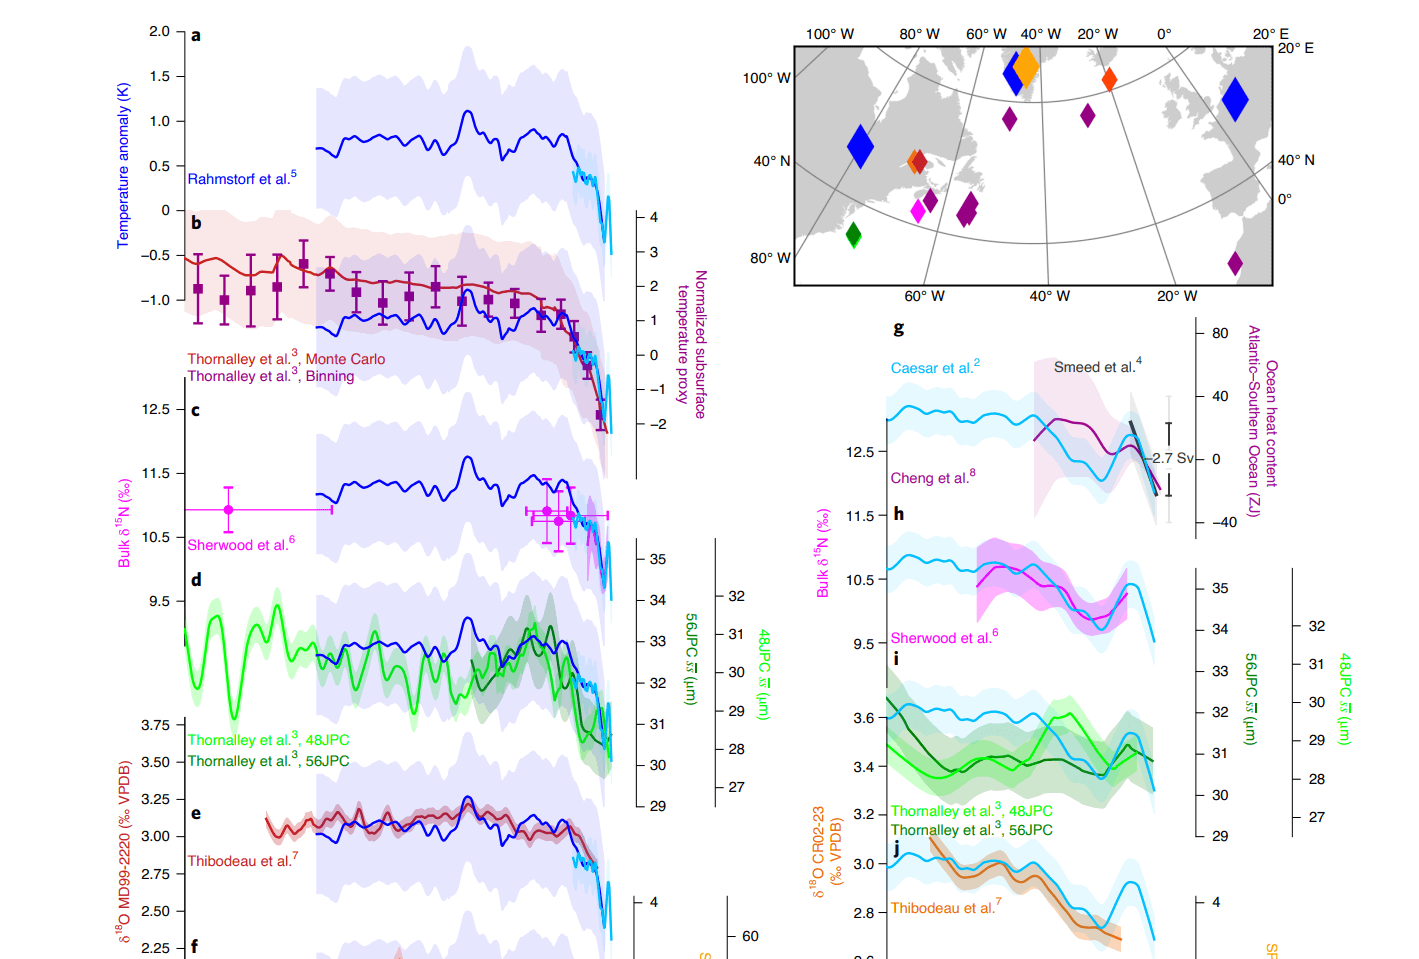
This image, which you can view below, shows a series of datasets taken from different areas in or around the North Atlantic region. Each of these shows its reconstruction of the strength of the AMOC. As a result, they all confirm that the AMOC is indeed weakening, either due to the ocean or land data, as the researchers suggest.
This is visible by looking at 1850-2100 observed and forecasted AMOC index below, which is following a negative trend.

HOW DO GLACIERS AROUND THE NORTH ATLANTIC RESPOND
There is much evidence of how glaciers around the North Atlantic Ocean respond to the cold blob and the atmospheric conditions at a multi-decadal time scale. We all know that due to a warming climate, glaciers and ice sheets around the world are continuously melting and shrinking at an accelerated pace.
There is strong evidence for this in the 1930-the 1950s for Iceland, Greenland’s east coast, Svalbard, and Hardangerj’kulen in Norway, all of which experienced negative mass balances and considerable retreat of glaciers. Recent studies have found that the ocean around Iceland has warmed after 1995, which correlates with the increased loss of mass caused by global warming in both Iceland and Norway since 1995.
This is increasing the discharge of fresh water. During the past three decades, there has been an accelerated release of freshwater from Arctic sea ice export and the Greenland Ice Sheet, likely resulting in cooling and freshening in the subpolar arctic region of the North Atlantic.
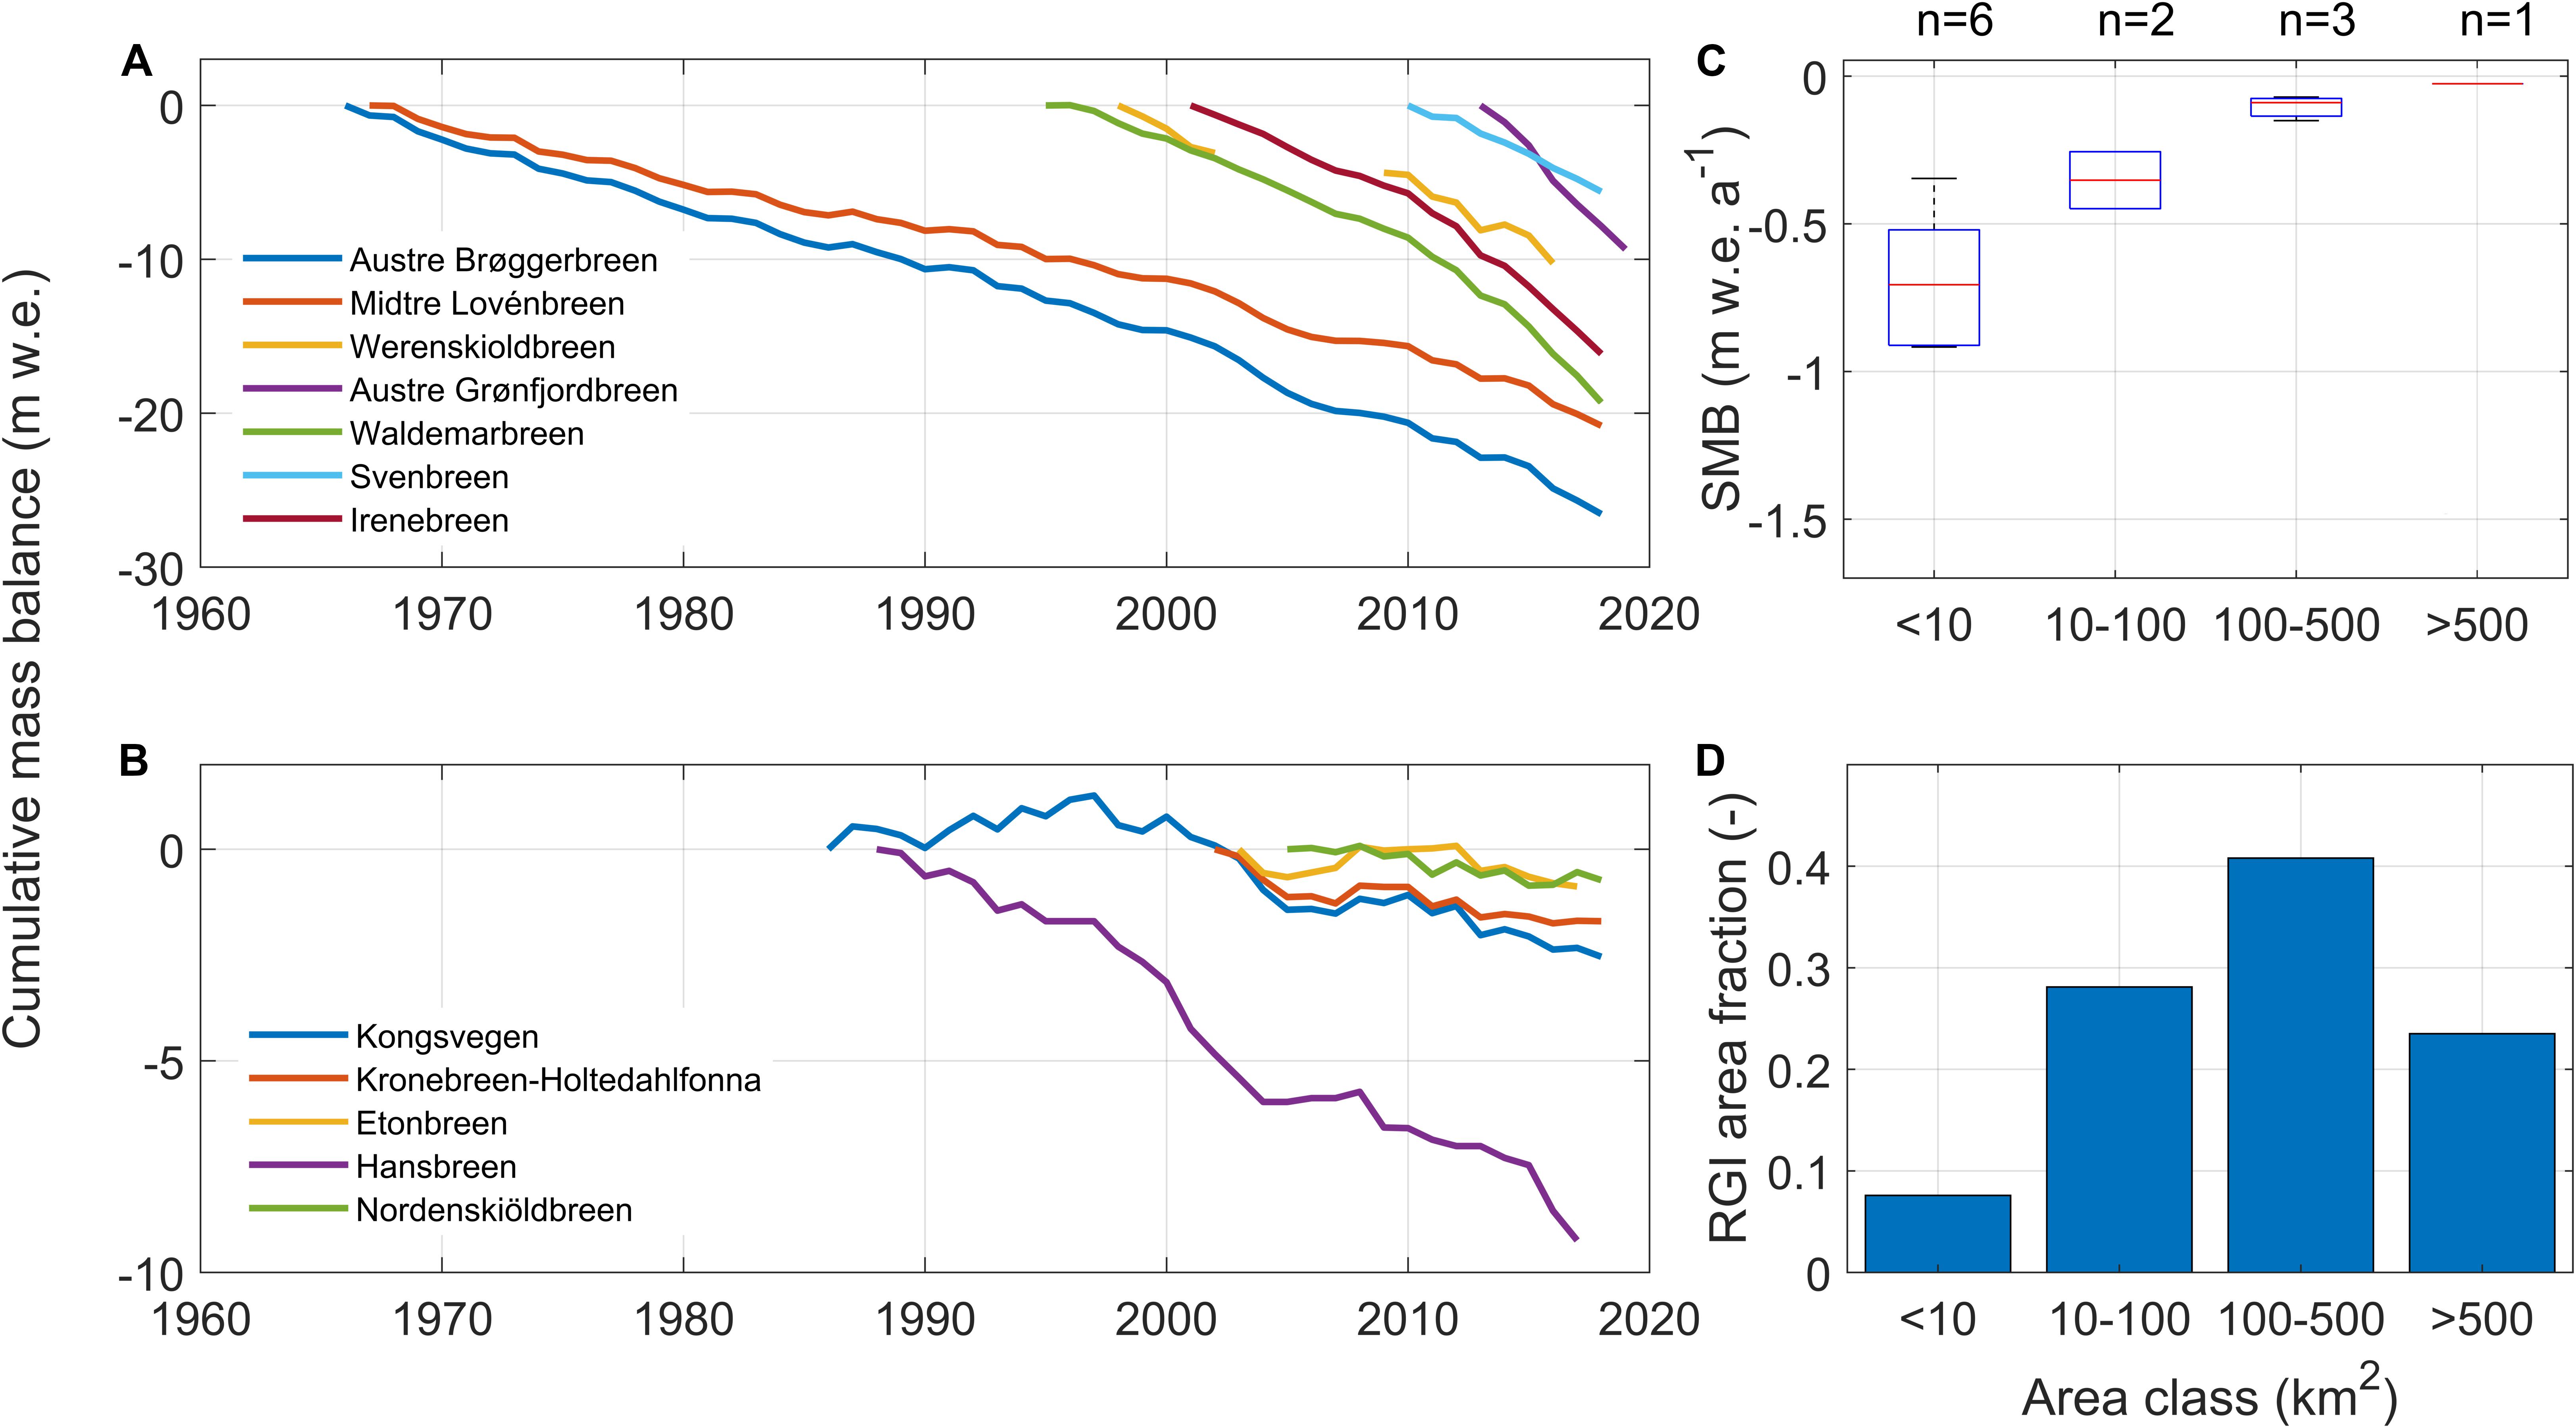
Similarly, the glaciers of Svalbard (image above) also changed from a positive to a negative regime around 1990. But after 2010, cooler oceanic conditions resulted in atmospheric temperature cooling, so Iceland and Norway could reduce their lost mass. Also, in Greenland, mass loss slowed down after a record mass loss year in 2012.
This is visible in the image below. There has been a fairly continuous loss of ice from glaciers in North Greenland and Northwest Greenland over the past 20 years. On the other hand, Southeast Greenland and Southwest Greenland are experiencing a slowdown in melting, along with Northeast Greenland, which is notching anything close to zero net mass balance over the last five years. Despite that, if we look at the total contribution of the ice sheet, we can see how the ice loss is constant over time.

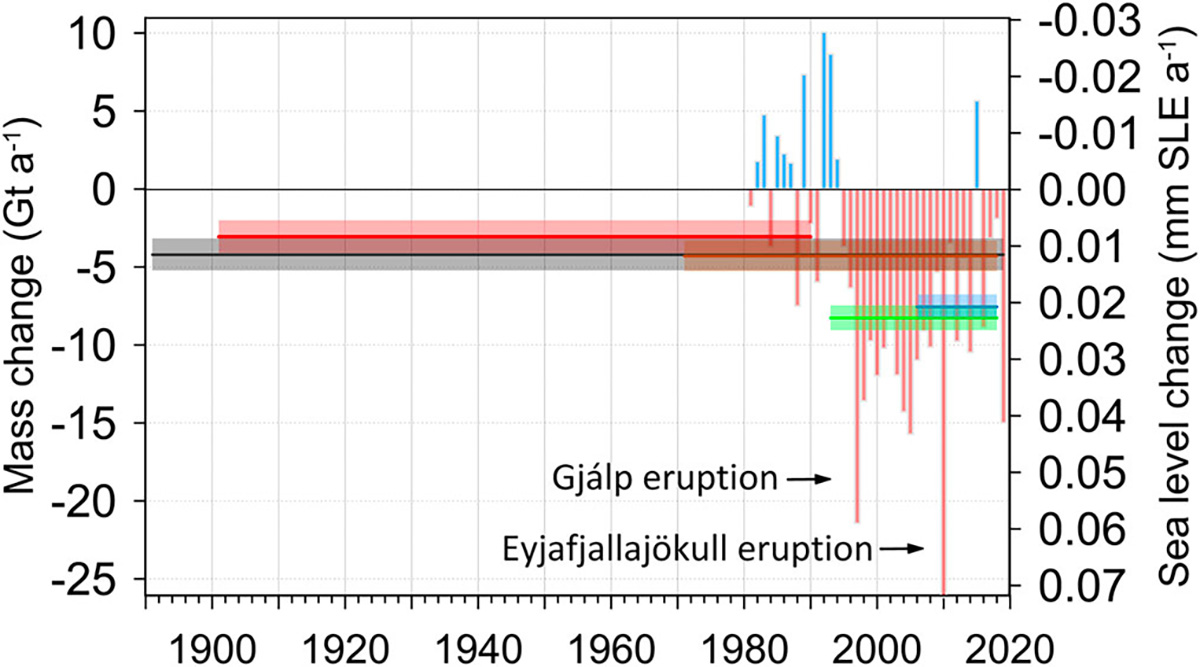
A recent study in Iceland has calculated that since the end of the little ice age in 1890, the total mass of glaciers and icecaps has changed by approximately 540 Gigatons (about 4.2 Gigatons per year on average) or 16 4%. The mass loss amounting to more than half of the total has been accounted for since 1994/95 (240 gigatons), which corresponds to an average of 9.6 gigatons per year.
The most rapid loss is observed from 1994/95 to 2009/10 (mass change rate −11.6 Gigatons per year). Since 2010, the mass loss rate has, on average, been about 50% lower, except in 2018/19, when one of the highest annual mass losses was observed. In the image below, the mass changes of all glaciers in Iceland.
We saw how the impressive cold blob anomaly in the North Atlantic is telling us nature is responding to global warming. Glaciers also react to this ocean anomaly, slowing down from melting in some portions of Greenland, Iceland, and Norway.
We don’t know whether all this could be a sign of an impending abrupt shutdown of the AMOC or if it is merely an example of natural climate variability influenced by local weather and winds, as recently proposed by an alternative and equally authoritative interpretation.
Our understanding of climate change depends on understanding what happened in the past and what could happen in the future about the thermohaline ocean circulation.
We will keep you updated on this and much more, so bookmark our page. Also, if you have seen this article in the Google App (Discover) feed or social media, click the like button (♥) to see more of our forecasts and our latest articles on weather and nature in general.
See also: