Arctic sea ice extent in November 2022 is increasing at a rate close to the 2010s average. Nevertheless, several peripheral seas had persistent open-water areas late into the Fall season. Warmer-than-average air temperatures in the northern sector of the North Atlantic and northwestern Europe were common this year. South, Antarctica’s sea ice extent is particularly low, and an unusual sea ice distribution as a consequence of persistent low air pressure in the Amundsen Sea is reported.
ARCTIC SEA ICE NOVEMBER 2022
Arctic sea ice extent in November 2022 was 9.71 million square kilometers (3.75 million square miles). The first week of faster-than-average growth, followed by a slower increase during the rest of the month, led to a rate of increase close to the long-term trend. Overall, the daily sea ice extent tracked mostly much below the interdecile range according to the Arctic Data archive System, NIPR.
The interdecile range measures the statistical dispersion of the values in a data set. Although below average, it is within the normal sea-ice inter-annual variability. The magenta line in the image below shows 1981 to 2010 average extent for that month.
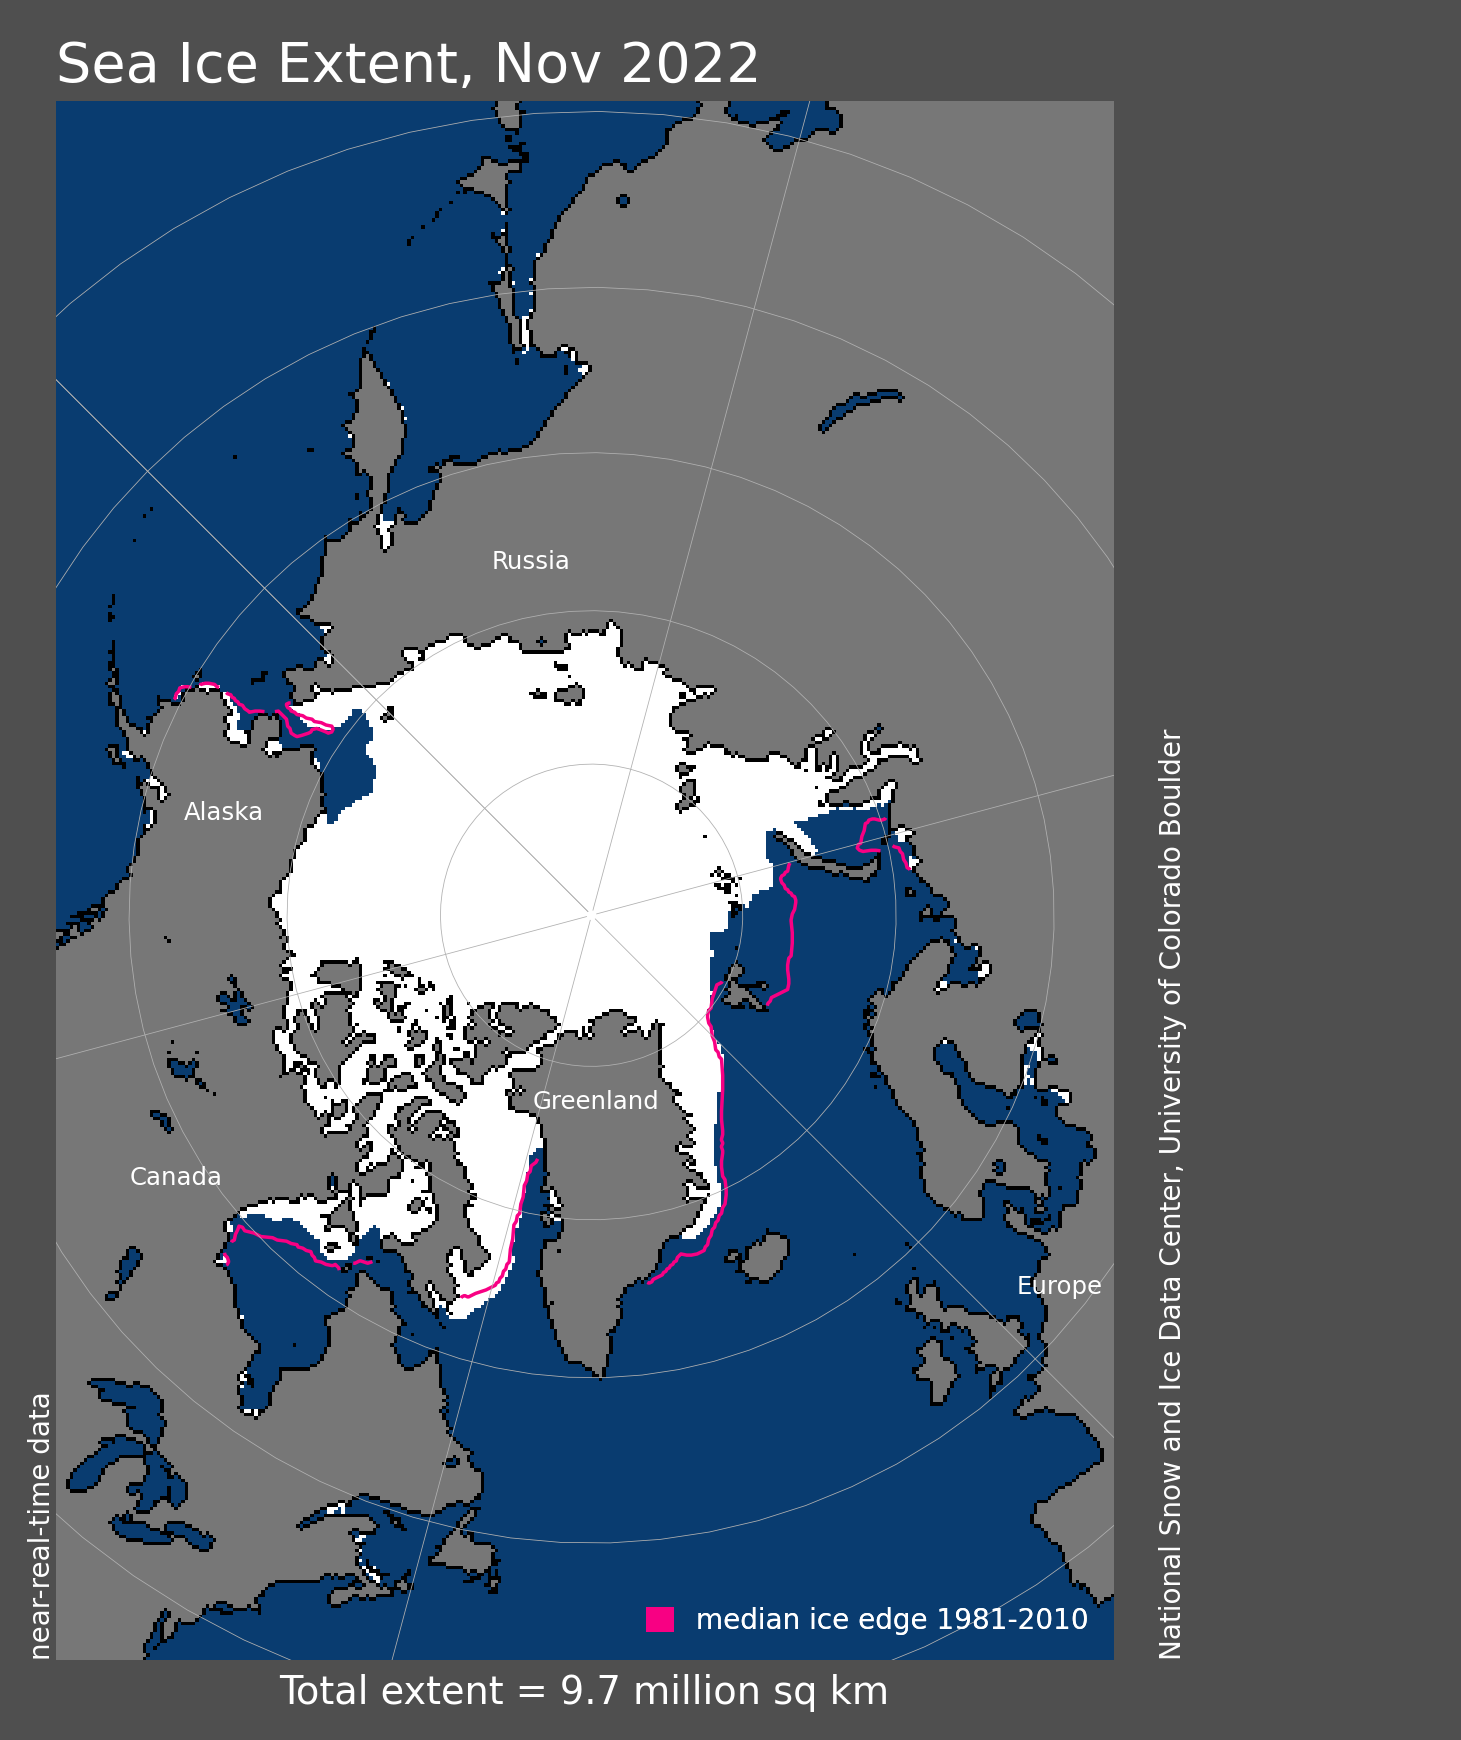
Sea ice Extent at the end of November was 990,000 square kilometers (382,000 square miles) below the 1981 to 2010 average of 10.7 million square kilometers or 4.13 million square miles. Nevertheless, the sea ice extent was 1.05 million square kilometers (405.000 square miles) above the November record low set 6 years ago in 2016 with 8.66 million square kilometers or 3.34 square miles. This is the eighth lowest in the satellite record for this month.
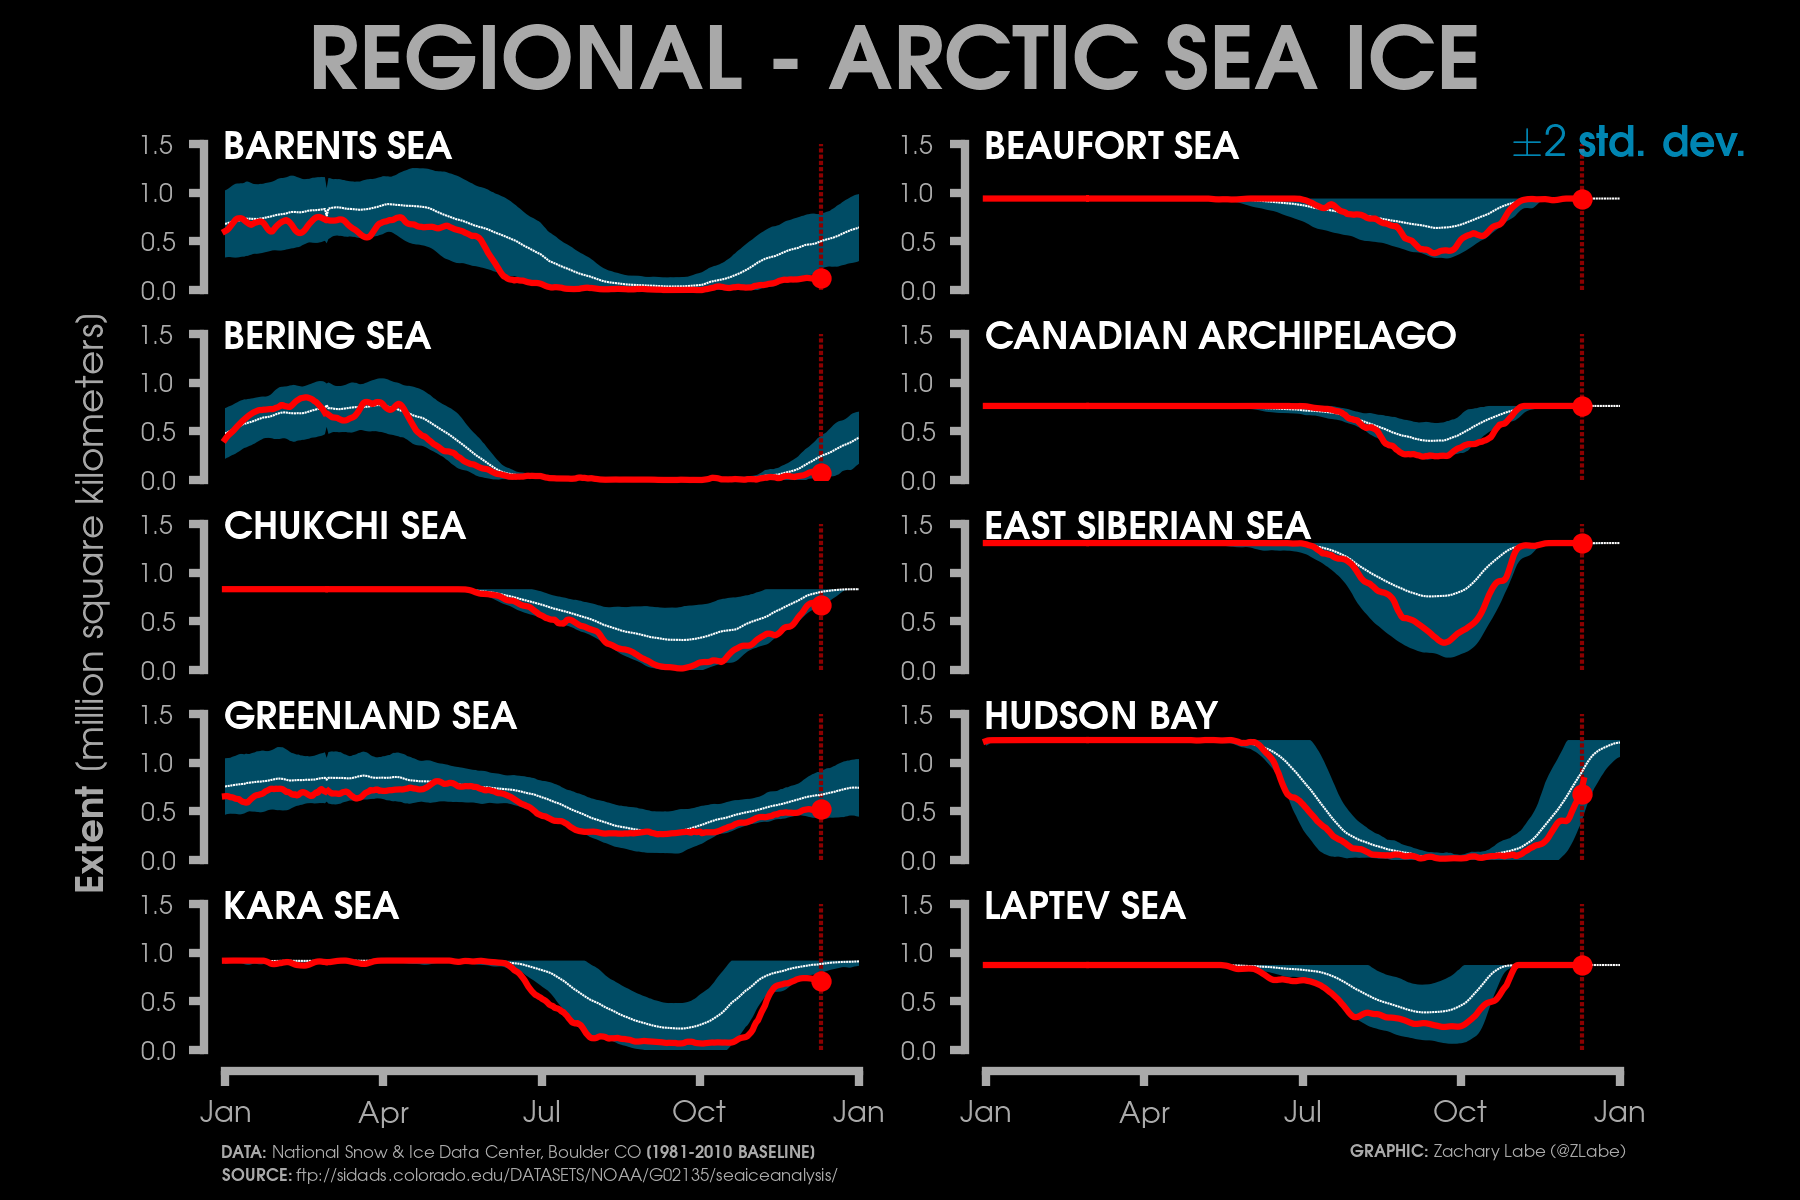
Open water conditions persisted in the Chukchi Sea, and its complete freezing is approximately two weeks in late respect to the 1981-2010 average. The sea ice extent in the Kara Sea, the Barents Sea, and the Hudson Bay are below average. Sea Ice extent in the Bering Sea is limited to Norton Sound and Kotzebue Sound. Sea ice around the Svalbard coasts didn’t form either in the far northern North Atlantic. The image below shows the sea ice extent on 12 December 2022.
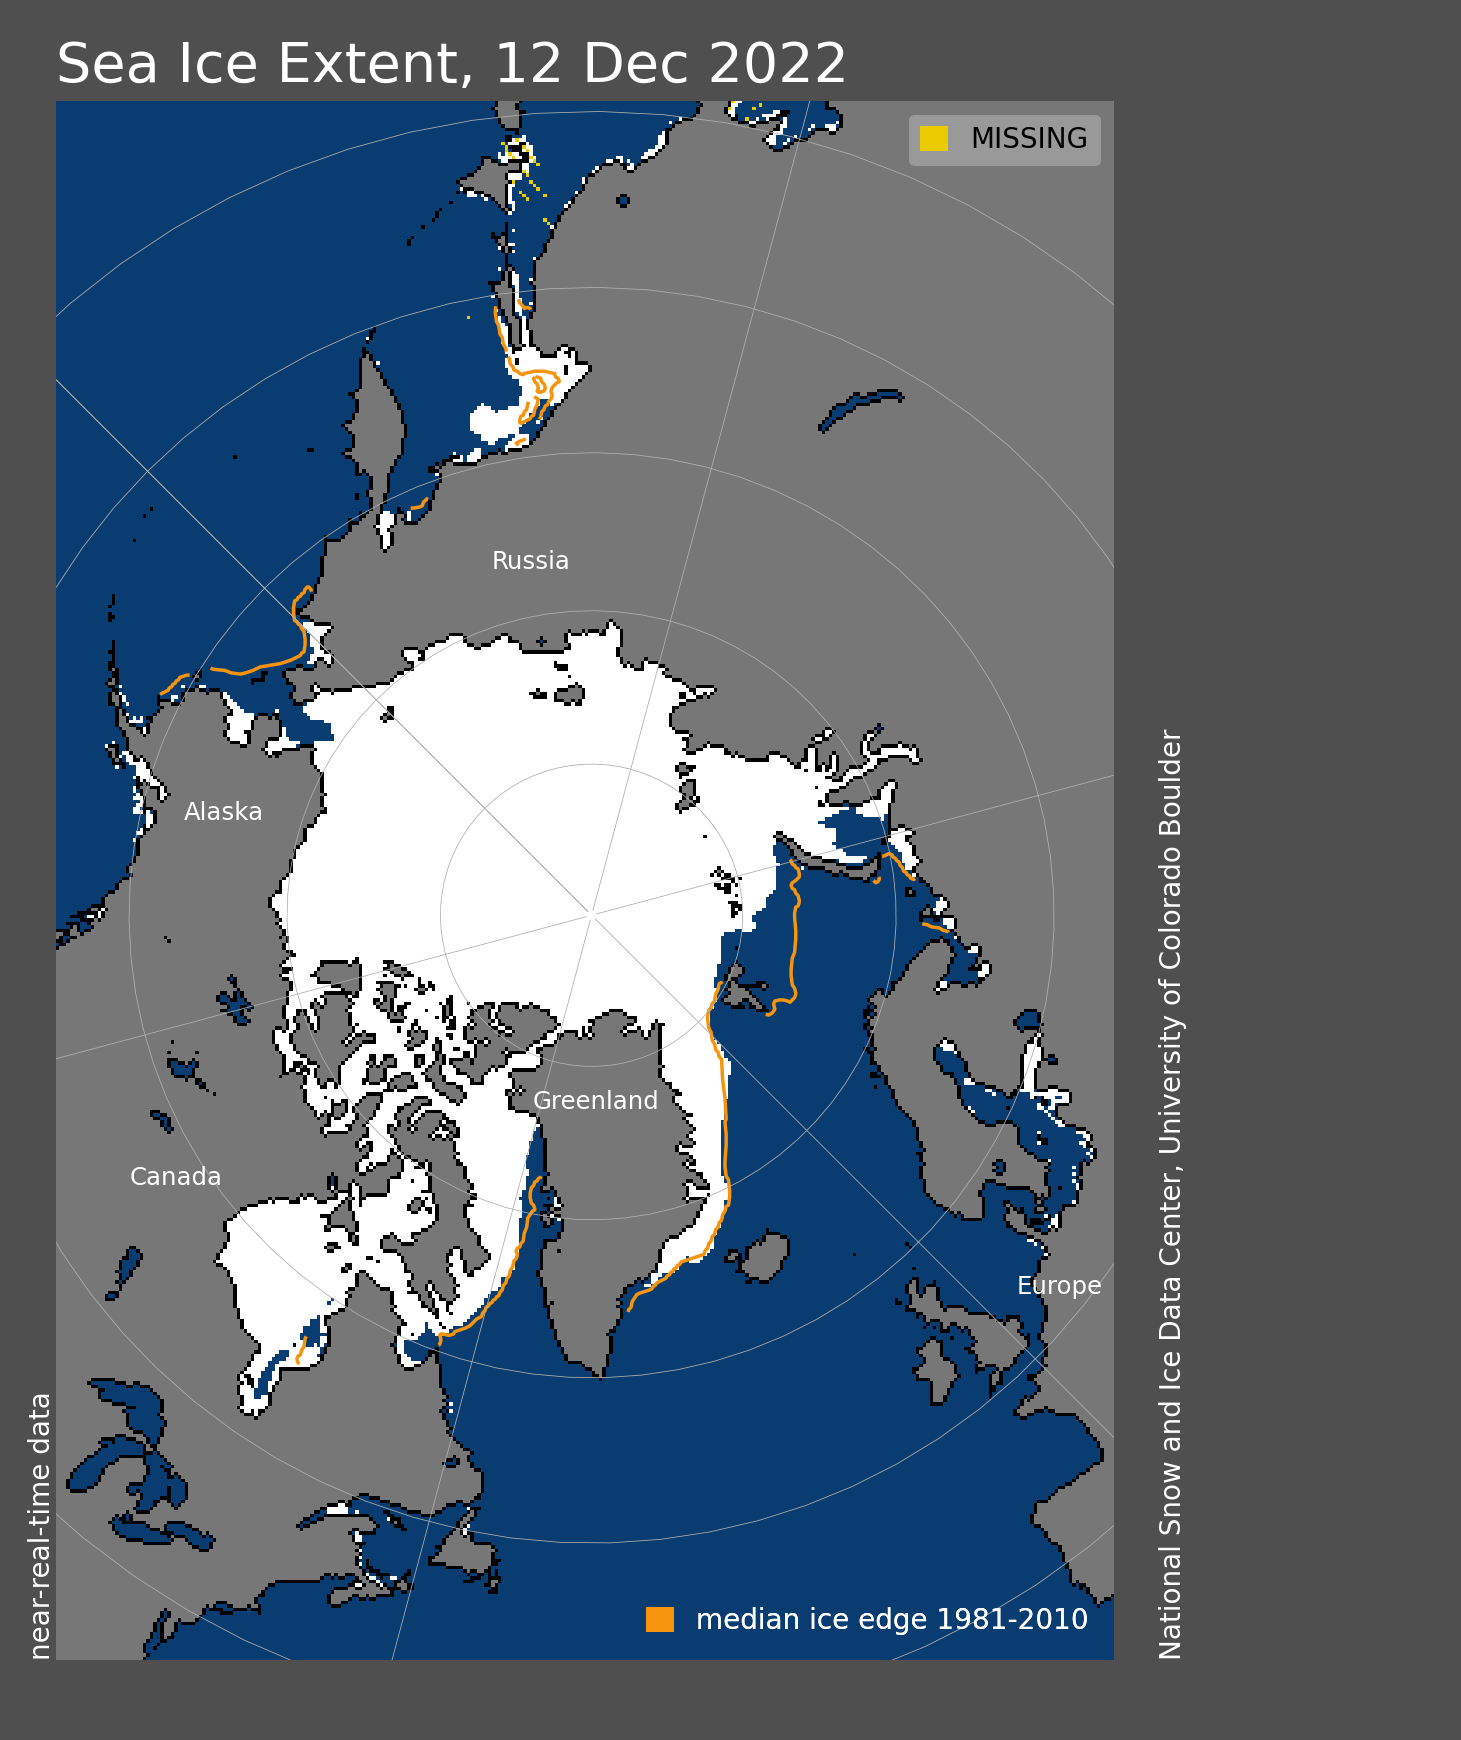
As we can see above, lingering open water areas are still clearly visible, especially in the Bering Sea and around Svalbard. The Sea ice extent, defined as the area of the ocean with at least 15% sea ice, is 11.4 million square kilometers or 4.40 million square miles on December 12th, 2022, according to the Arctic Data Archive System – ADS portal
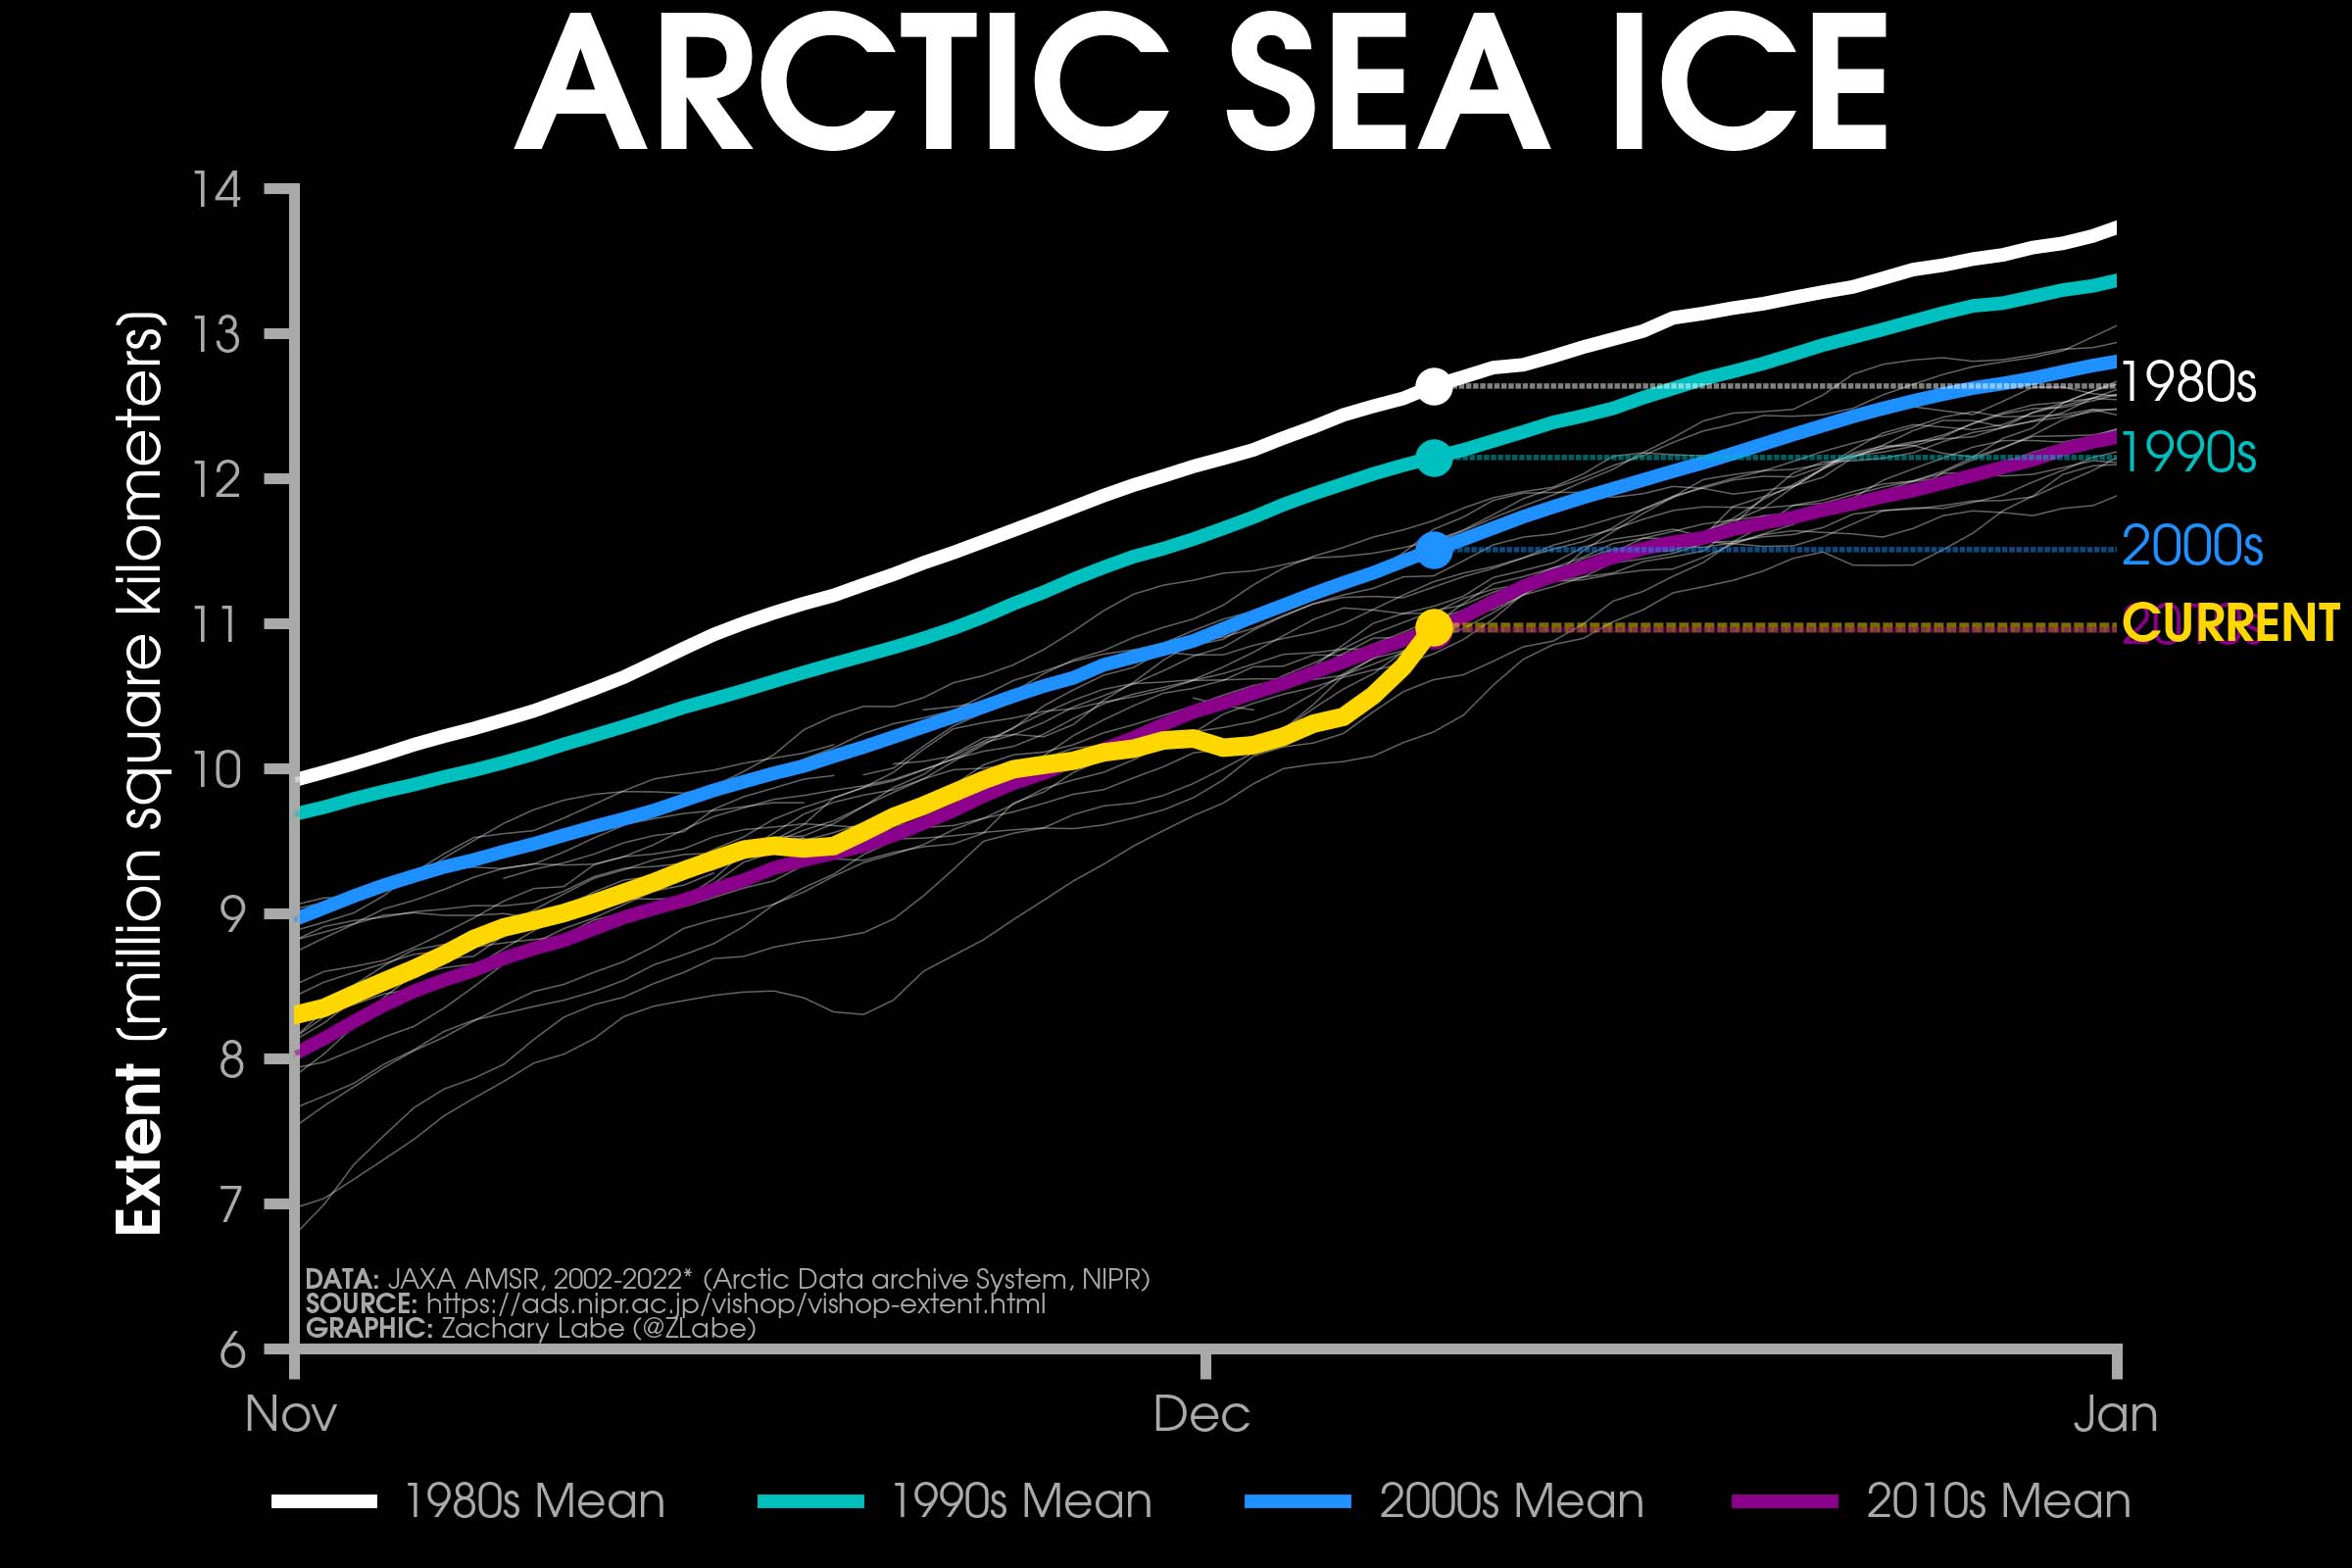
After slowing the extent of growth at the beginning of December, the Arctic sea ice extent is increasing fast, reaching the 2010s mean values, as shown in the image below, set by Zachary Labe. The yellow line shows how the daily extent perfectly aligns with the last-twenty-year average.
In the video we set below, you can see in the first part the area of minimum sea ice extent each year between 1979 – 2019. In 2019, the Arctic minimum sea ice extent covered an area of 3.66 million square kilometers. Data are obtained with passive microwaves.
The second part shows the March-to-September Arctic sea ice extent variations, thanks to NASA’s Goddard Space Flight Center in Greenbelt, Maryland. The map relies on data acquired by the Advanced Microwave Scanning Radiometer 2 (AMSR2).
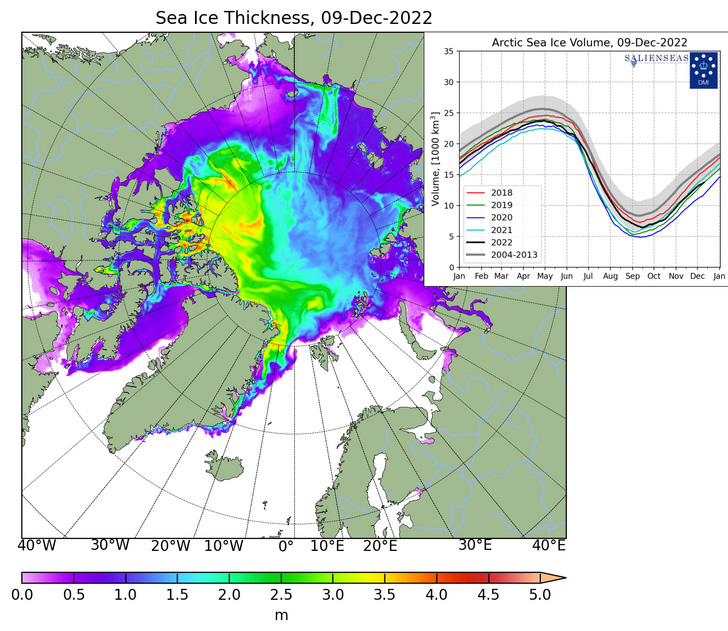
However, to get a consistent picture of the sea ice’s actual state, it is necessary to determine both extent and the volume. Thus, we need to know the thickness of the ice, which can vary from thin ice, less than 1 meter thick, to several-meters-thick ice.
The image below shows the sea ice extent and thickness on December 9th, 2022. Data are available thanks to the Danish Meteorological Institute through the Polar Portal. The ice volume updated in November 2022 was nine thousand cubic kilometers.
WHAT IS SEA ICE
Sea ice means all sorts of ice that form when seawater freezes. Sea ice that is not fast refers to drift ice, and if the concentration exceeds 70%, it is called pack ice. When sea ice concentration is lower than 15%, this is considered open water, and the boundary between open water and ice is called the ice edge.
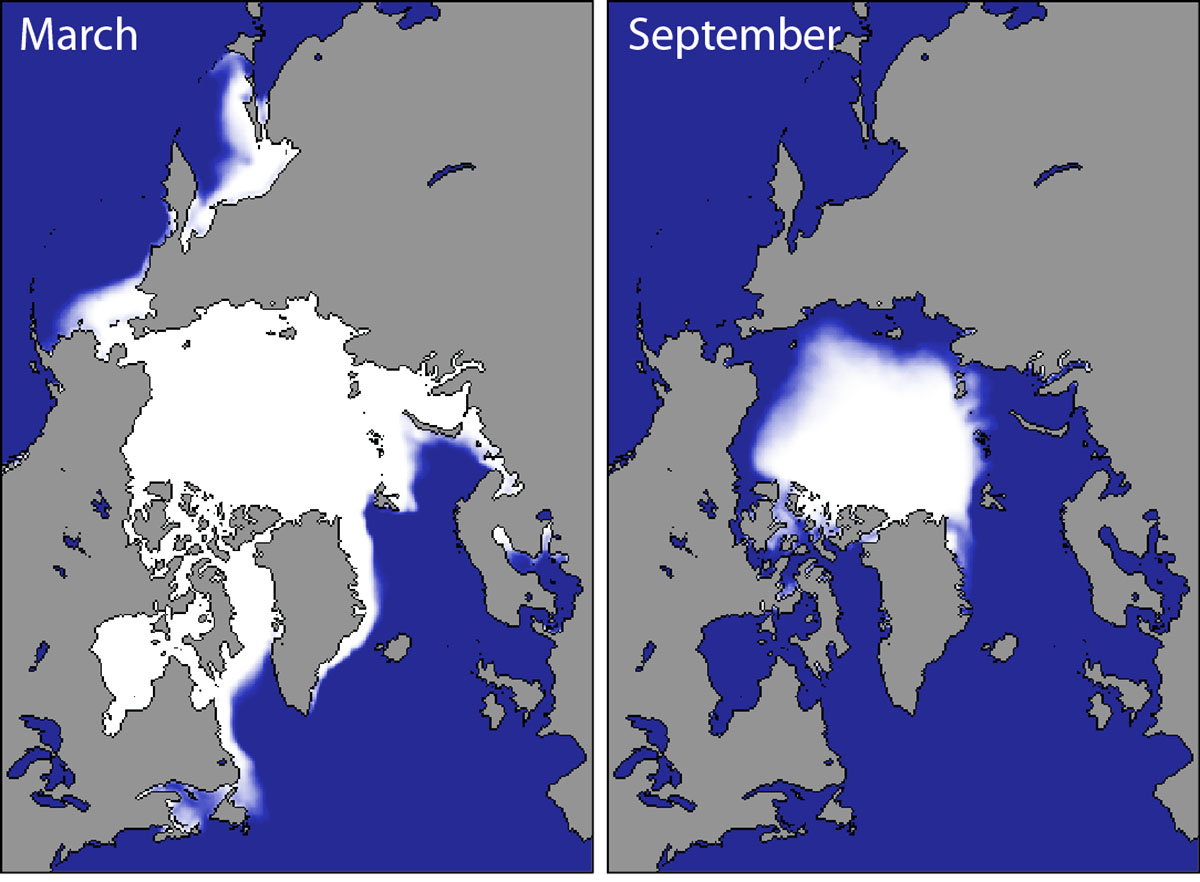
Sea ice cover in the Arctic grows throughout the winter and peaks in March. In September, the sea ice extension reaches its minimum, generally only around one-third of its winter maximum. To get a correct estimation of the sea ice state, there is a need to determine both extent and the volume. Such numbers primarily include the ice thickness, generally linked to the ice age. The image below shows Arctic sea ice climatology from 1981-2010 by the Snow and Ice Data Center, University of Colorado, Boulder.
As we stated a few paragraphs above, winter ice extent is a weak indicator of what the ice extent will look like this coming September when we will face the annual minimum. The seasonal cycle of Arctic sea ice is characterized by the maximum and the annual extent in March, decreasing through spring and summer to the annual minimum extent in September.
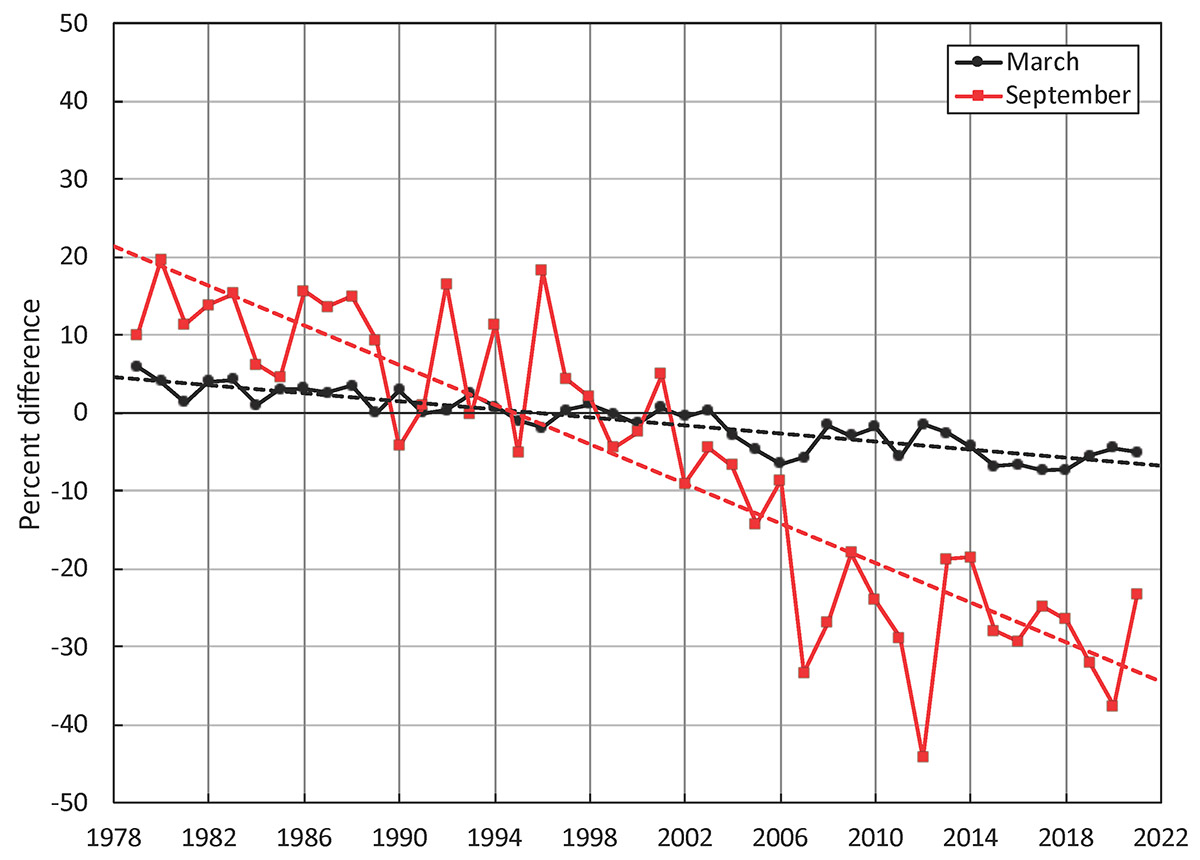
Since 1979 it has been possible to monitor sea ice by satellite. We have 43 years of reliable information on the extent of the sea ice cover. The sea ice had continuously diminished and particularly since the end of the 1990s. Nevertheless, the winter trend is different from the summer trend.
The image below shows the Arctic sea ice extent development at the end of the winter season (March maximum) and by the end of summer (September minimum).
WHY IS SEA ICE IMPORTANT?
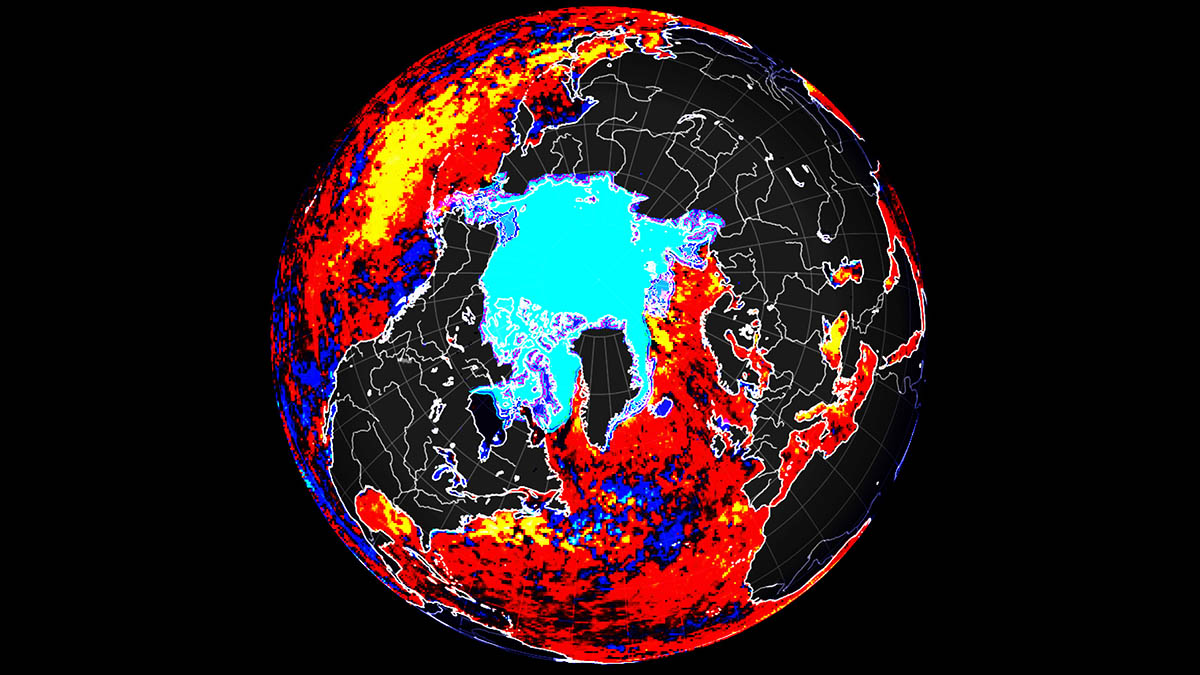
Sea ice keeps the polar regions cool and helps moderate the global climate. Sea ice has a high reflectivity (albedo) surface compared to many other Earth surfaces, particularly the surrounding ocean. The darker ocean reflects only 6 percent of the sun’s energy and absorbs the rest, while sea ice reflects 50 to 70 percent of the incoming energy.
The image below credits Tom Prater and demonstrates the difference in solar heat absorption on a white surface versus a darker ocean surface.
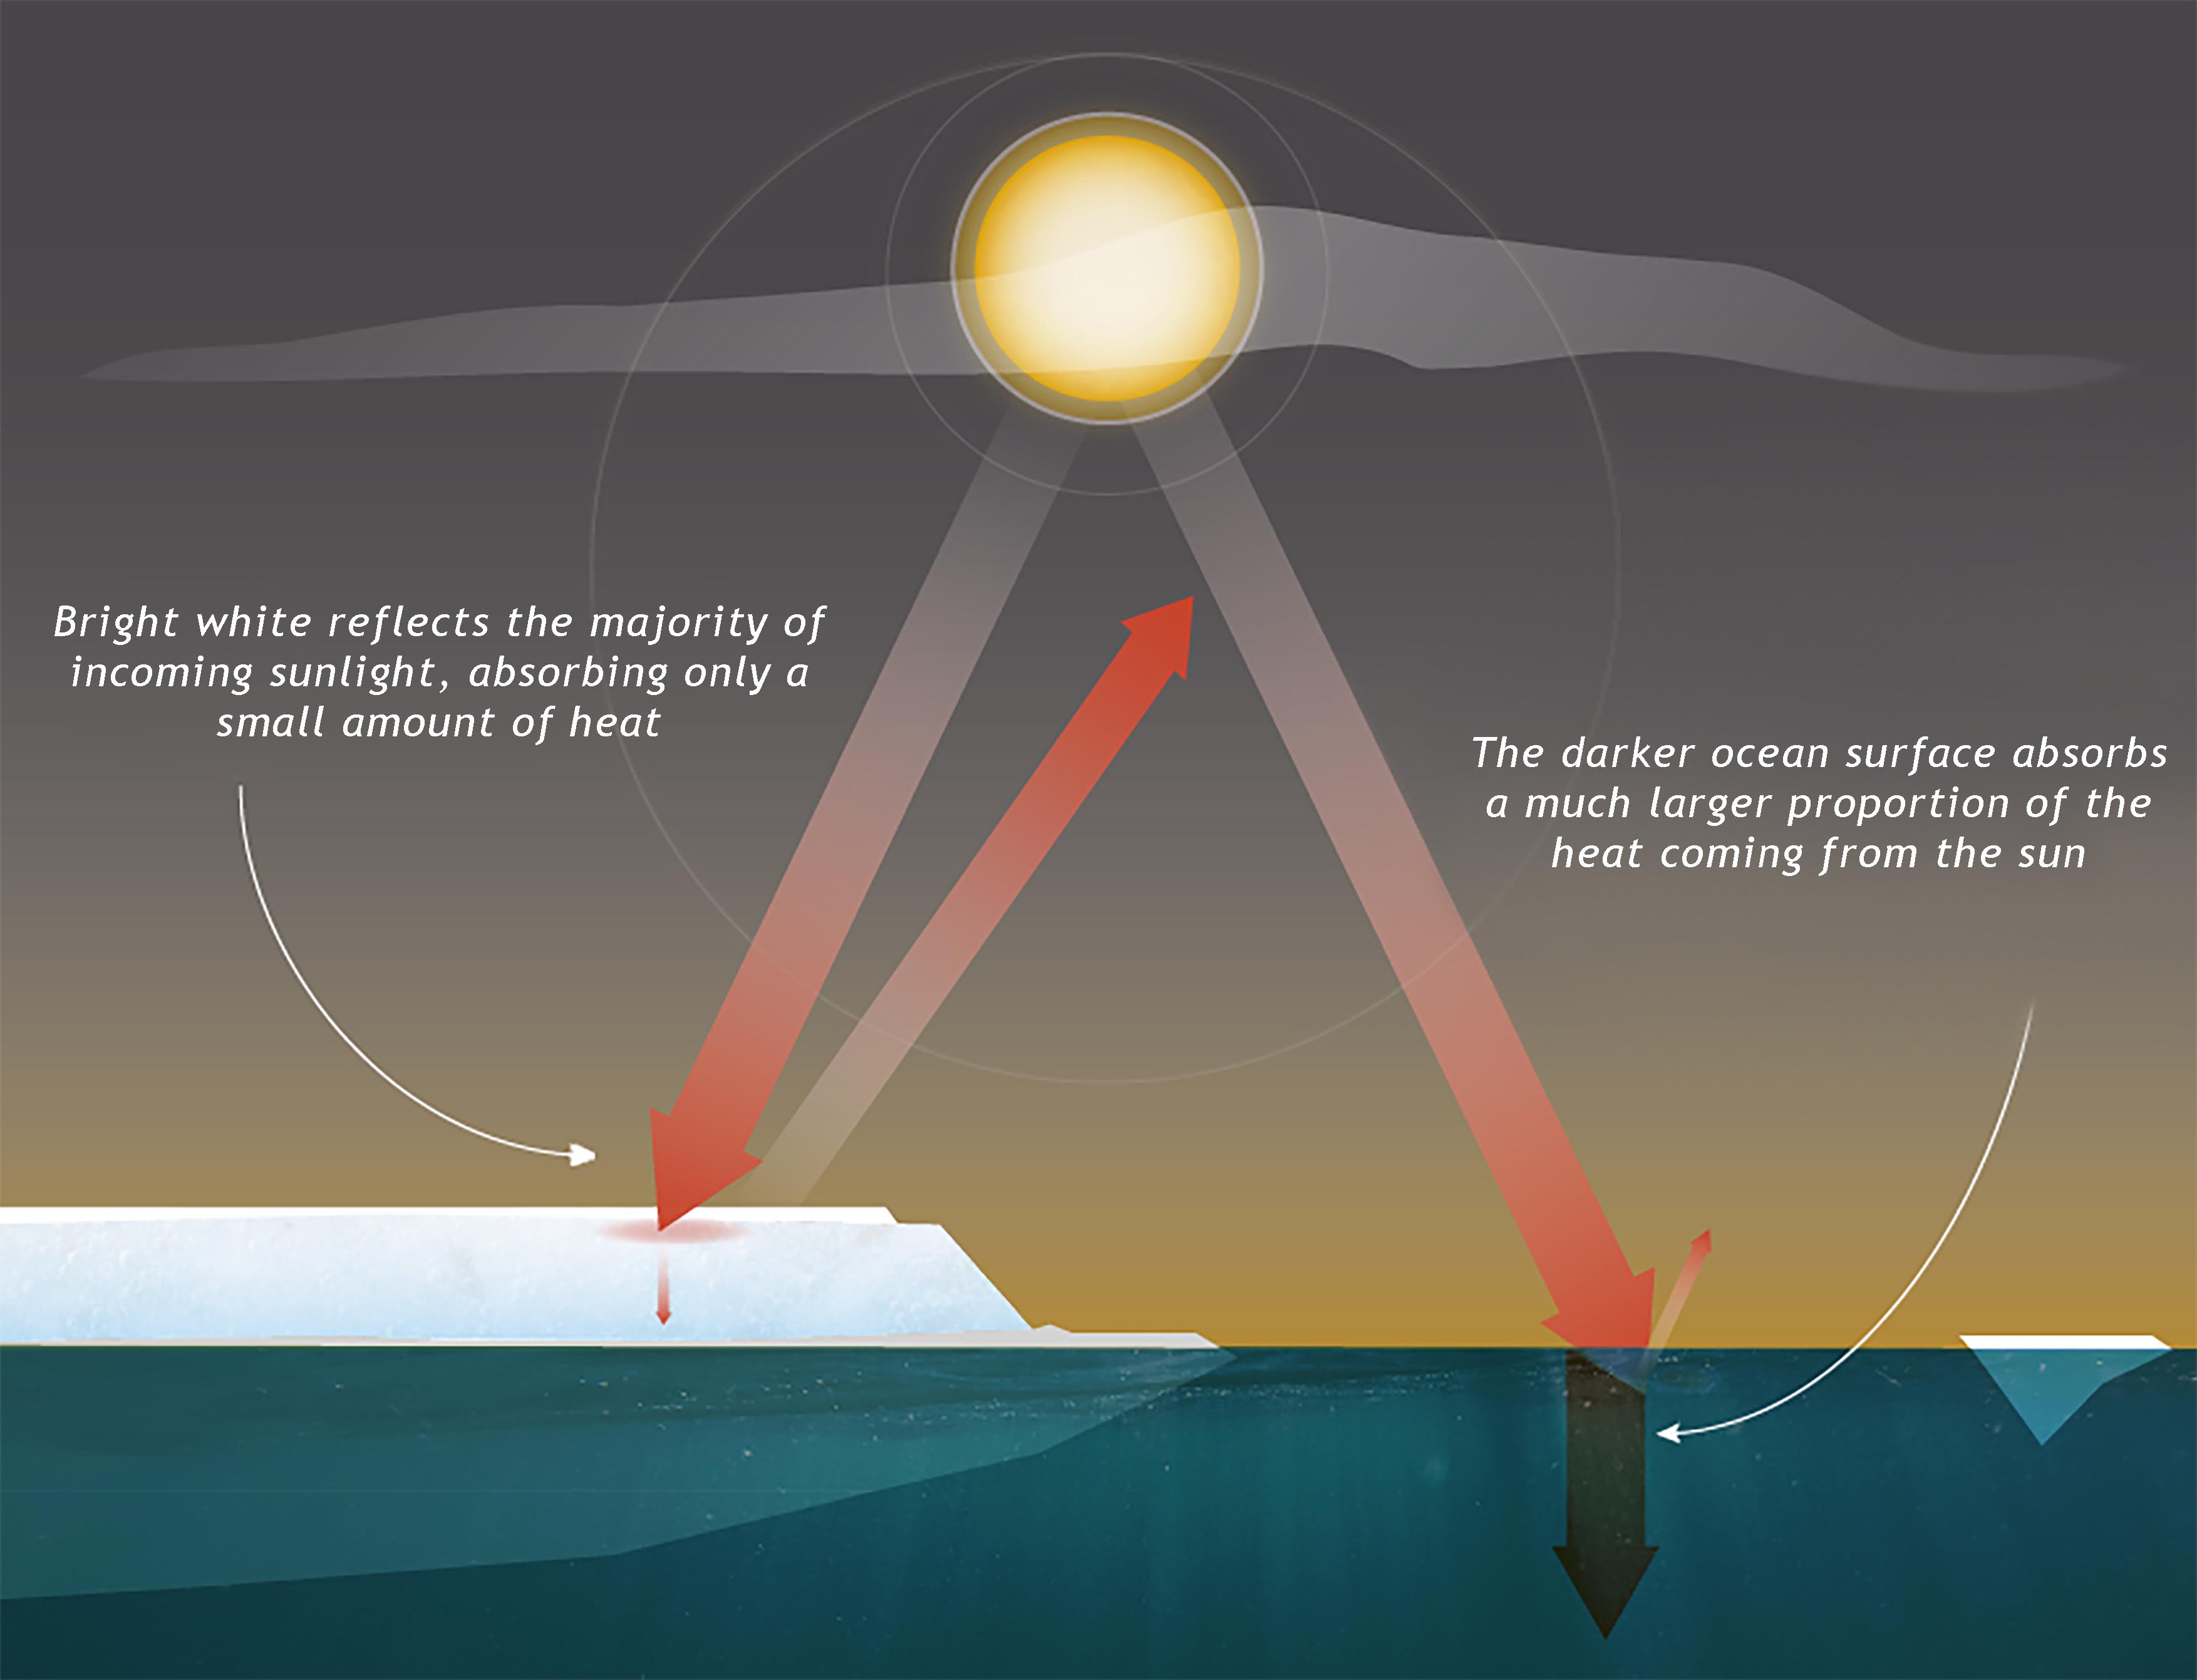
Thus, a small temperature increase at the poles leads to still greater warming over time, making the poles the most sensitive regions to climate change. According to scientific measurements, the thickness and extent of summer sea ice in the Arctic have dramatically declined since the 1980s. The sea ice decline is consistent with observations of a warming Arctic.
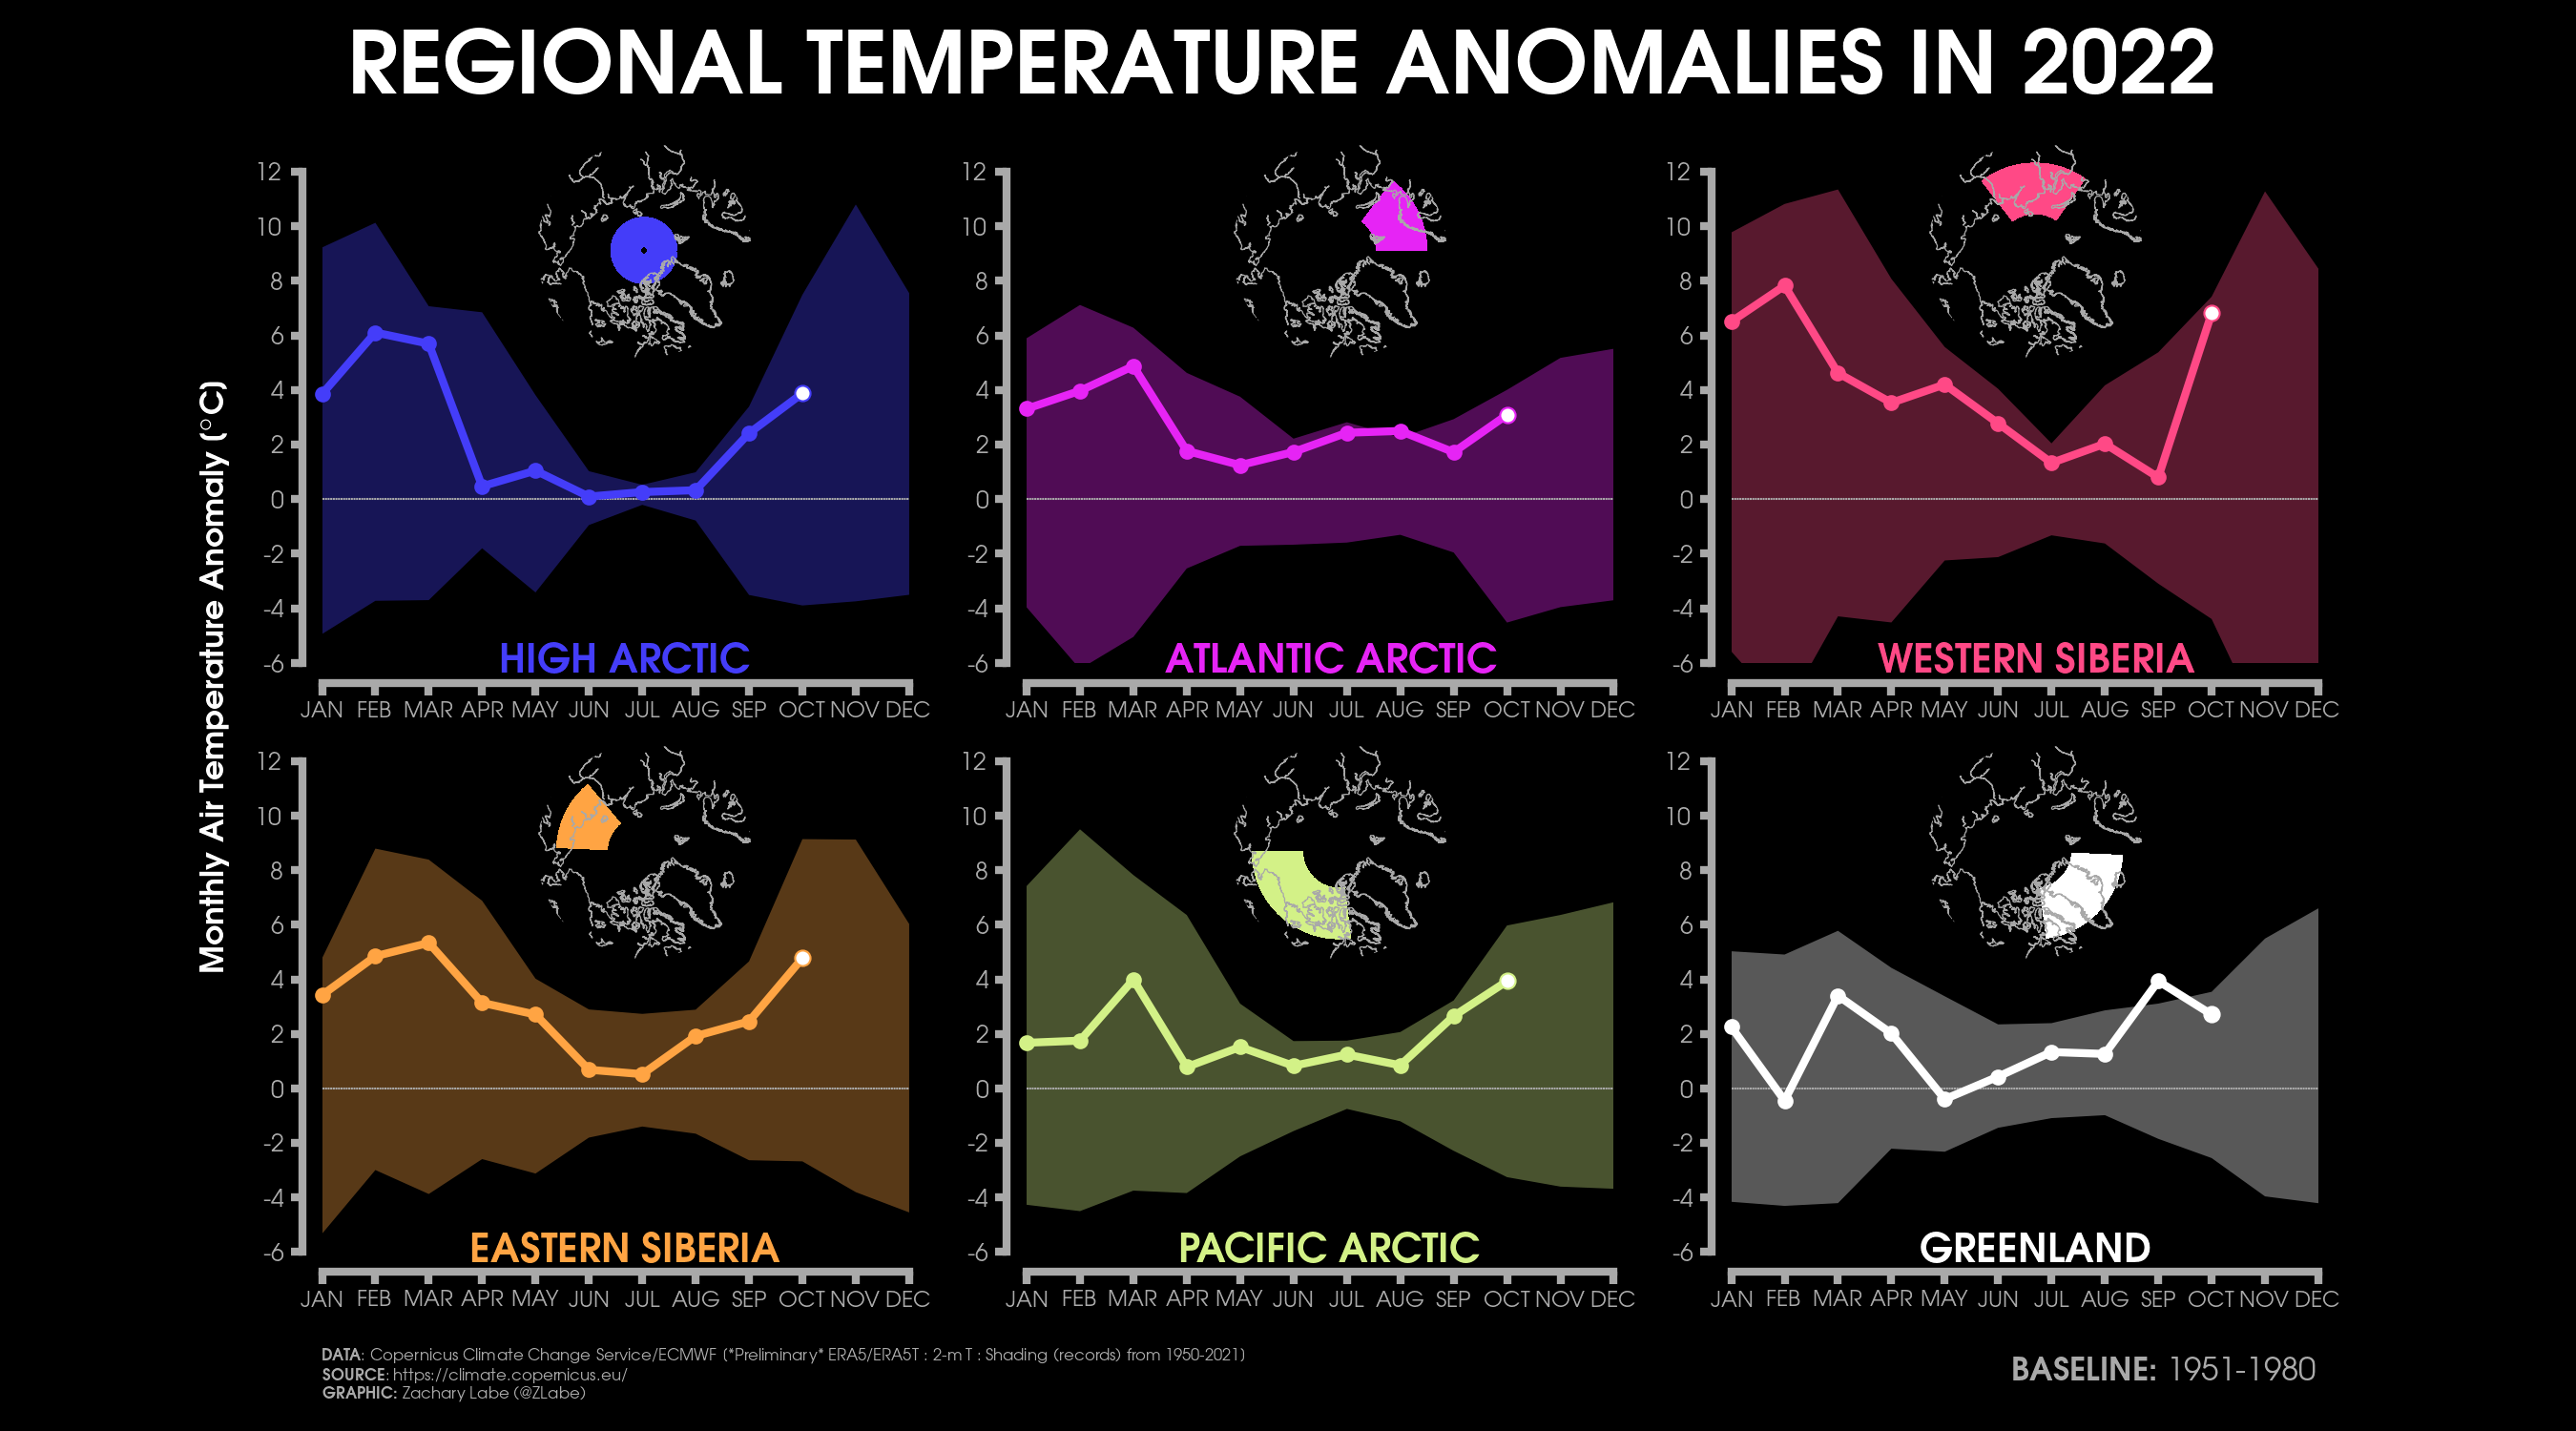
Open water reflects less sunlight than sea ice. Therefore, open water means a warm Arctic that leads to a positive feedback loop increasing the Arctic Amplification. The Arctic is warming more than three times faster than the global mean, as shown in the graphic below by Zachary Labe.

THE BOREAL AUTUMN
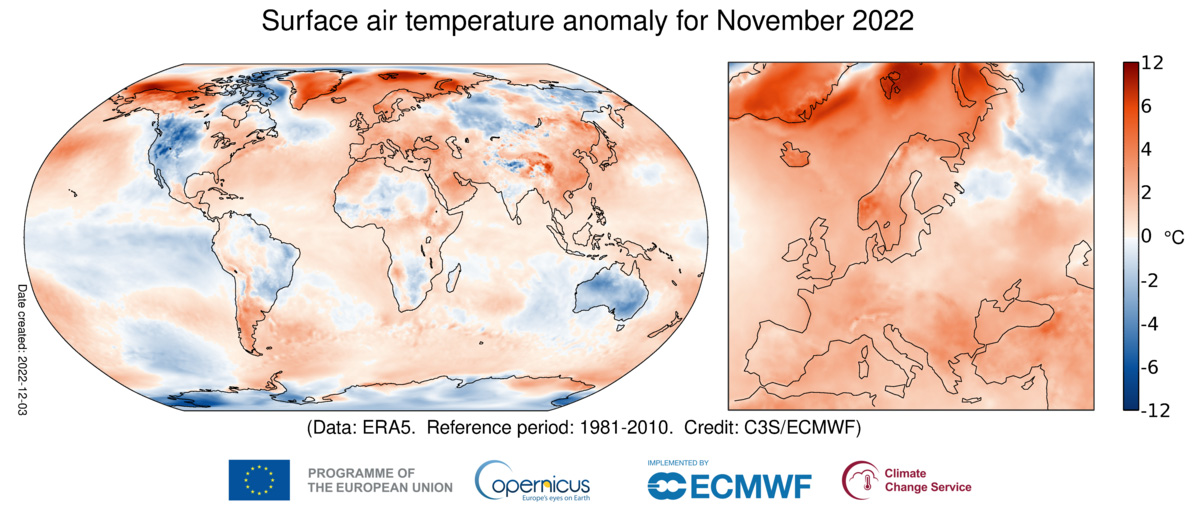
On a global level, November 2022 was cooler than the November of 2012 and from 2015-2021 but warmer than all other Novembers. This month was globally nearly 0.2°C warmer than the 1991-2020 November average. The Surface air temperature anomalies of the month in the image below are credits to Copernicus Climate Change Service/ECMWF.
Elsewhere, November 2022 was characterized by some pronounced regions of below-average temperatures. These regions included the western USA and much of western Canada, parts of the Canadian and Siberian Arctic, and Antarctica. Australia experienced the eighth-lowest countrywide average of daily maximum temperatures for November in an observational record dating back to 1910.
Warm conditions prevailed in the North Atlantic and over northwest Europe. Europe experienced its third warmest autumn at 1°C above normal. Temperatures were particularly high over the west of the continent.
The average temperature for Europe from September to November 2022 was 0.98°C above the 1991-2020 average for the season. This is the third warmest autumn value on record for Europe. The autumn of 2020 was almost 0.5°C warmer, and that of 2006 was warmer by less than 0.1°C.
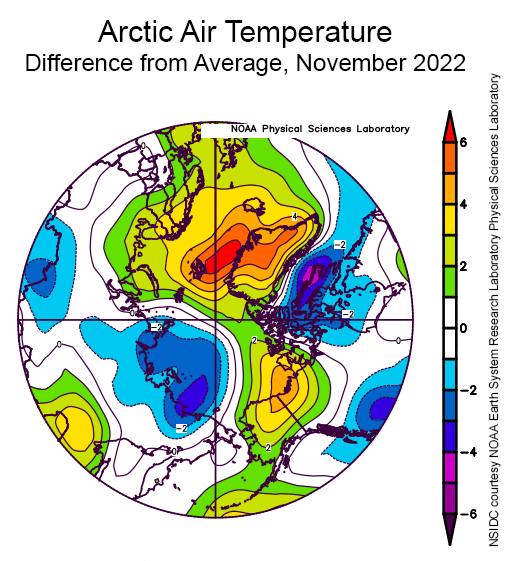
Indeed, air temperature at the 925 hPa level (approximately 700 meters above sea level) over much of the Greenland Sea (between Norway and Greenland) was 3 to 6 degrees Celsius (5 to 11 degrees Fahrenheit) above average. The temperature in the northern Yukon and northeastern Alaska regions was about 4 degrees Celsius (7 degrees Fahrenheit) above average.
However, the Siberian side of the Arctic experienced temperatures 1 to 3 degrees Celsius (2 to 5 degrees Fahrenheit) below average. The Baffin Bay region had temperatures of 3 to 5 degrees Celsius (5 to 9 degrees Fahrenheit) below average.
The image below credit NSIDC courtesy NOAA Earth System Research Laboratory Physical Sciences Laboratory shows the departure from mean air temperature in the Arctic at the 925 hPa level, in degrees Celsius, for November 2022. Yellows and reds indicate higher-than-average temperatures; blues and purples indicate lower-than-average temperatures.
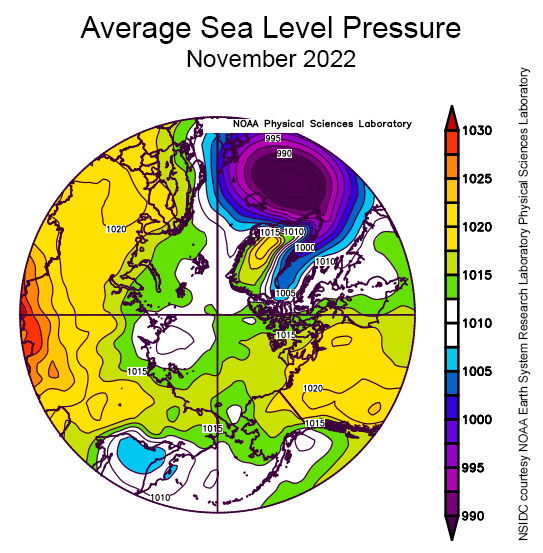
The image below (same credits as the above) shows the mean sea level pressure in the Arctic in hPa for May 2022. Yellows and reds indicate high air pressure; blues and purples indicate low pressure.
As for the atmospheric circulation, the month was characterized by a strong low sea level pressure centered south of Iceland. The counterclockwise circulation around this low is mainly responsible for the widespread warm conditions in the northern North Atlantic and the cooler conditions in Baffin Bay. By contrast, the pressure field over the Arctic Ocean was fairly flat, indicating weak winds overall.
THE CURRENT ANOMALY IN THE GENERAL CONTEST
Looking more in detail at the current Arctic Sea Ice anomalies referred to the long-term 1979-2022 monitoring, we use the image below credits Zachary Labe.
The plot shows the extent of anomalies, calculated using a 5-day running mean from a climatological baseline of 1981-2010. The year 2022, updated to December 12, is shown using a red line, while 2021 is highlighted in yellow.

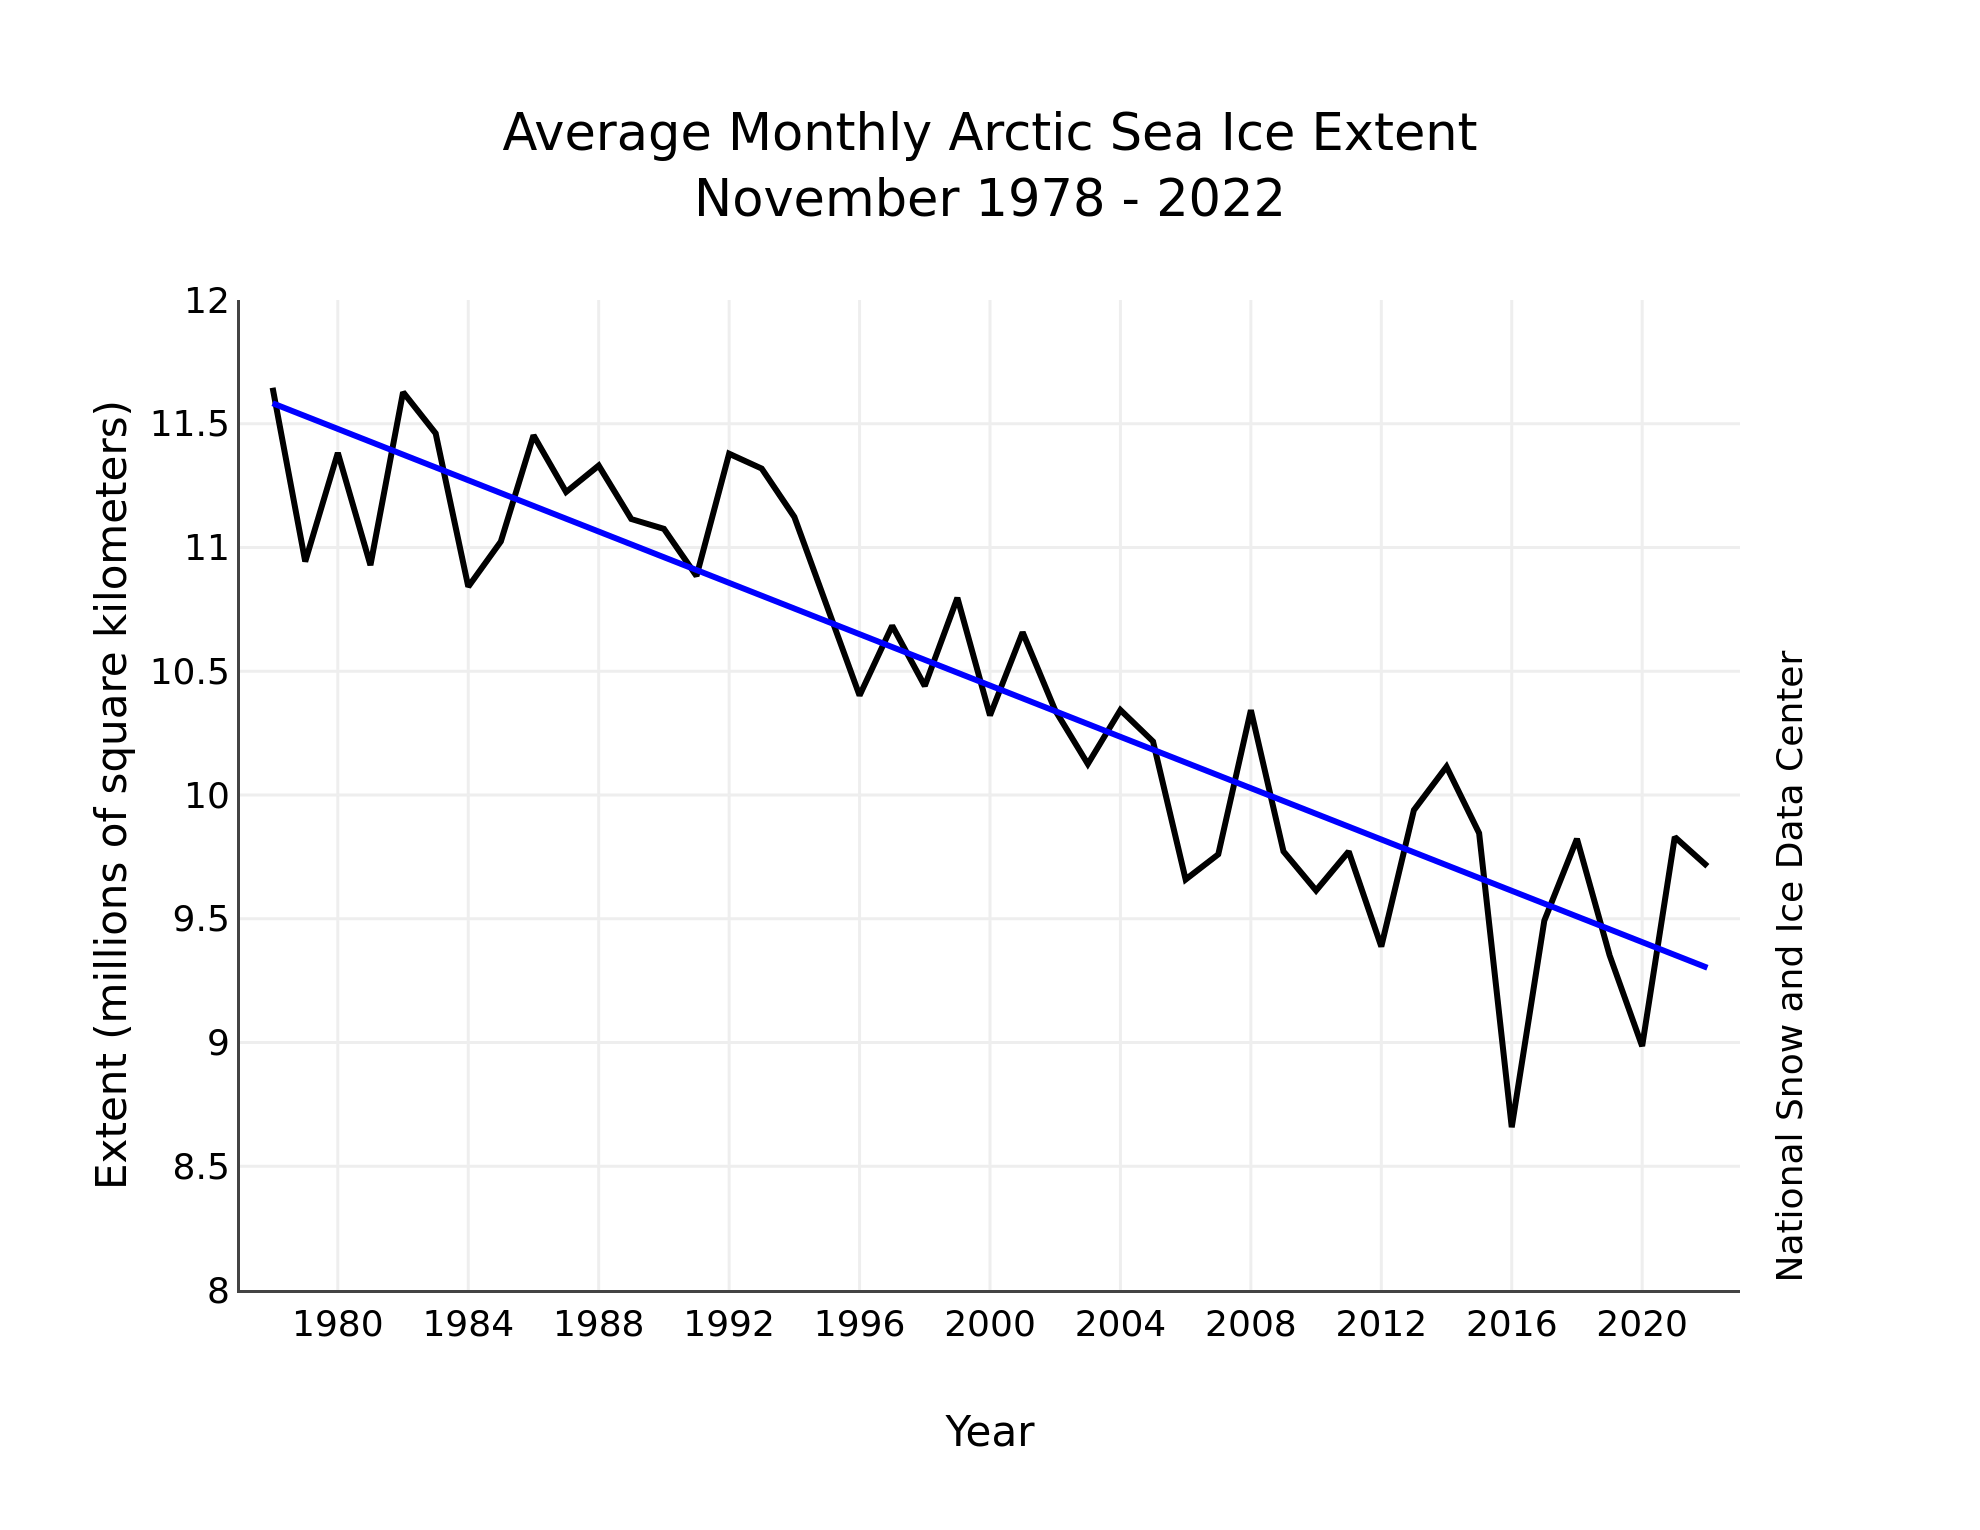
The downward linear trend in November Sea ice extent over the 45-year satellite record is 51,800 square kilometers (20,000 square miles) per year, or 4.8 percent per decade relative to the 1981 to 2010 average. Based on the linear trend, since 1978, November has lost 2.28 million square kilometers (880,000 square miles). This is equivalent to 1.5 times the size of Alaska.
According to satellite observations, Arctic sea ice reached its annual minimum extent on September 18th, 2022. This year, the ice cover shrank to an area of 4.67 million square kilometers (1.80 million square miles), approximately 1.55 million square kilometers (598,000 square miles) below the 1981-2010 average minimum of 6.22 million square kilometers (2.40 million square miles).
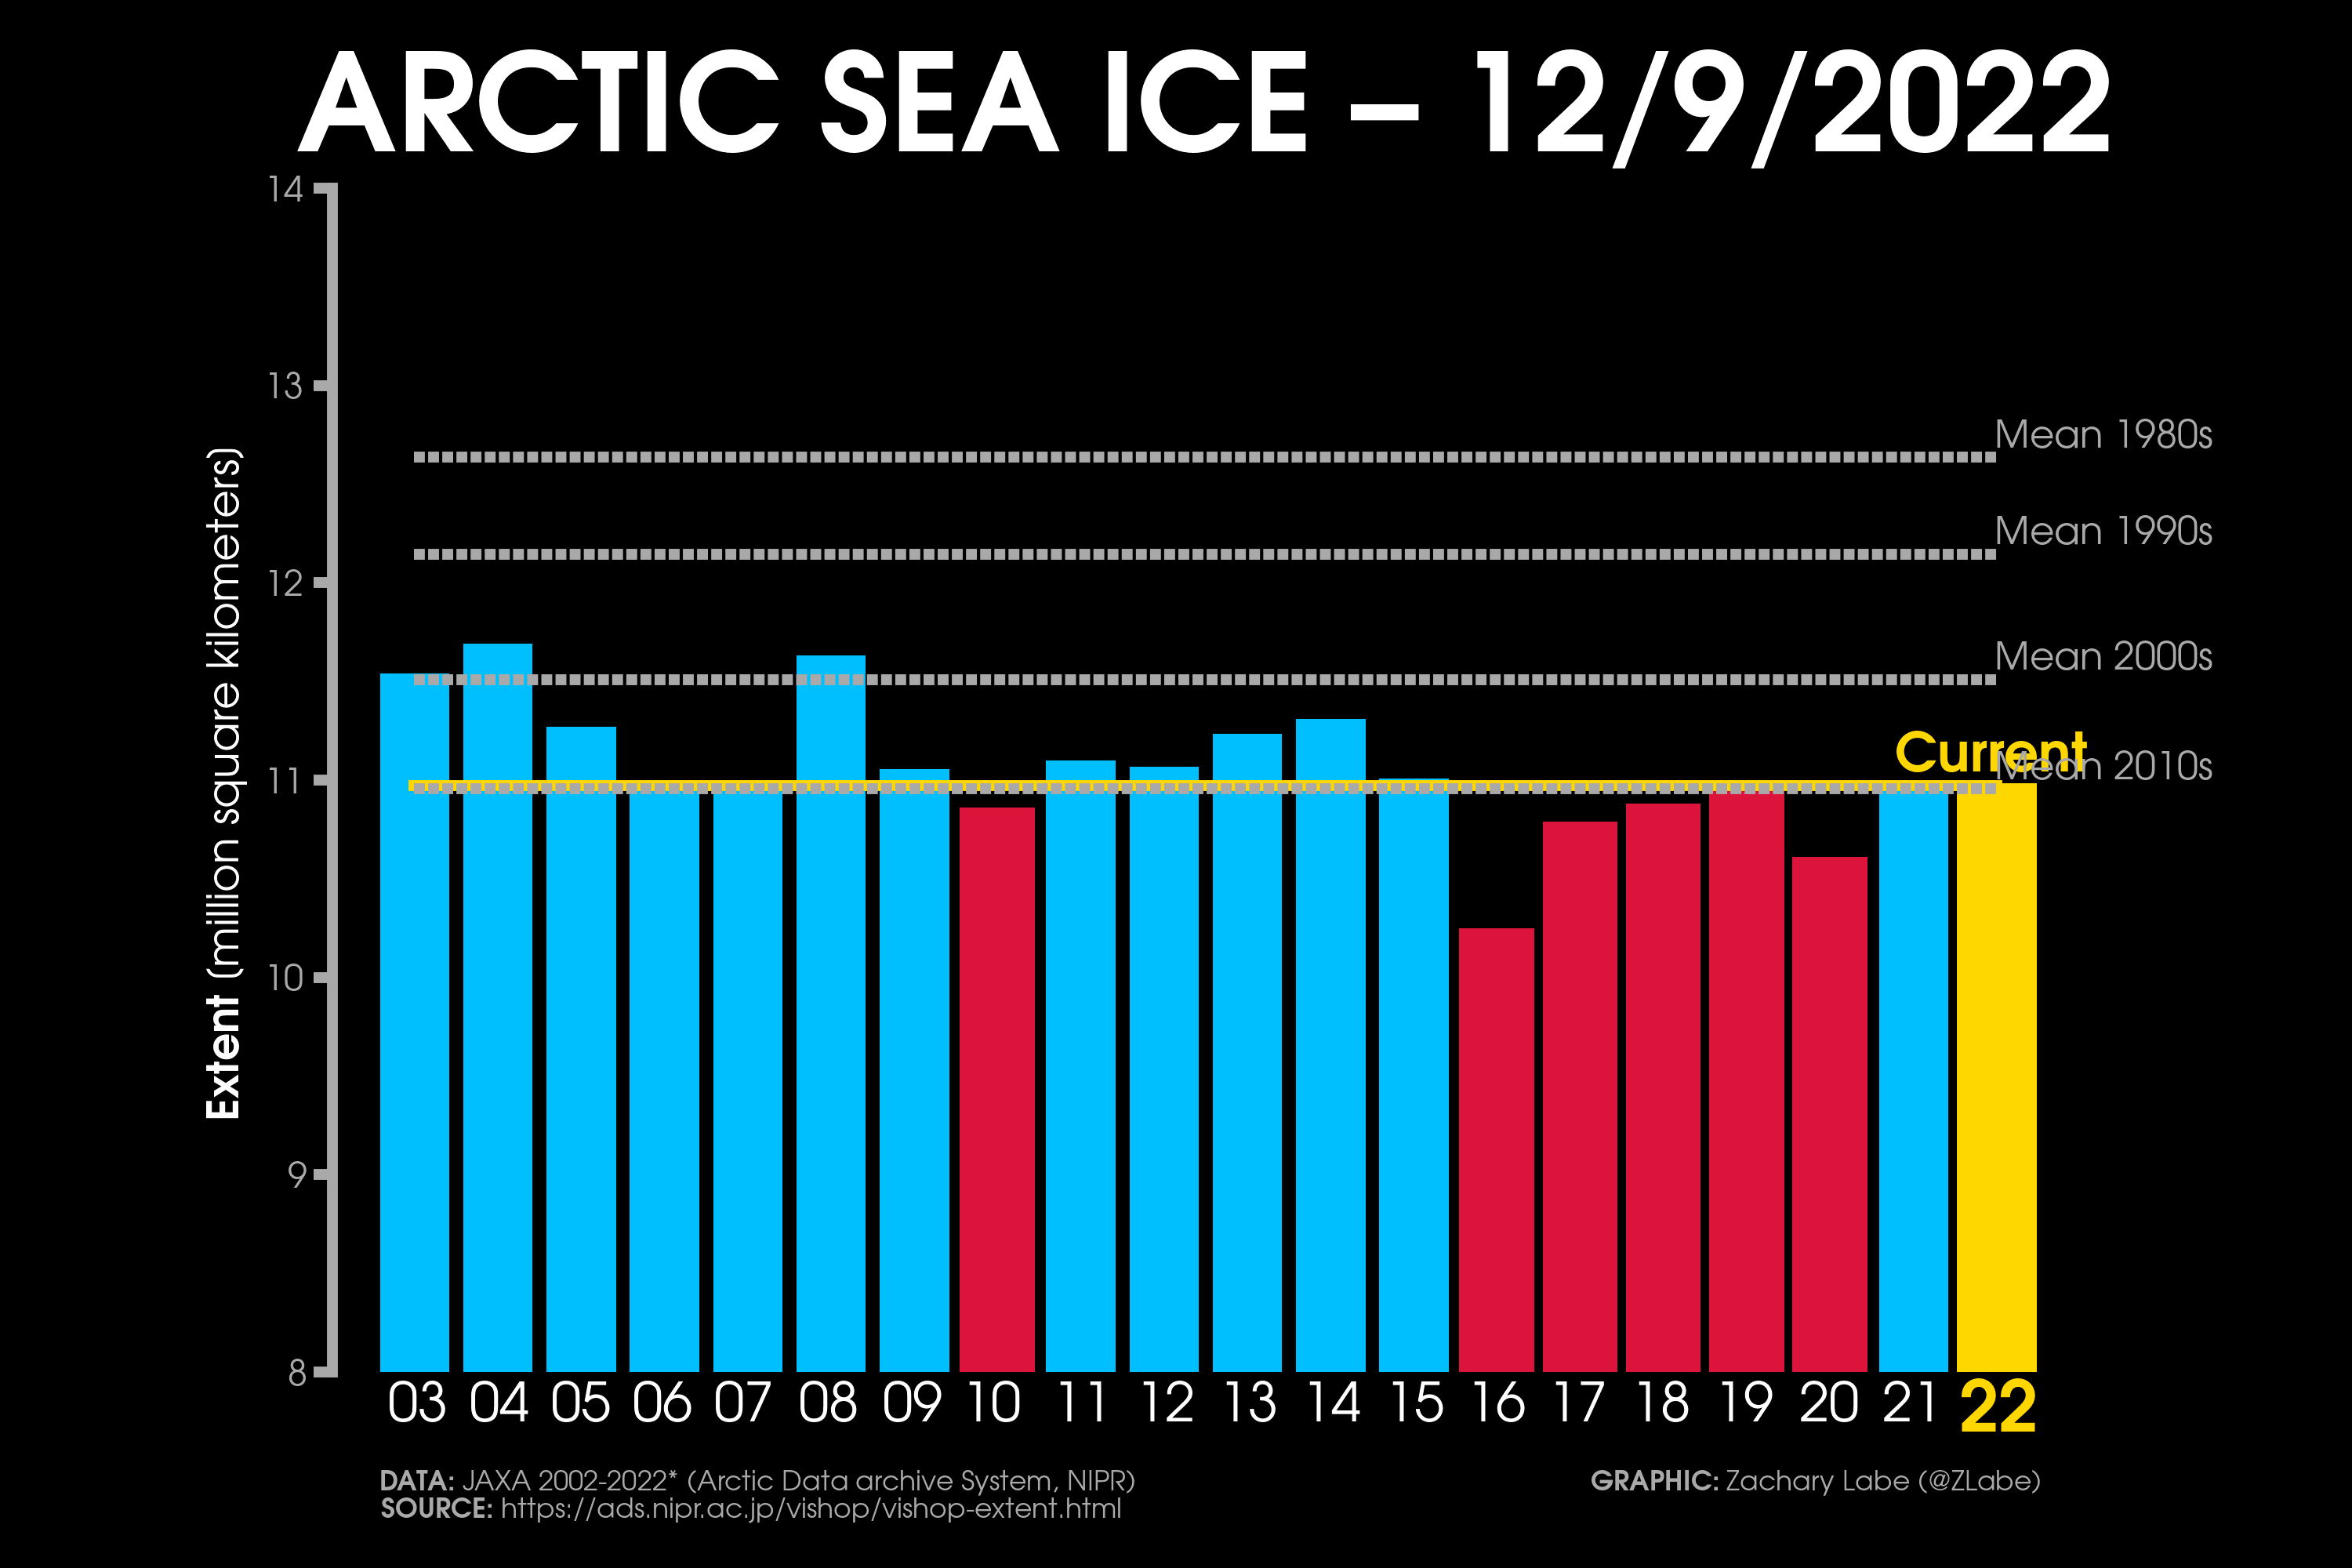
The image above shows the downward trend over the last almost twenty years. The current Arctic sea ice extents from 2003 color bars are blue when 2022 has dropped below the prior year. Updated through December 12th, 2022, by Zachary Labe.
Considering the global situation instead, both the Arctic and Antarctic Sea Ice extent push the global anomaly at -2.193 million square kilometers or about 0.846 million square miles. In the image below, the current sea ice extent anomalies for the Arctic and Antarctic, source NSIDC, DMSP SSM/I-SSMIS F-18 edited by Zachary Labe. Anomalies are based on the 1981-2010 climatology.

SPRING 2022 IN ANTARCTICA
In Australia’s southern hemisphere, springtime temperatures were much below average in 2022. Other austral regions with markedly below-average seasonal temperatures include northern Chile and Argentina, Paraguay and southern Brazil, and much of Antarctica.
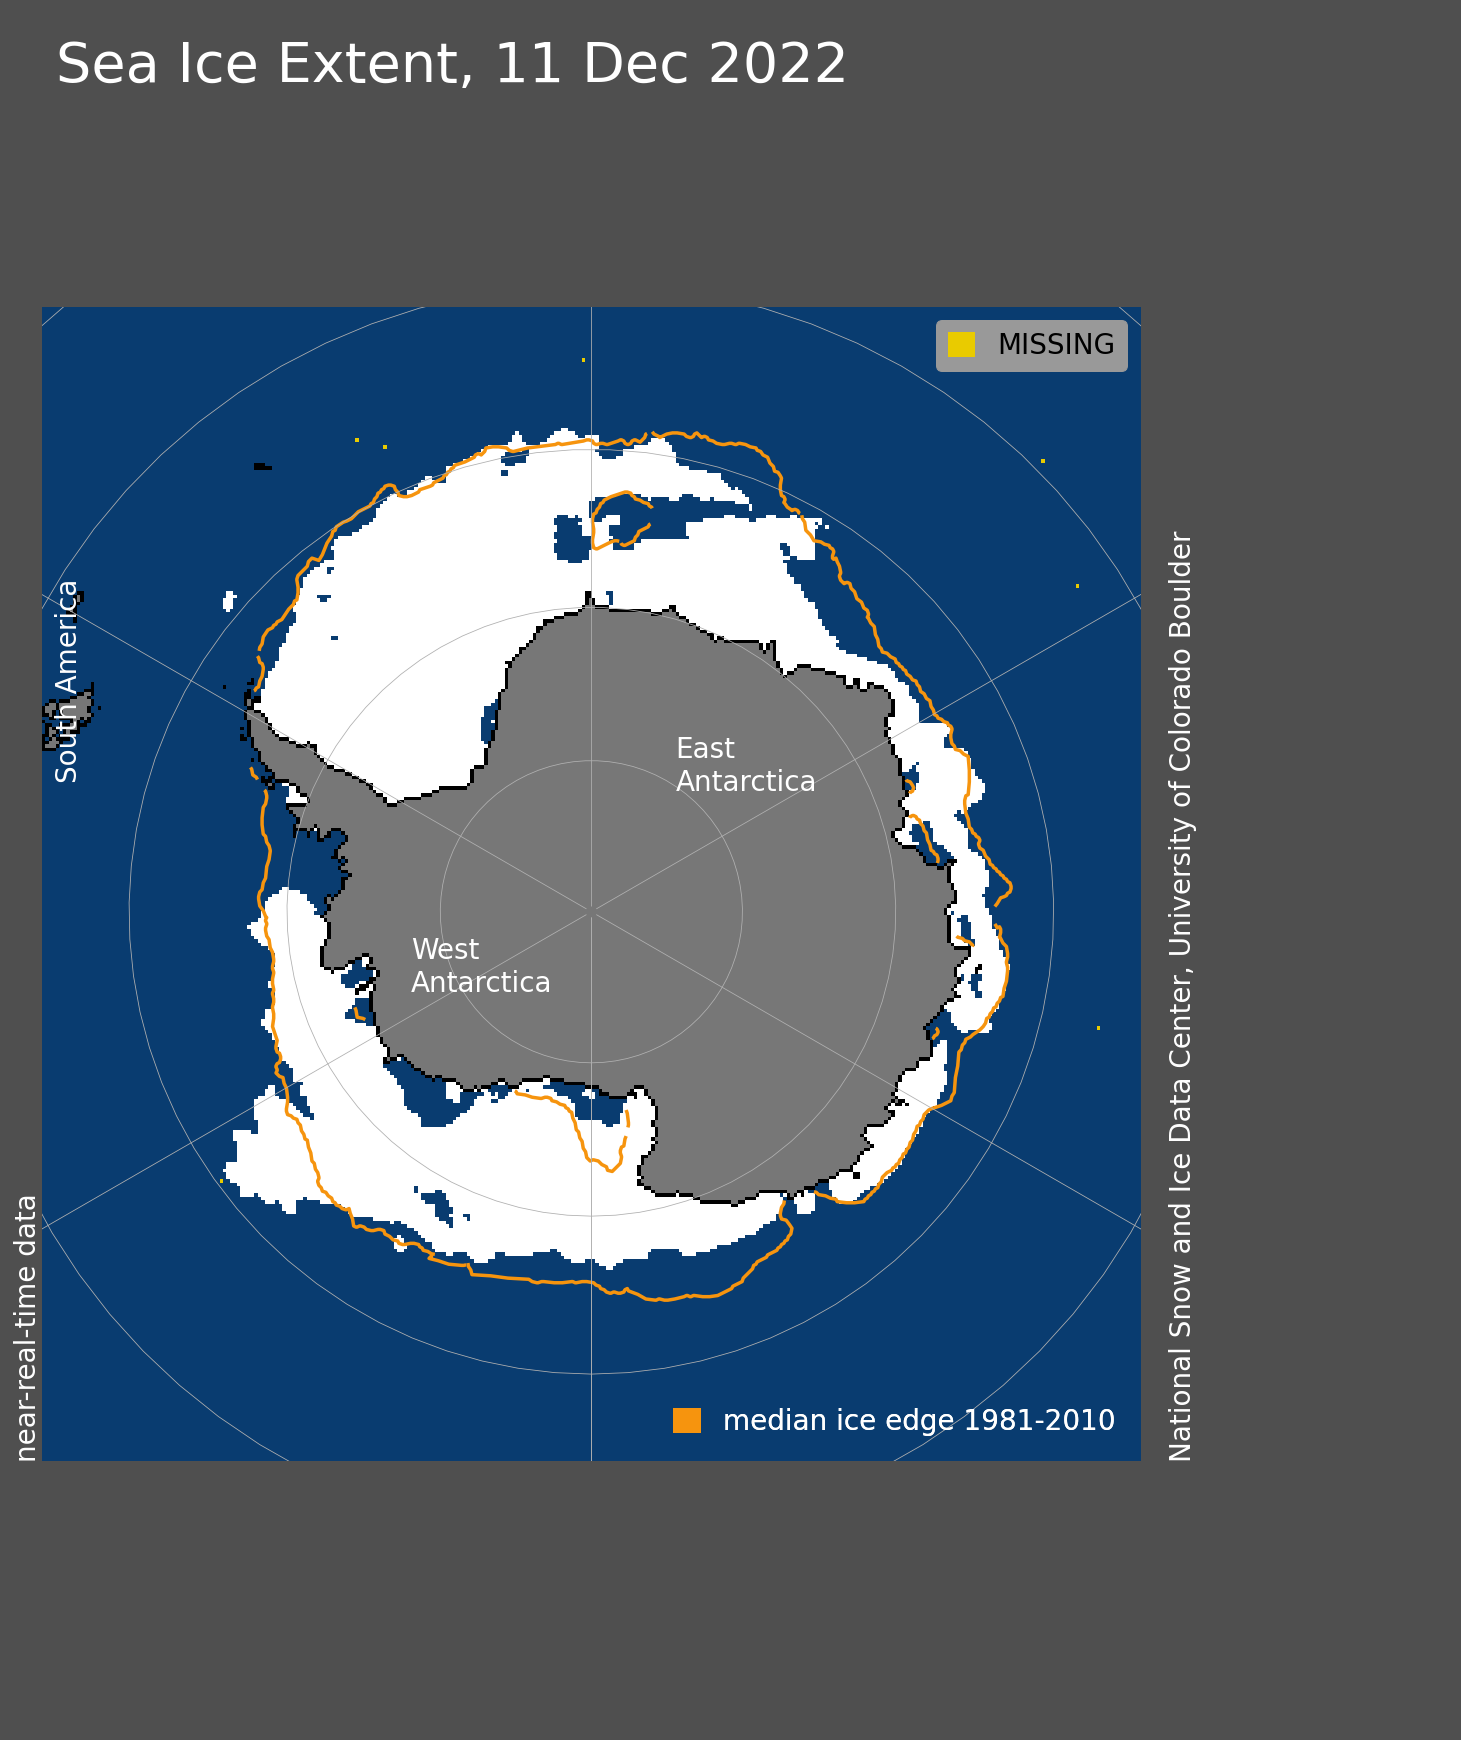
Antarctic sea ice is declining rapidly now in response to seasonal warming. Sea ice extent is extremely low in the Bellingshausen Sea, where much of the eastern portion adjacent to the Antarctic Peninsula has been ice-free for much of November. The image below shows the sea ice extent average for November 2022. The magenta line represents 1981 to 2010 average extent for that month.
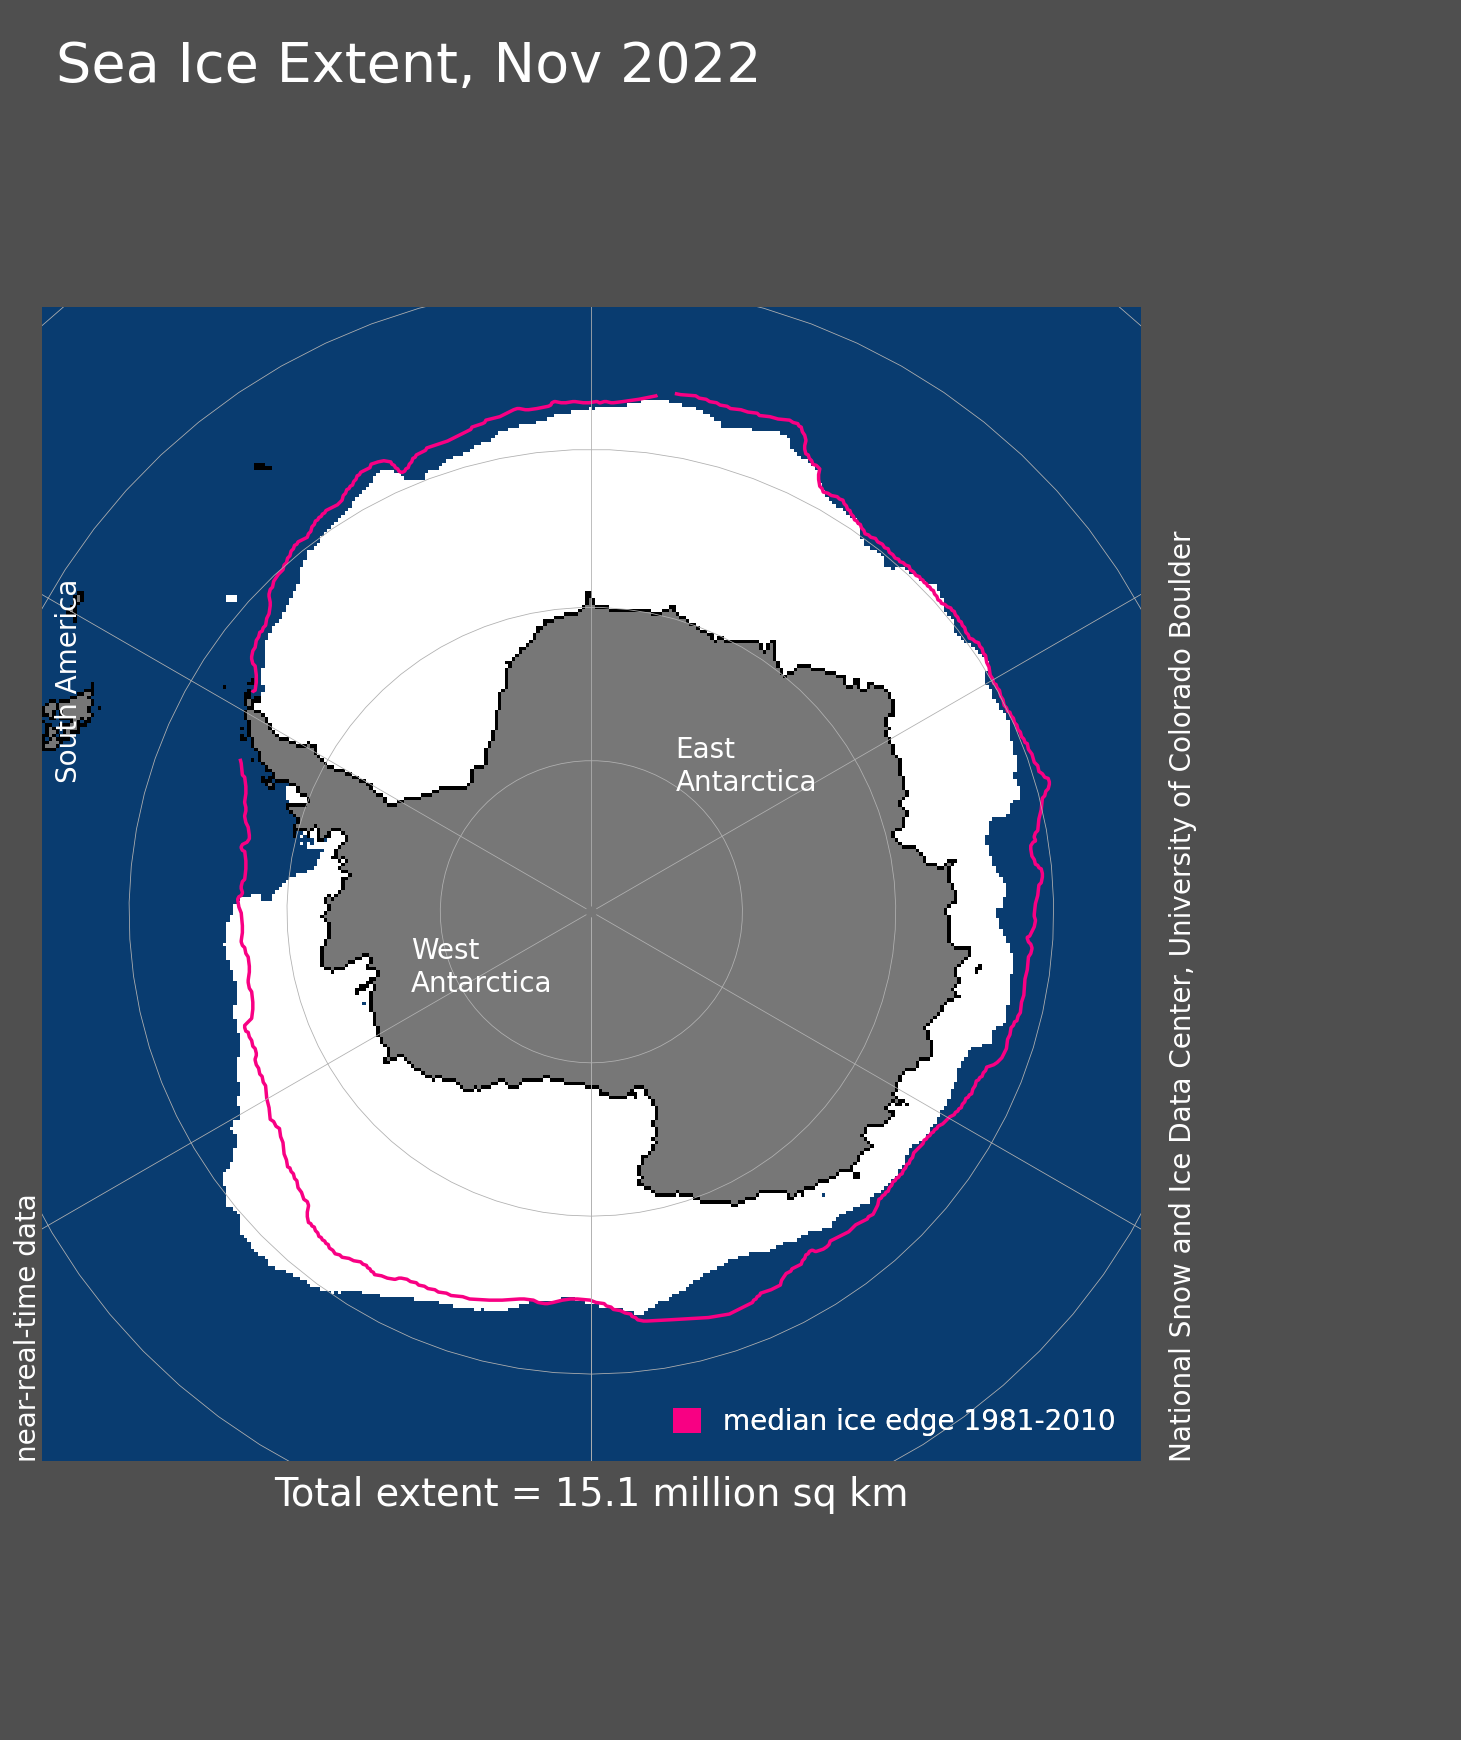
According to the National Snow and Ice Data Center of Boulder, Colorado, the Antarctic sea ice extent for November 2022 was 15.06 million square kilometers or 5.81 million square miles.
The updated daily sea ice extension on December 11th, shown in the image below by the National Snow and Ice Data Center, was 10.85 million square kilometers or 4.19 million square miles. This means that the Antarctic sea ice extent is 1.147 square kilometers (442.8 square miles) below the 1981-2010 average.
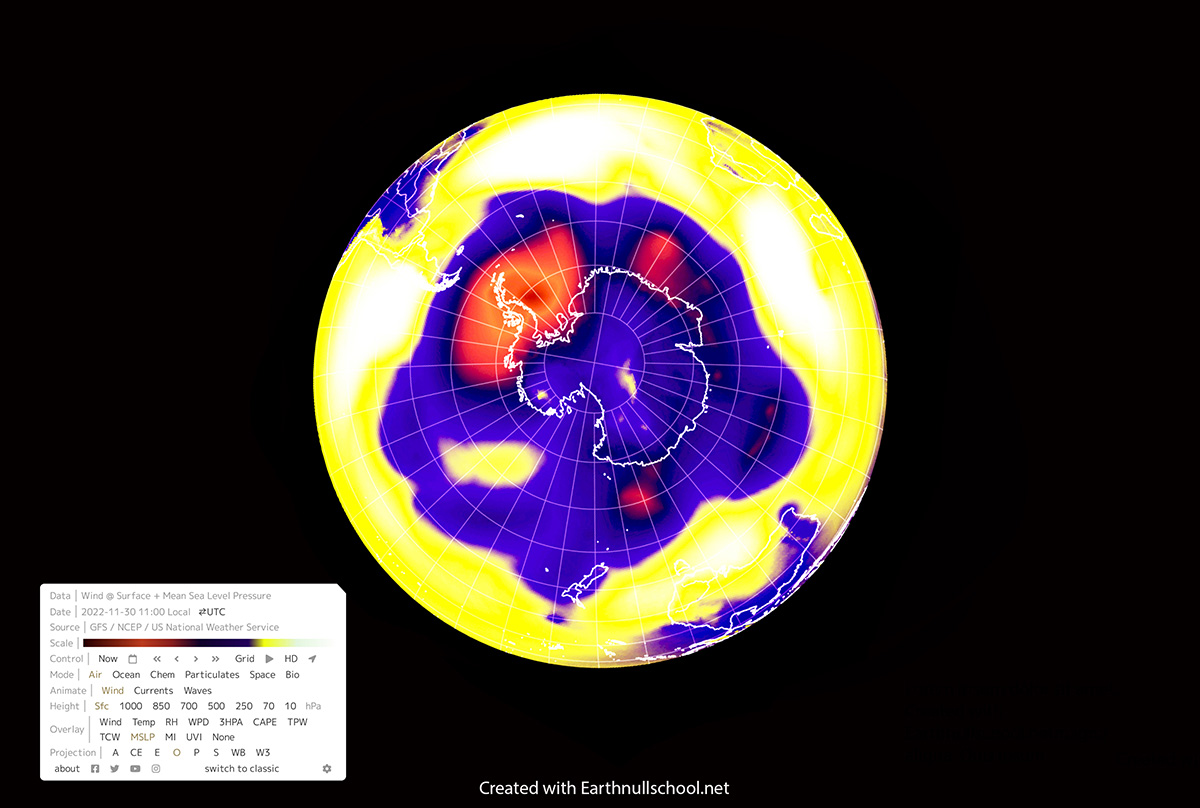
By sharp contrast, the ice extent in the Amundsen Sea just west of the Bellingshausen extended farther to the north than usual. It represented one area of the Antarctic sea ice with an above-average ice extent.
This unusual distribution is explained by the sea level pressure pattern, visible in the image below from Earthnullschool. A strong low pressure over much of the Amundsen Sea (red color), and the eastern Ross Sea have driven a clockwise air circulation that brought warm air from the north onto the western Peninsula region and cold air from the continental ice sheet northward in the Amundsen Sea.
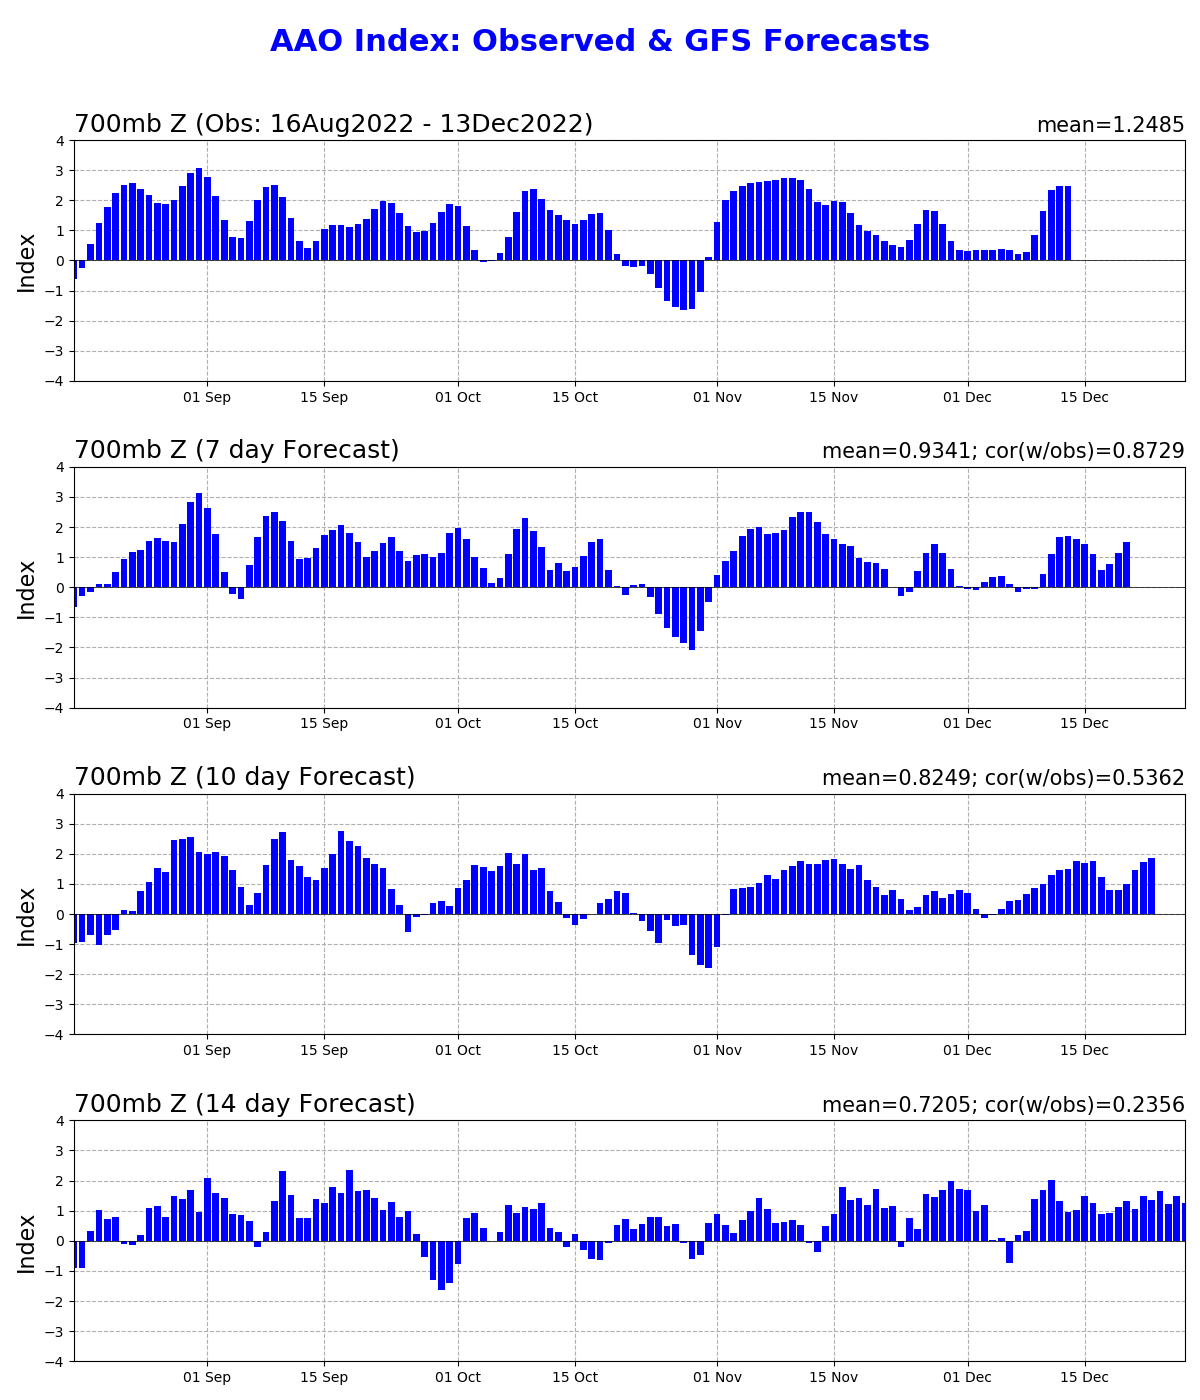
This low-pressure region is a well-known feature of the Antarctic’s climate. A climate index often measures its strength called the Antarctic Oscillation (AAO), shown by the illustration below, credits National Weather Service, NOAA.
The loading pattern of the AAO is calculated by analyzing the monthly mean 700 hPa height during the 1979-2000 period. As we can see in the graphs below (credits to the National Weather Service, NOAA.), the AAO index has been strongly positive for November, indicating especially strong low pressure in the Amundsen Sea. The index has been generally positive for the entire year and has become more positive over the past several decades.
Below, the daily AAO indices are shown for the previous 120 days, and the GFS forecasts of the daily AAO index at selected lead times are appended onto the time series. The indices are standardized by the standard deviation of the observed monthly AO index from 1979-2000. A 3-day running mean is applied to the forecast time series.
The values at the upper left and right corner of each figure below indicate the mean value of the AAO index and the correlation coefficients between the observation and the forecasts, respectively.
Furthermore, the sea ice extent of Antarctica has been decreasing in recent years. Currently, both sea ice extent and sea ice area are very low compared to the 1976-2010 average. As for the Arctic, sea ice extent is the integral sum of the areas of all grid cells with at least 15% ice concentration, while sea ice area is the integral sum of the product of ice concentration and area of all grid cells with at least 15% ice concentration.
The image below shows the 10-year averages between 1979 and 2018 and yearly averages for 2012, 2014, and 2022 of the daily ice extent and ice area. The 2022 value in the red line is the lowest of all the past averages. Credits to J. C. Comiso et al., Goddard Earth Sciences Division Project.

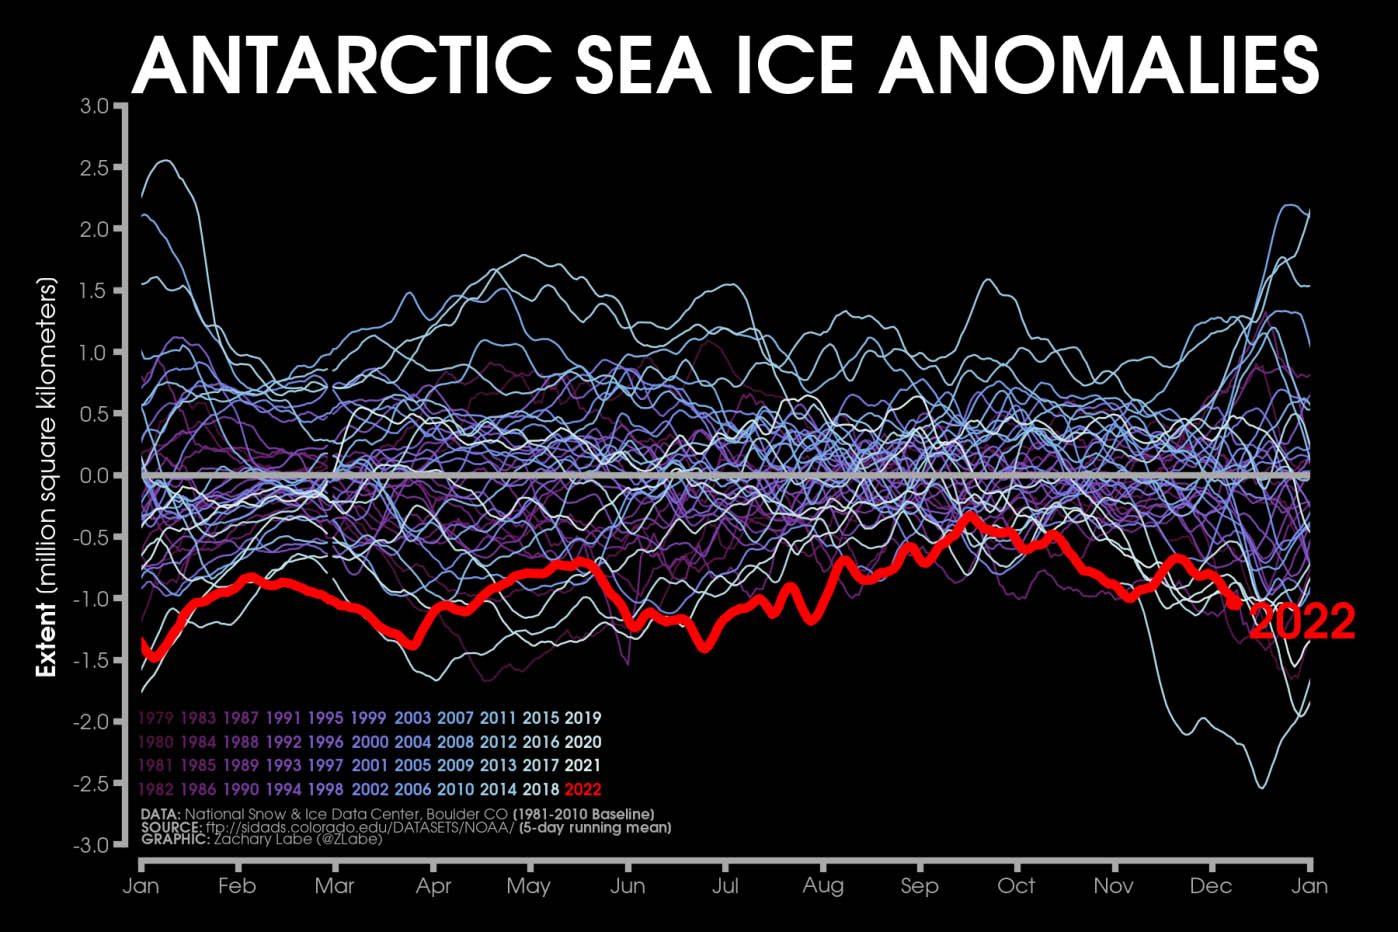
This is also clearly evident in the image below by Zachary Labe, which shows the Antarctic sea ice extent anomalies stretching from January 1979 to the present-day thanks to satellite-era NSIDC, DMSP SSM/I-SSMIS. The anomalies are plotted using a five-day running mean from the 1981-2010 climatological baseline and updated to February 28th.
While overall sea ice extent has only slightly increased since the late 1970s, the rate of increase began to accelerate in 2000, and ice extent reached a record high in 2014. But then something unexpected happened. It dropped drastically over the next three years, reaching a record low in 2017.
We will keep you updated on this and much more, so bookmark our page. Also, if you have seen this article in the Google App (Discover) feed or social media, click the like button (♥) to see more of our forecasts and our latest articles on weather and nature in general.