A strong Atmospheric wave is now emerging from the tropics. It is expected to influence the weather patterns over the Pacific Ocean and North America. It could even play a role in tropical storm development early in the month.
Global weather is a very complex system, with thousands of different factors influencing its development on different scales. But regardless of time and place, the weather is globally connected into one extensive system.
We will look at one of these global weather factors, now emerging as an atmospheric wave in the tropics. You will learn what it is and how it will play its role in the weather development as the meteorological Summer officially begins.

ATMOSPHERIC WAVES
A lot of the global variability is driven by invisible tropical wave-like features in the atmosphere. The largest and most dominant source of short-term variability from the tropical regions is the Madden-Julian Oscillation wave, known simply as MJO.
But what is an MJO wave? It is an eastward-moving disturbance of thunderstorms, clouds, rain, winds, and pressure anomalies. It moves around the entire planet on the equator in about 30 to 60 days.
It also has the power to influence the weather patterns further north over the North Hemisphere, as there is a strong connection between the tropics and the global weather.
The MJO consists of two parts: one is the enhanced rainfall (wet) phase, and the other is the suppressed rainfall (dry) phase. The graphic below from NOAA Climate shows two main components of this wave: increased storms and rainfall (lower pressure) and reduced storms and drier weather (higher pressure) on the other side. Image by NOAA Climate.
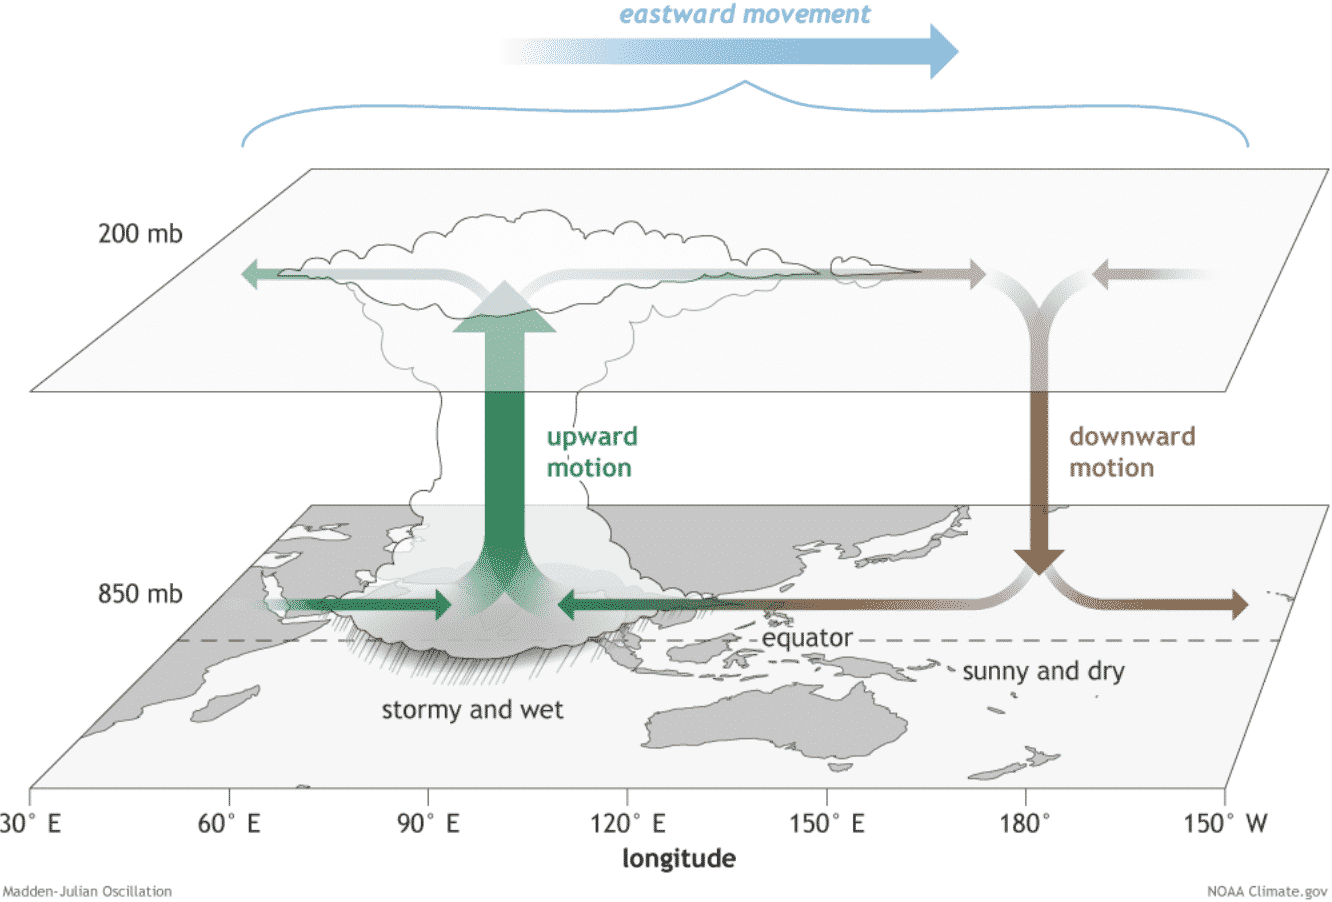
We can see here that on the top, the air is diverging (moving away) over the wet phase and converging (moving together) over the dry phase. This horizontal movement of air is called the Velocity Potential in the tropics.
How can we track an MJO wave? By looking at these larger-scale air movements and the areas where the air is rising and subsiding.
The graphic below shows exactly that. The horizontal movement of air in the upper levels (~12-13km), where cold colors indicate lower pressure and wet weather, and warm colors show drier weather with fewer clouds and precipitation.

You can see that the movement of the wave is arranged into phases. Each has its own influence on the weather patterns, so we need to keep track of how it is moving around the globe. This way, we can easily define where the wave is and what influence it brings along.
Monitoring is essential during the Atlantic Hurricane Season. This is because the wet/enhanced phase of the MJO wave can provide favorable conditions for tropical systems to form over the Atlantic Ocean. However, it also supports the intensification of tropical systems, so we have to keep track of these phases.
Below we have a great visualization of the MJO phases as it moves across the globe. The animation shows cloud patterns in different phases during the wave activity. For example, blue means more clouds and rainfall, and brown areas are drier with fewer clouds.

We have also produced a video animation showing the global atmospheric moisture as precipitable water to put everything into perspective. We can see how the tropical regions connect with the mid-latitudes, providing “atmospheric rivers” and playing into the global weather system.
A WAVE EMERGING
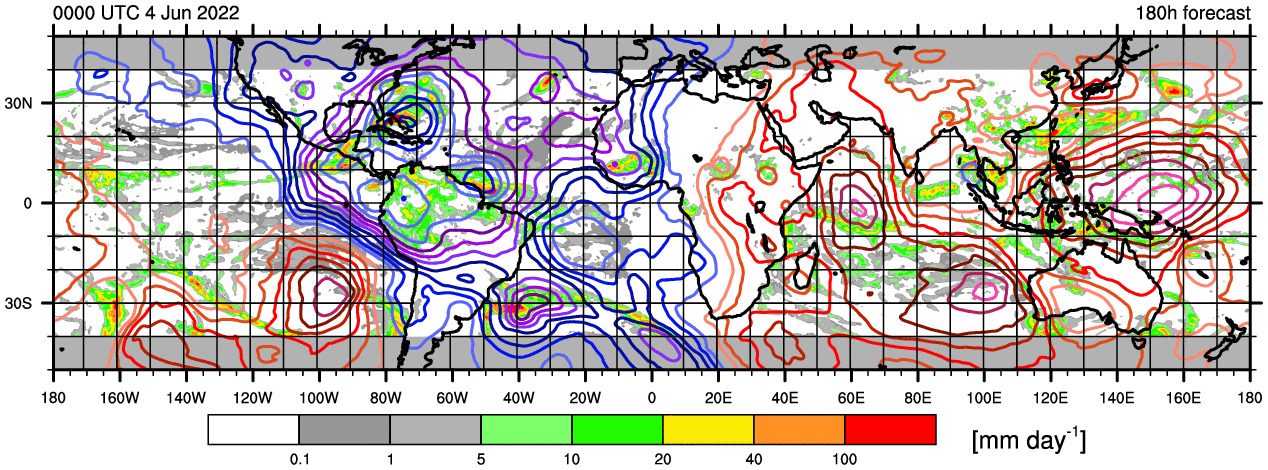
Looking at the latest analysis, we can see the convective phase of the MJO wave emerging over the western Pacific Ocean. The dry/suppressed phase is currently over the Atlantic Ocean. Looking at the diagrams above, this corresponds to the phase 6 pattern.

But looking a week ahead, we can see a totally different picture. The wet/enhanced phase is strong over the Atlantic Ocean and over North/South America. The dry phase is over the Indian Ocean and the West Pacific, a phase 7/8 combo.
MJO WEATHER FORECAST
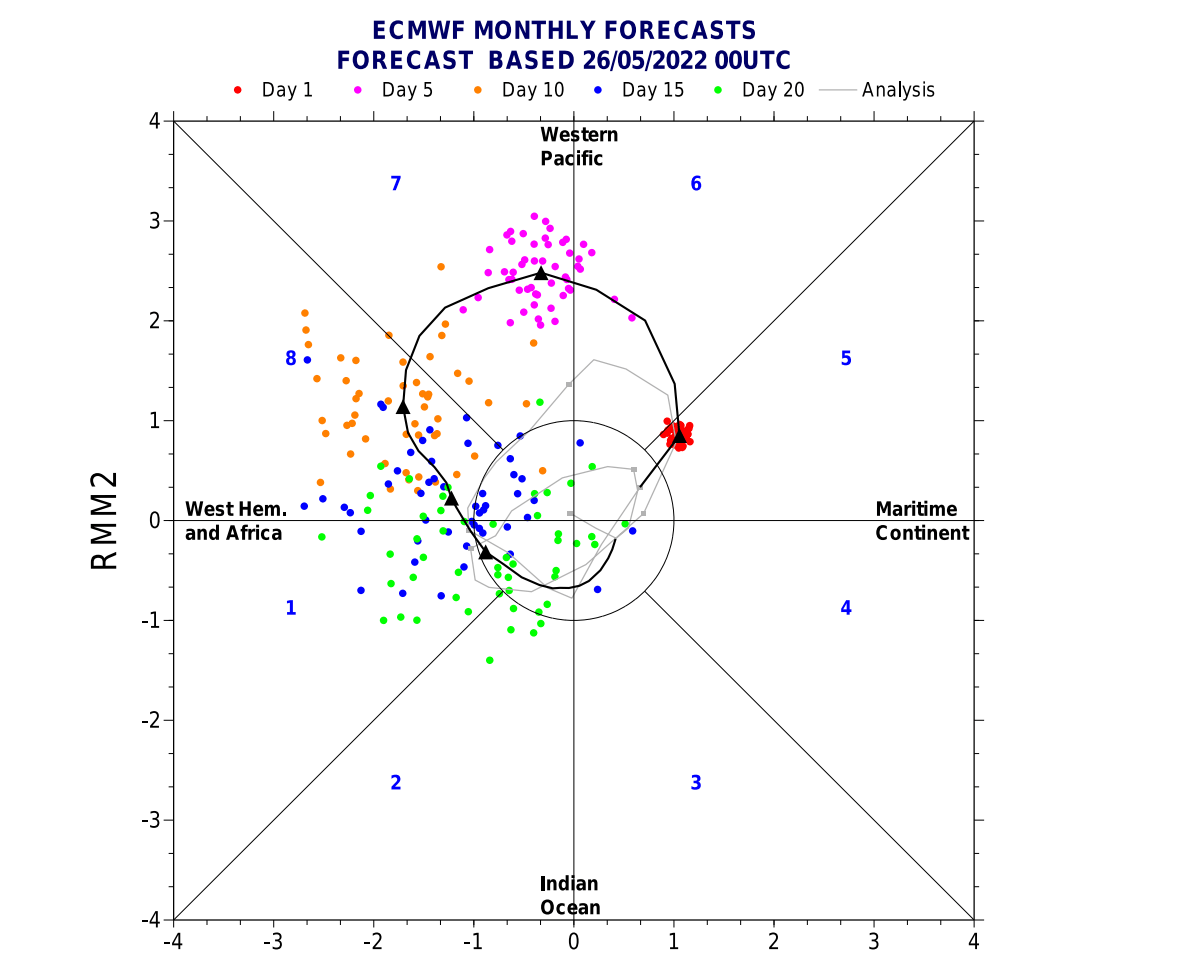
We now know what the MJO wave is and how it moves across the globe. Below is an ECMWF ensemble forecast of the MJO phases on a diagram. It is quite easy to read, as we can see in which phases it is moving and on which day.

We are now starting in phase 6, moving into 7 in early June, and then grazing into phase 8. Below we have the NOAA temperature composites for temperatures over the United States in the warm season. We can see temperature anomalies in each phase.

Phase 6 has a warm tendency for the eastern United States, while phase 7 shows a reverse with cooler in the east and warm in the west. But phase 8 favors more negative anomalies over the eastern United States.
We will now look at the weather pattern forecast for the next two weeks, looking for the MJO signal from the Pacific Ocean to the Atlantic.
GROWING WEATHER IMPACT
Below is the Phase 6 pressure anomaly composite for the Spring season. It suggests a high-pressure ridge in the North Pacific and over the eastern United States. We also have a low-pressure system over the western United States and western Canada. NAO is in the negative mode.

These composites use historical data for each phase in different seasons. It aims to uncover a signal that each MJO phase produces at a certain time of the year. Think of it as guidance on what to expect influence-wise from these waves.
Looking at the pressure anomaly forecast for the late May period, we can see the low-pressure area over western Canada and the western United States. We have high pressure over the eastern United States and a ridge in the North Pacific. This is good compatibility with the expected signal for phase 6.

We can first see a strong warm anomaly in the Polar regions by looking at the temperatures. But that is unrelated directly to the MJO. But we do have a typical phase 6 pattern over North America, ranging from west cold to warm east anomalies.

Looking at North America, we can see this strong weather contrast. We have stronger negative anomalies over much of the western United States. Warmer than normal weather is forecast over the northeastern United States, in the warm southerly flow.

Based on the phase forecast from ECMWF, phase 7 influence will play a big role as June begins.
PHASE 7 WEATHER PATTERN
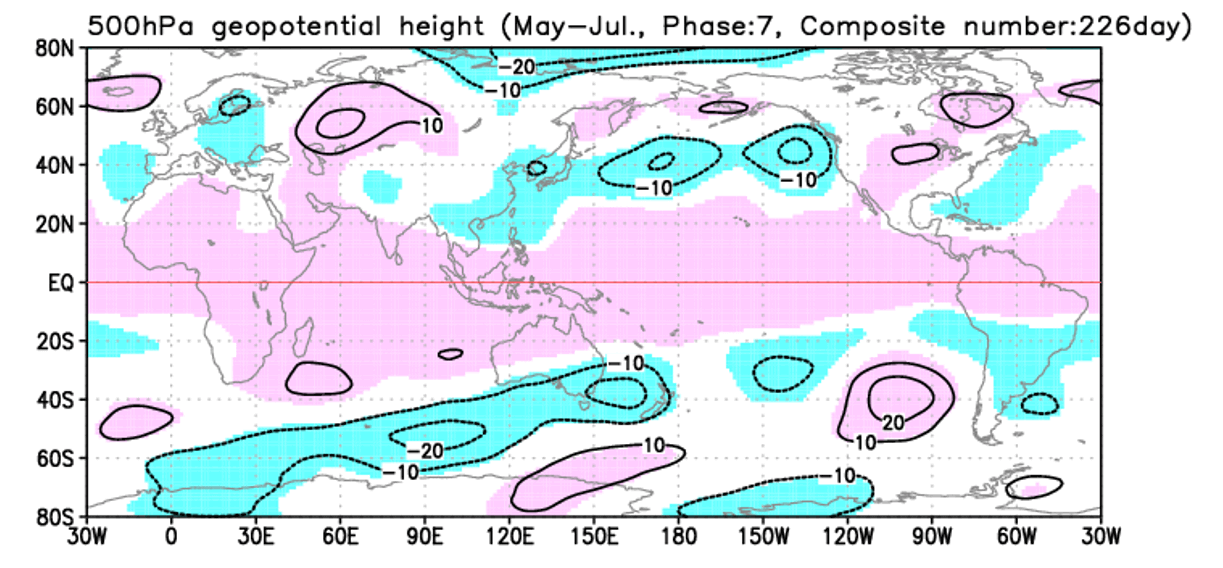
The composite for phase 7 in the May-July period shows high pressure over the United States and Canada. Low pressure is bound to the North Pacific and likely eastern United States. NAO remains in the negative mode.
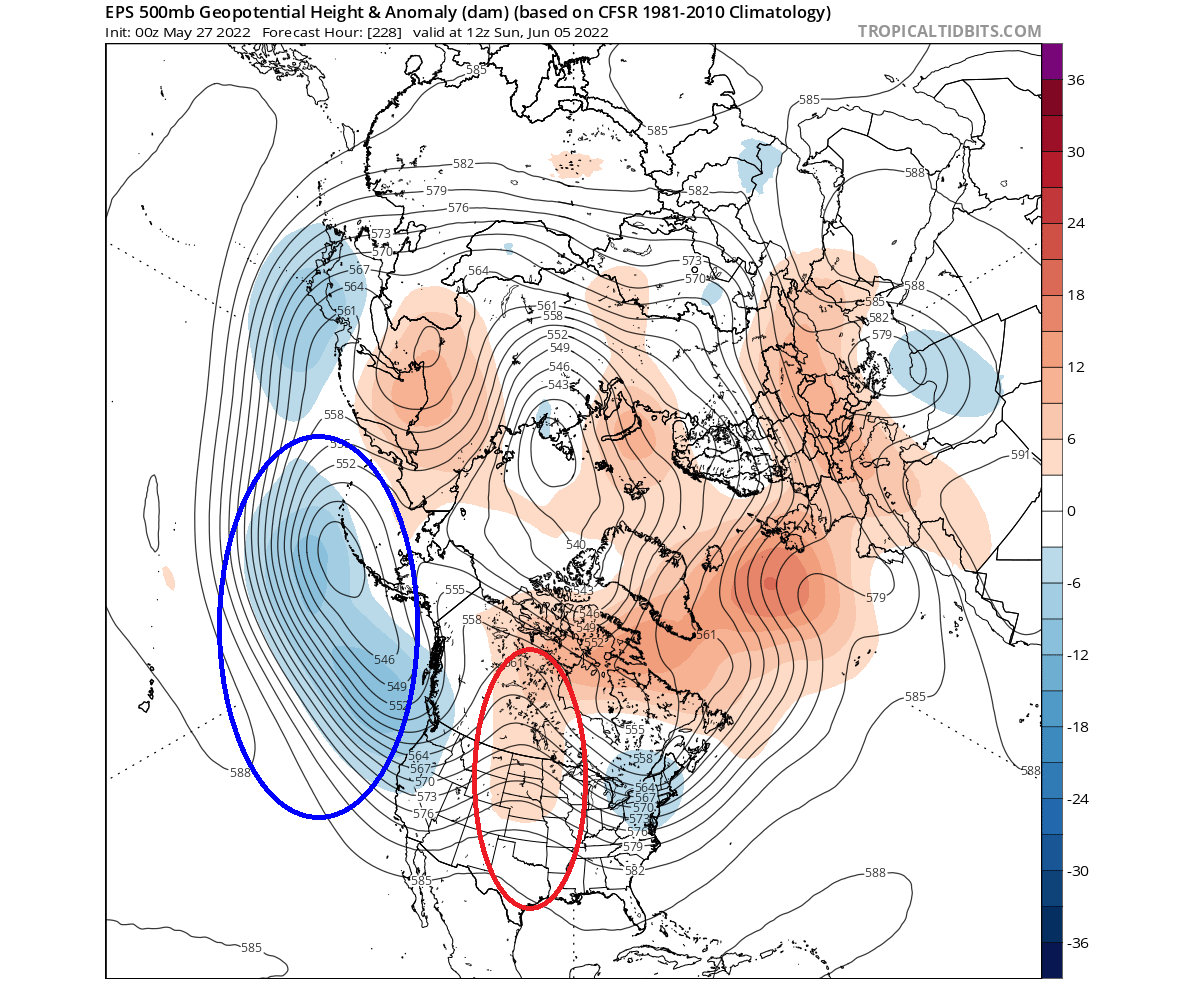
The ECMWF pressure forecast shows exactly this, with a ridge over the United States. A broad low-pressure area is found over the North Pacific, and an outgoing low-pressure system over the eastern United States.
The temperature composite shows warmer temperatures tendency over the western United States and negative anomalies in the eastern end. But of course, we have to keep in mind that there are also other background factors at play, so the actual weather is never the same.

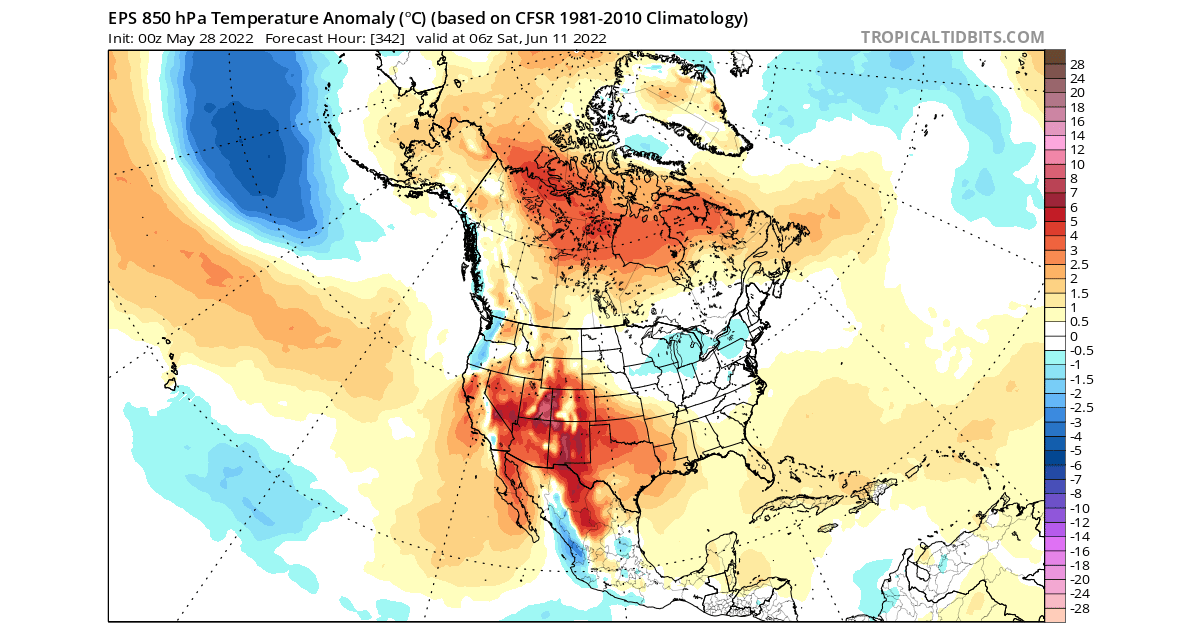
The 850mb temperature anomaly for early June shows an expected phase 7 MJO pattern over North America. Compared to the previous phase, we now have cold anomalies in the east and warm in the west.
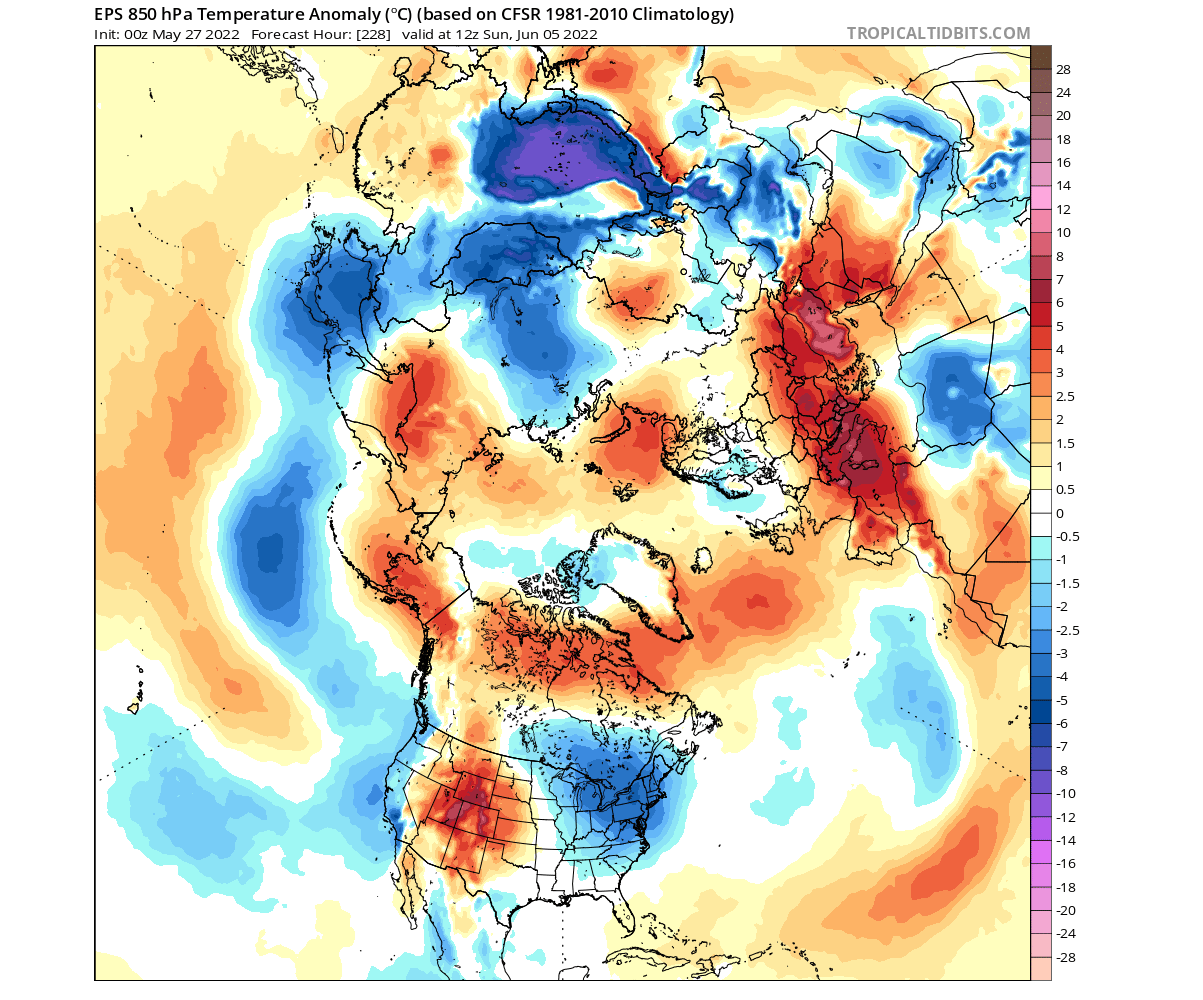
Below we have a surface temperature anomaly forecast over North America. The forecast calls for colder than normal air spreading into the Midwest and the northeastern United States. This pattern is in the expected range for the expected phase 7 influence of the MJO wave.

6-10 DAY NOAA FORECAST
NOAA also regularly releases its weekly forecasts for the United States. Below we have the temperature forecast in the 6-10 day range, where they call for colder than normal weather in the Midwest and parts of northeastern United States. Warmer weather will prevail in the west and far south.
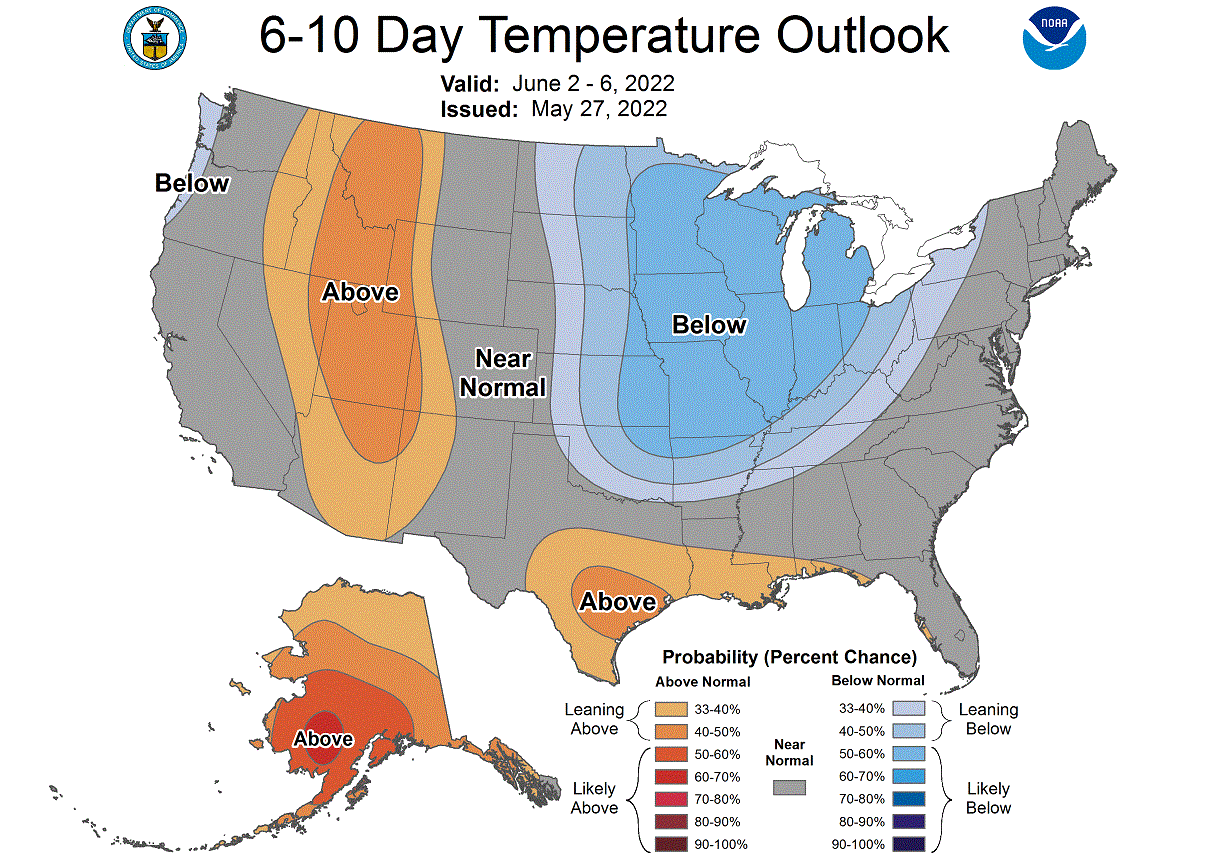
The forecasts have just begun to fully grasp the changes in the tropics and the emerging MJO wave. So we can expect more adjustments in the next few days.
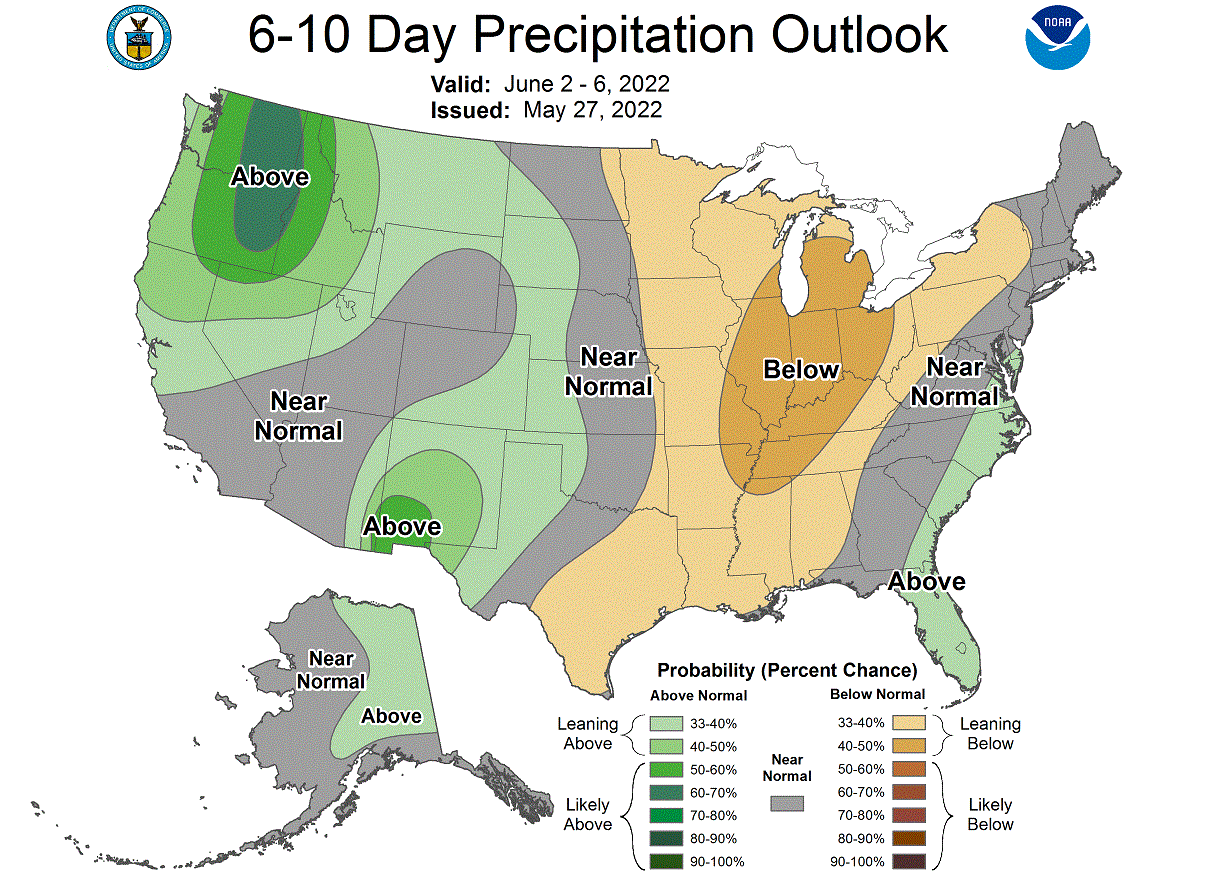
We also have the official precipitation outlook below, which calls for more precipitation on the west and east coast. However, cooler northerly air is generally drier, so less precipitation is expected in the eastern half of the United States.
MID-MONTH WEATHER INFLUENCE
Looking again at the MJO forecast phase diagram, we can see that in the 10-15 day range, phase 8 will be active. The evolution from here onwards is not so certain and requires close monitoring. The MJO will likely return to lesser activity and disperse.
Phase 8 in the warm season signals a low-pressure zone in the North Pacific and the southern United States. Over Canada, a high-pressure anomaly is usually present in this phase.

The ECMWF ensemble forecast shows this weather pattern ahead. High-pressure remaining stable over Canada, and low-pressure anomalies in the North Pacific. Over the United States, we don’t have a clear pattern, but it does trend towards lower pressure anomalies in the northern or eastern part of the country.

The temperature pattern for phase 8 in the summer is usually warmer in western Canada. Over the United States, it is trending cooler than normal over the far east and the northeast.
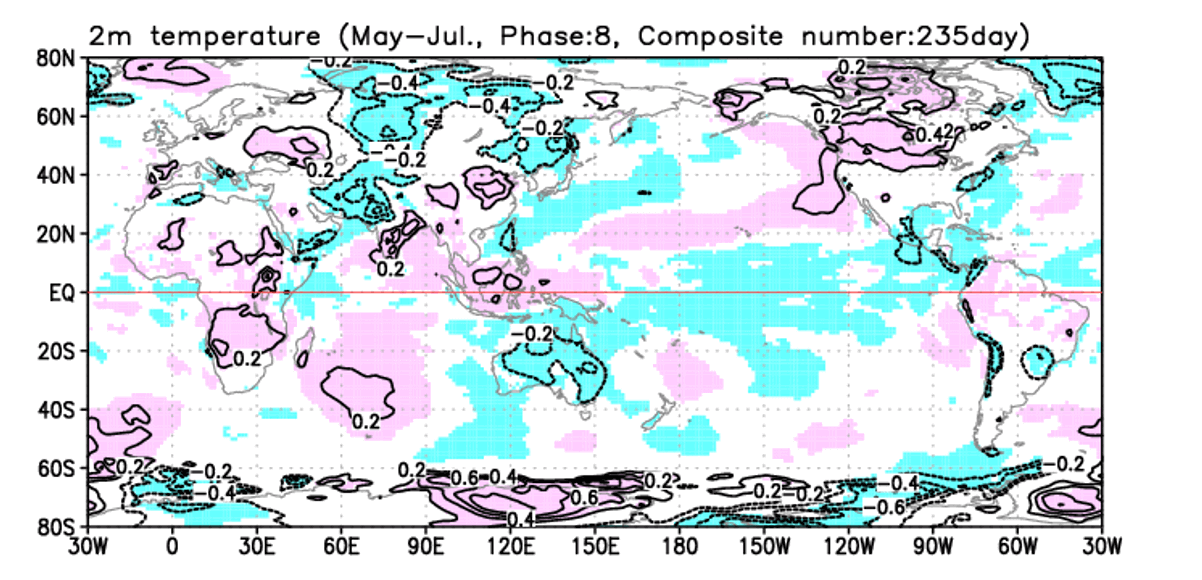
We have a cooler than normal trend in the northeastern United States, looking at the ensemble forecast. The Western United States is warmer than average, along with Canada.
NOAA 8-14 DAY WEATHER OUTLOOK
This process is captured on the official NOAA temperature outlook in the 8-14 day timeframe. NOAA is forecasting cooler than normal conditions over the northeastern United States and the pacific northwest. Conversely, warmer weather prevails over the central and southern United States.
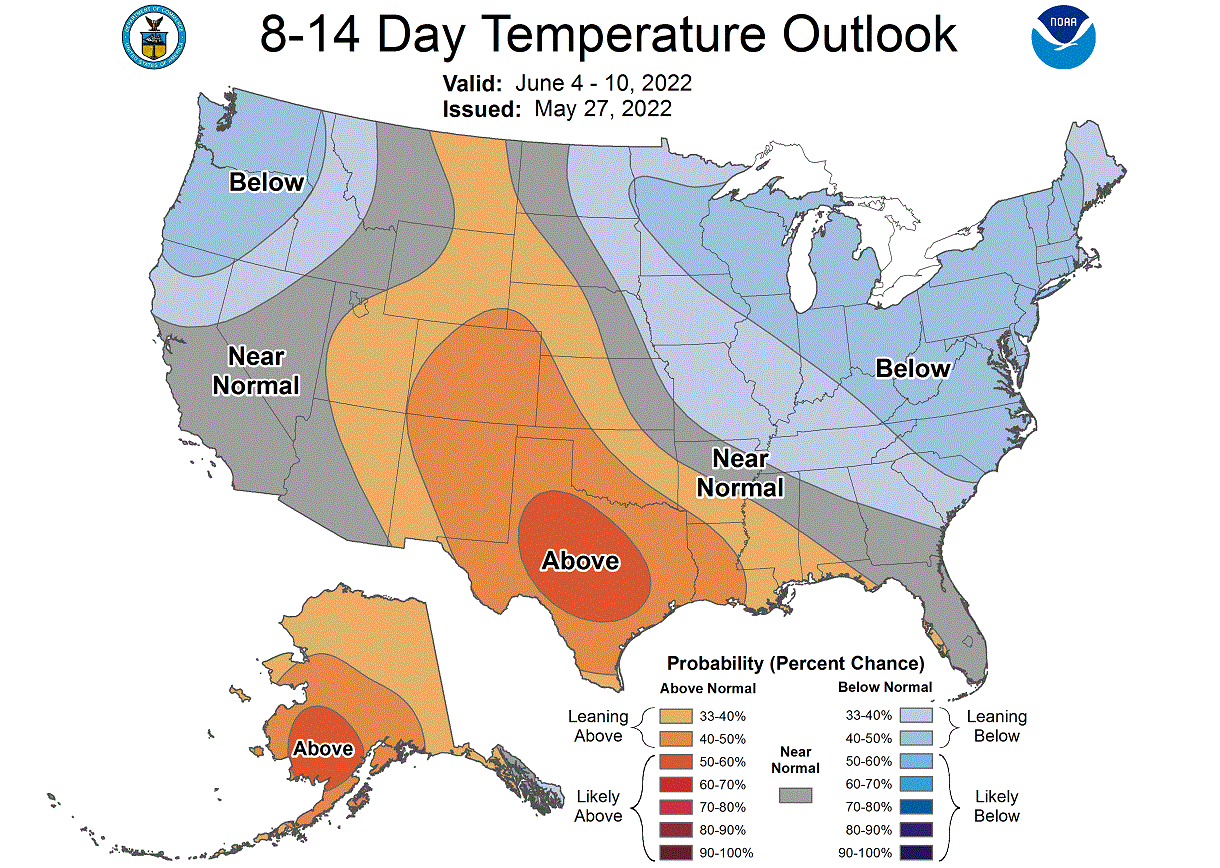
The forecasts have just begun to fully grasp the changes in the tropics and the pattern overall. So we can expect the official NOAA forecast to expand the normal and colder area further into the central and northeastern regions.
NOAA precipitation outlook also calls for wetter conditions over the northwestern United States. However, as seen before, cooler anomalies also mean less precipitation over the eastern half of the country.

The Atlantic Hurricane Season officially begins on June 1st. For this reason, we will look at the impact that this MJO wave might have on early tropical activity.
MJO WAVE AND TROPICAL ACTIVITY
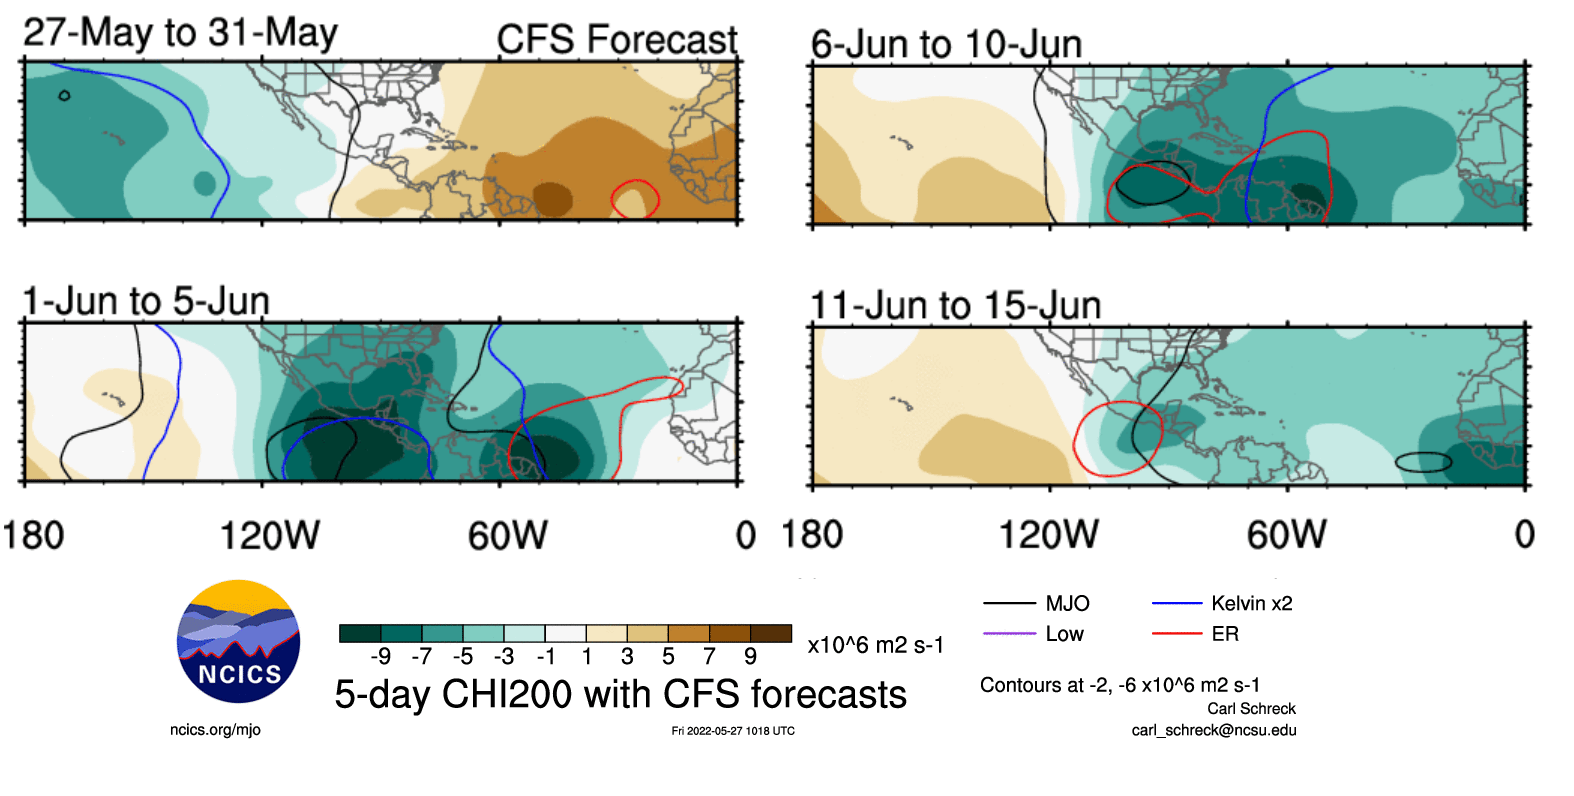
First, looking at the forecast, we see a strong wet/enhanced phase over the Caribbean and the Atlantic ocean in early June. This pattern generally supports any tropical development. But we are in the very early part of the hurricane season, so its impact is not yet as profound.
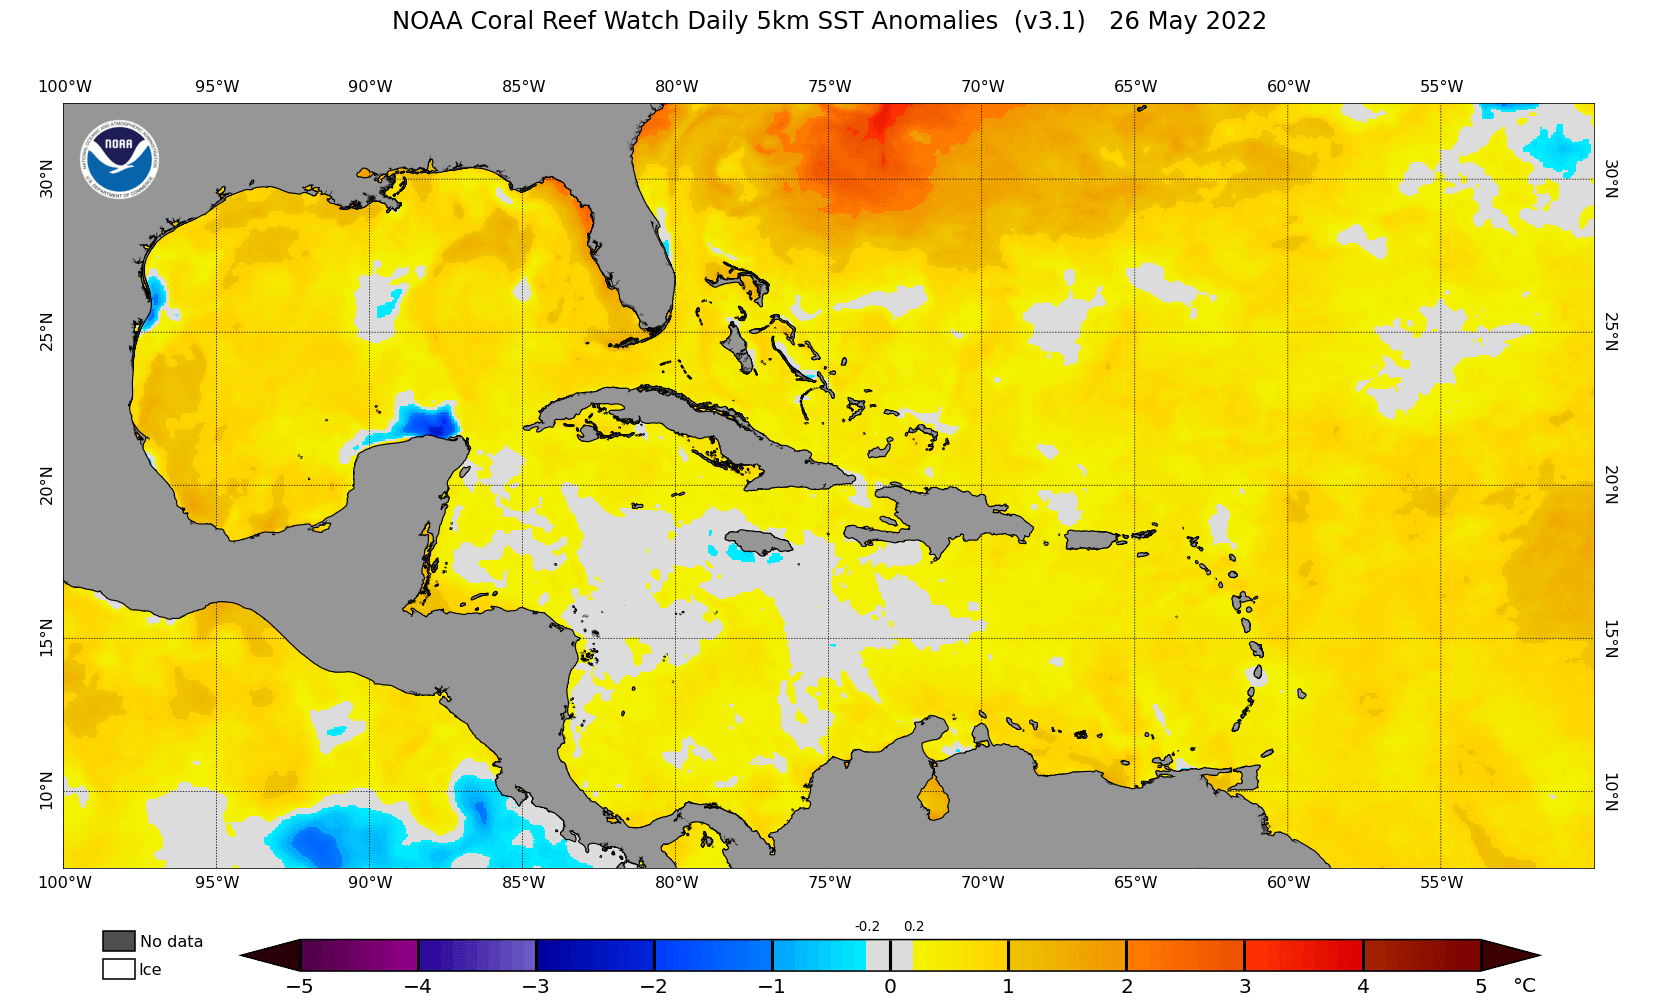
Looking at the ocean surface temperatures, most of the Caribbean sea and the Gulf of Mexico are running warmer than normal. Ocean temperatures are supportive of tropical development.
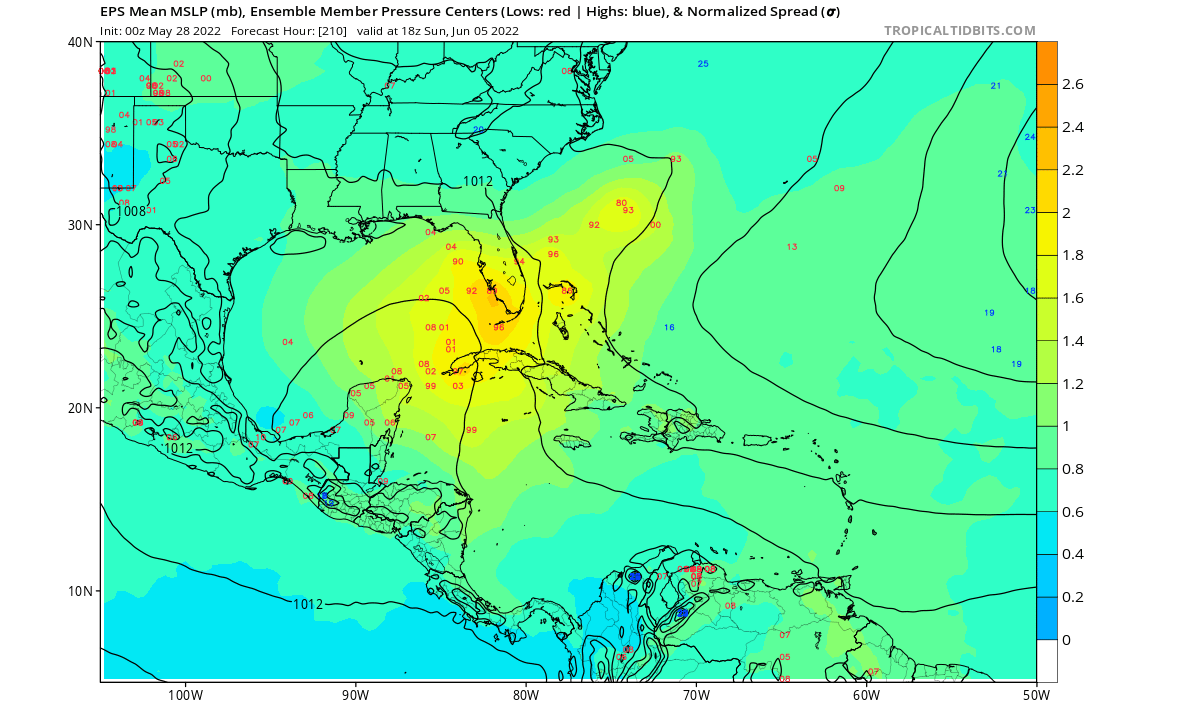
Going at the actual forecast, we see the ECMWF ensemble indicating a low-pressure system to develop. The forecast indicates a system could form in the Gulf of Mexico, moving towards Florida.
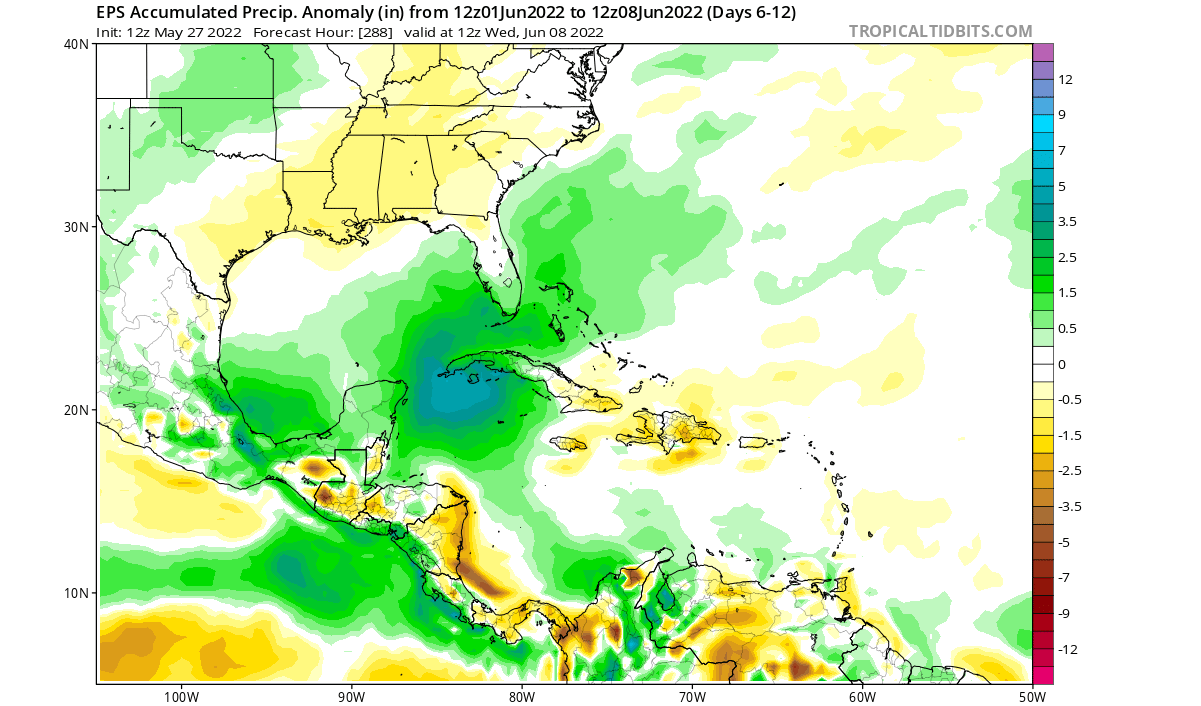
The precipitation anomaly forecast shows the increased rainfall, indicating that some low-pressure system is likely to develop.
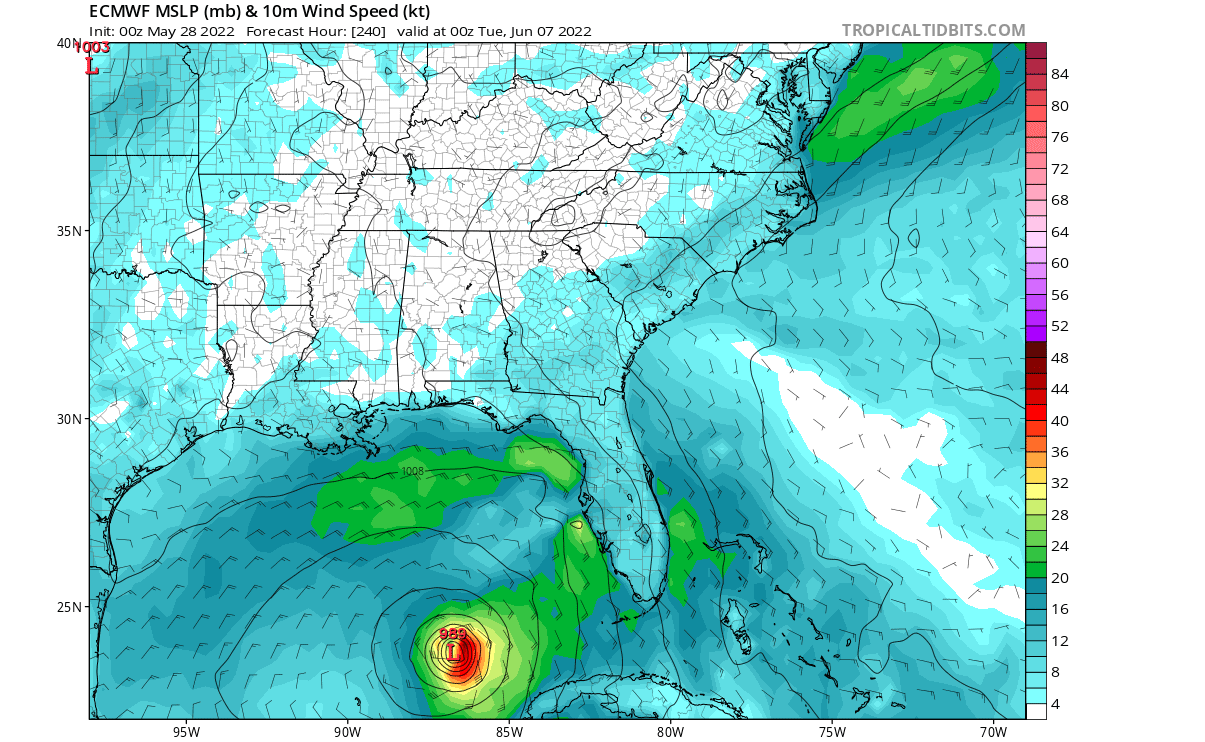
The operational ECMWF forecast shows a tropical storm in the Gulf of Mexico, tracking towards Florida in the first week of June. But these forecasts can change fast with each new run, so we will closely monitor the situation.
The overall synoptic conditions are supportive of the early development of tropical systems. But if such a strong MJO wave appeared in the middle or late Hurricane Season, it could provide additional support for significant hurricane development.
There is already an area watch issued by the National Hurricane Center, set at a 20% development chance in the next five days. This shows the legit potential of the first tropical system developing in the 2022 Hurricane Season.

We will release regular weekly and monthly updates as fresh forecasts and data are available. So make sure to bookmark our page. Also, if you have seen this article in the Google App (Discover) feed, click the like button (♥) there to see more of our forecasts and our latest articles on weather and nature in general.
SEE ALSO: