Arctic sea ice extent 2021 at the end of December is the highest in recent years and the 2nd highest in 18 years according to the US Snow and Ice Data Center. A cool summer and autumn, particularly in the western Arctic Ocean, led to a rapid increase in sea ice this year. A marked negative anomaly affected the Hudson Bay still almost entirely free at the end of November. Although delayed by more than a month it finally froze in the last 2 weeks.
ARCTIC SEA ICE AT THE END OF 2021
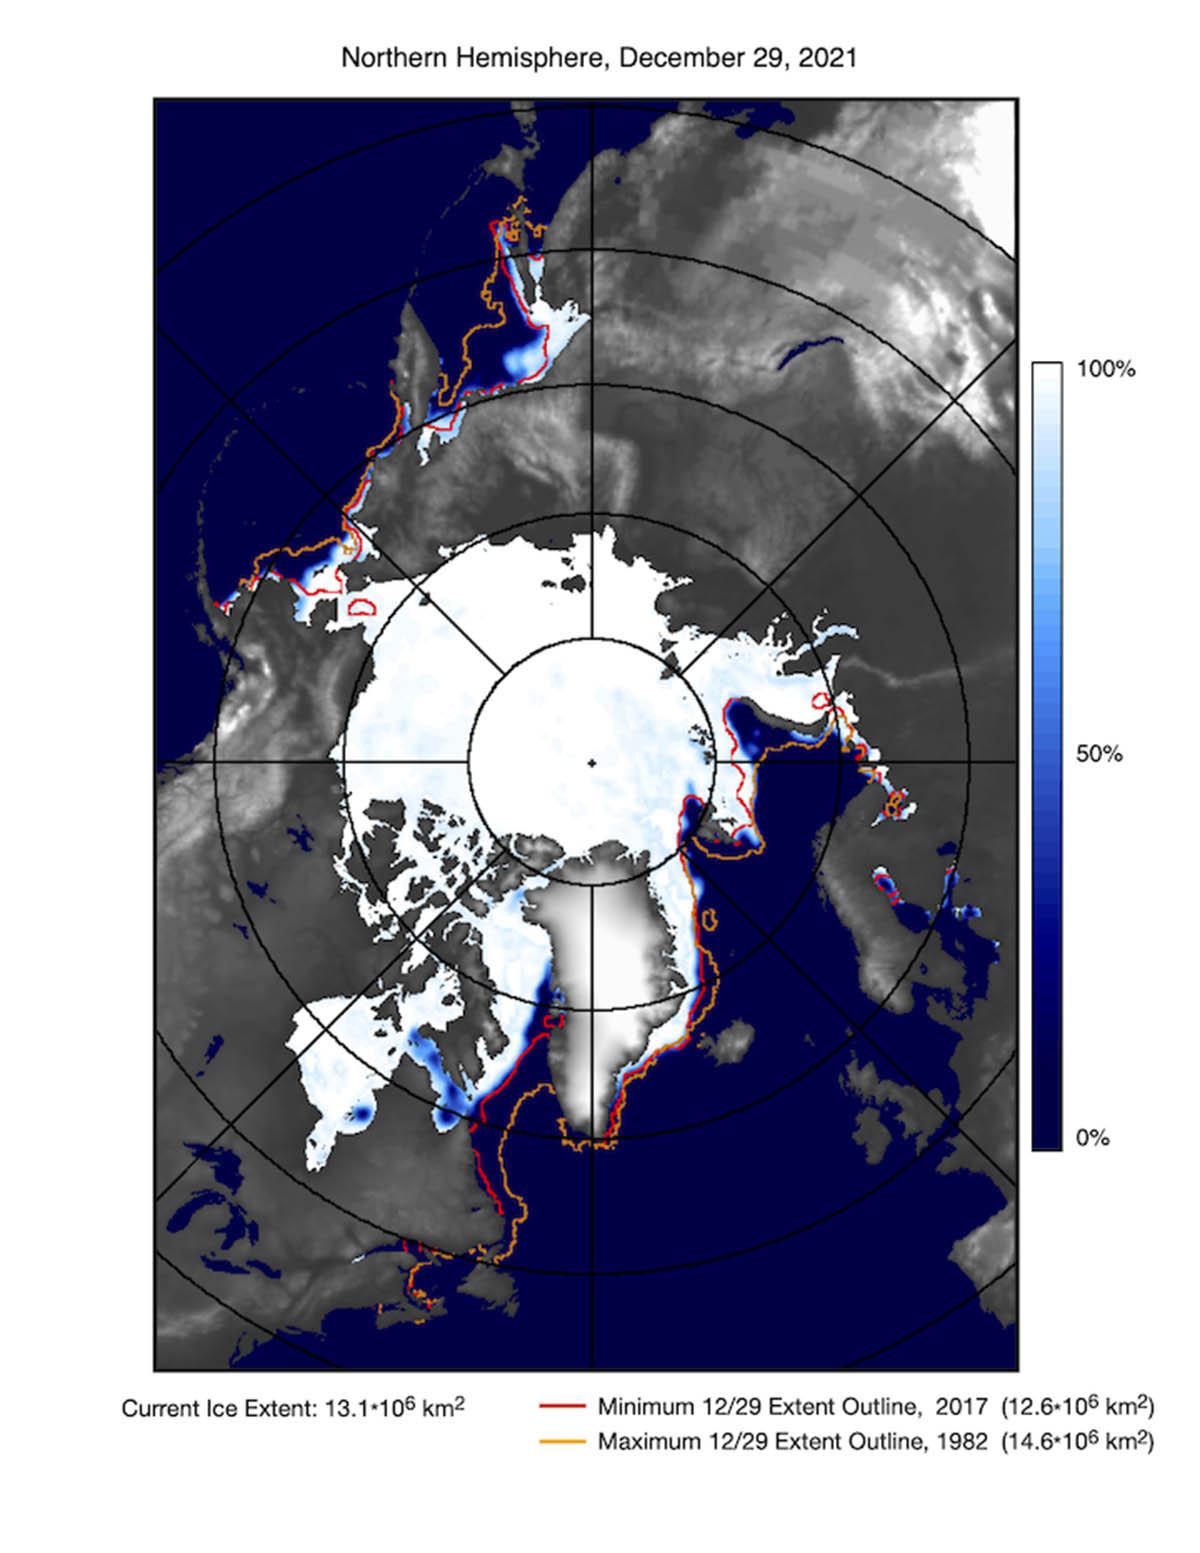
The Arctic sea ice extent actually grew faster than in the latest years. By the end of December, its extent is 12.95 million square kilometers (5.00 million square miles) which is just within the interdecile range according to the National Snow & Ice Data Center of Boulder, Colorado (US).
The interdecile range is a measure of statistical dispersion of the values in a set of data. This means although below average, it is actually within the normal sea-ice inter-annual variability. Sea ice extent is actually much higher than average in the Greenland Sea and in the Sea of Okhotsk.
Cargo ships transiting through the Northern Sea Route were caught by surprise in November. Several of them became frozen in, and waited weeks for icebreakers to free them. It has been an Arctic odyssey for a number of ships and crews got stuck in sea-ice on the remote Northern Sea Route.
After a month of icy captivity and subsequent icebreaker rescue, eventually, a convoy of nine made it to safety in the Kara Sea. A Russian nuclear icebreaker on the 7th of December completed the escort of ships that started in the far eastern Arctic, almost six thousand kilometers away.
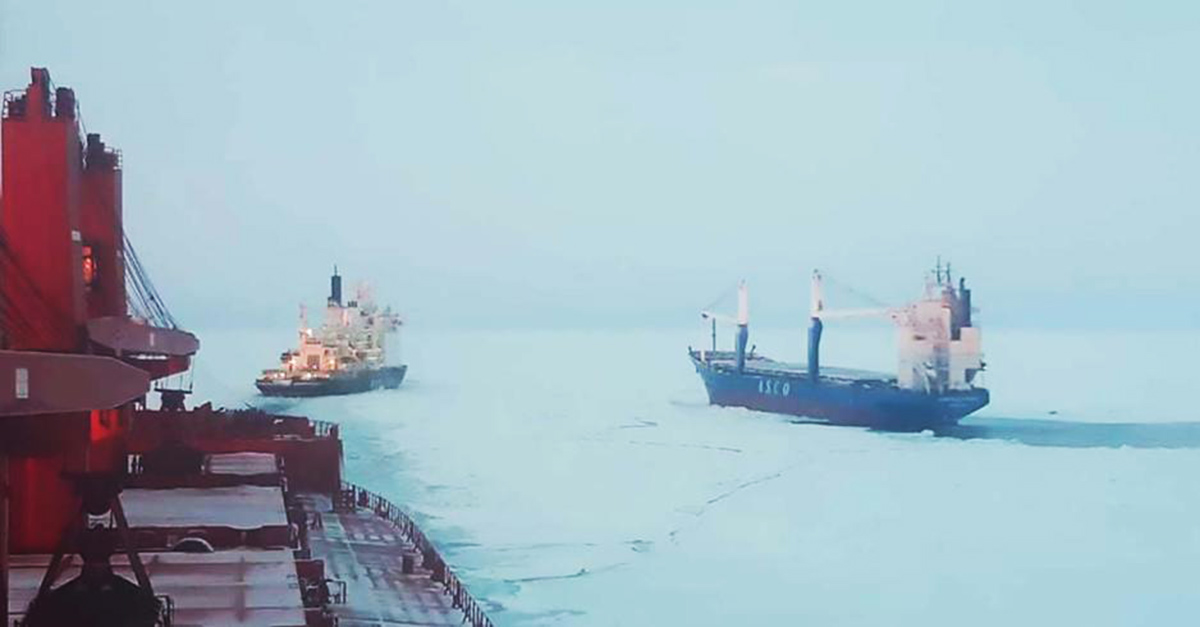
Photo courtesy of ESL shipping
Sea Ice grew fast up to 30 cm thick across most of the Laptev Sea and East Siberian seas, according to the Barents Sea Observer. The waters along the eastern parts of the sea route were ice-covered already in late October, which is several weeks earlier than normal.
By the end of November, the sea ice extent was already 9.77 million square kilometers (3.77 million square miles). Then, sea ice grew by about 3.20 million square kilometers (1.24 million square miles) in the last 30 days. Sea ice grew fast particularly in the Greenland Sea, in the Sea of Okhotsk, and in the Hudson Bay. Sea ice was extraordinarily low in November in the Hudson Bay, which remained unusually ice-free through November.
In the video below the sea ice extent in the Arctic is updated every 5 days from the 29th of November to the 29th of December.
SEA ICE
Sea ice means all sorts of ice that form when seawater freezes. Sea ice that is not fast ice is referred to as drift ice, and, if the concentration exceeds 70%, it is called pack ice. When sea ice concentration is lower than 15% this is open water, and the boundary between open water and ice is called the ice edge.
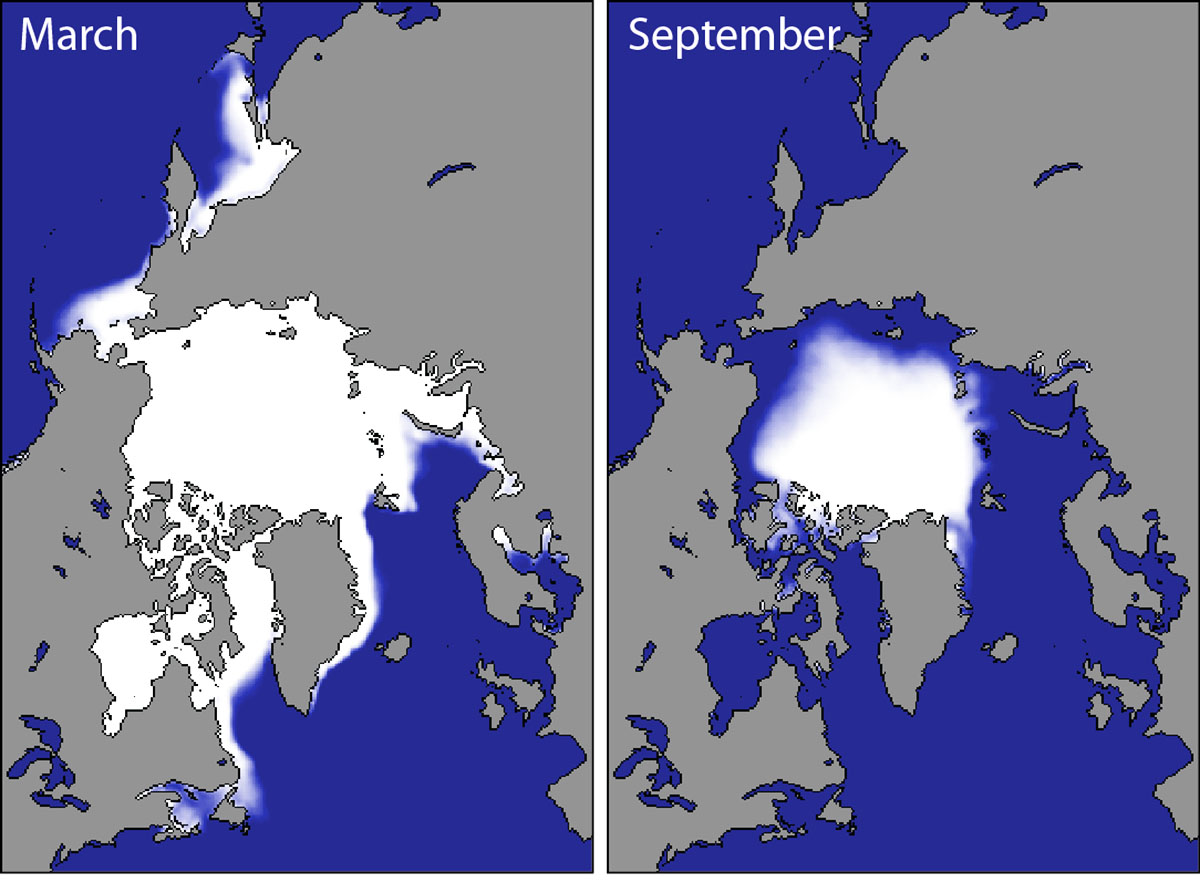
Sea ice cover in the Arctic grows throughout the winter and peaks in March. In September the sea ice extension reaches its minimum, which is generally only around one-third of its winter maximum. In order to get a proper picture of the sea ice state, there is the need of determining both extents and volumes. Such numbers primarily include the ice thickness, generally linked to the age of the ice.
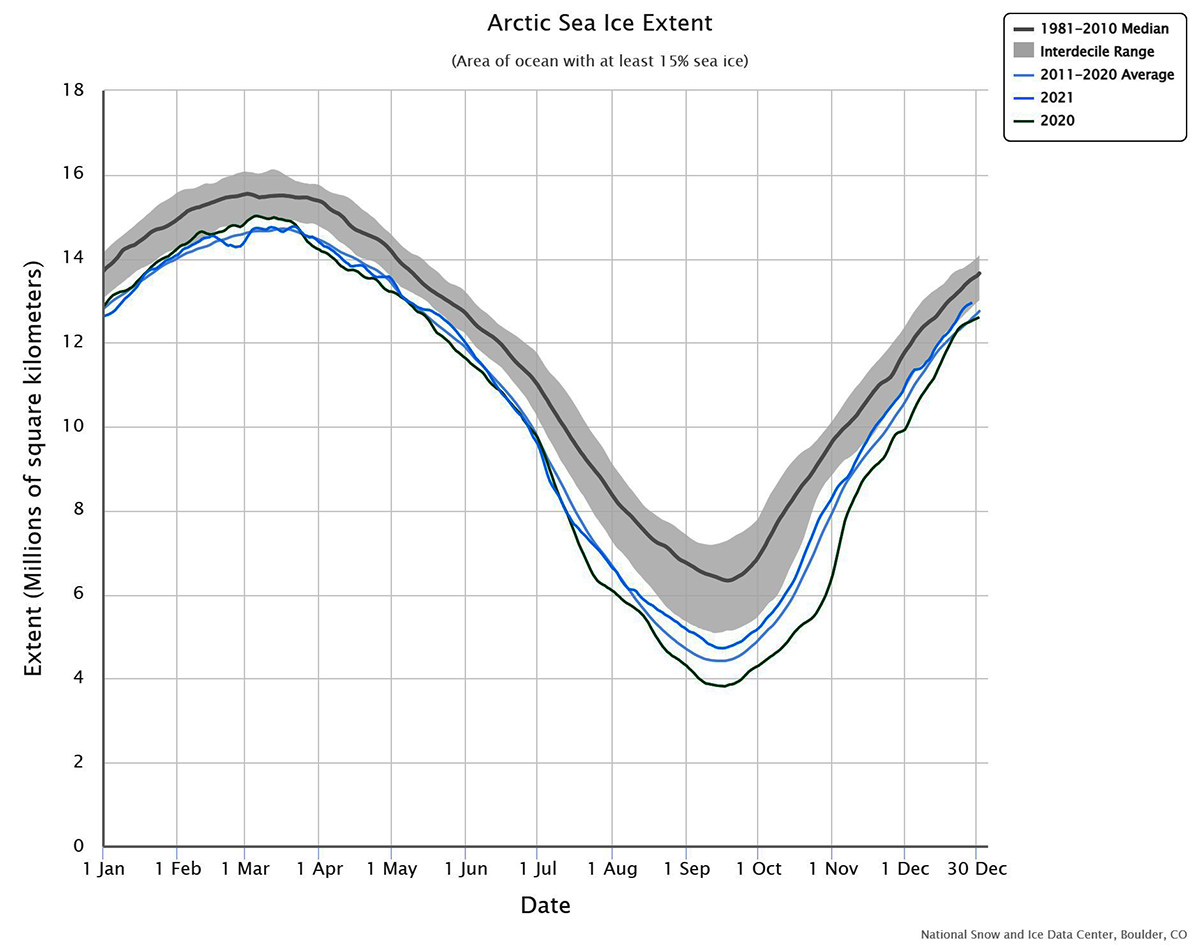
In the image below, Arctic sea ice climatology from 1981-2010 by the Snow and Ice Data Center, University of Colorado, Boulder.
As you can see from the image below, the 2021 blue line kept reducing the negative anomaly from the 1981-2010 median through the month of December. Sea ice extent in 2021 remained above the 2011-2020 average since August. The present 12.953 square kilometers means the sea ice extent this year is the highest of the last 7 years.
Sea ice extent on December 29 is roughly 0.399 million square kilometers higher than in 2020, corresponding to a 3% difference. At the same time, the 2021 sea ice extent is 0.603 million square kilometers lower than the 1981-2010 average, corresponding to a 4.4% negative anomaly.
The present situation is mainly caused by the rapidly growing Sea Ice in the western Arctic sectors, namely the Bering Sea, the Chukchi Sea, and the East Siberian Sea in November.
HUDSON BAY AND REGIONAL DIFFERENCES
Other sectors were well below average in November as the Greenland Sea, the Barents Sea, and the Hudson Bay. Particularly, sea ice was extraordinarily low in the Hudson Bay, which remained unusually ice-free through November. Generally, Hudson Bay starts freezing up by early November, and the northern part of the basin is typically entirely iced over by the end of the month.
Only the far north of the Hudson Bay froze over at the end of November 2021. The NSIDC reported that this was the second-lowest sea ice extent in Hudson Bay at this time of the year, above only 2010.
Nevertheless, through December the Greenland Sea, the Sea of Okhotsk, and the Hudson Bay faced an unusually fast increase in Sea Ice extent. The map below reports the Hudson Bay sea ice extent on November 30th (left) and December 29th (right) thanks to the Multisensor Analyzed Sea Ice extent products of the NSIDC.

Sea Ice Extent in the Hudson Bay grew slowly and quite regularly in the first 10 days of December, increasing from 0.3 million square kilometers to 0.75 million square kilometers on the 12th of December. It stayed stable until December 18th, then abruptly increased by about 0.4 million square kilometers in just 5 days.
On December 22nd Sea Ice extent was about 1.15 million square kilometers and is now slowly approaching the complete freezing of the total 1.25 million square kilometers bay. In the image below the 2021 green line of Sea Ice Growth in the Hudson Bay is well below the trend of the most recent years.

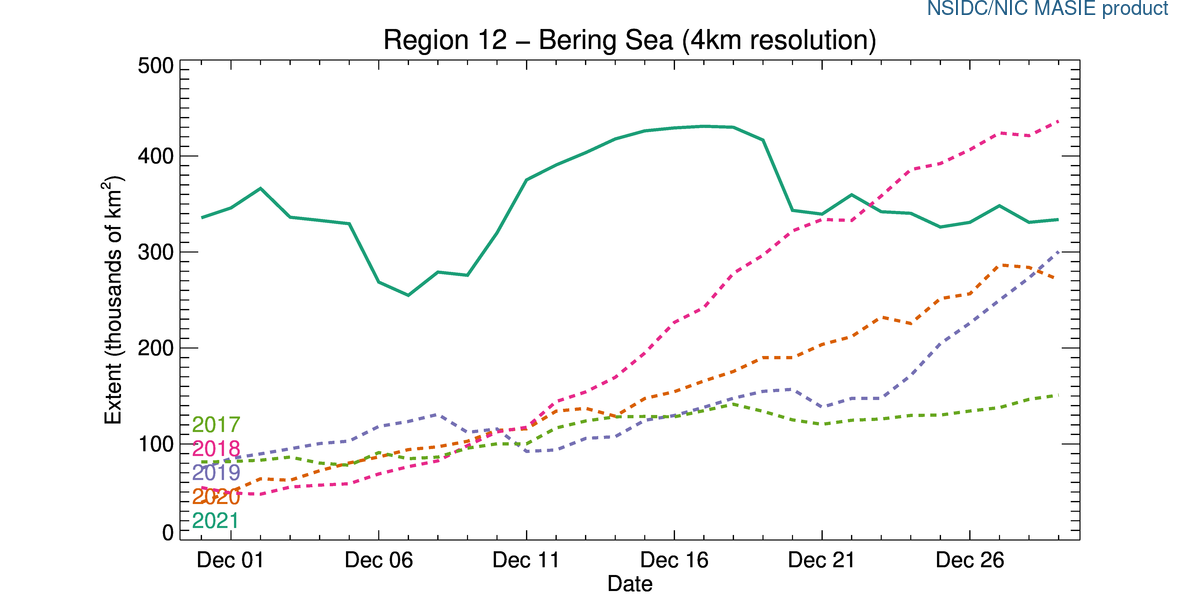
Sea Ice Extent in the Bering Sea, after the unusually rapid growth observed through November, stabilized remaining well above the long-term average. After reaching a peak in the area at about 440 thousand square kilometers in mid-December, dropped down to about 350 thousand square kilometers.
In the image below the 2021 green line of Sea Ice growth in the Bering Sea is rather different from the usual trend observed in the very last years. Nevertheless, there is a decent positive anomaly when comparing the present extent with the one in 2017, 2019 and 2020
In the Sea of Okhotsk, the Sea Ice extent grew with the typical trend observed in the most recent years. The ice growth was rather constant, apparently accelerating in the second part of the month. The present extent is around 400 thousand square kilometers, which is in line with what has been observed in the very last years.
In the image below the 2021 green line of Sea Ice growth in the Sea of Okhotsk is in line with the usual trend observed in the very last years.

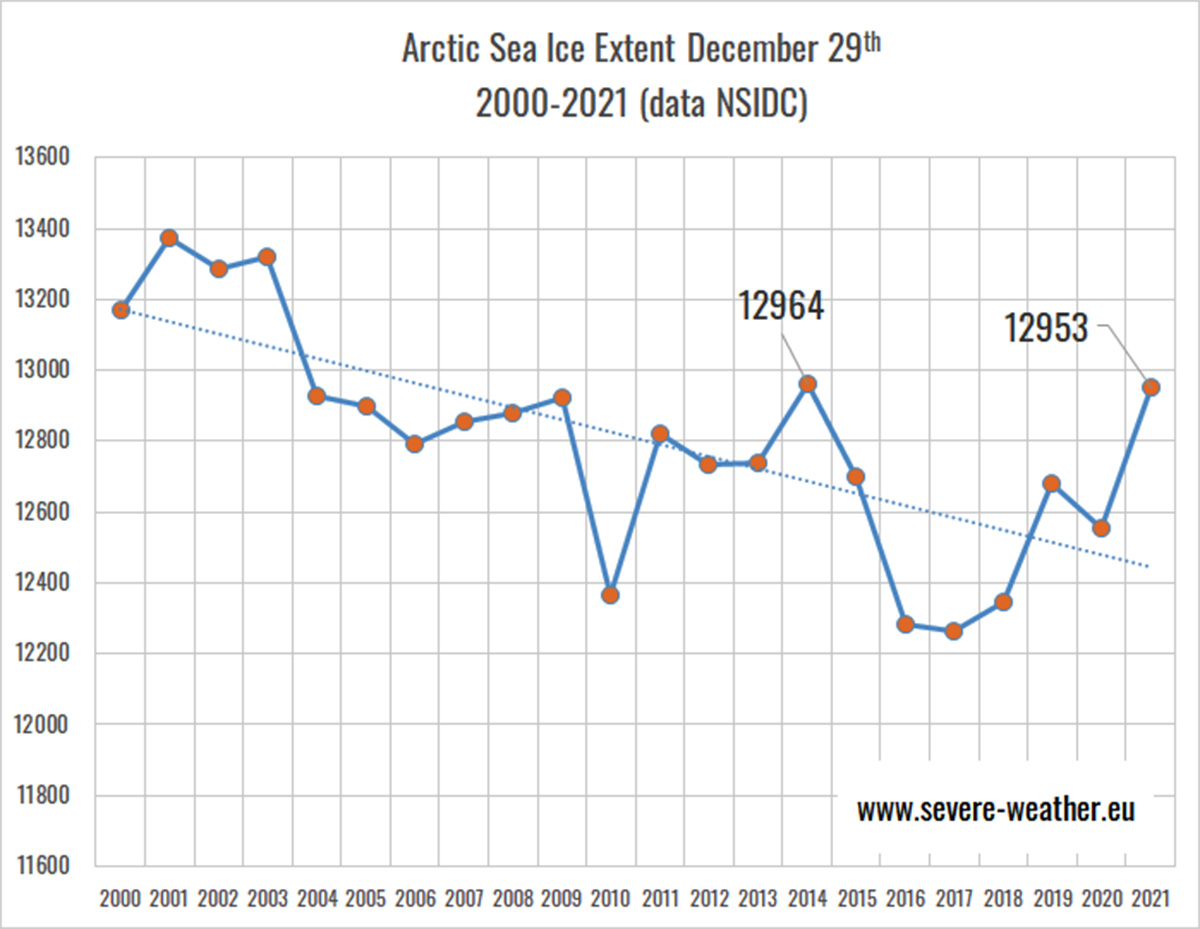
Sea ice extent on December 29 is the highest since 2014 according to the NSIDC when it was 12964 million square kilometers on the same date. The extent at the end of December was close to the 2021’s values from 2004 to 2014, except 2010 when it was much lower. Then, it abruptly dropped down to less than 12300 million square kilometers in 2016.
Since 2017, we observe a short 4-year-long increasing trend which led to the Sea Ice Extent measured this year. Nevertheless, the 20-years-long trend is clearly negative as well highlighted in the image we prepared below by accessing data of the National Snow and Ice Data Center, Boulder, Colorado (US).
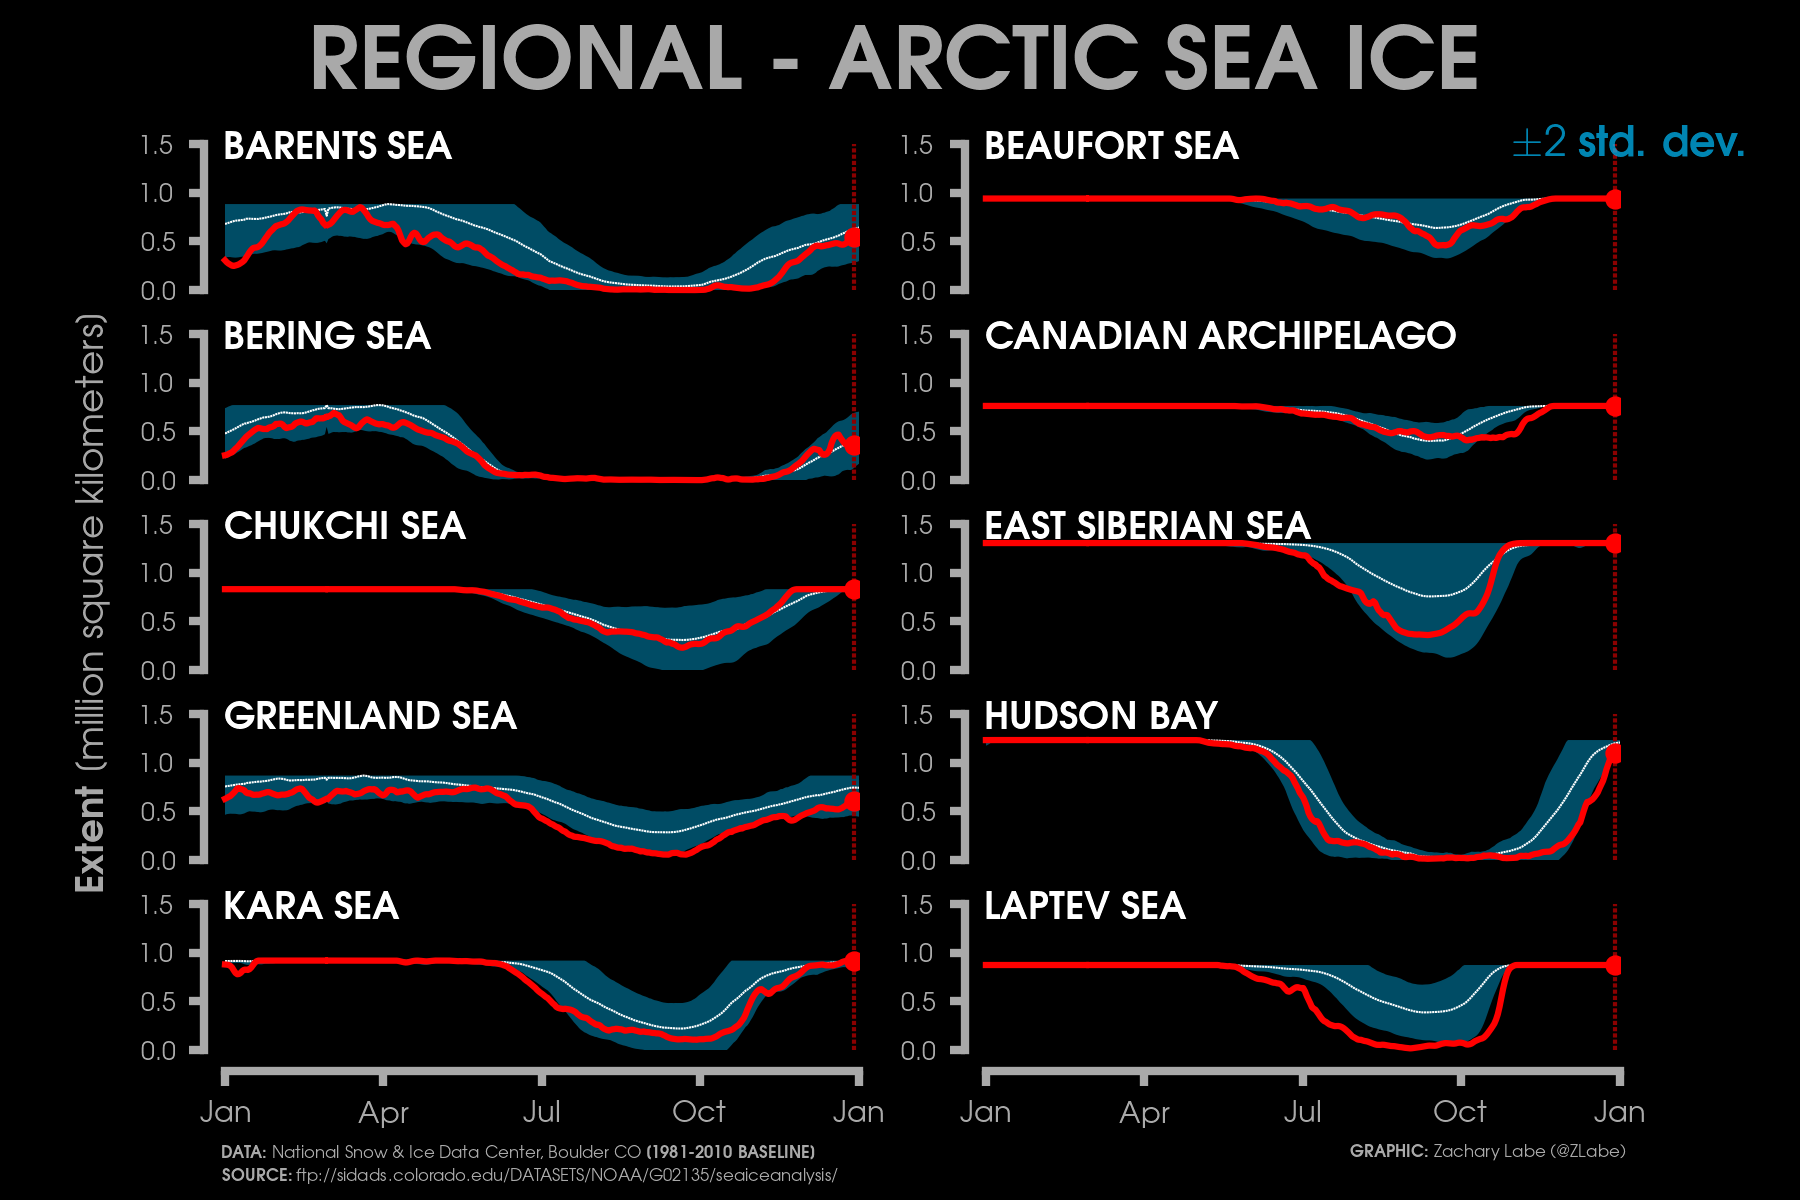
In the image below from Zachary Labe, you can see the current regional Arctic sea ice extents (NSIDC Sea Ice Index v3: DMSP SSM/I-SSMIS F-18) in addition to 2 standard deviations from 1981-2010 mean. From this picture, we can clearly see how the Bering Sea and the Chucky Sea froze much earlier than usual this year.
On the other hand, the Greenland Sea, the Laptev Sea, the Beaufort Sea, the Canadian Archipelago, and the Hudson Bay froze late. At the same time, the Kara Sea and the East Siberian Sea were characterized by a rapid increase through November and December.
Looking more in detail to the current Arctic Sea Ice anomalies, we use the image below realized by Zachary Labe. The plot is calculated using a 5-day running mean from a climatological baseline of 1981-2010. The year 2020 is highlighted with a yellow line. The year 2021 is the red line (updated 12/27/2021).
It is clearly evident from this plot that Arctic Sea Ice is facing a positive phase leading to a reduction of the negative anomaly in the last 5 months. After a rapid melting occurred from late May to early July, the anomaly reduced through August, eventually raising again in September and early October.

This year, sea ice has reached its minimum extent on September 16th but it was far from the lowest on record and was actually just the 12th lowest in the past decades. The main reason for that was the colder than average weather in the western Arctic Ocean which slowed down sea ice from melting in the Canadian and Alaskan regions.
Although higher, the 2021 minimum sea ice extent was around 4.724 million square kilometers, roughly 1.6 million square kilometers lower than the long-term mean. A northern hemisphere’s strong negative height anomaly in the geopotential in late summer kept the western Arctic cooler and reduced the ice from melting.
Not only air temperature, but sea temperature as well were colder than normal in the western Arctic sector last summer. This was certainly a favorable trigger contributing to fast and earlier freezing in this Arctic sector when the fall season started.

The extent of sea ice in the Arctic has important implications for global climate and weather, both in North America and Europe. In particular, for example, it has recently been seen that decreasing sea ice in the Arctic has a strong impact on precipitation in northern Europe.
Scientists in a dedicated paper published on the Journal Environmental Research letters state that observed wet summer months in northern Europe tend to occur when the jet stream is displaced to the south of its climatological position. In their simulation, Arctic sea ice loss induces a southward shift of the summer jet stream over Europe and increased northern European precipitation.

In the image above, summer precipitation anomalies (% from 1981 to 2010 average) averaged over northern Europe. The inset map shows the precipitation anomalies in the period 2007–2012 relative to the period 1979–2006. (b) Time-series of summer precipitation anomalies (% from 1981 to 2010 average) for England and Wales. The black curves show 5-year running means.
It will definitely be interesting to follow the evolution of sea ice extent over the coming weeks and months, particularly at a time when global warming is proceeding at a rapid pace. By now, the Arctic continues to increase its sea ice extent at a steady pace, and if this trend continues in the coming months, there may be important repercussions for next spring’s synoptic and meteorological conditions.
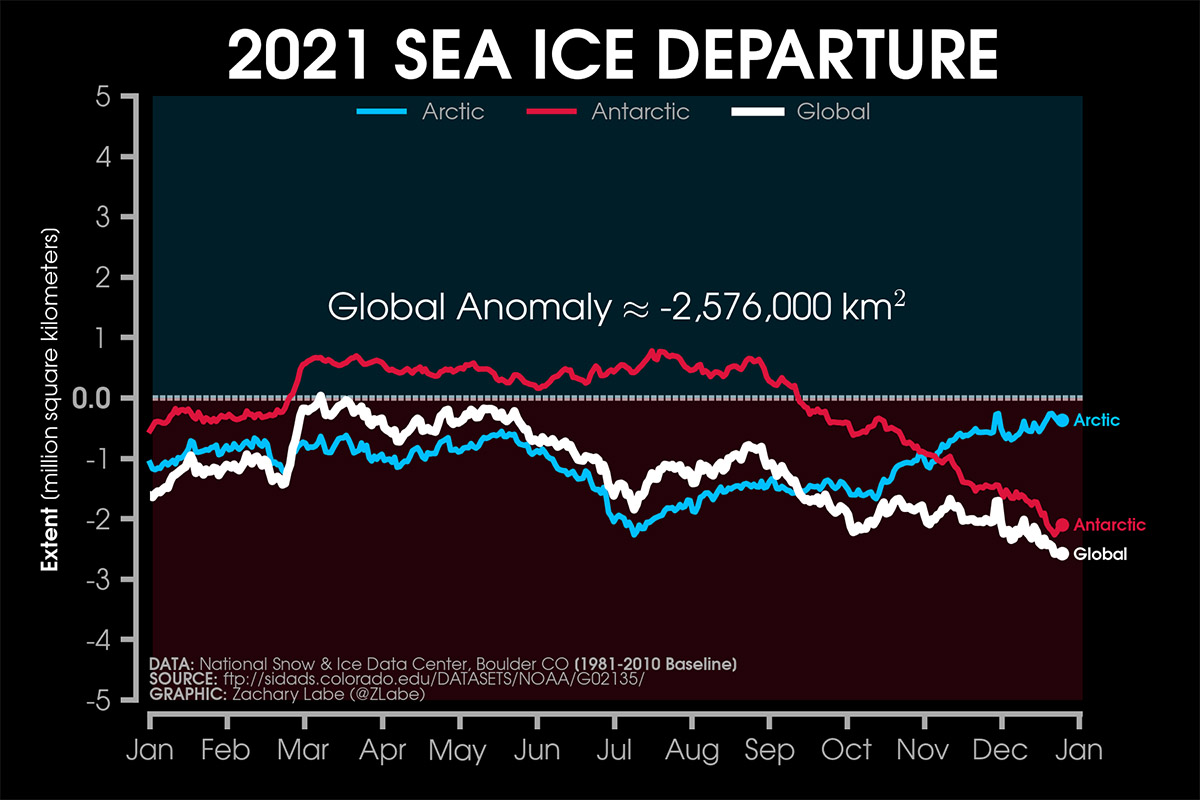
The Sea Ice Extent in the Arctic this year is in contrast with what is happening globally, and in particular because the Antarctic sea ice is in sharp decline. Although stable above the long-term average from March to the end of August, Antarctic Sea Ice started its rapid decline in September. At present the anomaly is equal to about 2 million square kilometers.
Both the Arctic and Antarctic Sea Ice extent push the global anomaly around 2.5 million square kilometers. In the image above source NOAA, data NSIDC (1981-2010 baseline) and graphic Zachary Labe, the opposite trend between Arctic and Antarctica are clearly evident.
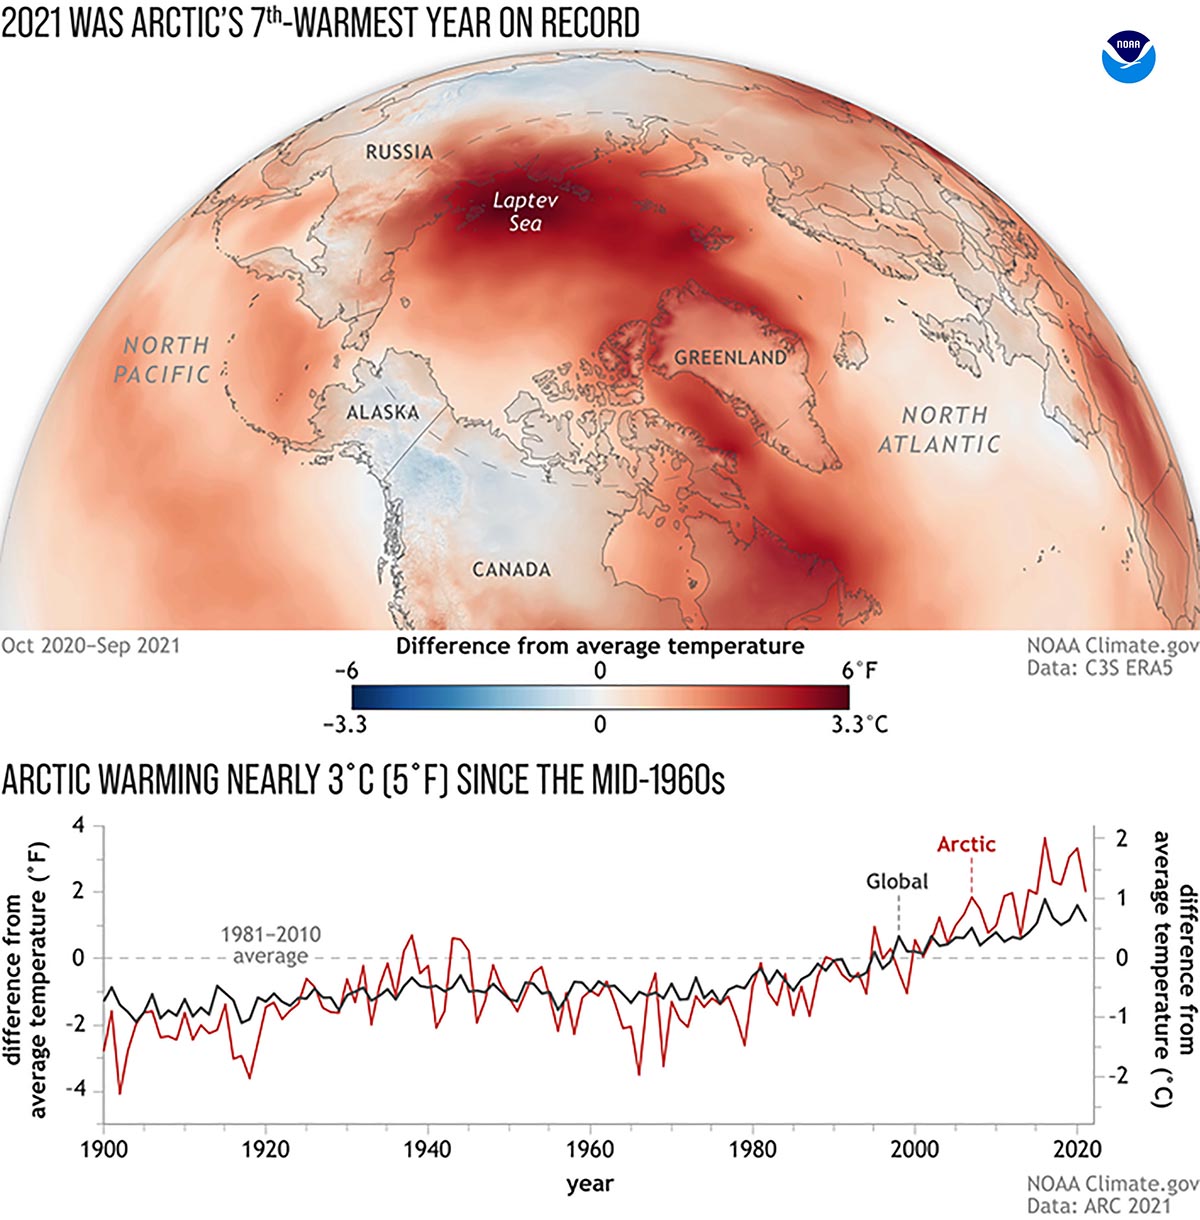
Although Sea Ice Extent is not as bad as in recent years, the year 2020 in the Arctic saw the 7th warmest air temperature in the instrumental record. The image above depicts the departure from the average temperature across the Arctic in 2021. Redder colors are showing areas of greater warmth. The bottom half of this graphic shows how Arctic air temperatures varied from global temperatures since 1900. (Climate.gov)
We can see the extremely high anomaly recorded in the Laptev Sea north of Siberia, as well as the moderate to strong anomaly observed around Greenland. The positive temperature anomaly includes the Last Ice Area north of Greenland and Ellesmere.
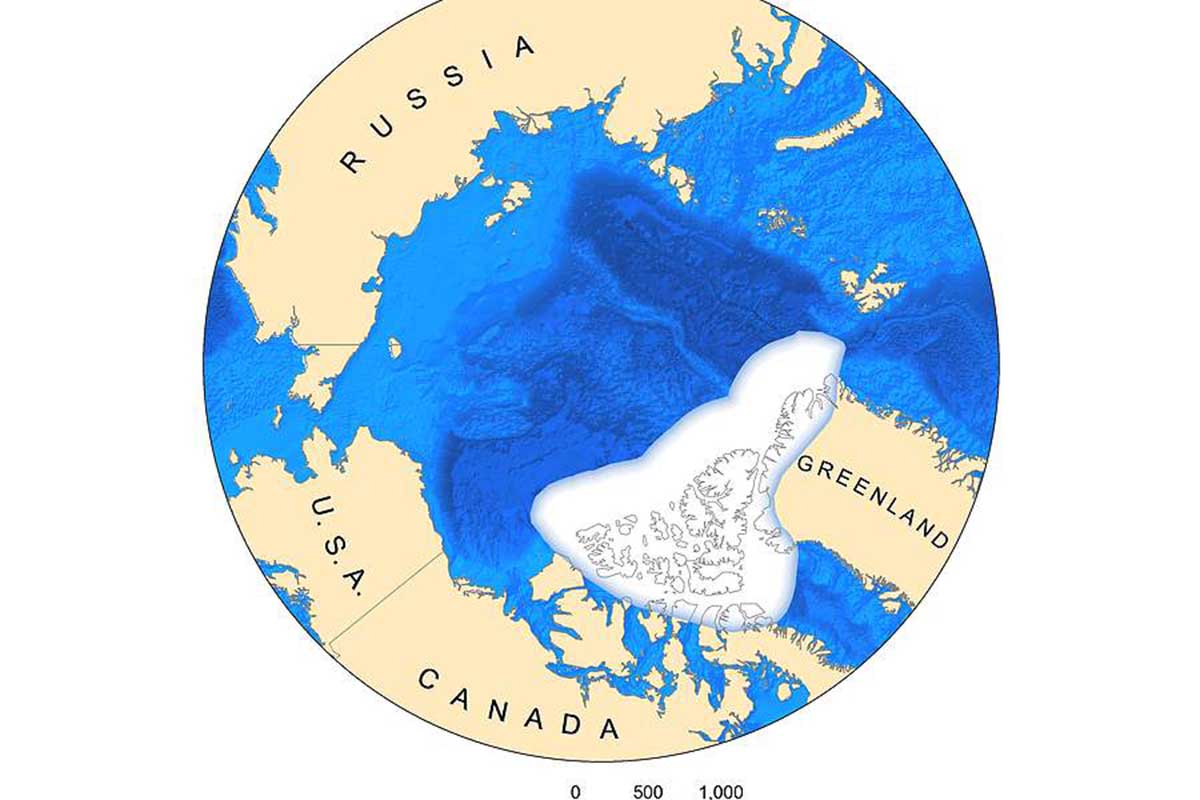
This is the only sector of the Arctic where old and thick ice can be still found, in the Canadian territory of Nunavut. Basically, the area refers to the predicted summer sea-ice extent projected to the year 2040 and beyond.
Climate projections forecast the total disappearance of summer sea ice in the Arctic by 2040, with the exception of the Last Ice Area. The Last Ice Area might represent the last refuge for ice-dependent species as the world warms.
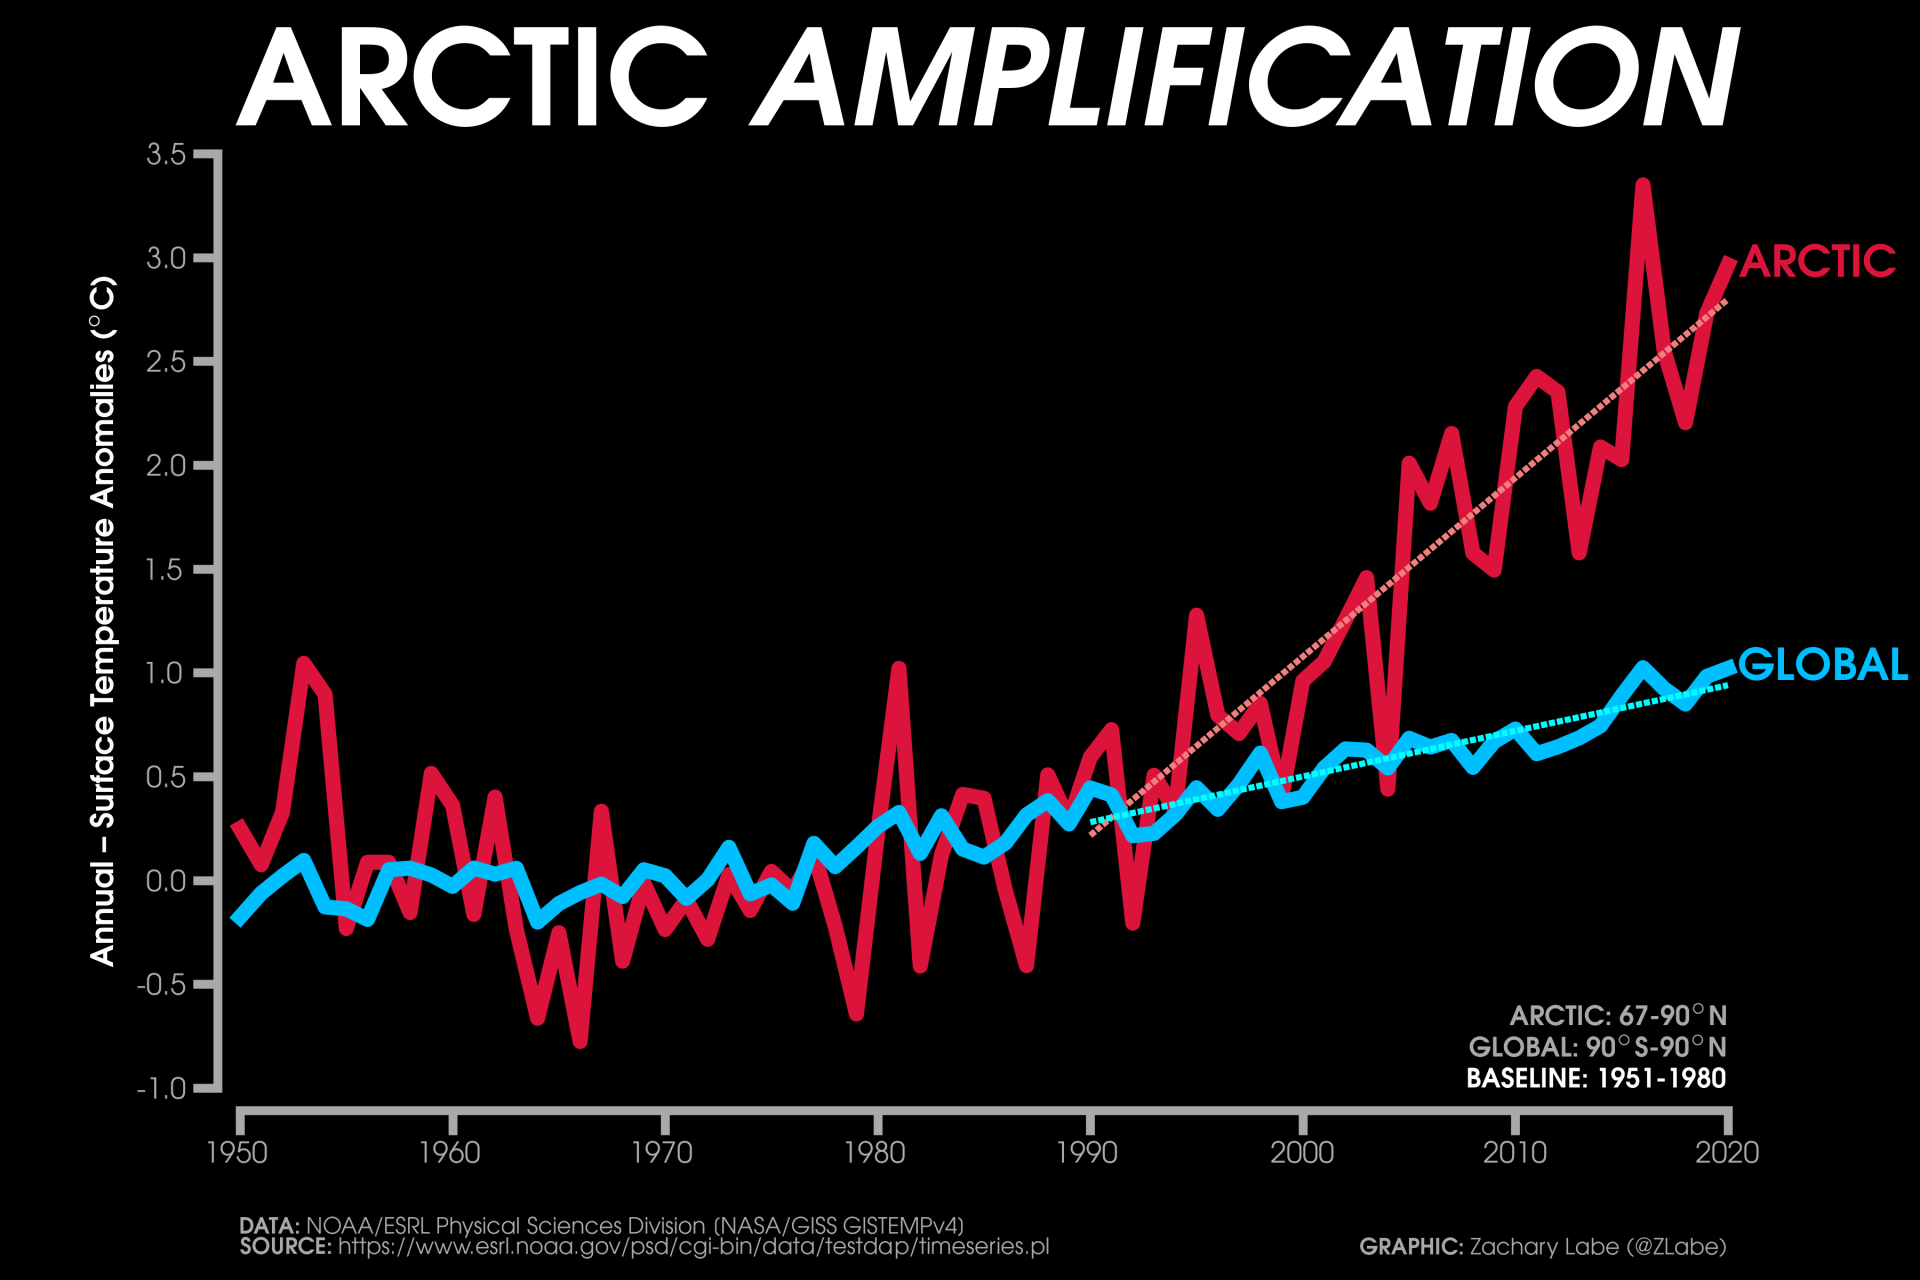
But why the Arctic is warming at an accelerated pace? This is mainly due to the so-called Arctic Amplification.
Arctic Amplification refers to the enhancement of near-surface air temperature change over the Arctic relative to lower latitudes. These mechanisms include both local feedbacks and changes in poleward energy transport. Temperature and sea ice-related feedbacks are especially important for Arctic Amplification since they are significantly more positive over the Arctic than at lower latitudes.
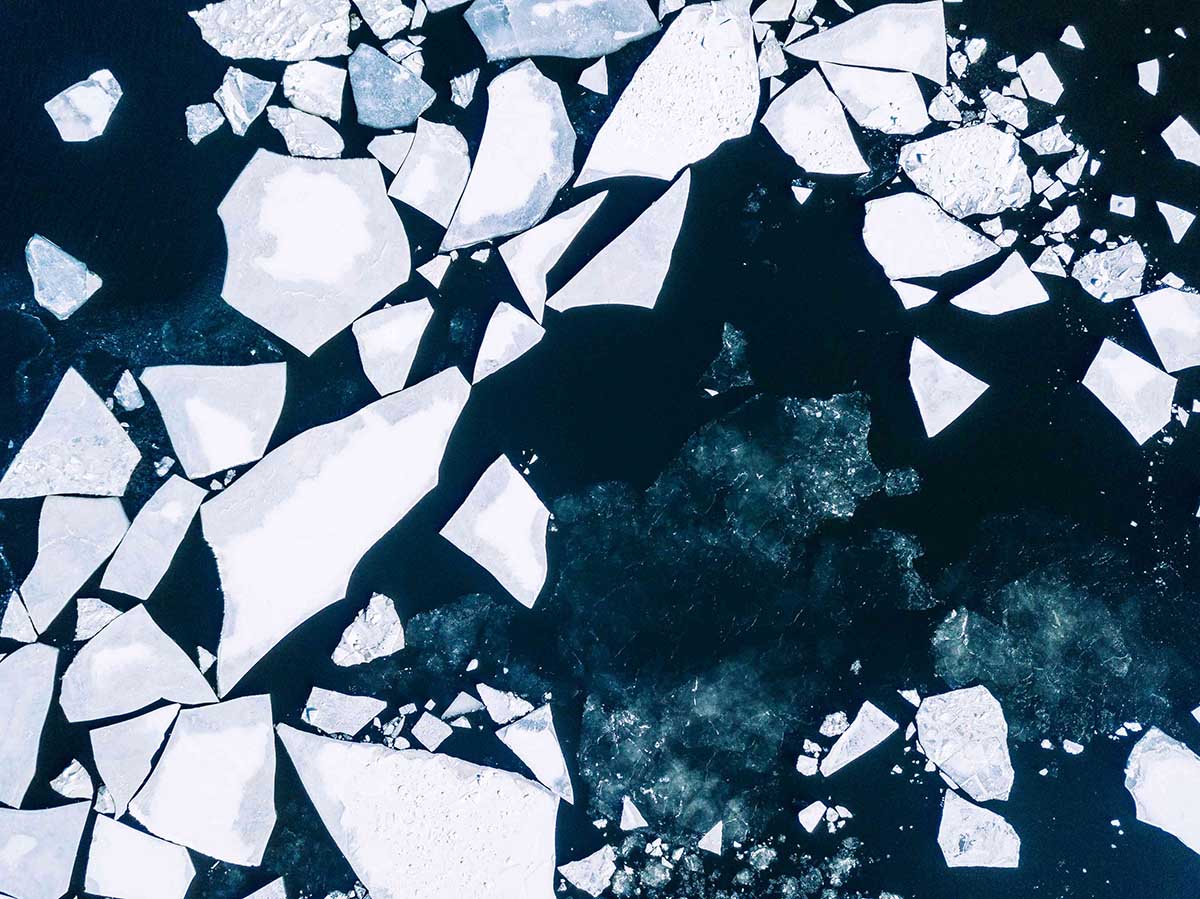
Wintery top-down aerial view of cracked ice on Baltic Sea around Helsinki. Miemo Penttinen – miemo.net / Getty Images
Changes in albedo from a frozen light sea surface to a free-of-ice and darker sea surface allow positive feedback affecting mean and extreme temperatures in the Arctic.
In the Image above, annual mean surface air temperature anomalies for the Arctic (67-90°N) and for the Global average (90°S-90°N) from 1950 to 2020. Linear trend lines (dashed) are also shown over the 1990 to 2020 period. GISS Surface Temperature Analysis (GISTEMPv4) is available from 1880 to 2020 at data GISS NASA.
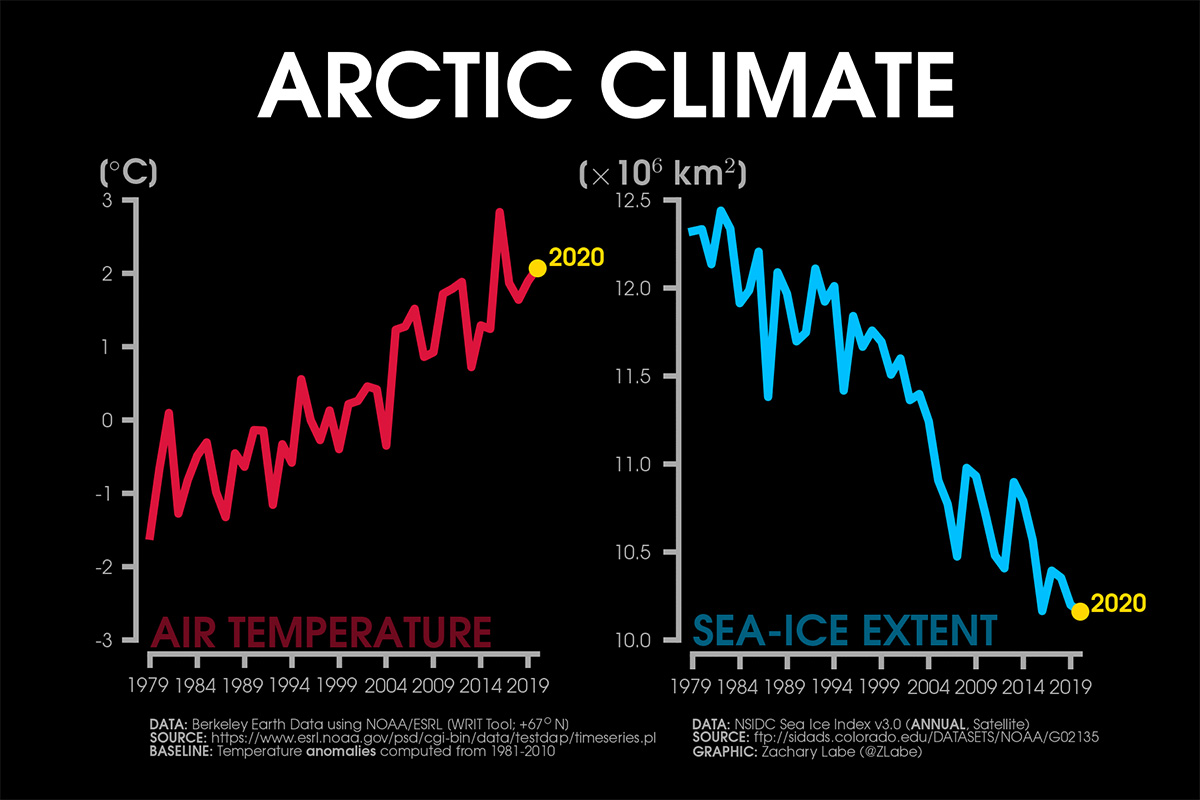
In the image above instead, changes in annual mean Arctic sea ice extent (NSIDC, Sea Ice Index v3) and air temperature anomalies (Berkeley Earth Surface Temperature; BEST) over the satellite era. The temperature rise is mostly influenced by the Arctic sea ice reduction, and not the other way around as one might think.
We will keep you updated on this and much more, so make sure to bookmark our page. Also, if you have seen this article in the Google App (Discover) feed or social media, click the like button (♥) to see more of our forecasts and our latest articles on weather and nature in general.
SEE ALSO: