As a fundamental force in weather systems, wind has captivated human attention for millennia. At its core, wind is simply air in motion, generated by the uneven heating of the Earth’s surface. Understanding wind speed and direction is crucial for various applications—navigation, aviation, weather forecasting, or renewable energy.
The Physics Behind the Wind
Wind is the movement of air molecules from areas of high pressure to low pressure, driven by the Earth’s rotation (Coriolis effect) and variations in temperature and pressure across the globe. Complex fluid dynamics equations, such as the Navier-Stokes equations, describe this air movement.
In weather systems, various factors like thermal gradients, geographical obstructions, and atmospheric pressure differences contribute to wind speed and direction. Accurate measurement techniques hold significant implications for understanding local weather patterns and global climate systems and even for predicting natural disasters like hurricanes.

From flags fluttering atop castles to ultrasonic sensors on modern weather stations, the quest for understanding the wind is a fascinating journey through time and technology. As our understanding of the physics behind wind evolves, so does our capacity to measure it—shaping our interaction with the world around us.
Cyclones and Anticyclones: Wind Patterns in the Northern and Southern Hemispheres
Cyclones and anticyclones are fundamental components of atmospheric circulation that play a pivotal role in shaping weather patterns across the globe.
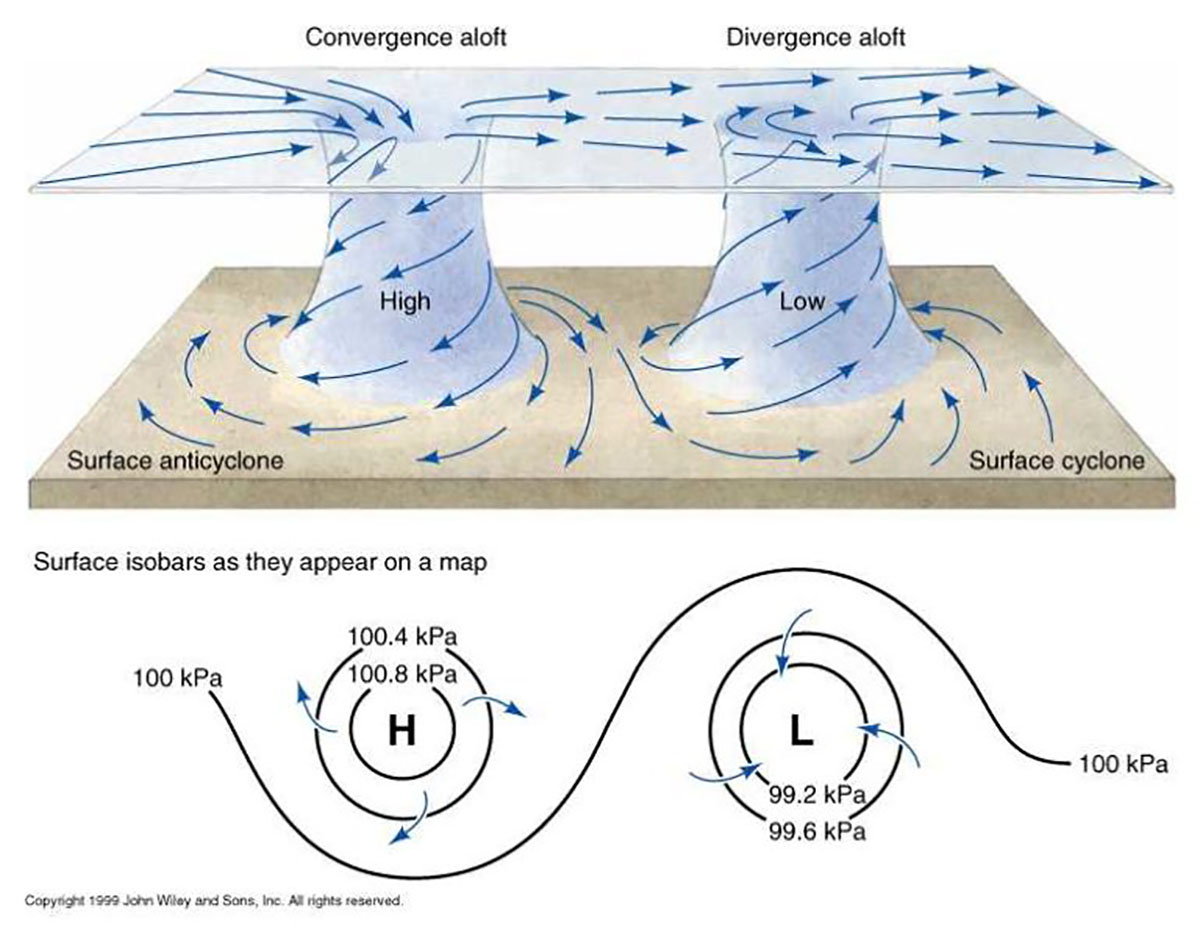
In the Northern Hemisphere, cyclones, often called low-pressure systems, exhibit counterclockwise wind circulation. Winds converge toward the low-pressure center, where rising warm air fuels cloud formation and precipitation. This counterclockwise rotation results from the Coriolis effect, which deflects moving air masses to the right due to the Earth’s rotation.
Conversely, in the Southern Hemisphere, cyclones feature clockwise wind circulation due to the same Coriolis effect. Cyclones are often associated with stormy weather, heavy rainfall, and the potential for severe weather events such as hurricanes and typhoons, depending on the region. Anticyclones, or high-pressure systems, exhibit outward-spiraling winds. In the Northern Hemisphere, these winds rotate clockwise, while in the Southern Hemisphere, they rotate counterclockwise.
Anticyclones typically bring stable and fair weather conditions. As the air descends from the upper atmosphere towards the surface in high-pressure systems, it warms, resulting in clear skies and reduced cloud cover. These systems are often associated with calm winds and pleasant weather, making them favorable for outdoor activities and clear skies.
The opposite wind patterns of cyclones and anticyclones in the Northern and Southern Hemispheres are a direct consequence of the Coriolis effect.
The Coriolis effect occurs because different points on the Earth’s surface rotate at different speeds. For example, the rotational speed is highest at the equator, decreasing as you move towards the poles. As a result, when objects, such as air masses or ocean currents, move across latitudes, they appear to be deflected to the right in the Northern Hemisphere and the left in the Southern Hemisphere.
Understanding these variations is crucial for meteorologists when analyzing and predicting weather systems on a regional and global scale. Cyclones and anticyclones not only influence day-to-day weather but also have a significant impact on climate patterns.
Wind Speed and Direction on Synoptic Charts
Weather synoptic charts are essential for meteorologists and weather enthusiasts, visually representing atmospheric conditions. One critical aspect depicted in these charts is wind speed, which is closely linked to the spacing and orientation of isobars—lines connecting points of equal atmospheric pressure.
When closely packed, isobars indicate a steep pressure gradient, resulting in higher wind speeds. Conversely, when isobars are widely spaced, it signifies gentler breezes.
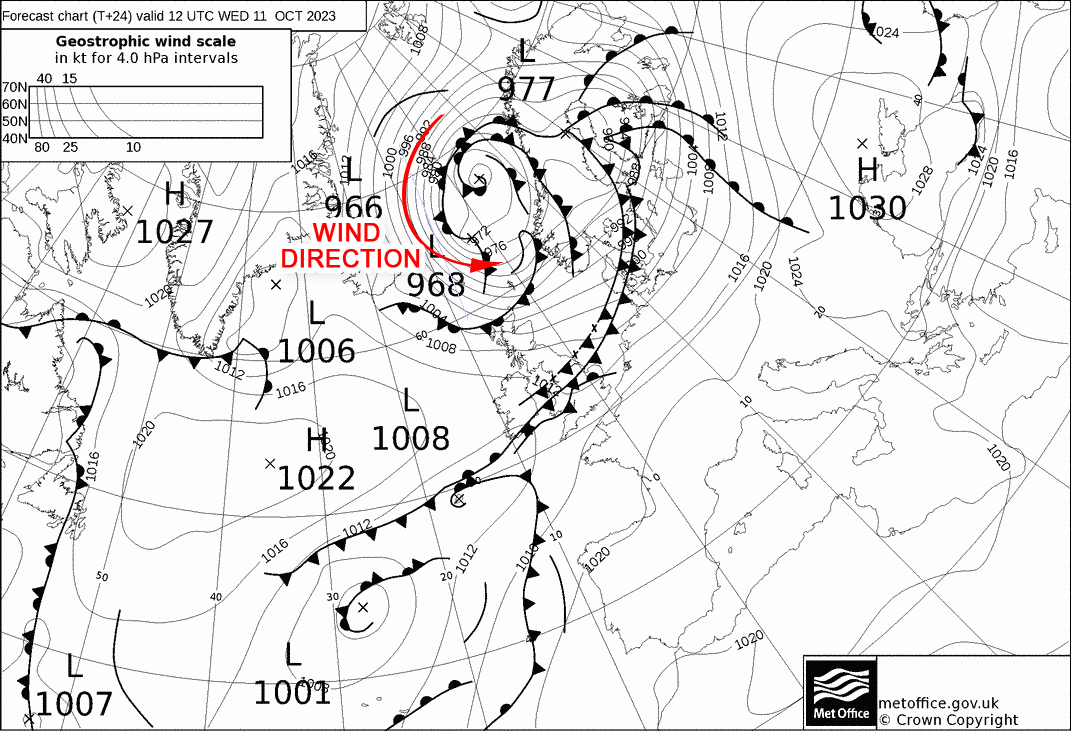
The wind direction on synoptic charts follows the shape and orientation of the isobars, flowing parallel to them from areas of high pressure to low pressure. By studying the relationship between isobars and wind patterns, meteorologists gain insights into the dynamics of the atmosphere, aiding in weather analysis and prediction. These wind-related observations on synoptic charts provide crucial information for understanding and preparing for changing weather conditions.
Beaufort, Cups, and Vanes: Pioneering Wind Measurement
Sir Francis Beaufort, a distinguished Royal Navy officer, is celebrated for his maritime exploits and invaluable contribution to wind measurement science. In the early 19th century, Beaufort recognized the need for a standardized method to assess wind speeds and their effects on sailing vessels.
His innovative solution came from the Beaufort Scale, a numerical system that allowed sailors and meteorologists to estimate wind strength based on observable phenomena. By categorizing wind conditions from calm to hurricane force, Beaufort’s invention revolutionized how wind was understood and communicated.
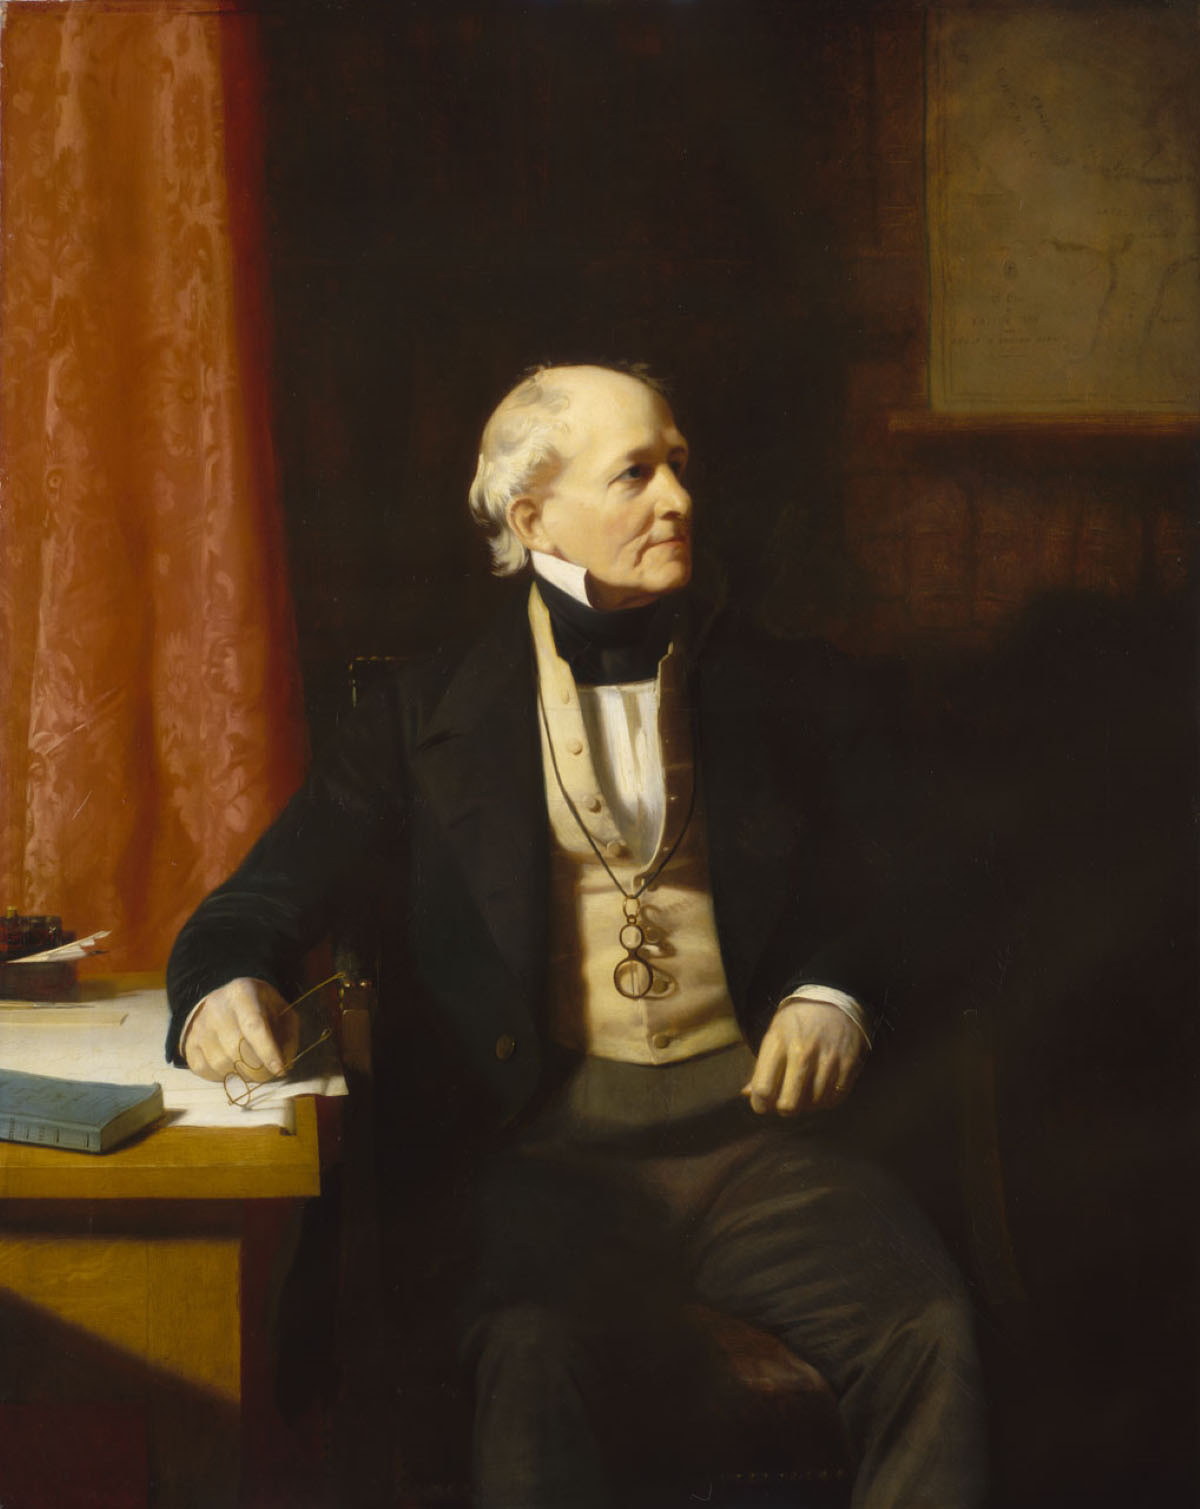
The genesis of the Beaufort Scale can be traced back to 1805 when Francis Beaufort first introduced it in his logbook while serving in the Royal Navy. Initially consisting of just seven categories, the scale described the impact of wind on sails and rigging.
Over the years, Beaufort continued to refine and expand his scale, incorporating additional categories and refining the descriptions to encompass a broader range of observations, including the effect of wind on the sea, land, and vegetation. His dedication to improving this system led to the widespread adoption of the Beaufort Scale by sailors, scientists, and meteorologists seeking a standardized method to assess wind conditions.
As our understanding of the physics of wind and weather deepened, so did our need for accurate and reliable instruments to measure and interpret these natural phenomena. The quest for precision and the desire to harness the power of the wind led to the development of innovative tools that could quantify its force and direction.
Historically, flags and windsocks were elementary yet effective devices to gauge wind direction. With the advent of maritime exploration, the Beaufort scale came into existence, providing a qualitative way to describe wind speed based on observable sea conditions.

By the late 19th century, mechanical anemometers began to emerge. The cup anemometer, designed by Dr. John Thomas Romney Robinson in 1846, became the first standard instrument for wind speed measurement. This simple device consisted of three or four cups attached to horizontal arms, then connected to a vertical rod.
As wind speed increased, the cups would rotate faster, and the rotations per minute were translated into wind speed. Wind vanes, on the other hand, have been used for centuries to indicate wind direction. These simple mechanical devices are mounted in a way that allows them to freely rotate and align with the wind, thereby indicating its direction.
Let’s explore the various types of wind sensors available as I delve into their unique features and capabilities.
Wind Vane
A wind vane, sometimes called a weather vane, is a simple yet effective tool for determining wind direction. It consists of a rotating arrow or a similar shape mounted on a vertical shaft. The design usually includes a broad tail on the arrow, which allows the wind to push against it, causing the arrow to point in the direction from which the wind is blowing.
As the wind changes direction, the arrow rotates to align itself accordingly. Wind vanes are generally mounted at a height and in an open space to avoid interference from buildings and trees.
While wind vanes are excellent for indicating wind direction, they offer no data on wind speed. Also, because they are mechanical devices, they can suffer from issues like wear and tear, although their simple construction makes them remarkably robust.
They have been used for centuries and can be seen everywhere, from barns to churches and even modern-day meteorological stations. However, they’re more likely to be part of a combined system for more comprehensive weather monitoring today.
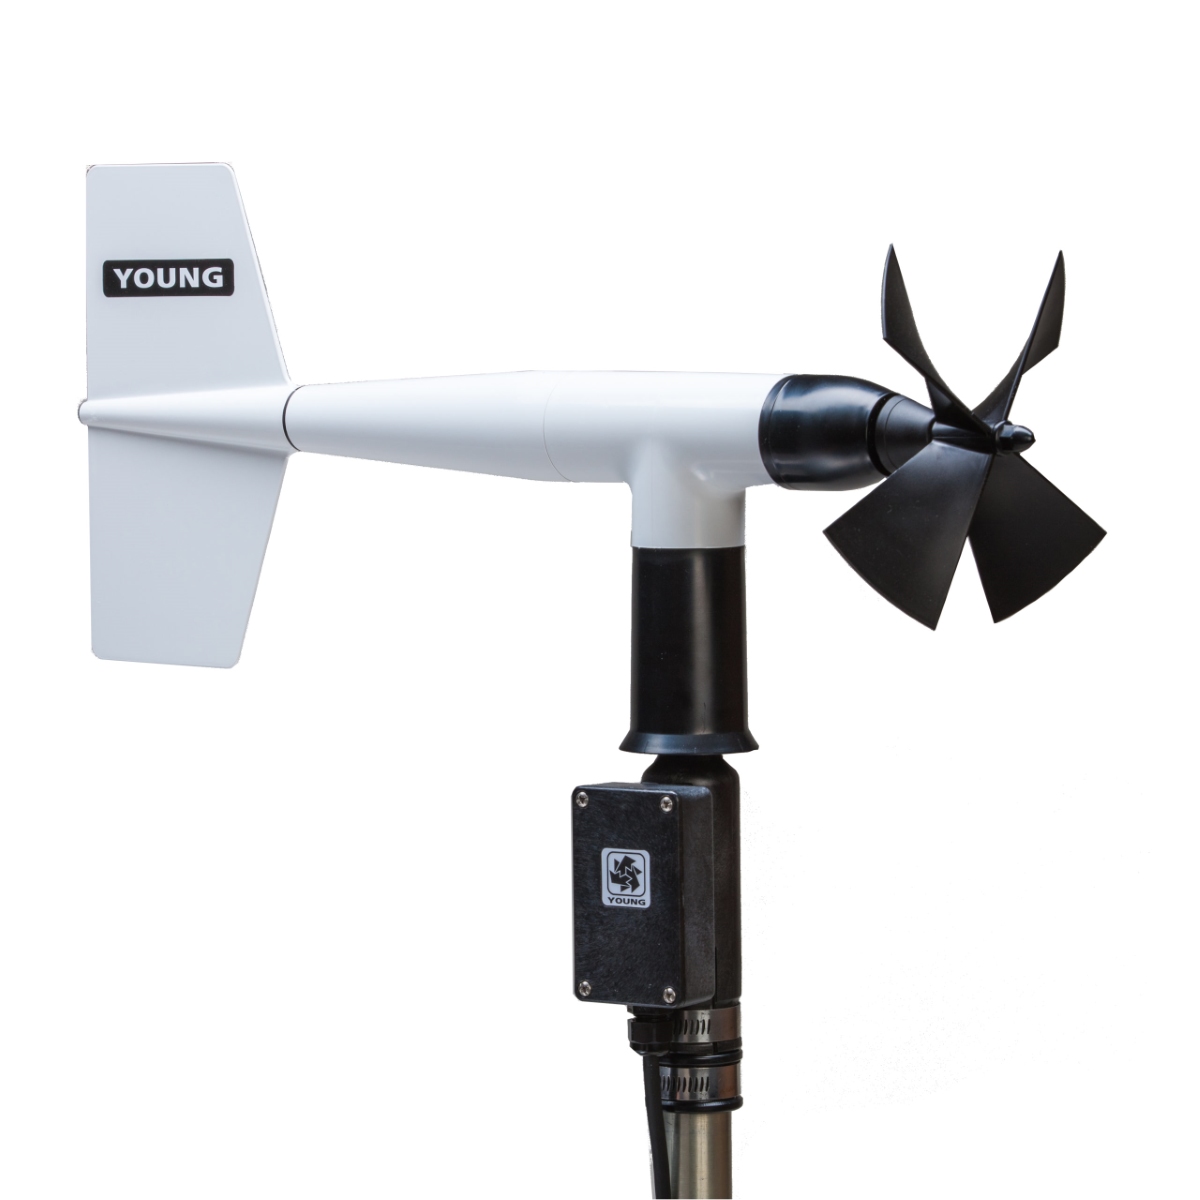
Vane Anemometers
Unlike wind vanes, vane anemometers are designed to measure both wind speed and direction. These devices feature a series of blades or cups (similar to those in a cup anemometer) but are distinct in that they also include a tail vane. The tail vane aligns the device with the wind direction while the rotating blades measure the wind speed. A sensor usually picks up the rotations, translating the data into readable metrics of wind speed in miles per hour (mph) or kilometers per hour (km/h).
Vane anemometers share some drawbacks with cup anemometers, such as the possibility of mechanical wear and tear and inertia affecting response time to sudden changes in wind conditions. However, they offer the added advantage of determining wind direction and speed, making them invaluable in various applications ranging from HVAC system testing to weather stations and environmental research.
In summary, while wind vanes are excellent tools for measuring wind direction and have been around for centuries, vane anemometers represent a technological step forward in measuring wind speed and direction. The choice between these two often boils down to the application’s specific needs: whether the primary requirement is to gauge wind direction alone or to obtain a more comprehensive picture of wind conditions.
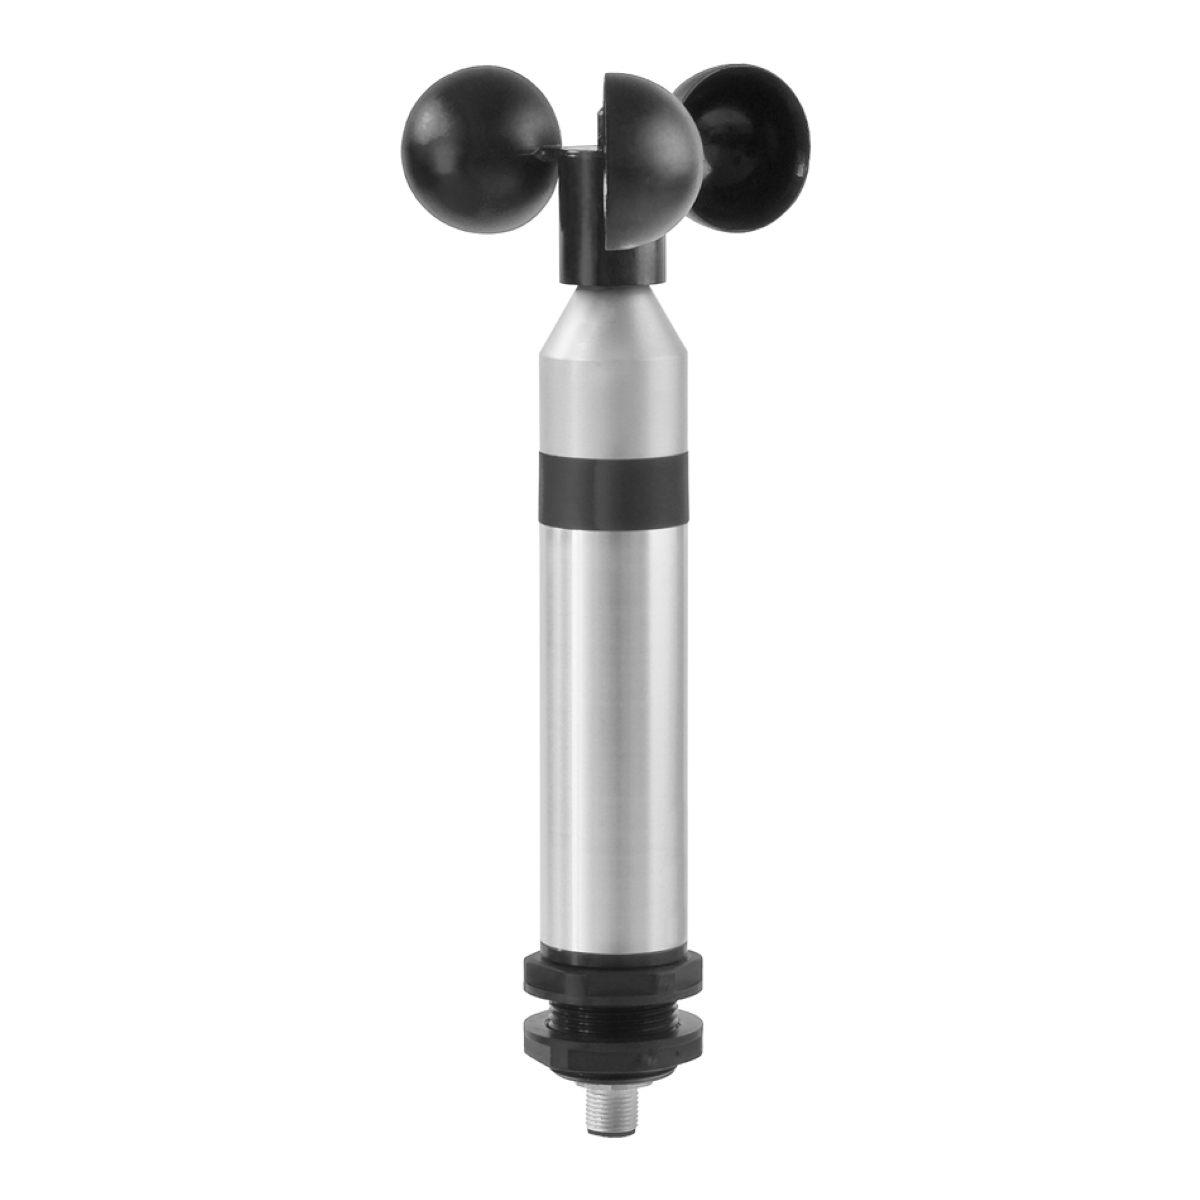
Standard Cup Anemometers
The standard cup anemometer consists of three or four cups (often hemispherical) attached to horizontal arms connected to a vertical rod. As wind flows over the cups, they capture the wind’s kinetic energy and begin to rotate. The rate of rotation corresponds directly to the wind speed.
This mechanism operates based on Newton’s second law, where the force exerted by the wind is balanced by the rotational inertia of the system, thereby establishing a stable speed of rotation that can be measured. Typically, a mechanical counter or electronic sensor measures these rotations and converts them to a wind speed reading, often in units like miles per hour or meters per second.
The cup anemometer has some limitations despite its simplicity and longevity—having been used for over 150 years. The primary concern is wear and tear due to the mechanical nature of the device. Over time, the bearings can wear out, requiring replacement or recalibration to maintain accurate measurements.
Another issue is inertia; the cups can’t instantly respond to sudden changes in wind speed or direction, resulting in a lag between actual atmospheric conditions and the readings displayed. Therefore, while still widely used, especially in less critical applications, they may not be suitable for highly-precise, real-time monitoring scenarios.
Modern Marvels: Digital Anemometers and Ultrasonic Sensors
Fast forward to the 21st century, we now have digital anemometers with electronic sensors offering higher accuracy and digital displays. These modern anemometers work on the same mechanical principles, but the conversion and recording of data are digitalized.
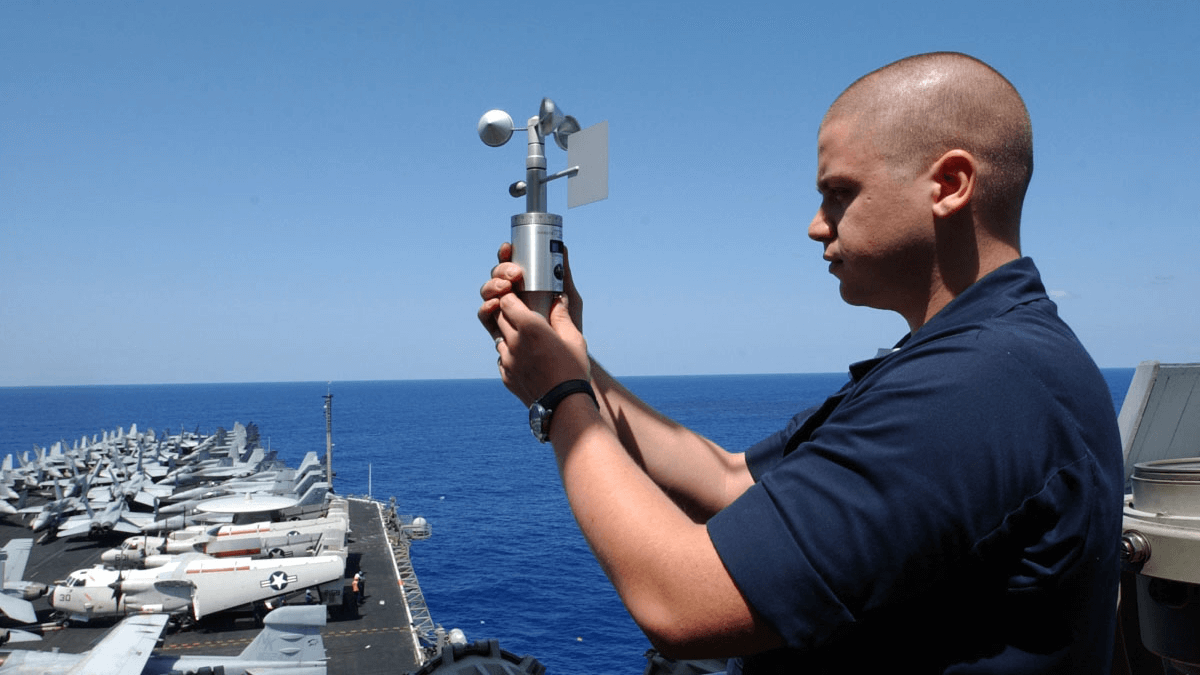
However, the state-of-the-art in wind measurement today is the ultrasonic anemometer. Unlike traditional mechanical anemometers, ultrasonic devices have no moving parts, reducing wear and tear and ensuring long-term accuracy.
These devices use ultrasonic waves to measure wind speed and direction. They emit sound waves between pairs of transducers and measure the time the sound travels between them. The wind affects the speed of these sound waves, allowing for the calculation of both wind speed and direction.
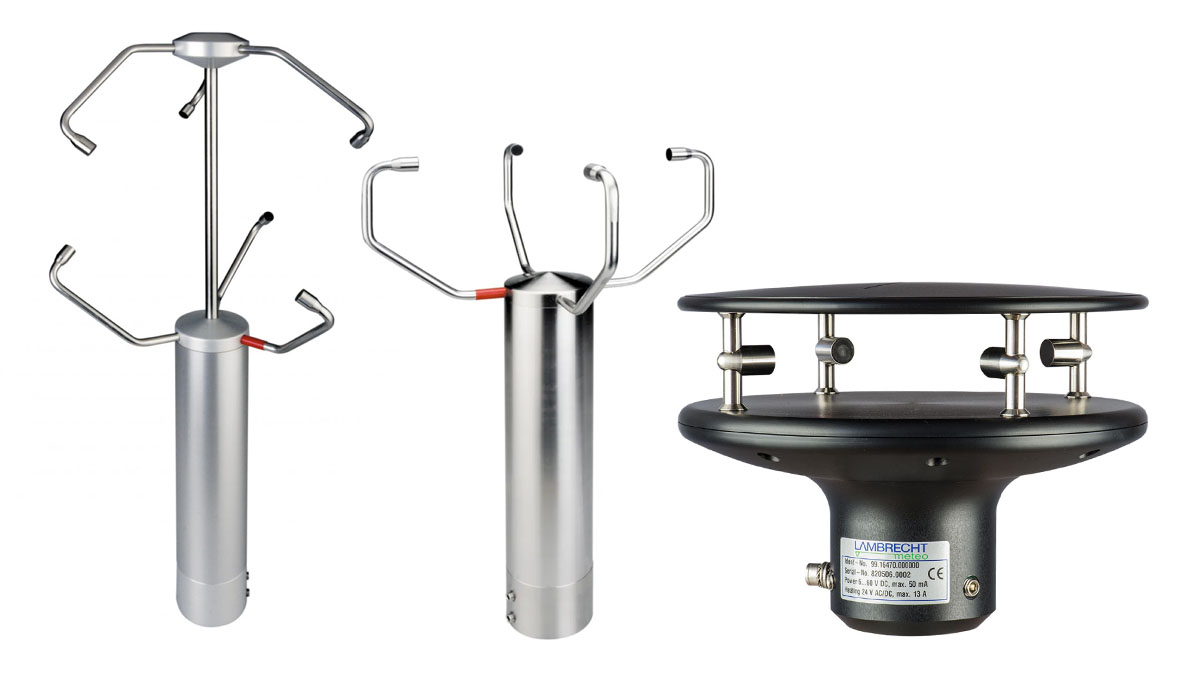
Ultrasonic Anemometers
Ultrasonic anemometers operate on an entirely different set of principles, leveraging the propagation speed of sound waves in air to measure wind conditions. The device consists of at least two pairs of ultrasonic transducers. These transducers emit and receive sound waves, creating a ‘ping’ that travels between them.
When wind flows through the device, it affects the speed at which these sound waves propagate. By calculating the difference in travel times for sound moving upwind versus downwind, the anemometer can derive both the wind speed and direction with a high degree of accuracy.
The ultrasonic anemometer’s primary advantage is the absence of moving parts, resulting in less wear and tear and a longer operational lifespan. They also quickly respond to changing wind conditions, providing almost real-time readings. However, these advantages come at a cost in terms of the device’s actual price and power requirements.
Ultrasonic anemometers are generally more expensive and require an external power source to operate the transducers and internal electronics. These devices are beneficial in situations requiring high-precision measurements, such as scientific research, aviation, and advanced meteorological studies.
Earth’s Wind Records: Blowing Minds with Nature’s Extremes
Imagine soaring through the sky at speeds up to 275 miles per hour (about 442 km/h). This isn’t a fantasy; it’s the speed of jet streams, the fast-flowing air currents that roam between 7 and 12 miles above Earth’s surface. These “air superhighways” not only shape our weather patterns but also have a tangible impact on air travel. Pilots often catch these air streams to speed up their flights and save fuel, but going against them can turn a smooth journey into an extended ordeal.
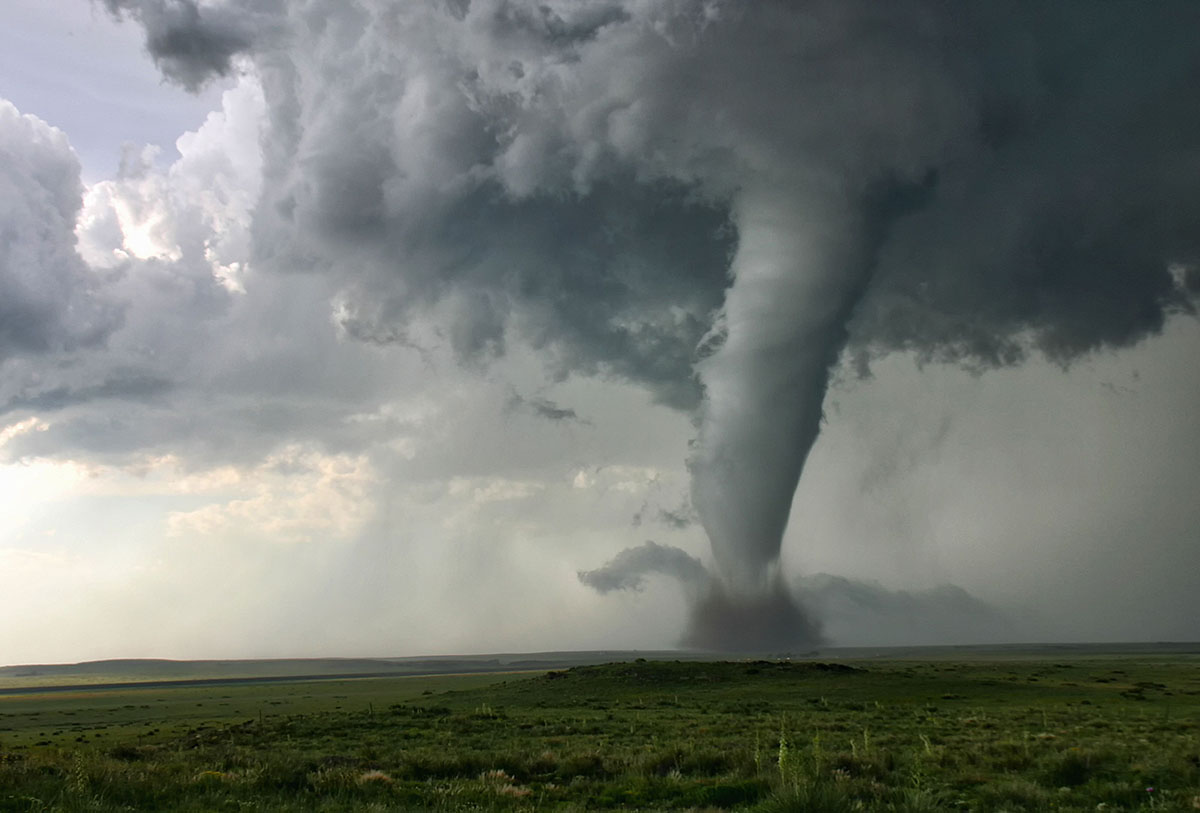
As awe-inspiring as jet streams are, they pale compared to the ferocious tornado that hit Oklahoma on May 3, 1999. This tornado boasts the highest wind speed ever measured on Earth, a staggering 300 miles per hour (around 483 km/h). The resulting damage was devastating, but the data collected provided invaluable insights into the science of tornadoes, significantly advancing our understanding of these natural phenomena.
But tornadoes don’t hold all the records for incredible wind speeds. Straight-line winds, characterized by their non-turbulent nature, also have their champions. During a 1996 storm in Barrow Island, Australia, a gust was recorded at a mind-blowing speed of 253 miles per hour (about 407 km/h). That’s powerful enough to lift cars and hurl them several meters away.
While these wind speeds are undoubtedly awe-inspiring, let’s shift our focus to a completely different realm: temperature. The Antarctic katabatic winds are not only some of the coldest winds on Earth but also astoundingly fast. Originating from the highlands of Antarctica, these winds can reach up to 200 miles per hour (approximately 322 km/h) while maintaining temperatures that can freeze almost anything in their path instantaneously.
You might be surprised to learn that one of the windiest places on Earth is not some remote peak in the Himalayas but rather Mount Washington in New Hampshire, USA. In 1934, this mountain recorded a wind speed of 231 miles per hour (about 372 km/h), a record that remained unbeaten for 62 years. Remarkably, these high-speed winds are sustained at relatively low altitudes, challenging our assumptions about where to find the world’s windiest places.

Finally, let’s consider how human ingenuity has leveraged wind power. Modern wind turbines can start generating electricity with wind speeds as low as 8 miles per hour (about 13 km/h). However, when winds reach approximately 55 miles per hour (around 89 km/h), they become too strong for most turbines, requiring them to shut down to avoid damage. Researchers are now actively working on engineering solutions that can harness even these extreme winds.
So there you have it—a whirlwind tour of Earth’s most astonishing wind records. From the rapid jet streams high above us to the breathtaking speeds of tornadoes and straight-line winds, the power of the wind is as varied as it is extraordinary. These mind-blowing facts amaze us and serve as a vivid reminder of the incredible natural forces that shape our planet.

Mechanical anemometers, like the cup anemometer and wind vane, were pivotal inventions. They precisely quantified wind speed and direction, enhancing our ability to predict its behavior and impact. Today, ultrasonic anemometers have joined this lineage, employing advanced technology to provide even more accurate wind data.
From past to present, these instruments form the legacy of dedicated scientists and meteorologists who unraveled the enigma of Earth’s atmosphere. So, the next time you feel the wind’s gentle touch or confront a fierce storm, remember it’s not just nature’s wonder; it’s a testament to human curiosity and ingenuity. Wind, from whirlwinds to ultrasonic instruments, remains an ever-present, ever-changing, and ever-inspiring force.
Wikipedia, Energycanvas.com, R.M. Young USA, Science Sparks, popularmechanics.com, Adventureblog, Nature, outsideonline.com, and agrilearner.com provided images used in this article.