Winter 2023/2024 is slowly approaching, and the groundwork for its weather patterns is already being laid. Latest forecasts show a colder trend and a strong influence of the new El Niño event. But two more factors are being monitored, having a known Winter impact across the United States, Canada, and Europe.
The global weather system is complex, with many large and small weather drivers. A growing El Niño event will be the main influence in the 2023/2024 Winter across the Northern Hemisphere. But there is also the infamous Polar Vortex and a new anomaly high in the Stratosphere.
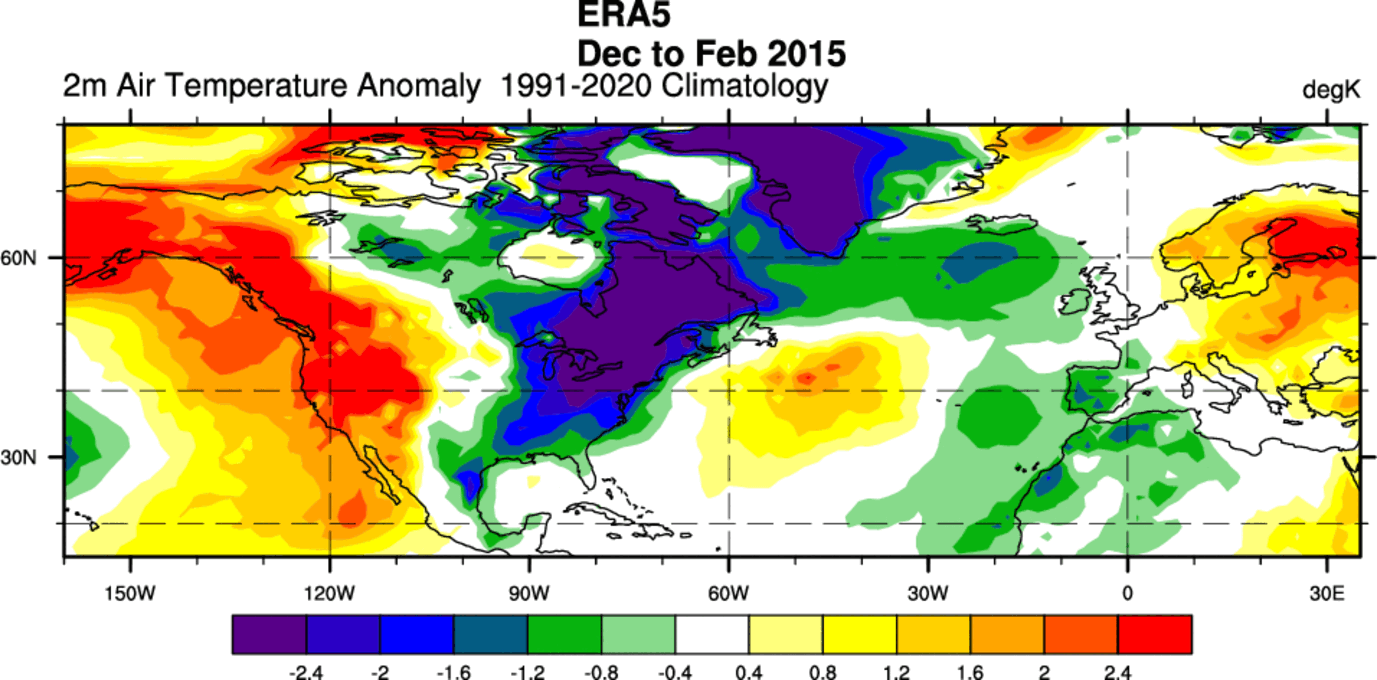
The image below shows the actual pressure anomalies of the 2009/2010 Winter season. That Winter has featured a very interesting dance between the El Niño and the Polar Vortex, creating a very impressive cold Winter pattern in the process.

THE WINTER TRIO
There are always various factors and influences that shape every weather season. Some are big, but most are small. How they work together in a very fine and sensitive balance determines the final weather outcome.
Based on the latest analysis, there are three large-scale factors that we are looking at closely for the upcoming Winter season:
- El Niño event (ENSO)
- Stratospheric Polar Vortex
- Quasi-Biennial Oscillation (QBO)
Each of these factors can have different phases: warm, cold, positive, negative, east, west, and so on. So you can imagine that each year, you can have a different combination of these factors, creating a different Winter weather outcome.
We will quickly review each one and look at their role for this Winter. As you will see, they all complement each other in a very delicate balance of power.
EL NINO SOUTHERN OSCILLATION
El Niño Southern Oscillation (or ENSO) is a region of the equatorial Pacific Ocean that changes between warm and cold phases. Typically, there is a phase change around every 1-3 years.
We are currently entering a warm phase called El Niño. The cold ENSO phase is called La Niña, which was active in the past three winters.
You can see the El Niño in NOAA’s latest ocean anomaly analysis below. It stands out as an area of above-normal ocean temperatures across the equatorial Pacific Ocean. This anomaly affects the atmosphere but also tells us that the weather patterns are changing globally.
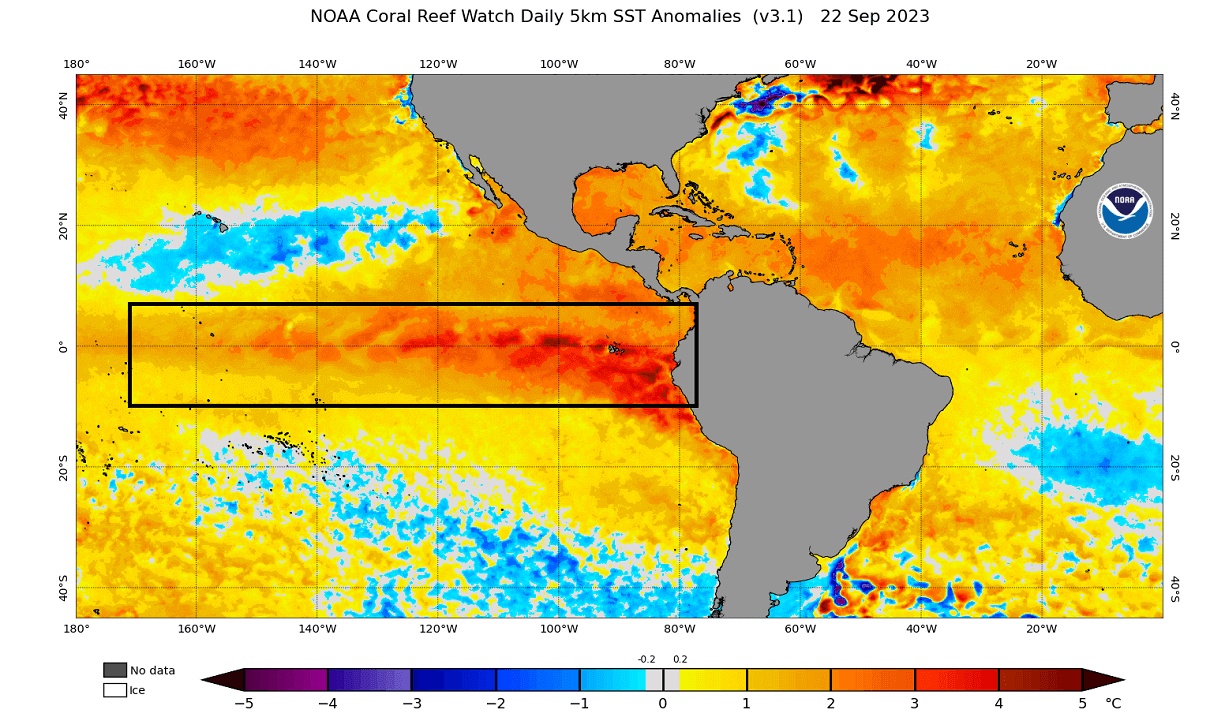
El Niño significantly influences tropical rainfall, pressure patterns, and the complex ocean and atmosphere exchange. With some delay, these changes affect circulation over the rest of the world.
The following image below from NOAA Climate shows the typical circulation during an El Niño event. During an El Niño, rising air in the eastern Pacific causes more storms and precipitation and lowers the pressure over that region.
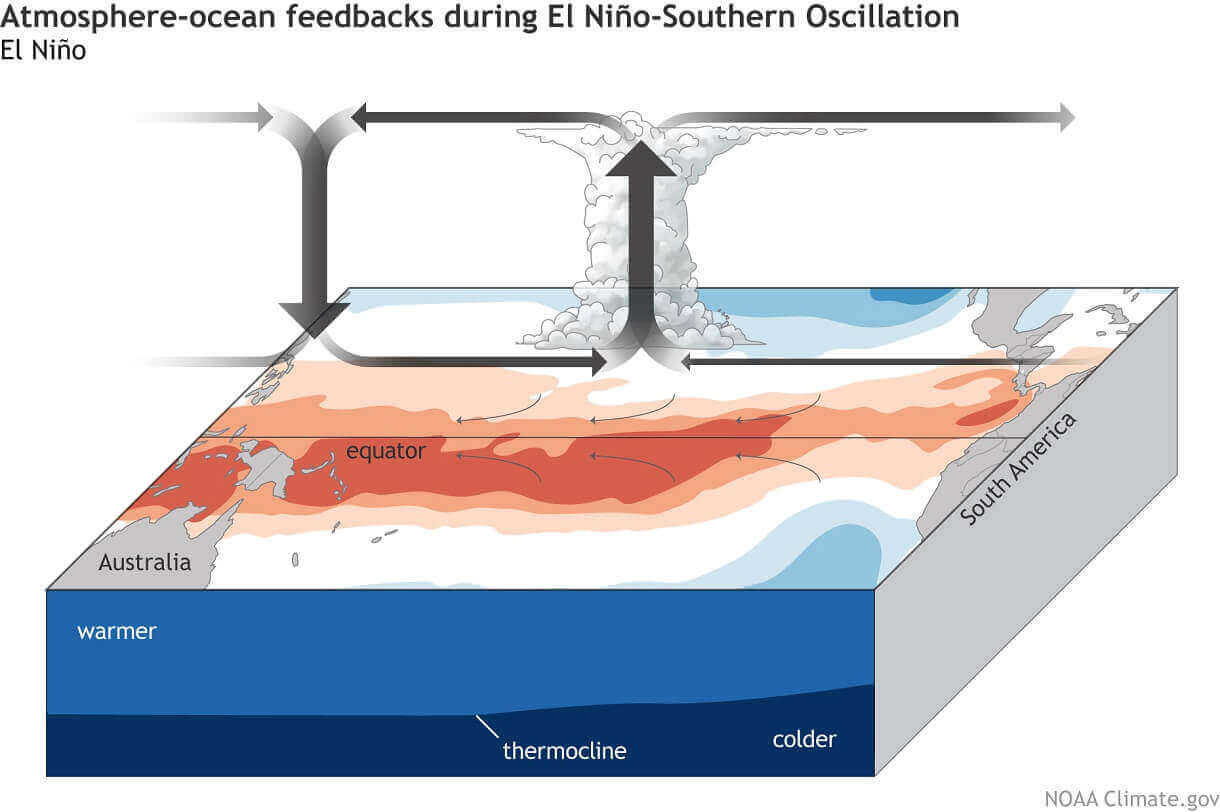
At the same time, the air is descending in the western Pacific, causing stable weather and high-pressure conditions.
This way, El Niño significantly impacts the tropical rainfall and pressure patterns and thus impacts the ocean-atmosphere feedback system. Through this ocean-atmosphere system, the ENSO influence spreads globally.
El Niño forms during weak trade winds, which can tell us much about global circulation. This way, we can use these ocean anomalies as an “indicator” to know the current state of the global climate system.
EL NINO WINTER FORECAST
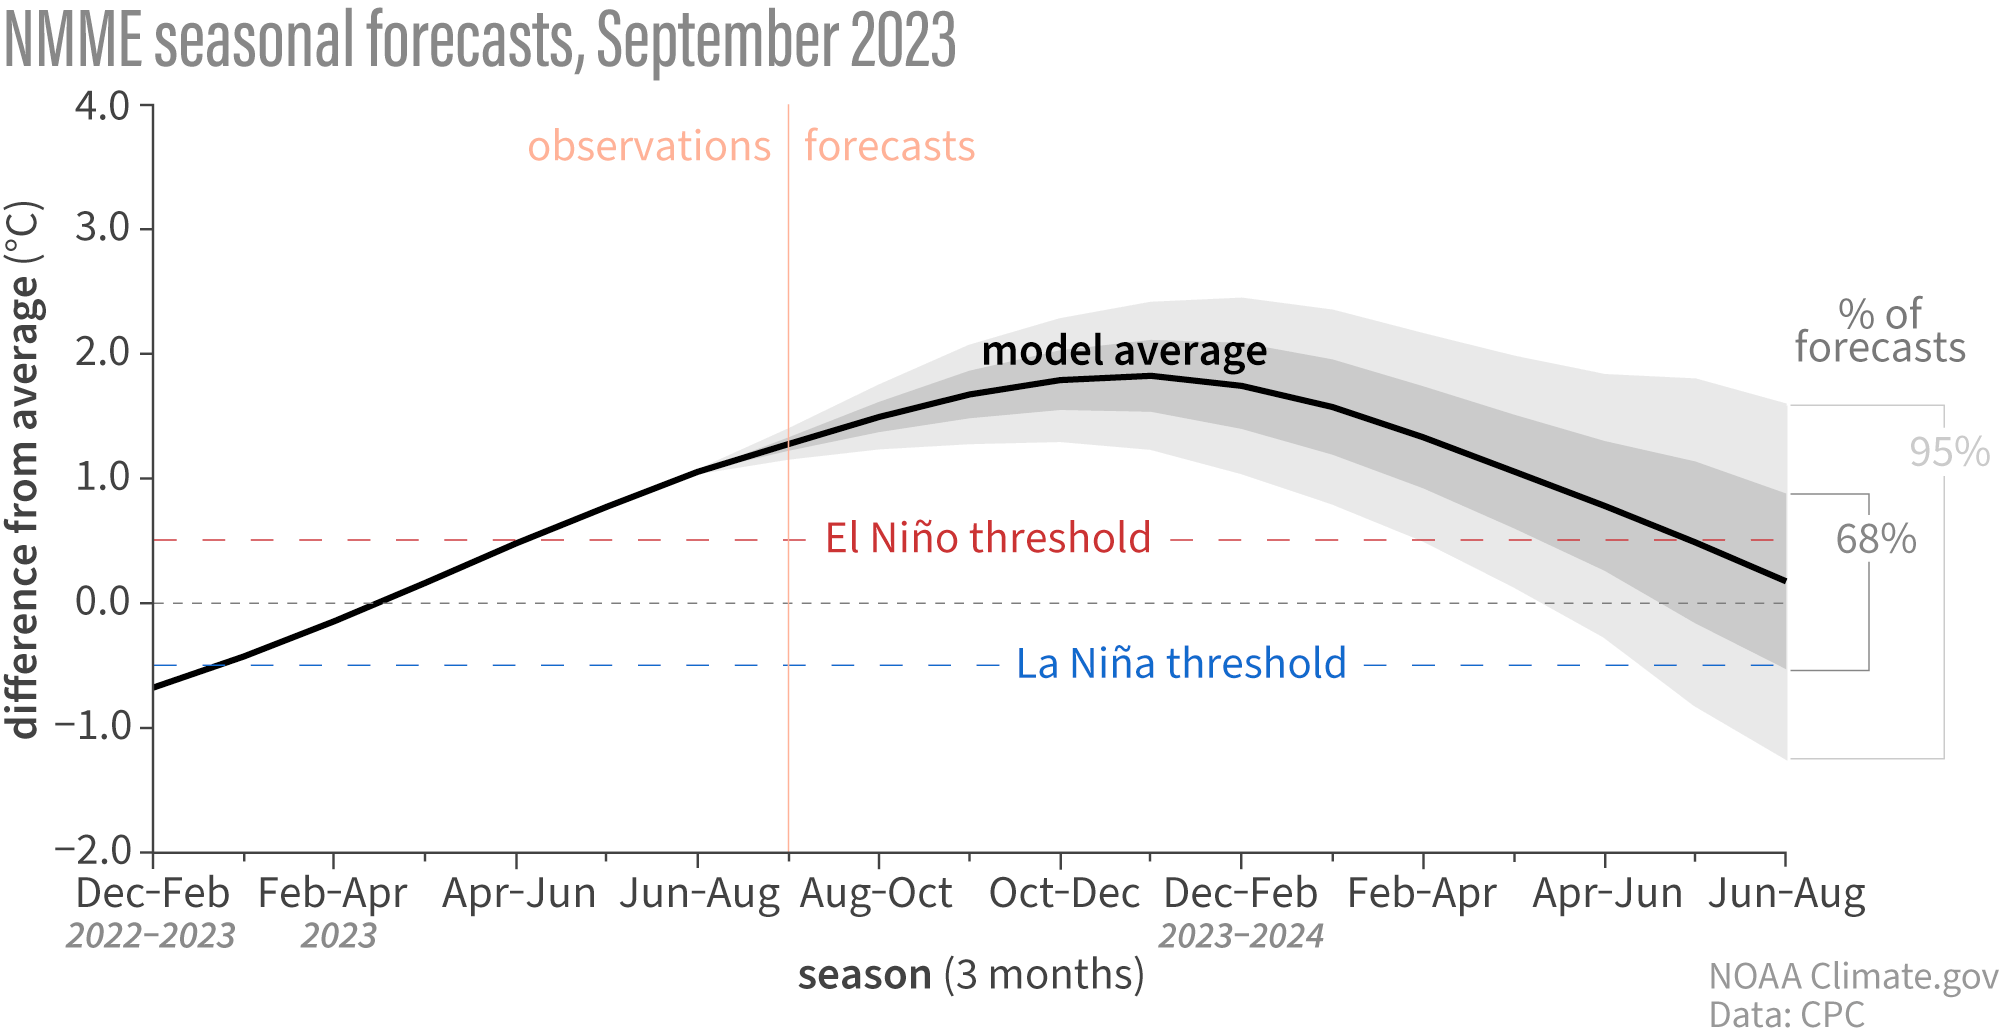
Below is an analysis/forecast graphic by NOAA-CPC, which shows the long-range forecast for the main ENSO region. The forecast average has it around a +1.5 degrees anomaly by mid-Winter. That is considered a moderate to strong El Niño event, expected to have a considerable weather influence.
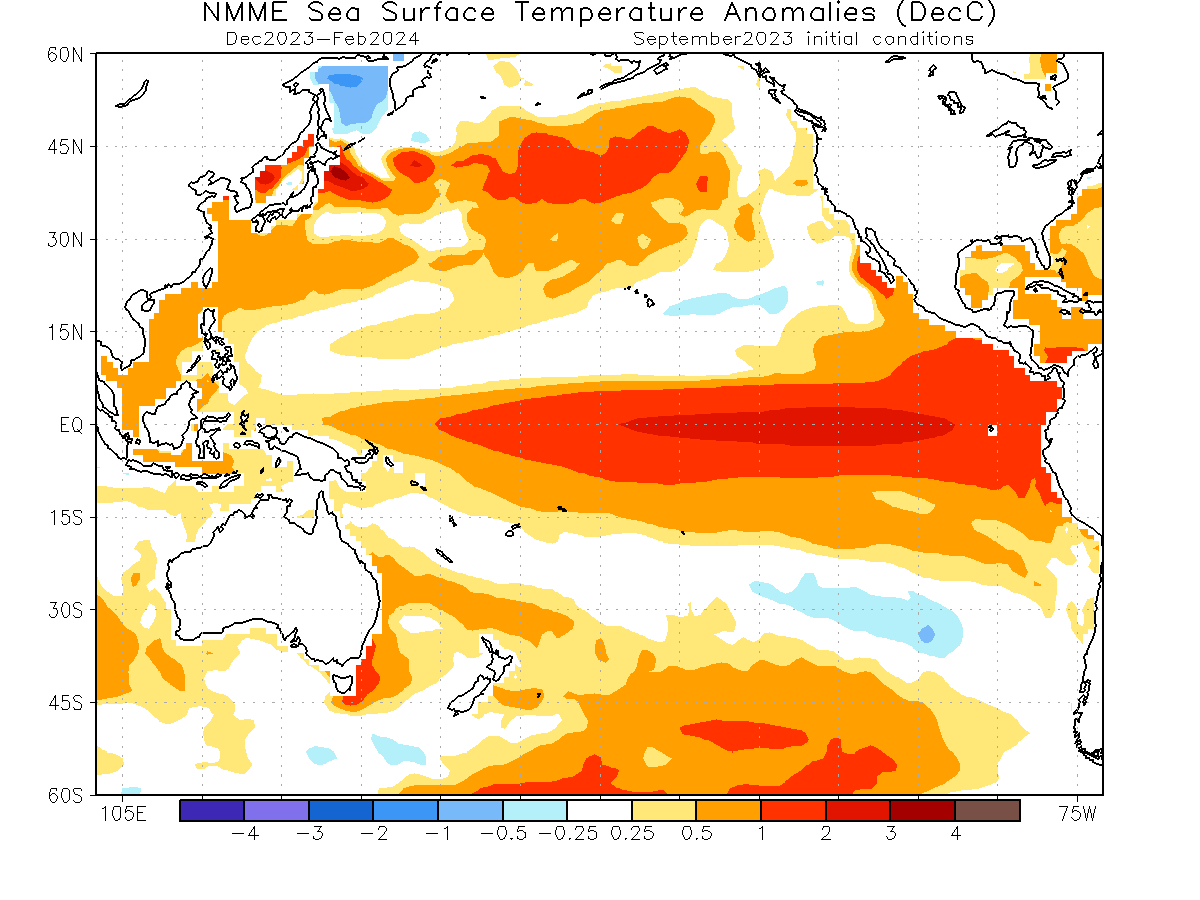
Looking at the Winter 2023/24 ocean temperature anomaly by the same NMME forecast system, you can see a strong El Niño event expanding across the tropical Pacific. With an event on this scale, a strong impact on the Winter weather patterns across the Northern Hemisphere is expected.
During an El Niño Winter, there is typically a strong and persistent low-pressure area in the North Pacific. That pushes the polar jet stream further north, bringing warmer-than-normal temperatures to the northern United States and western Canada.
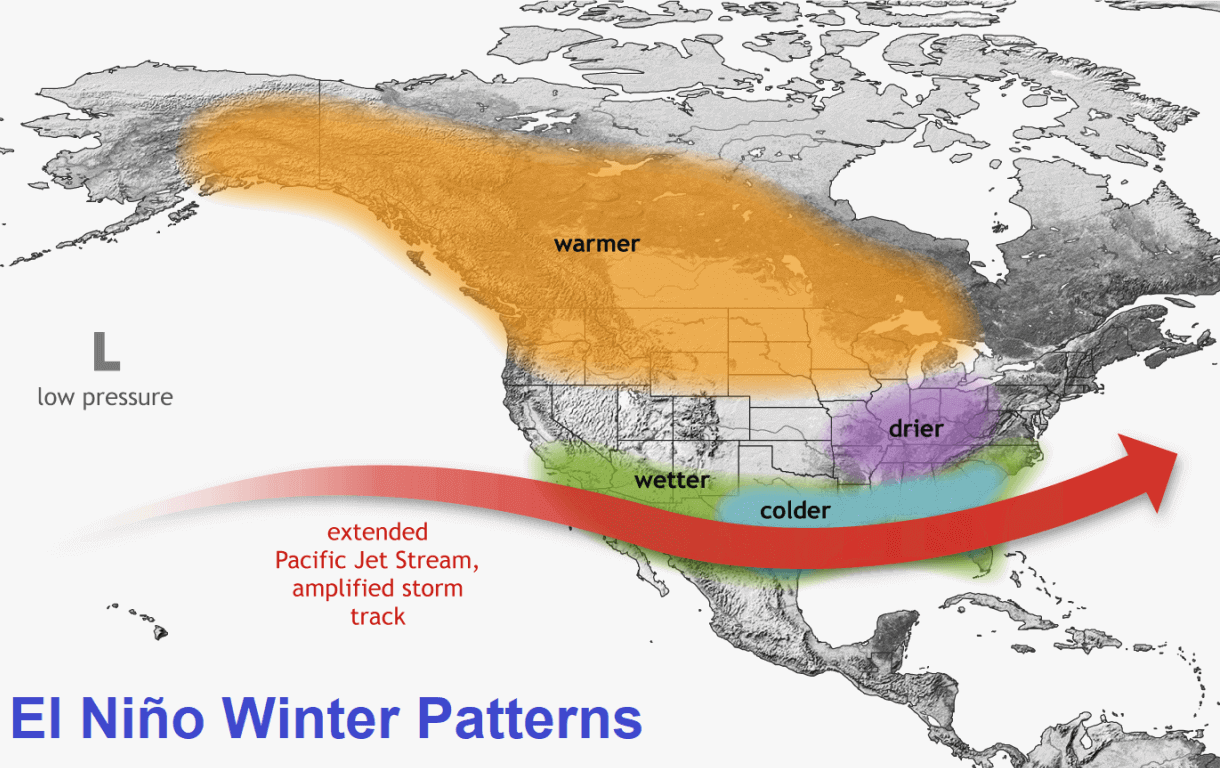
But the southerly Pacific jet stream is extended and amplified during an El Niño, bringing low pressure and storms with lots of precipitation and cooler weather to the southern United States.
With cooler temperatures and more precipitation, there is more snowfall in the central and southern United States during an El Niño. And also over parts of the mid-Atlantic and higher elevations of the southwestern United States.
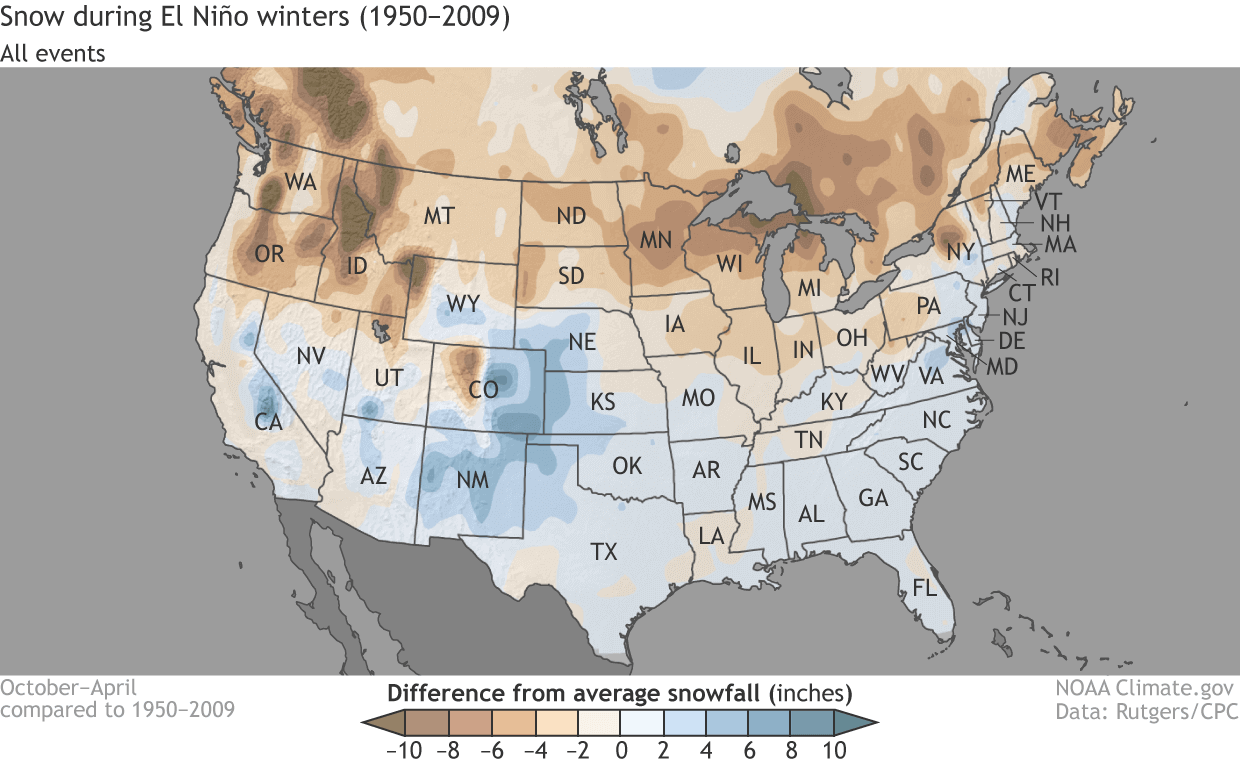
This is mainly due to low-pressure systems trailing across the southern United States. With more moisture available, the chances of snowfall increase in the southern half of the country.
But we now move on to the second member of the Winter trio, perhaps less known but very important, residing in the higher parts of the atmosphere.
THE POLAR VORTEX CIRCULATION
To understand what the Polar Vortex is, we can try and visualize it. In simple terms, it is a single name that describes the broad winter circulation over the northern (and southern) hemispheres.
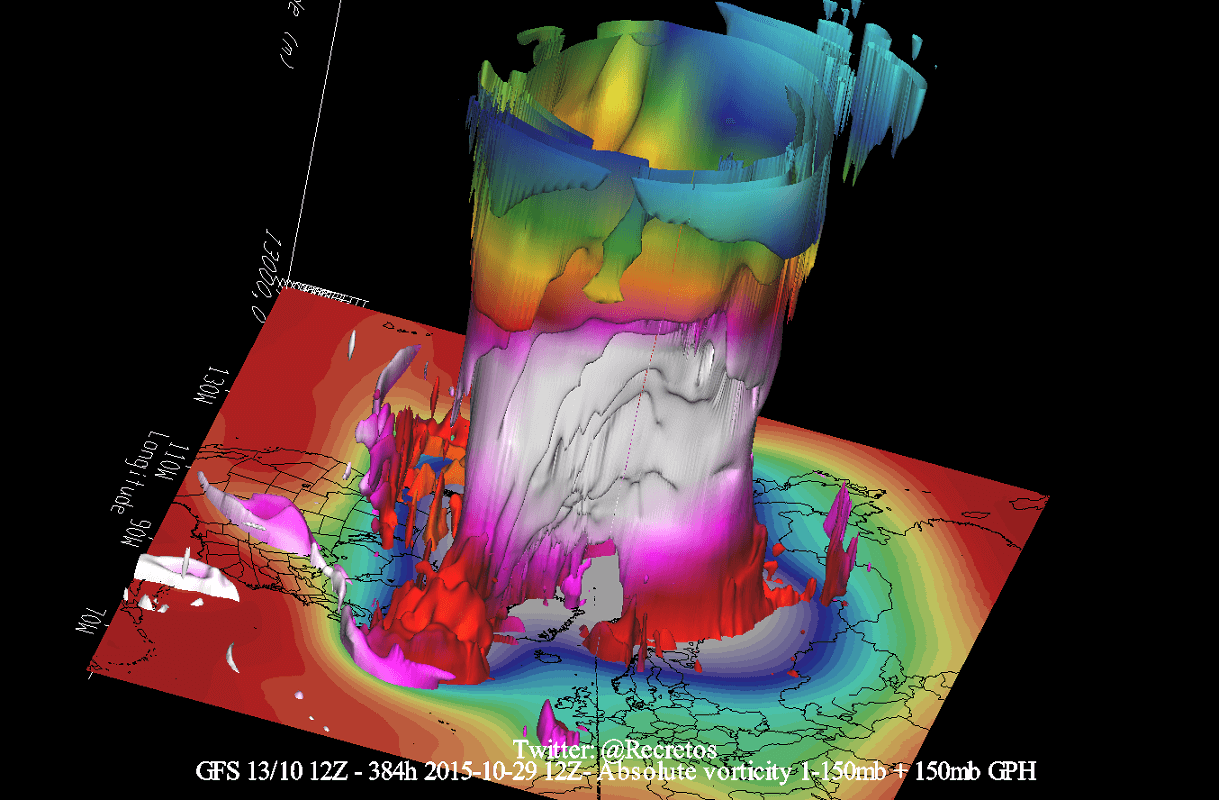
Below, you can see a 3-dimensional image of the Polar Vortex. The vertical axis is greatly enhanced for better visual presentation. In addition, you can see the actual structure of the Polar Vortex, connecting down to the lower levels to the pressure systems.
The Polar Vortex extends high up into the atmosphere. The lowest level of the atmosphere is called the troposphere, where all the weather events are. But above that, we have the Stratosphere, a deeper and drier layer and the home of the ozone layer.
For this reason, we tend to separate the entire Polar Vortex into an upper (stratospheric) and a lower (tropospheric) part. They both play their role differently, so we monitor them separately. But it is also very important if they are properly connected—image by NOAA-Climate.
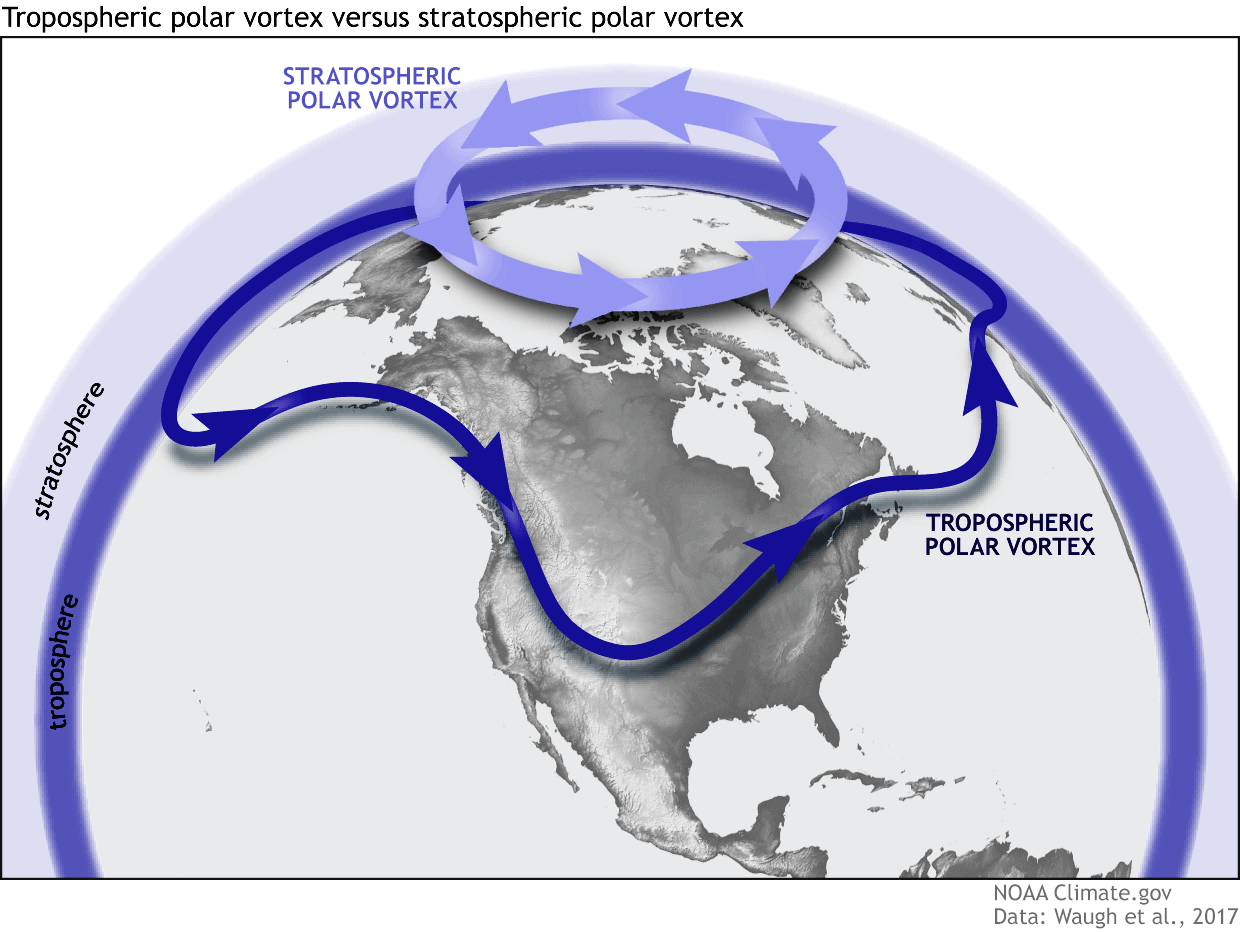
The upper (stratospheric) part is more circular and symmetrical as it spins higher above the ground, with fewer obstacles in its flow.
But, the lower structure of the Polar Vortex is much more uneven and mainly disrupted. That is due to the influence of the terrain/mountains and strong pressure systems acting as obstacles.
The Polar Vortex behaves like a very large cyclone, covering the whole north pole down to the mid-latitudes. It is connected through all atmospheric levels, from the ground up, but can have different shapes at different altitudes.
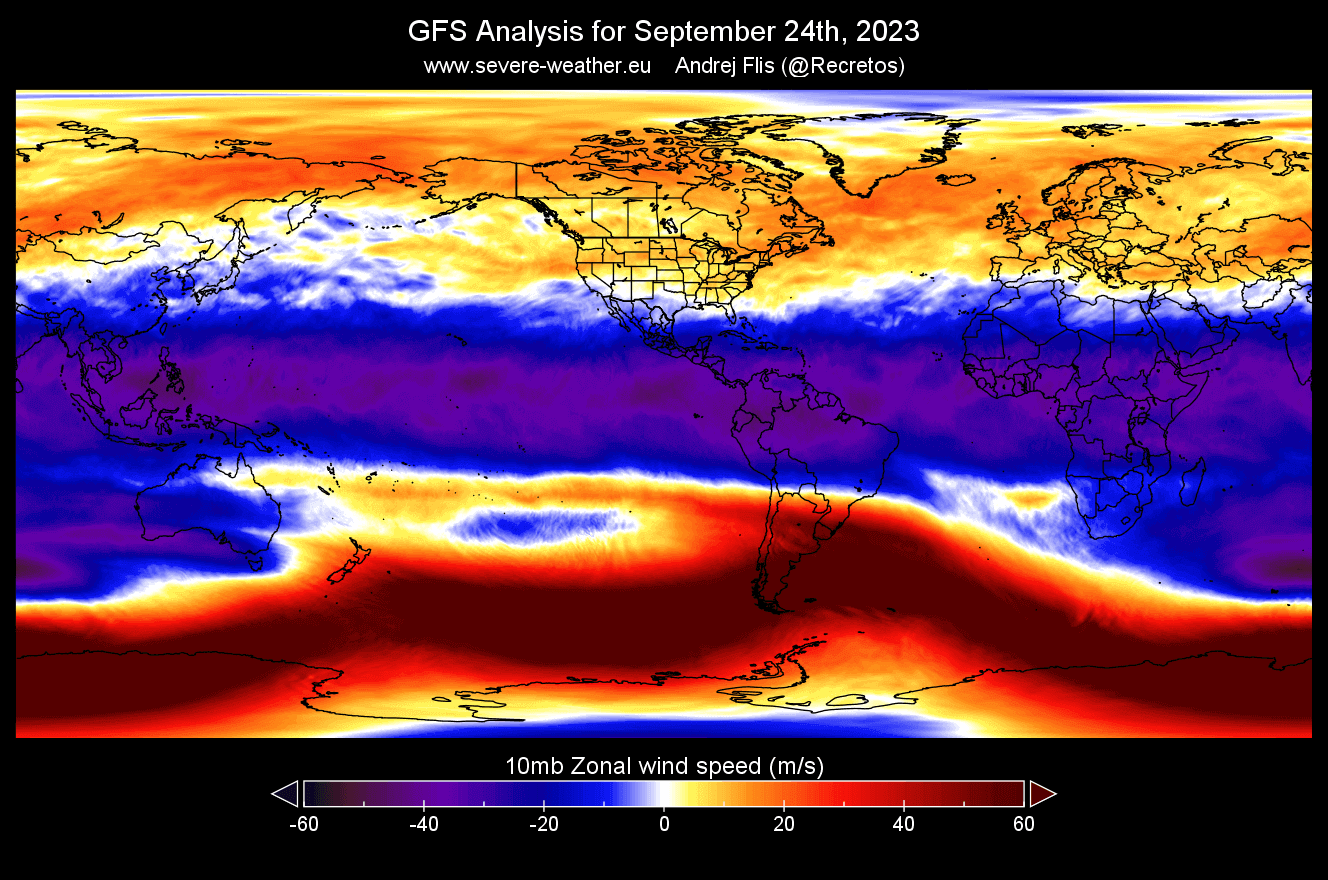
To put the Polar Vortex into perspective, we produced a high-resolution video below, showing the Vortex spinning over the Northern Hemisphere in the Stratosphere at the 30mb level, around 23km/14miles altitude.
The video mainly shows that the Polar Vortex is not just one winter storm or a cold outbreak that moves from the Midwest into the northeastern United States. It is a powerful large-scale circulation.
Unlike the El Niño or the QBO, the Polar Vortex does not have a warm/cold or a clear positive/negative phase. Instead, the Polar Vortex is most impactful when fully in a strong or weak mode.
A strong Polar Vortex usually means strong polar circulation and jet stream. This contains the colder air into the Arctic Circle, creating milder conditions for most of the United States and Europe.
In contrast, a weak Polar Vortex creates a weak jet stream pattern. As a result, it has a harder time containing the cold air, which can now escape from the polar regions into the United States and Europe. Image by NOAA.
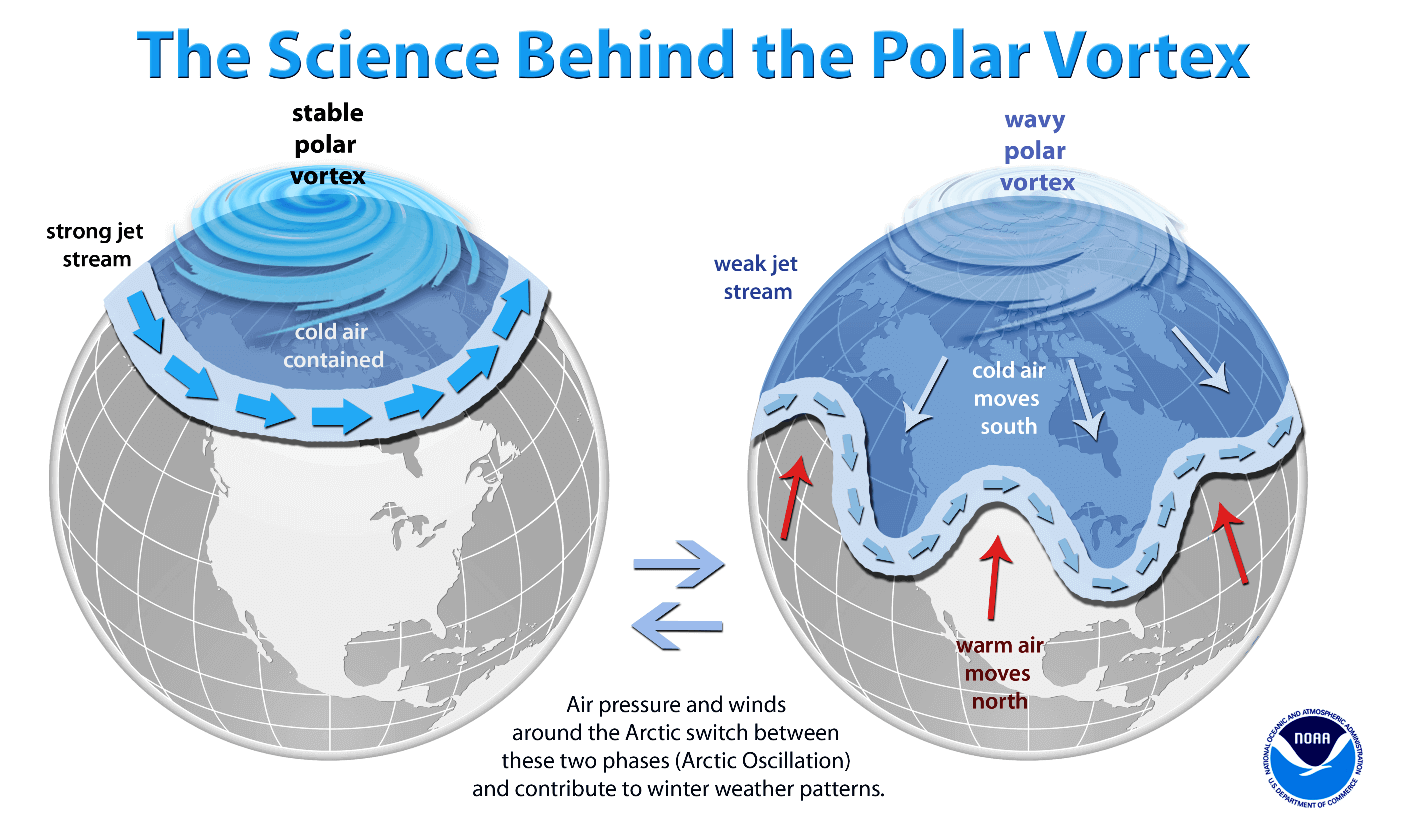
So, as you can see, to have a colder and snowier Winter, your odds are highest with a weak Polar Vortex. In nature, a weak Polar Vortex essentially means a breakdown of the stratospheric Polar Vortex.
That is usually achieved by increasing the pressure or temperature in the polar Stratosphere. We call such events “Sudden Stratospheric Warming”. As the name suggests, it is a rapid temperature increase in the Stratosphere.
But such events need a lot of energy at various levels. So this brings us to our third Winter factor for this season. It is an atmospheric wind phenomenon so regular that it is called the atmosphere’s heartbeat.
THE ATMOSPHERIC ANOMALY
This atmospheric phenomenon is called Quasi-Biennial Oscillation (QBO short), a changing wind anomaly in the tropical Stratosphere. Its presence has been well known for many decades, and it plays its role in the Winter season pattern development.
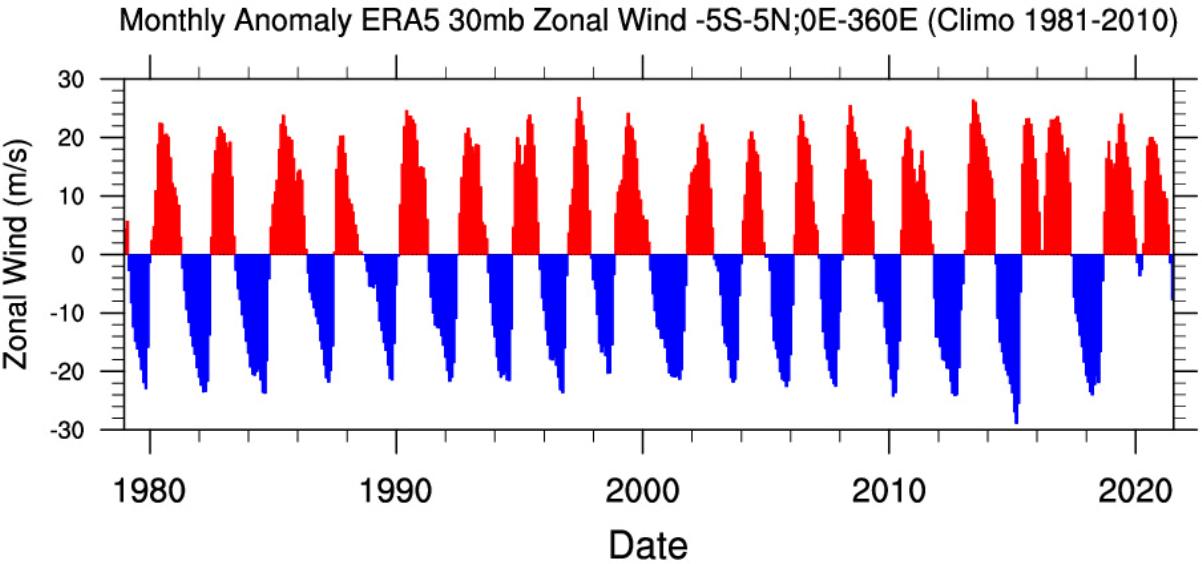
Strong stratospheric winds can be found in a belt across the planet over the Equator. Around every 14 months, these winds completely change direction from west to east, or vice-versa.
This means that winds in the tropical stratosphere change from west to east every year or so.
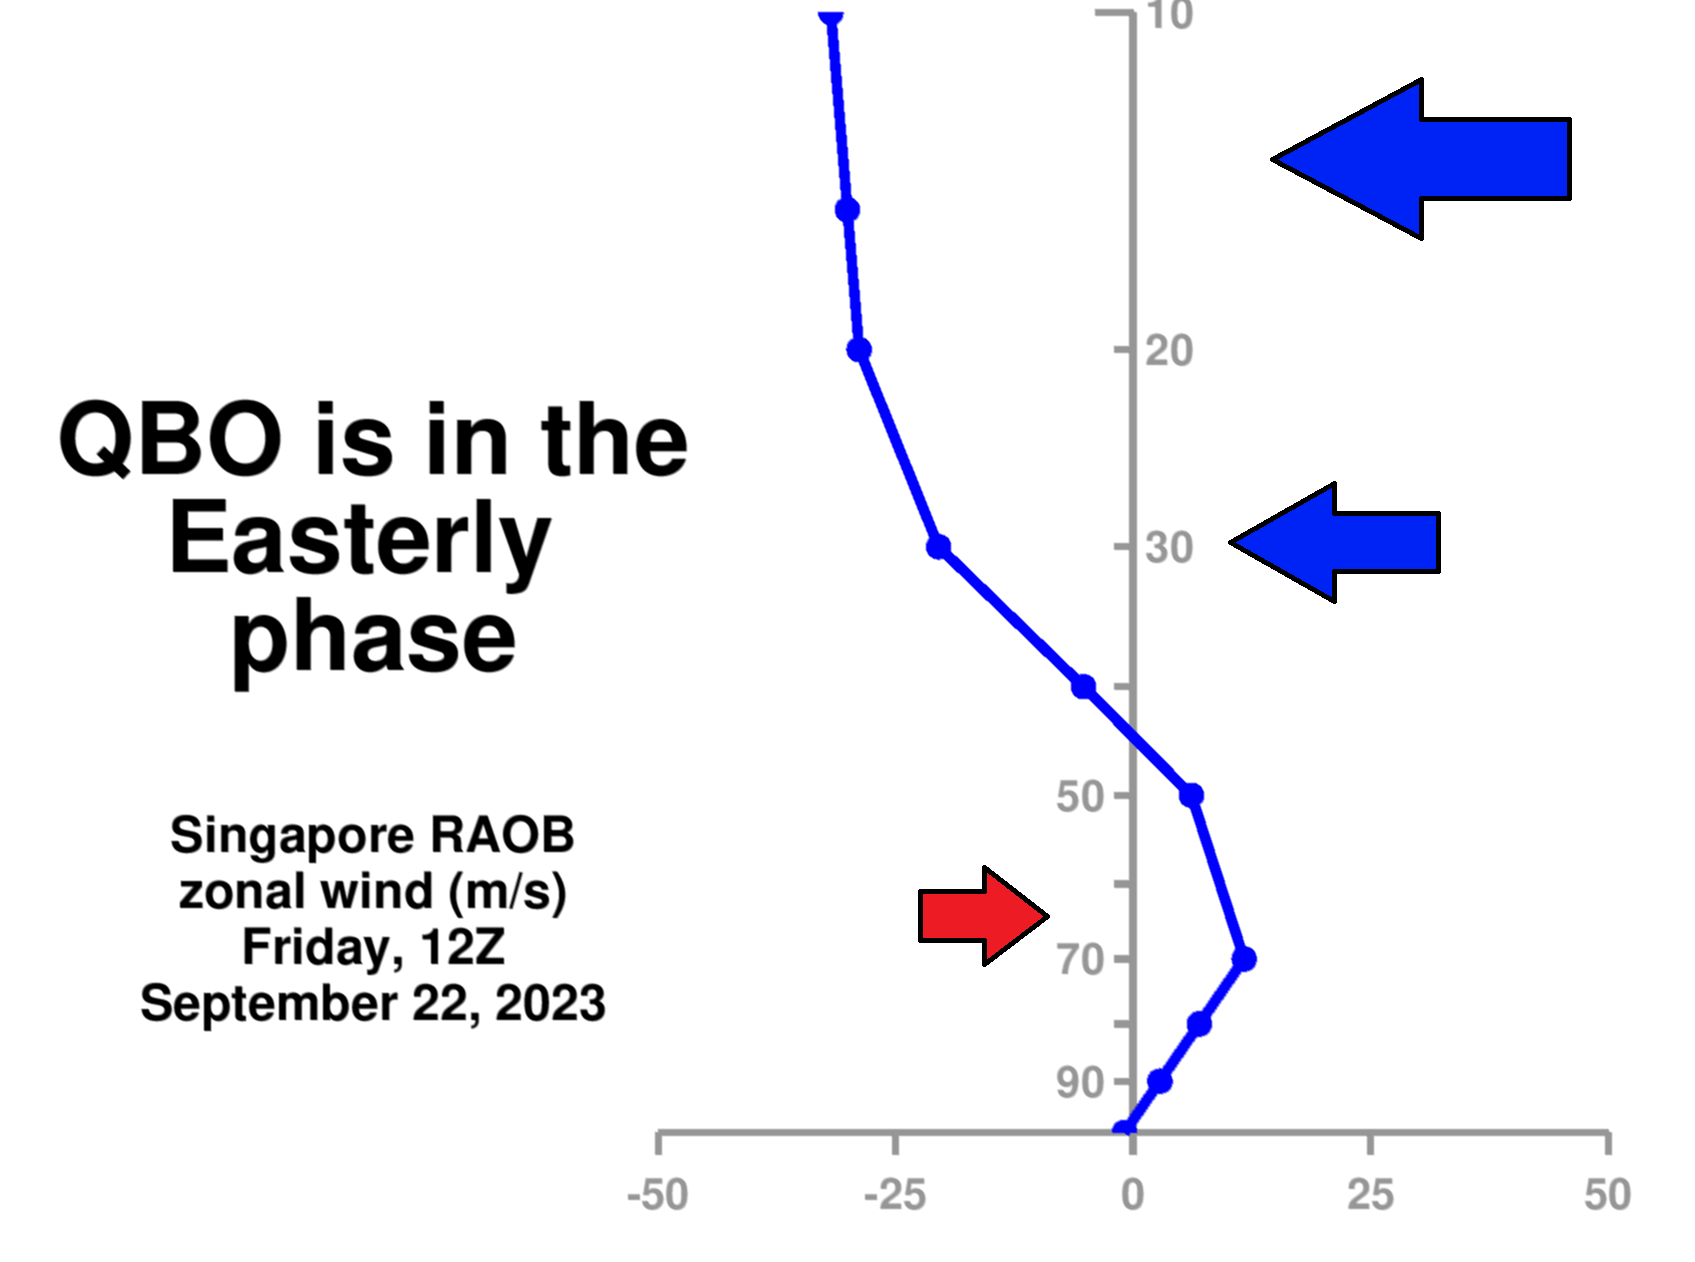
A wind analysis below for the Stratosphere shows a negative wind stream above the tropical regions. The negative values indicate easterly winds. This means that the QBO is in the east (negative) mode.
Below is a special graph showing the zonal wind anomalies for the past 40 years at around 24km/15mi altitude over the Equator. It shows just how regular this wind shift really is, like watching a heartbeat, but in this case, that of the atmosphere.
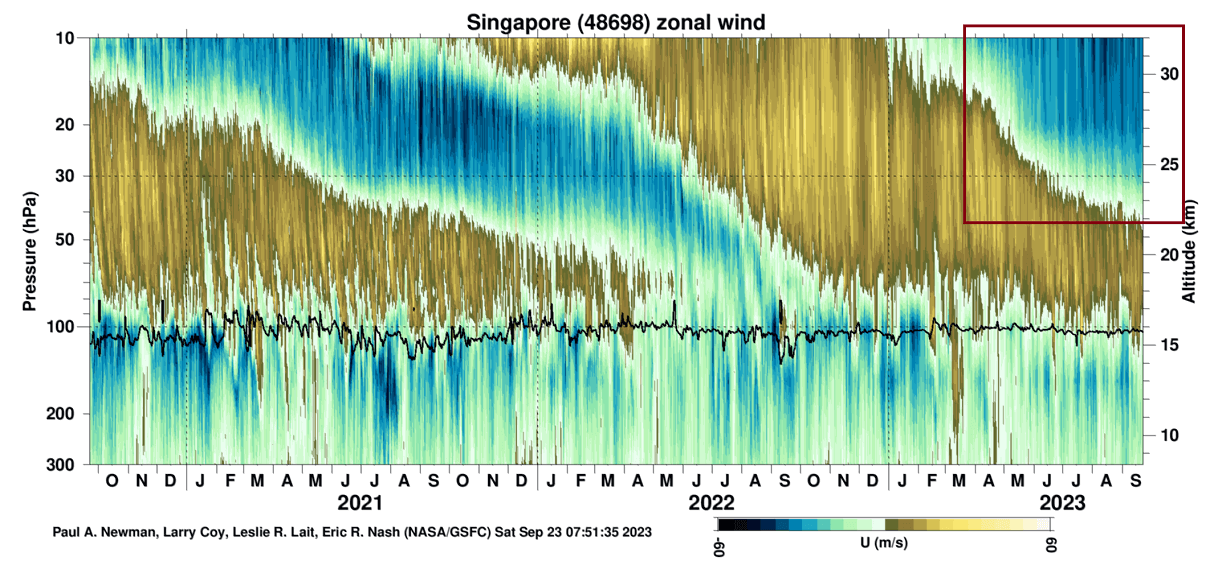
A NASA radiosonde analysis from Singapore also shows the wind direction above the tropical regions. It reveals the easterly winds around the 10-40mb level, confirming the east QBO phase is descending in the Stratosphere and will be dominant this Winter.
Looking more closely at the analysis of the past three years, you can see how each phase descends over time. A west QBO phase was active in the last Winter. Marked in the upper right corner is the currently developing negative phase, slowly descending down the Stratosphere and ready to impact the upcoming Winter.
So, if we summarize the QBO, it is the wind phase in the tropical Stratosphere, changing between the easterly and westerly phases.
QBO AND POLAR VORTEX
The QBO is an important part of weather development in Winter, as it can affect the Polar Vortex and the jet stream. The power and direction of the winds in the polar jet stream can change with the QBO.
So, the QBO on its own does not affect the weather at the surface directly. Rather, it helps to modify/change the large-scale forcing of the El Niño, helping to collapse the Polar Vortex.
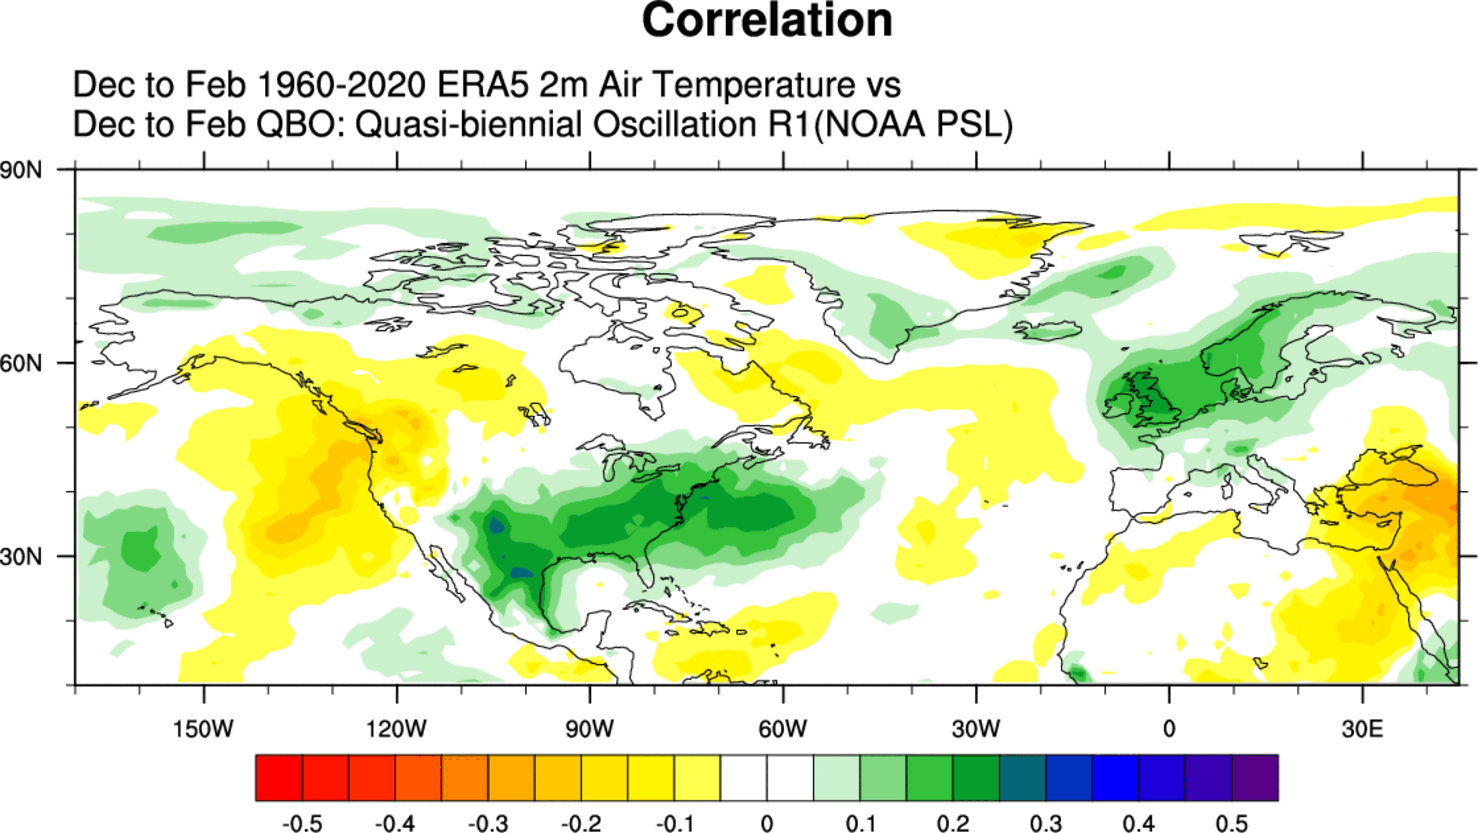
There is more than one reason why QBO can influence our Winter weather. But the most familiar aspect is, of course, the Polar Vortex. The image below shows the connection between the east QBO, El Niño, and the Polar Vortex in the December-January Winter period. It also shows the complex global weather system.
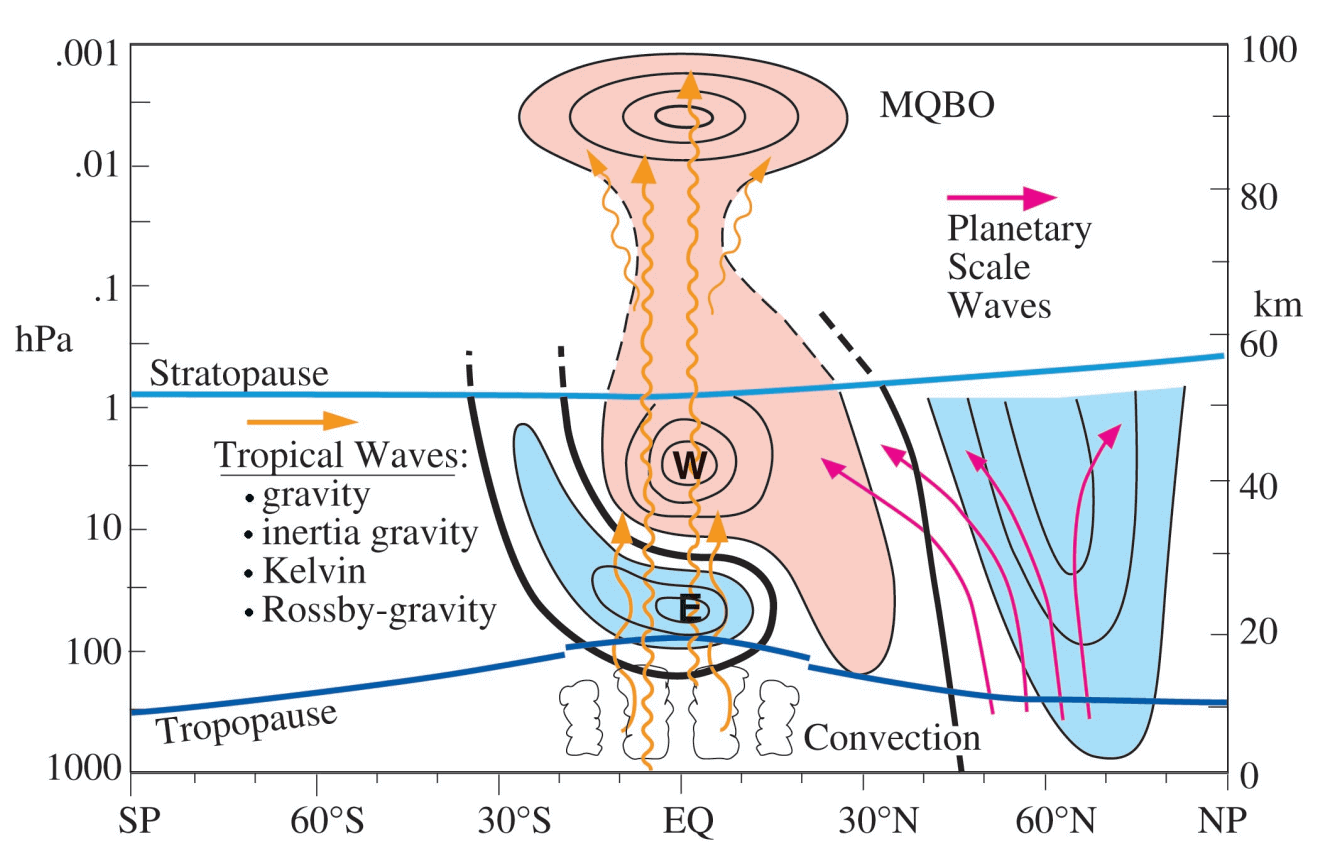
It might seem complicated, but the main takeaway is that the QBO is connected to the overall tropical effects, including the El Niño. That is why a QBO does not mean a fixed weather situation, as an east QBO response can be different during a La Niña or an El Niño, creating a different impact on the Polar Vortex.
By helping to change the Polar Vortex conditions, the QBO influences can help to change the weather patterns across the United States, Canada, and Europe. Add El Niño into the mix, and you get the full picture of how all these factors are connected on a truly global scale.
The image below shows a signal for a warm anomaly in the polar Stratosphere during Winter with an east QBO. This indicates that in an easterly QBO, the Polar Vortex and the stratospheric winter circulation are weaker.
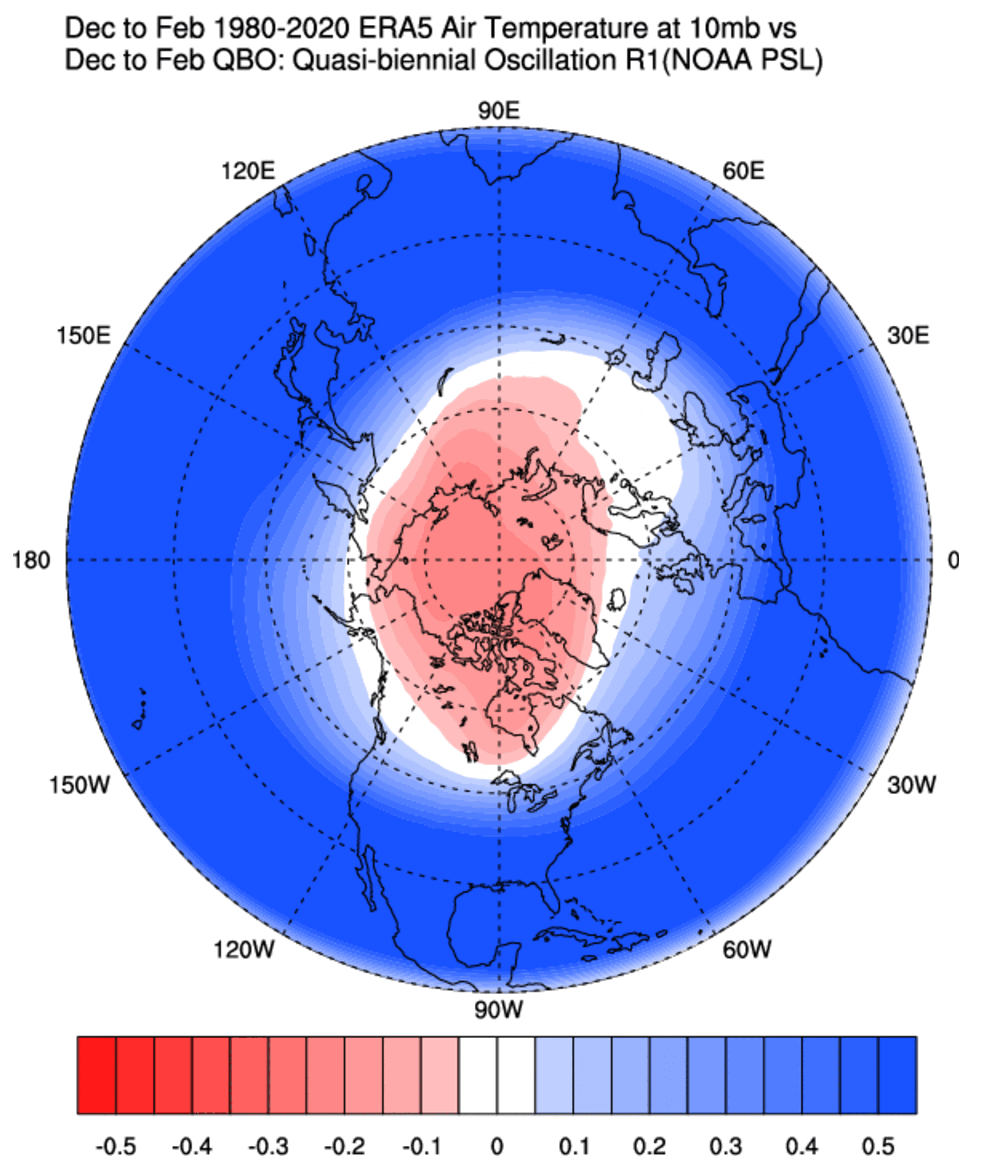
That is usually associated with Sudden Stratospheric Warming (SSW) events. These powerful weather events occur high up in the Polar Stratosphere, raising the temperature and pressure. These effects usually come crashing down, impacting the weather across the Northern Hemisphere.
So combining an El Niño and an east QBO can be one way to increase your odds for a Polar Vortex collapse event and, thus, a very dynamic Winter pattern.
WINTER WEATHER RESPONSE
Depending on the phase, the risk of winter conditions across the Northern Hemisphere can differ by each of the phases:
- When the QBO is negative (easterly), there is an increased chance of a weaker jet stream, sudden stratospheric warming events, and colder winters in the United States, Canada, and Europe.
- When the QBO is positive (westerly), the chance increases for a stronger jet stream and a stronger Polar Vortex. That means a milder winter, as the colder air is locked in the polar regions, having a harder time punching out of the strong circulation.
Below is an image of how the east QBO can amplify or change the original El Niño pattern across the United States, Canada, and Europe.
Looking at pressure anomalies, we can see that an east QBO in an El Niño winter has a stronger high-pressure signal in the North Atlantic, western Canada, and the northern United States. As a response, you can see lower pressure over the southern and eastern parts of the United States and Europe.
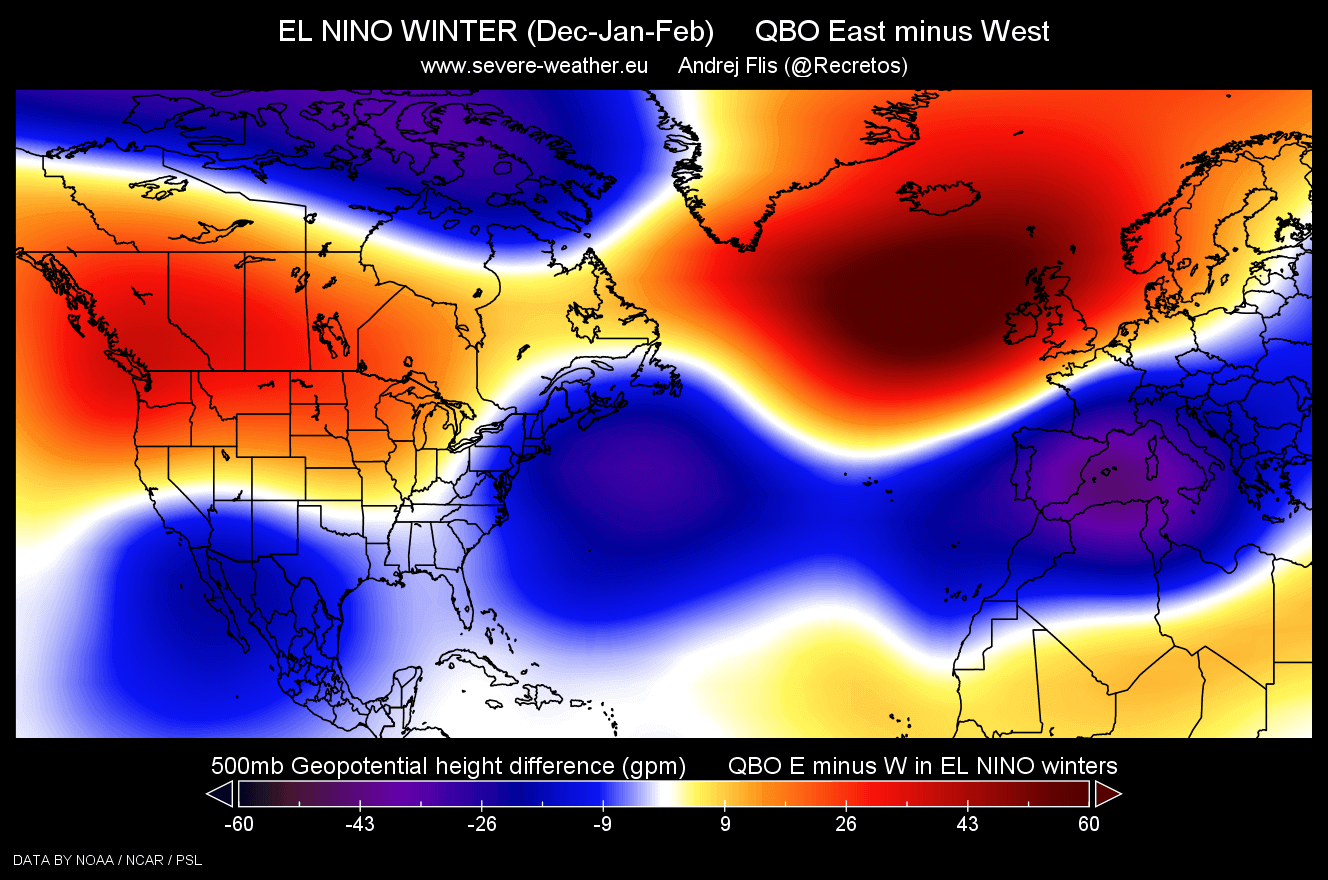
This shows a tendency for a reversed pressure pattern in the Atlantic and a more disrupted (wavey) jet stream. A disrupted jet stream means an easier way for the colder air to escape the polar regions and into the United States.
Below is a Winter temperature signal for a negative QBO phase based on decades of data. You can see a tendency for colder temperatures over the southern and eastern United States and Europe. The signal is not overly strong, as there are a lot of other “winter influencers” besides the QBO in the raw data.
So we now know how the El Niño and QBO work and how it all spins around with the Polar Vortex. But has there ever been such a combination of these factors in the past?
Actually yes. The last two winters with an El Niño and an east QBO were 2009/10 and 2014/15. The 09/10 Winter season was perhaps a more memorable one, as it also featured a full Polar Vortex Collapse event in the form of a Stratospheric warming event.
THE DAYS OF WINTER PAST
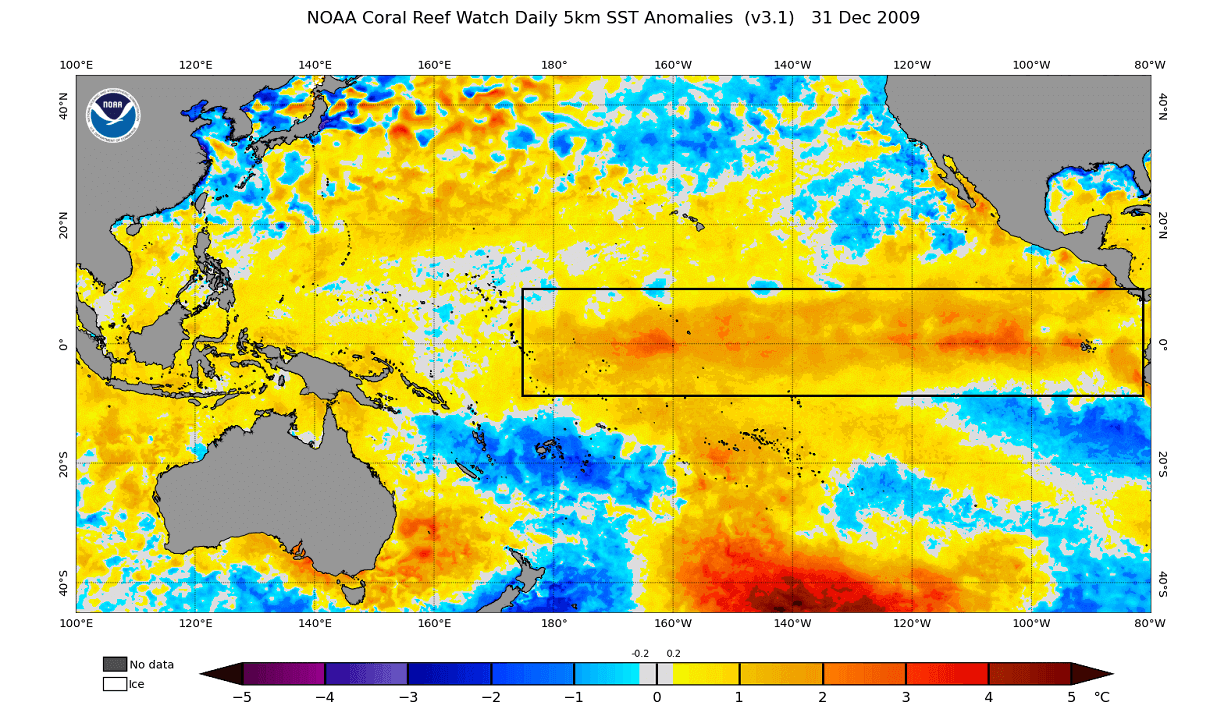
Looking more closely at the 09/10 season, we first have to note the El Niño event. The ocean analysis image below by NOAA shows the warm temperature anomalies across the ENSO regions, as the El Niño was active during that Winter.
It was, however, a weaker event than what is forecast for this Winter season.
Also, the QBO analysis below shows that the 09/10 season had a very clear negative (east) QBO during Winter. Image by NASA analysis.
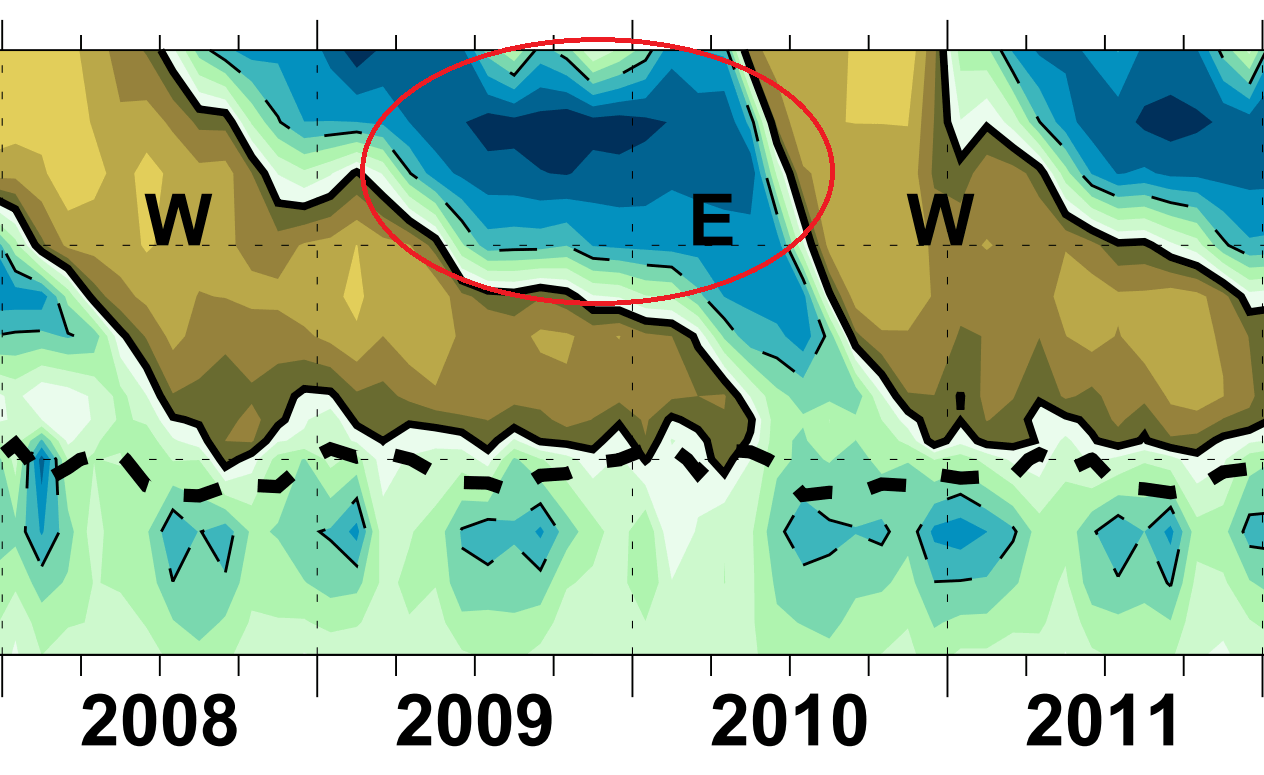
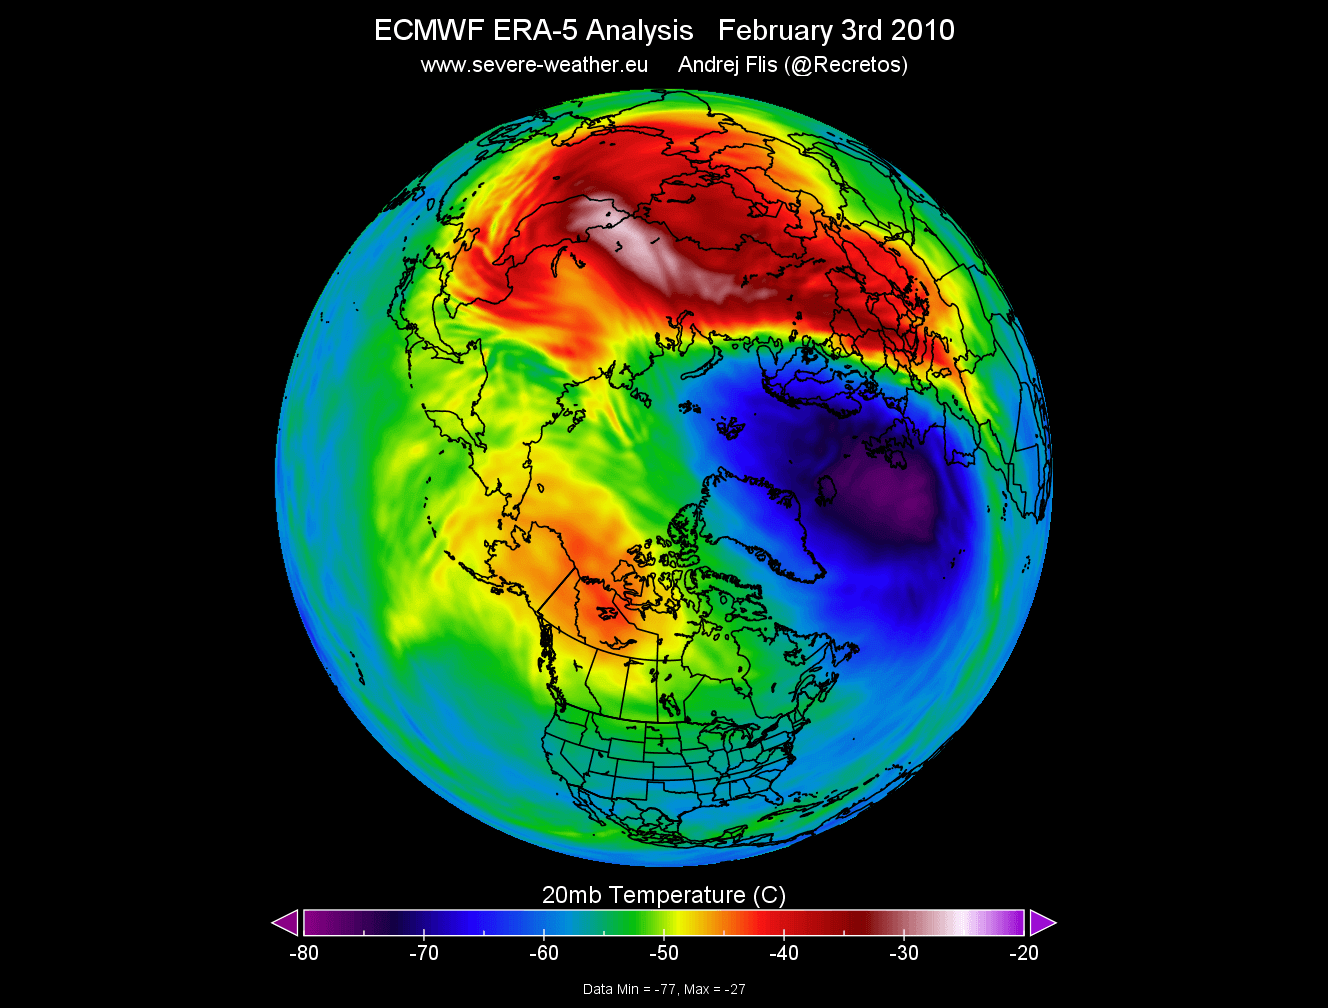
The Polar Vortex also began to collapse in late January and early February that season. The image below shows the vertical pressure anomaly from the surface to the upper Stratosphere. You can see a strong anomaly in the center of the image, starting from late January, covering the whole observed atmosphere.
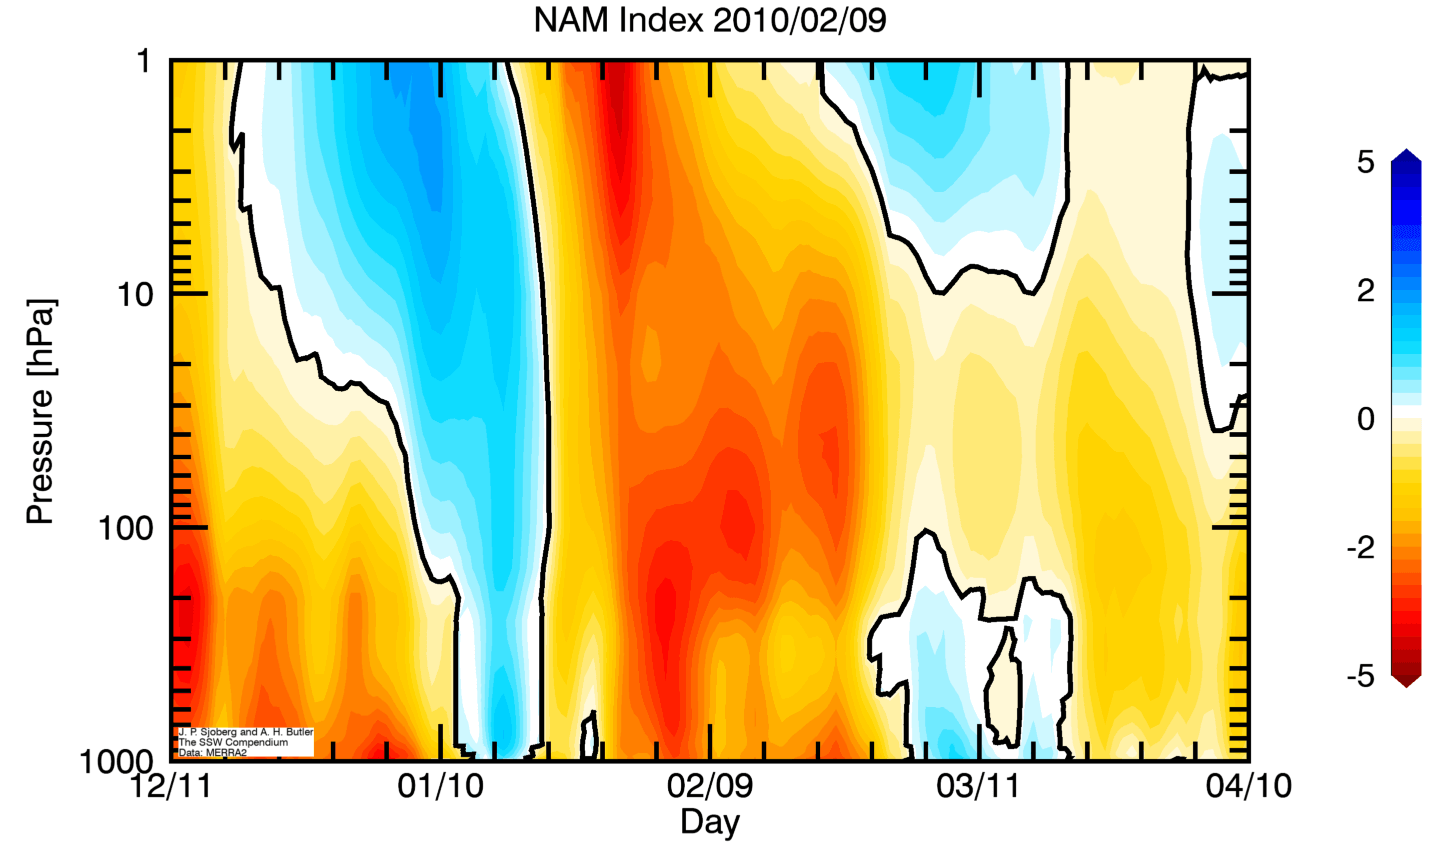
Below is an ECMWF temperature analysis of the mid-stratosphere in early February of that Winter. This is a direct view of the stratospheric warming event. The Polar Vortex was weakened and displaced out of the North Pole. A strong warming wave engulfed the Stratosphere, collapsing the stratospheric circulation.
This strong, sudden stratospheric warming event disrupted the Polar Vortex. In the image below, you can see the surface temperature anomaly following 30 days after the stratospheric warming event.
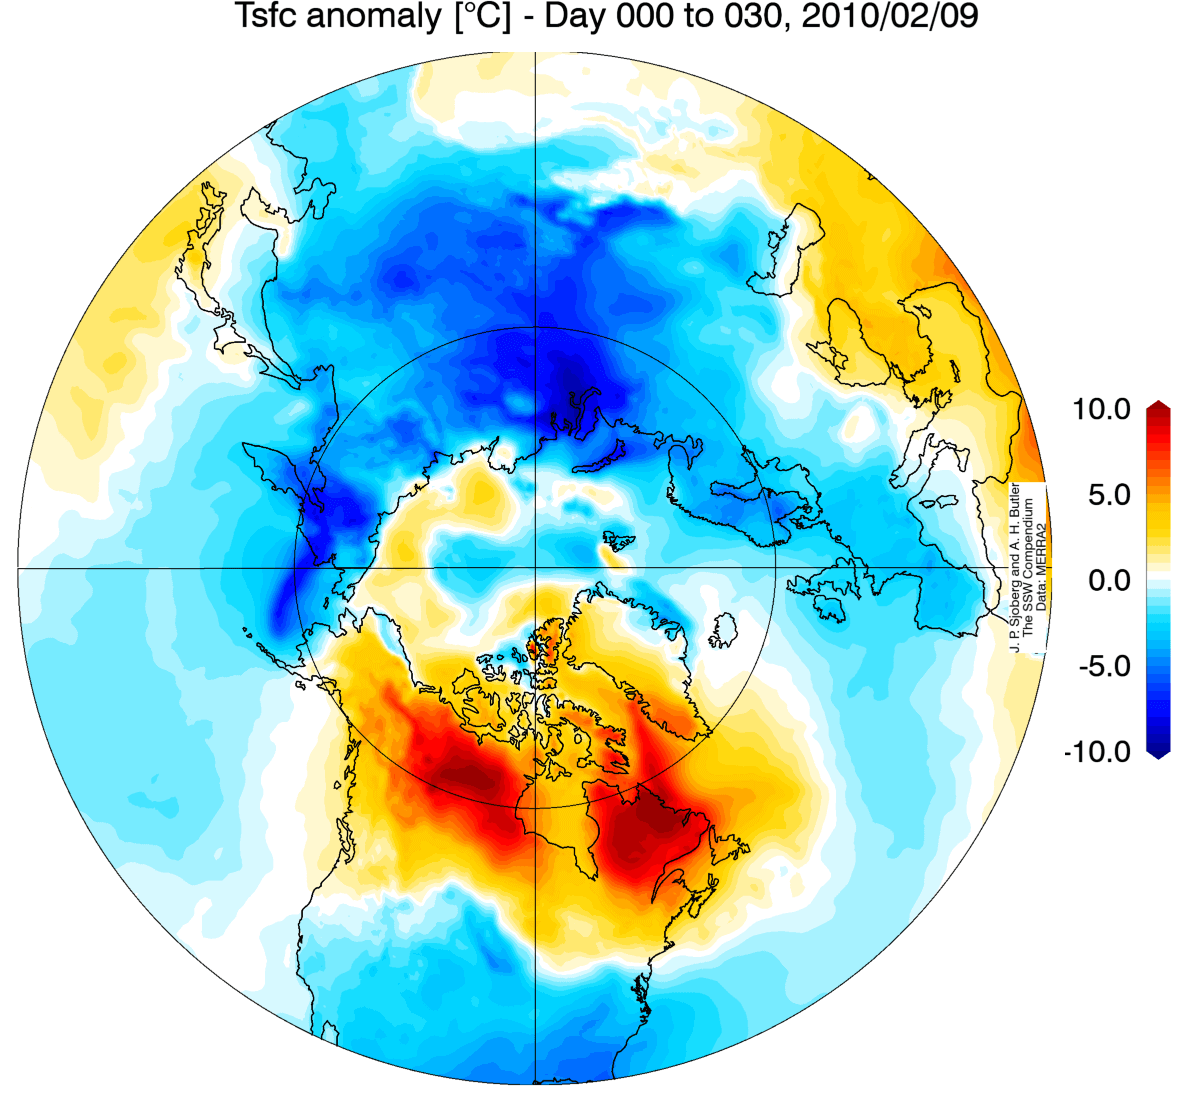
You can see that following the Polar Vortex collapse event, the cold air was displaced south as the jet stream got disrupted. Most of the United States and Europe were experiencing colder than normal Winter weather.
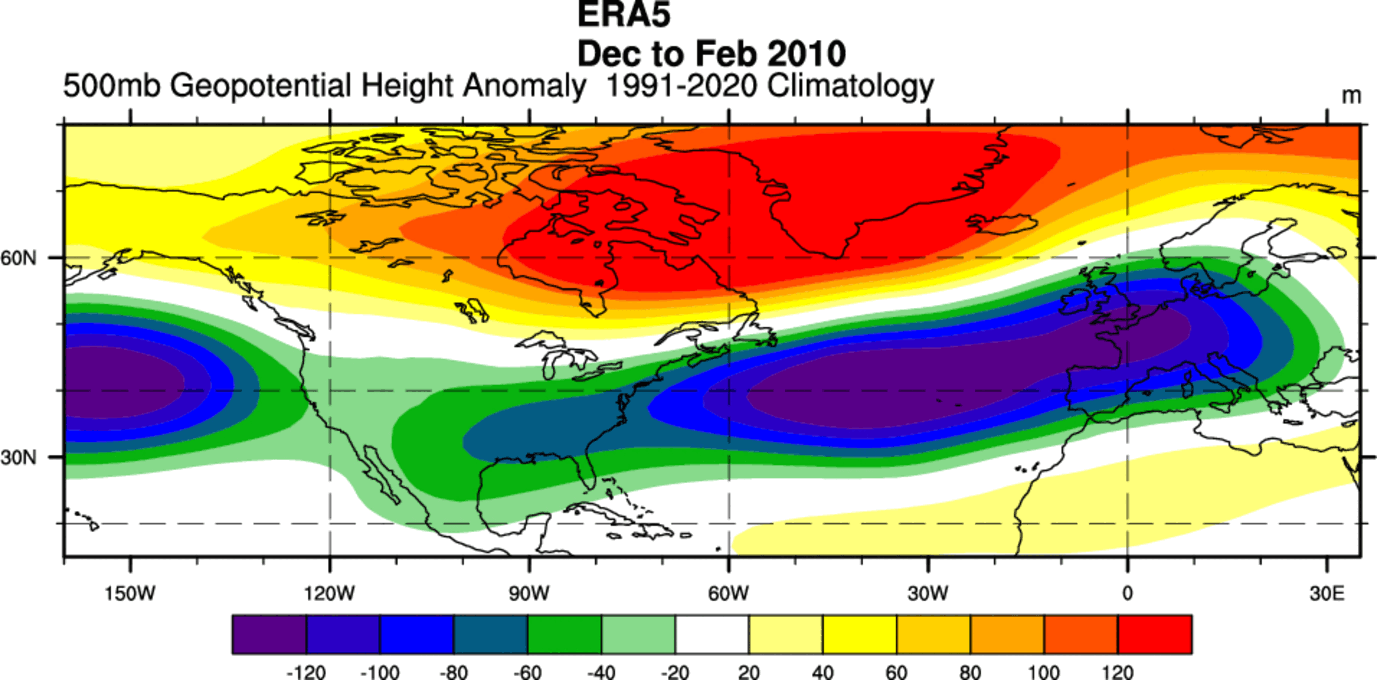
Looking at that whole Winter season, the pressure pattern shows a strong blocking high-pressure system over Greenland and eastern Canada. That heavily disrupted the jet stream pattern, unlocking the cold polar air and releasing it into the United States and Europe.
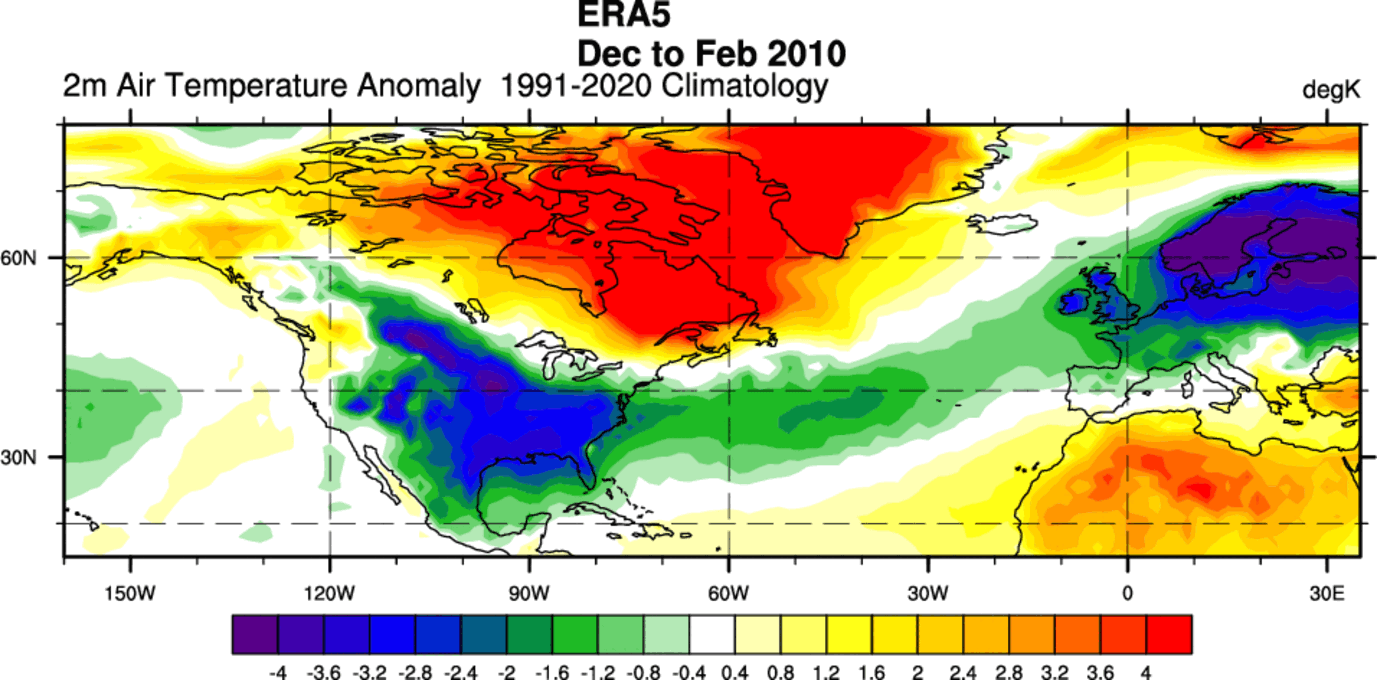
The temperature anomaly for that whole season shows mostly colder than normal across the United States and most of Europe. Strong warm anomalies were present over northern and eastern Canada.
It is impossible to quantify how much of this cold winter pattern was due to El Niño and how much was due to the QBO or the Polar Vortex collapse. But the combination of factors made it possible, and a colder-than-normal Winter occurred.
Since then, there has been another Winter season with an El Niño and an east QBO. The Winter of 2014/15. That Winter did not feature a Polar Vortex collapse but was still, on average, colder than normal across much of the eastern half of the United States and Canada.
The pressure pattern for that Winter was different than the one in 09/10, with much fewer polar high-pressure systems.
So now we know which are the three large-scale factors that will be at work this Winter and how they came together in the past.
But the main question remains: will this Winter also be colder across the United States, Canada, and Europe, as suggested by many news articles and indicated by past weather patterns?
To at least try and answer that, we will look at the latest Winter forecast update, released this month.
WINTER SEASON 2023/2024 FORECAST UPDATE
We will look at the global long-range models and their early hints for Winter 2023/2024. Graphics are from the Copernicus Climate project and Tropical Tidbits.
All these forecasts are an average picture over three meteorological winter months and show the general prevailing weather patterns.
Even if the models were 100% accurate, it does not mean such weather conditions would last for three months straight. It only suggests how the weather patterns might look most of the time.
ECMWF WINTER SEASON EARLY FORECAST
The ECMWF model is often referred to as the most reliable model. But no long-range/seasonal forecast can ever be called “reliable “.That is because we are only looking at trends and how the weather patterns might evolve on a large scale over a long period.
The latest ECMWF forecast update shows a typical El Niño weather pattern. We have a low-pressure zone over the North Pacific and a belt of low-pressure anomalies across the southern United States and northern Europe.
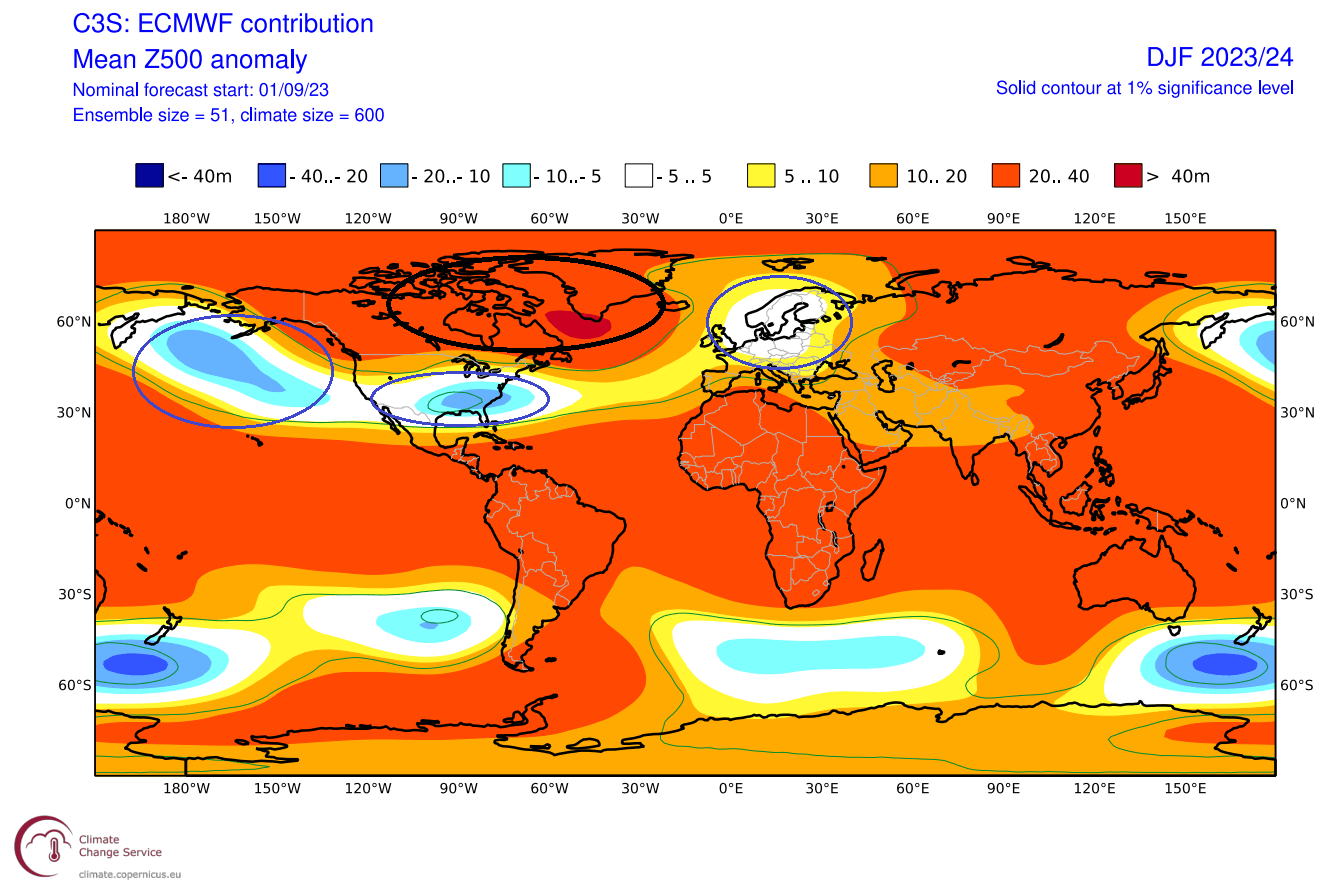
You can also see a large high-pressure anomaly zone over Canada and Greenland. This is a strong west-based negative NAO pattern. It looks very similar to the 09/10 Winter pattern that we presented above.
This is not a coincidence; the model calculations usually come up with similar scenarios when large-scale factors are in similar states as in the past.
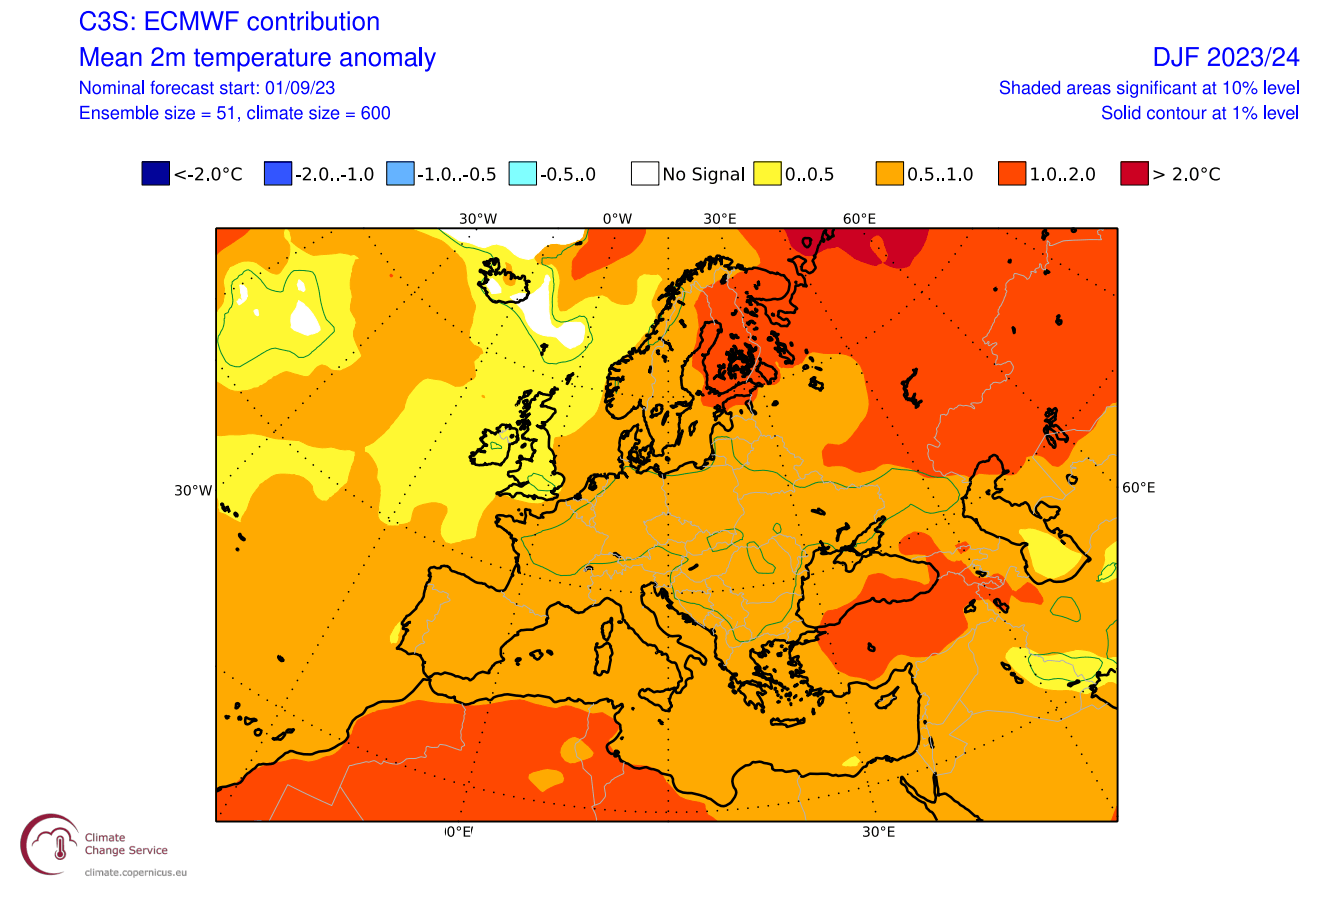
Looking at the surface temperature forecast over Europe, we see the surface temperatures are mostly above normal across the continent. This is perhaps not the most compatible temperature picture based on the pressure pattern, as it should be at least neutral, if not colder, in the central and northern parts.
Over North America, the ECMWF forecast shows much above-average temperatures over most of Canada. Warmer than normal temperatures are forecast over the northwestern United States and across the upper Midwest. But notice a lack of any anomalies over the rest of the United States.
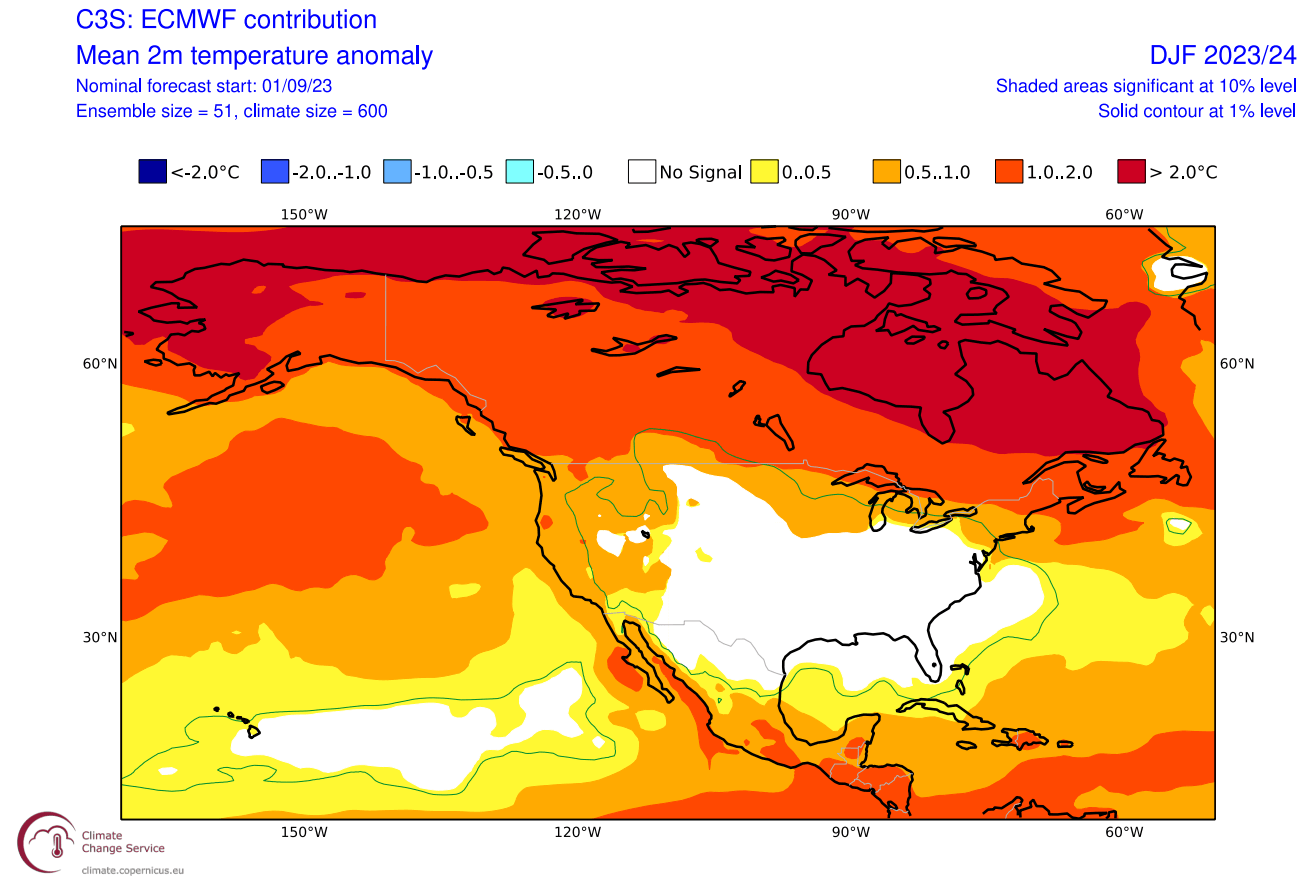
This neutral zone with no signal looks very similar to the area seen colder in the 09/10 Winter analysis above. The model has its limitations in this range, but this shows where the main potential for colder-than-normal winter temperatures is.
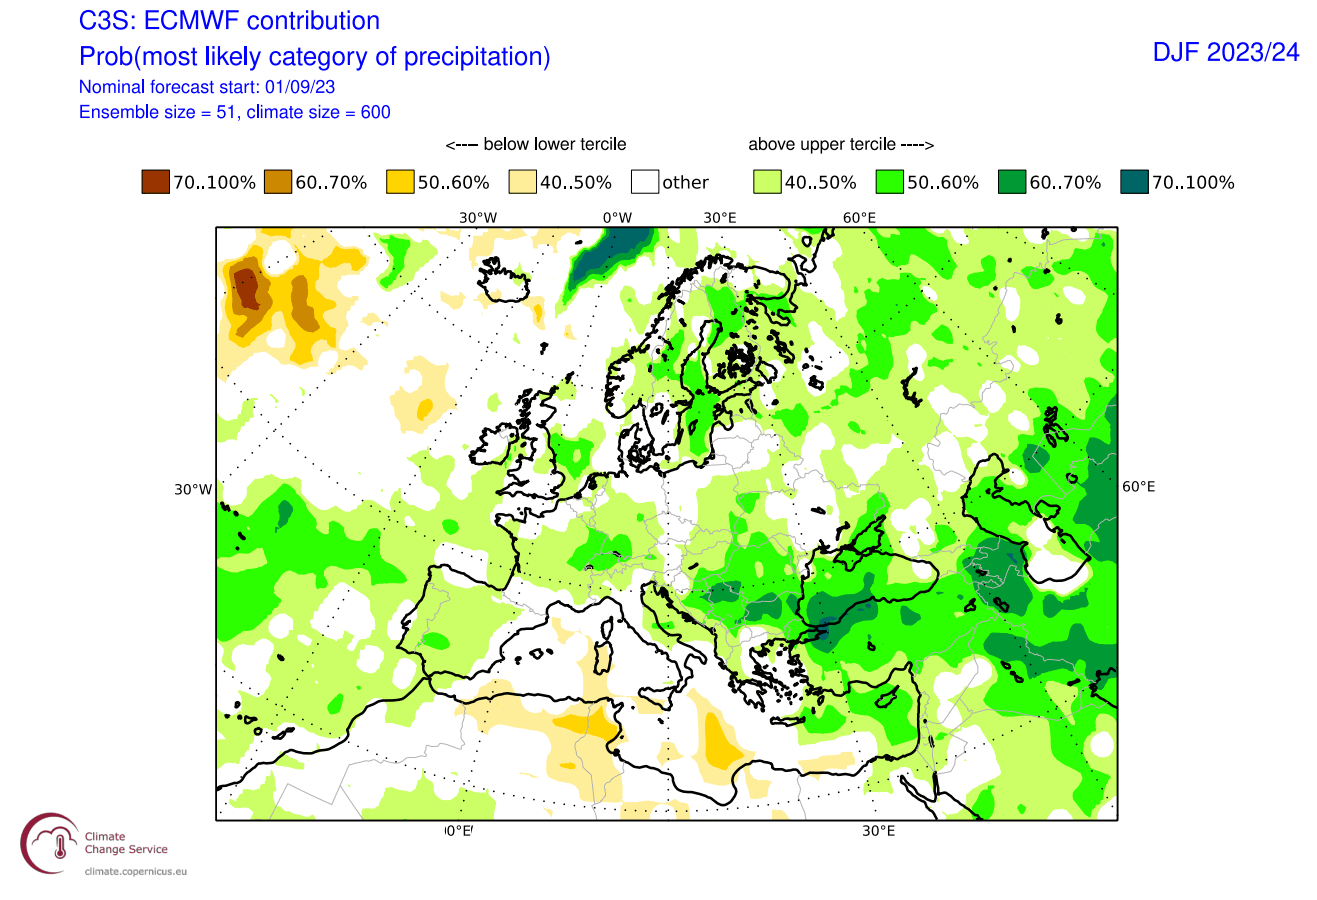
Going to the precipitation forecast, we can see Europe having a strong signal for above-average precipitation. This means increased snowfall potential, mostly over the Alpine region and Scandinavia.
The precipitation anomaly forecast for North America shows an expected El Niño-type pattern over Canada and the United States. You can see drier conditions over the Northwestern United States, around the Great Lakes, and southwestern Canada.
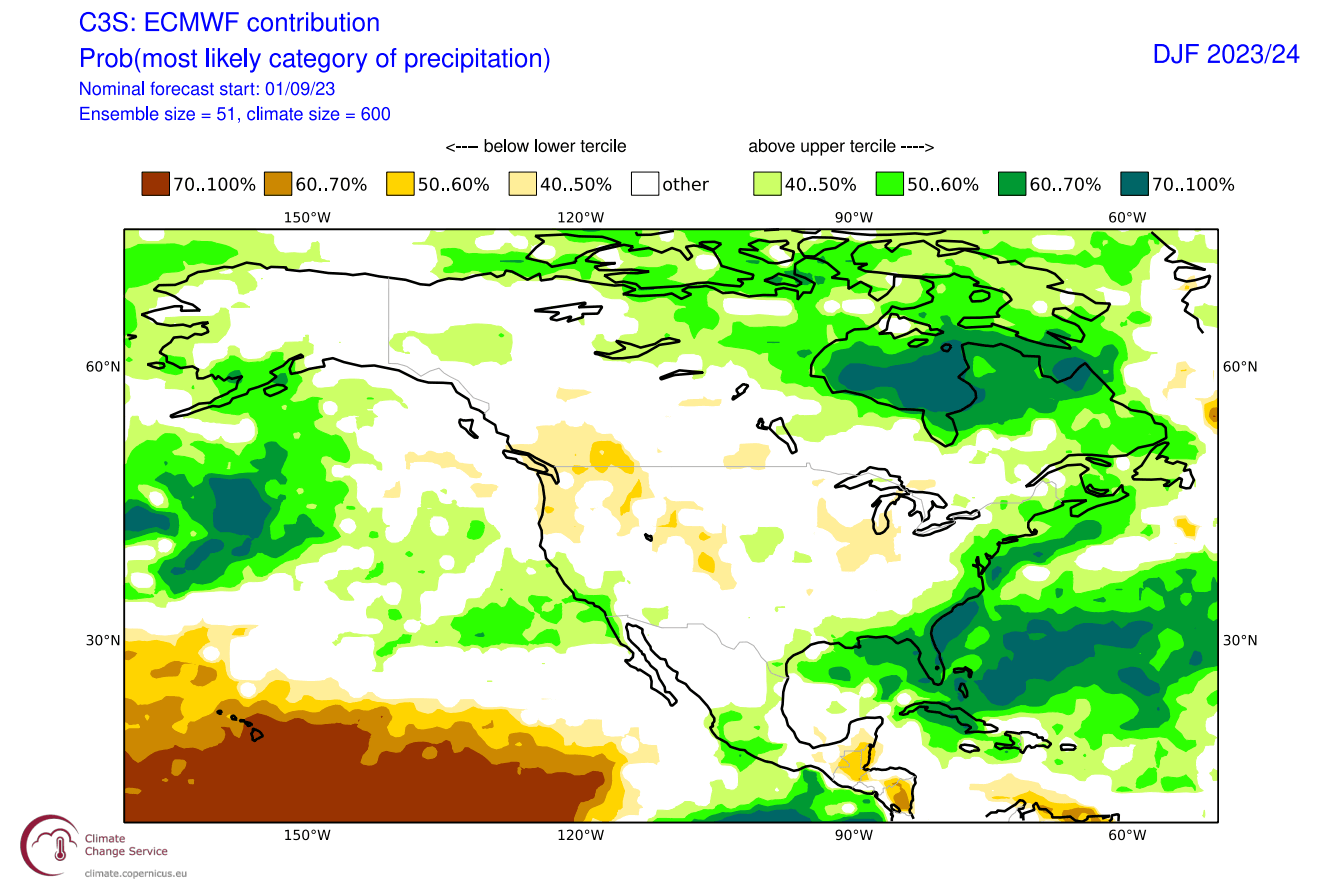
The strong subtropical jet stream of El Niño brings increased precipitation across the southern and eastern parts of the United States and the plains. More precipitation is also forecast across northeastern Canada.
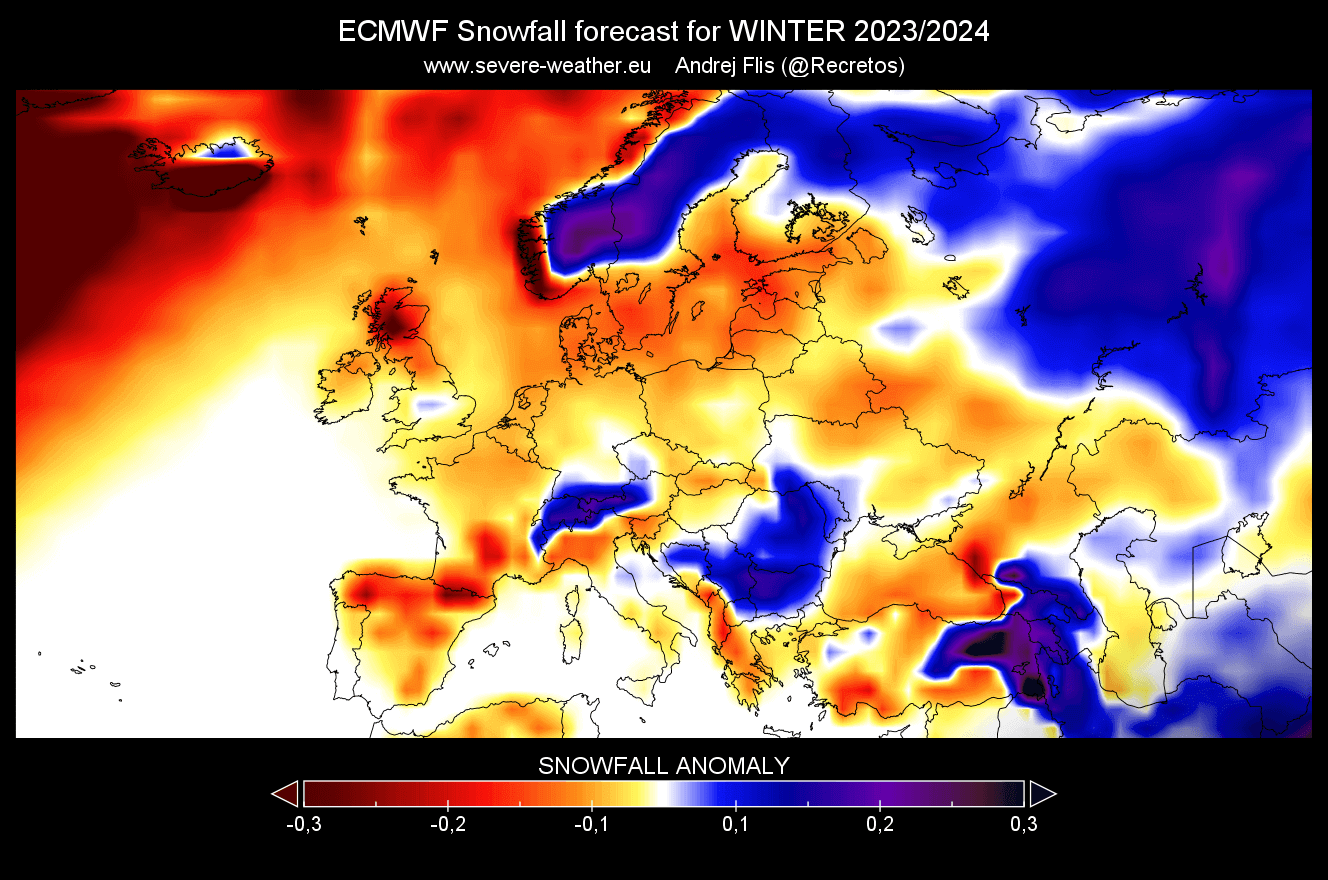
WINTER 2023/2024 SNOWFALL FORECAST UPDATE
As always, we produced a special snowfall forecast from the ECMWF data provided by the Copernicus-EU project. It covers the December-February period of the meteorological Winter season.
Over Europe, we see mostly below-average snowfall, except over parts of Scandinavia and the Alpine region and towards the southeast.
Over North America, ECMWF suggests much less snowfall than usual in the western United States and across the Midwest. That is mainly due to less precipitation. But you can see trends of increased snowfall forecast over the central plains and the southern United States.
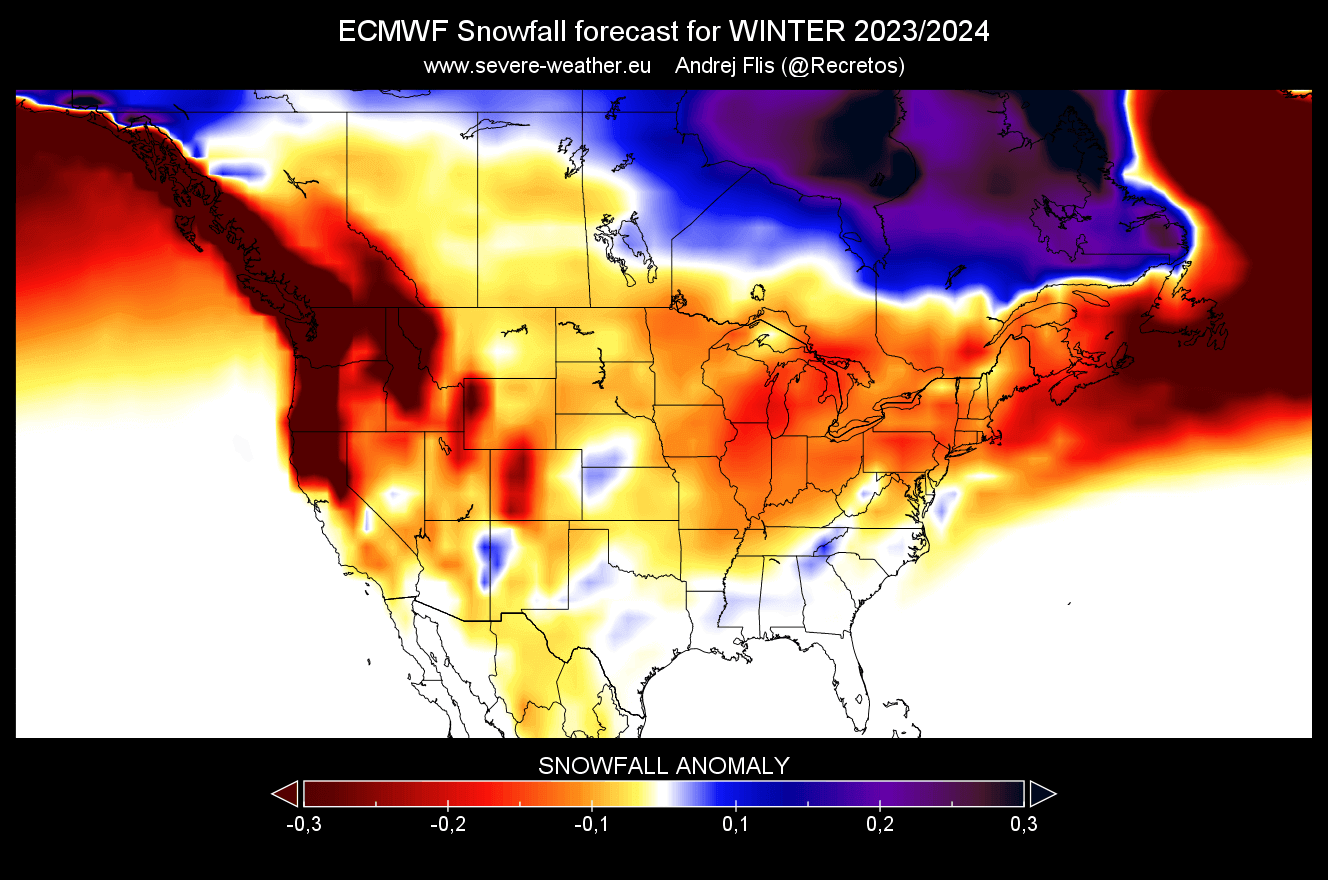
The increased snowfall potential is also seen over parts of the lower Ohio River Valley. Looking at Canada, you can see less snowfall across the southern parts of the country, while more snowfall is forecast across northern and northeastern Canada.
Remember that this is a 3-month average, and the month-to-month snowfall potential can be very different. Especially going into the mid and late-Winter season.
We will do a monthly breakdown of snowfall in our next long-range forecast article. There, you will see a very different snowfall pattern each month.
MID-WINTER FORECAST
As seen in the past Winter analysis, major changes tend to manifest from early to mid-winter. Therefore, we will look more closely at the January-March period, which also tends to have more cold air events than the December-February period in recent years.
The monthly NAO forecast from ECMWF below actually hints at negative trends in mid-and-late Winter. That would increase the chances of cold events in the eastern United States and parts of Europe.
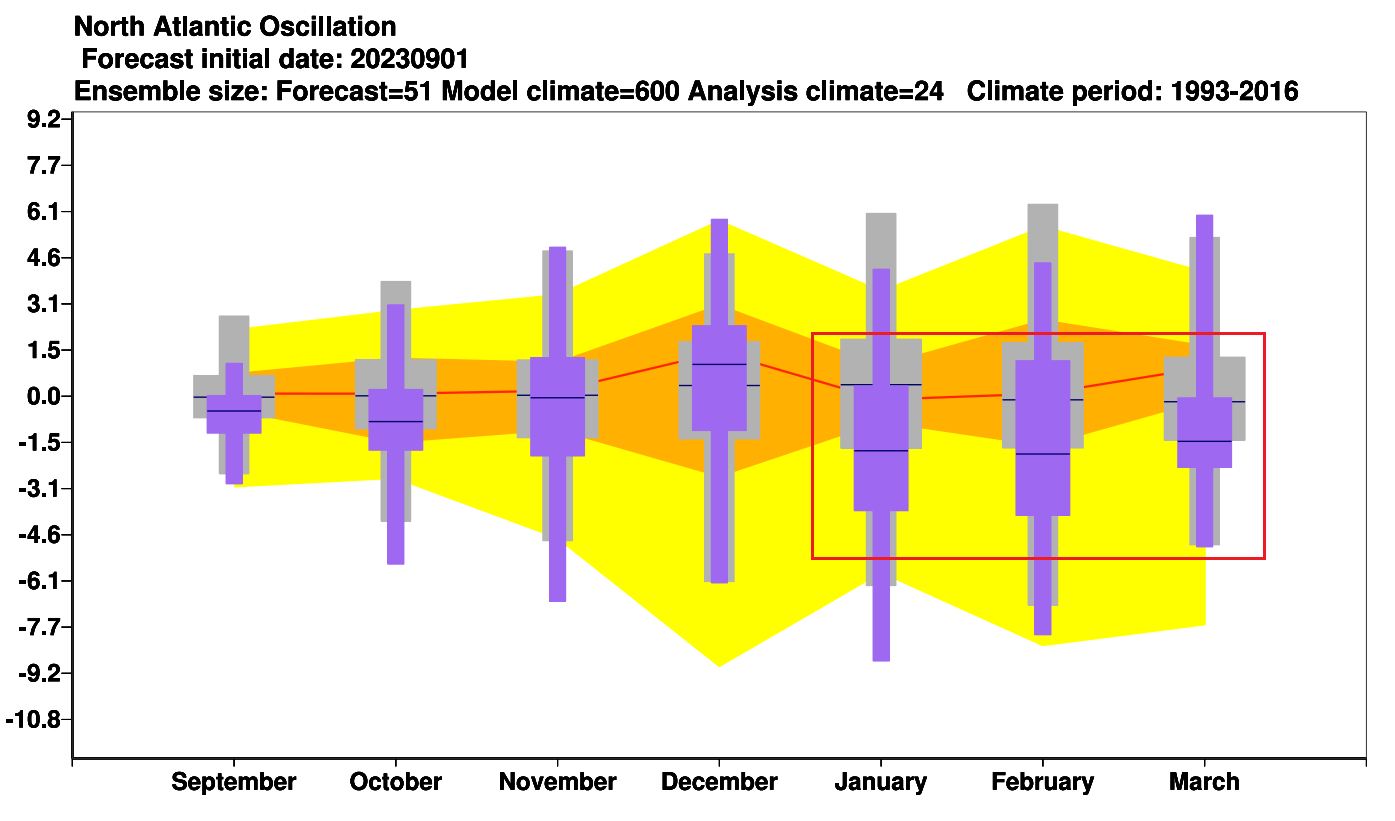
A negative NAO index means a higher pressure over the far North Atlantic and Greenland, which means a weaker polar jet stream circulation over the North Atlantic. It creates an easier release of colder air into the eastern United States and parts of Europe.
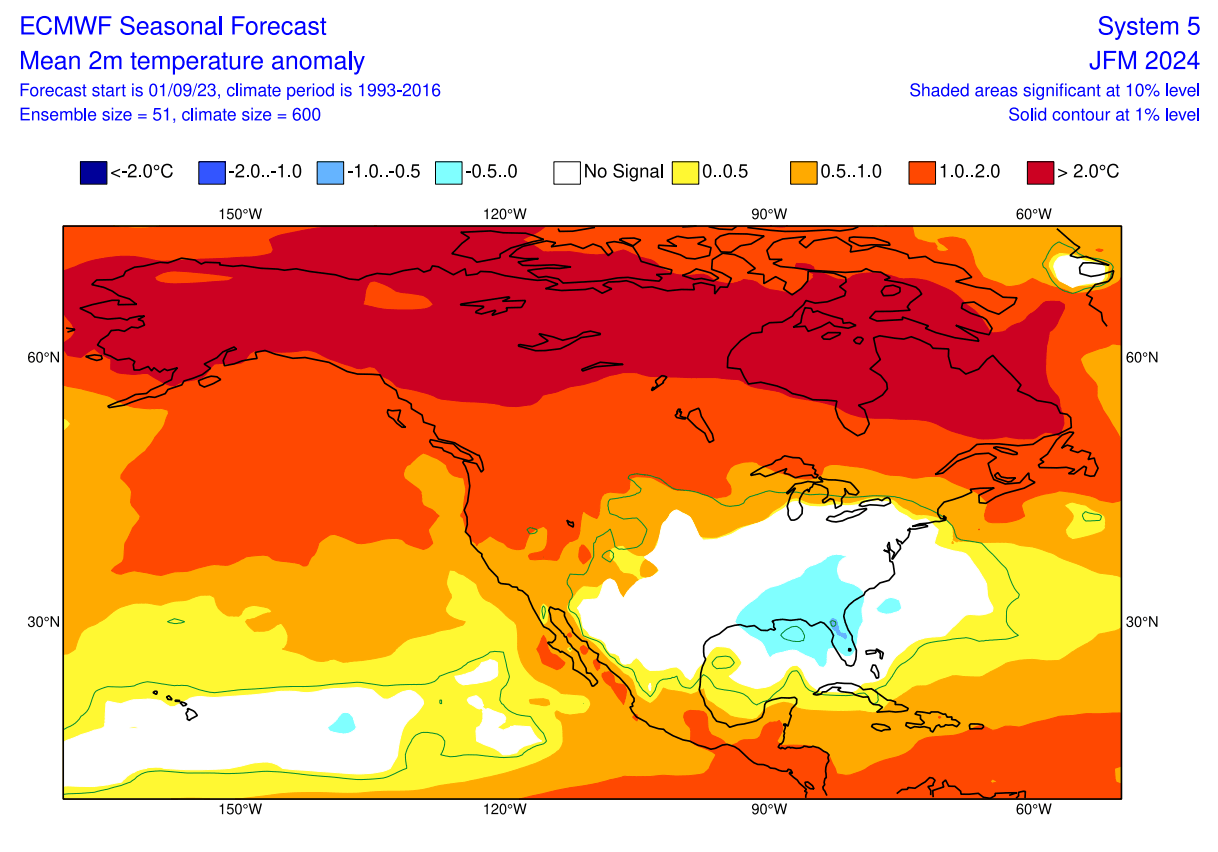
Looking at the January-March temperature for North America, we can finally see the colder anomalies starting to appear in the southeastern United States. Compared to the December-February average above, this tells us that there is more cold potential in the middle and later parts of Winter 2023/2024.
Below is the EMCWF stratospheric temperature anomaly forecast for the 30km/18.5miles altitude. You can see that the ECMWF is actually forecasting a warmer polar region, which indicates a potentially weaker Polar Vortex.
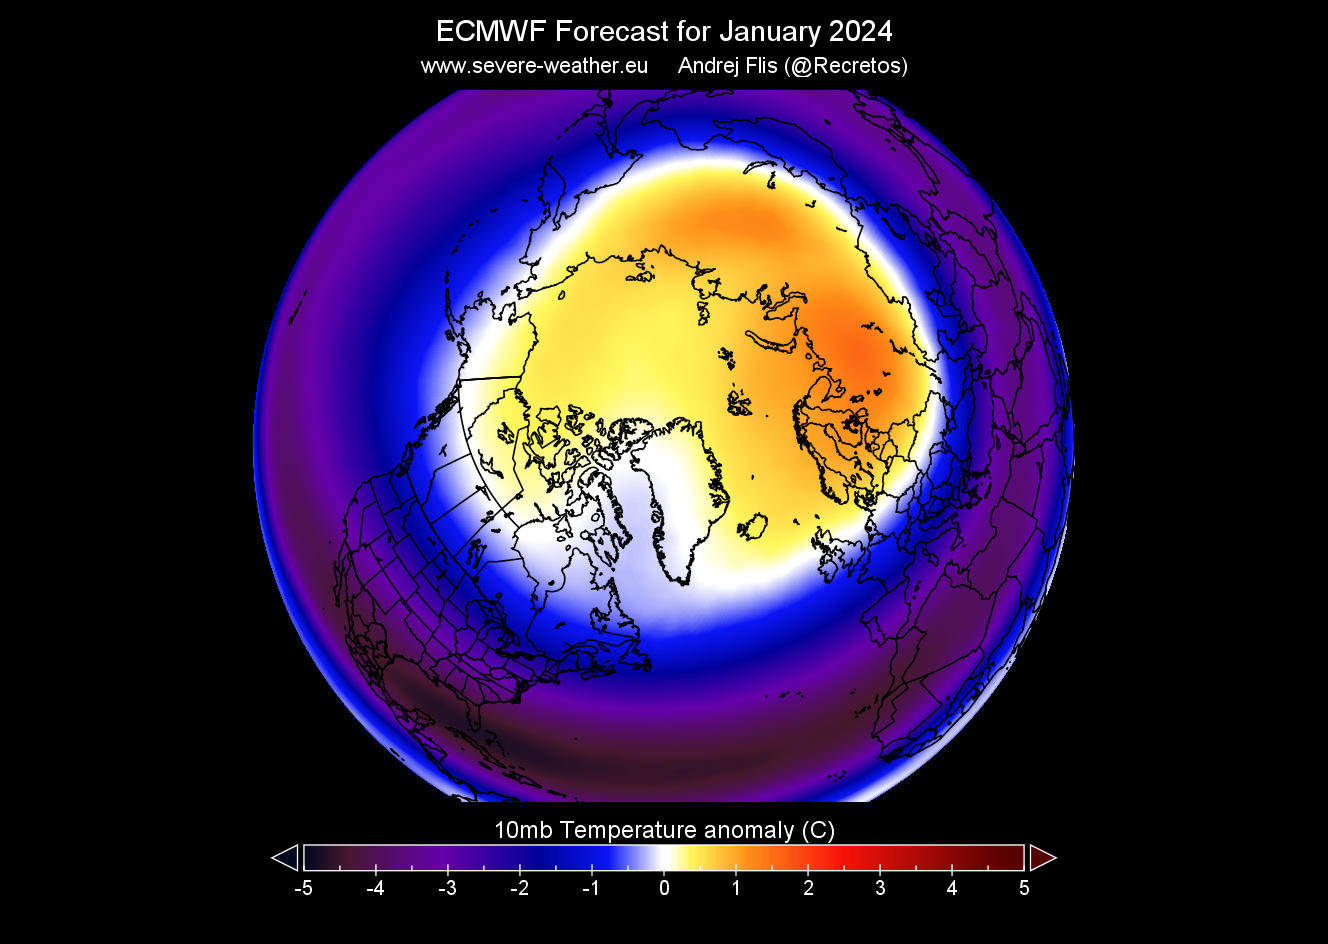
We cannot forecast an SSW this far out into the future, but seeing a weaker Polar Vortex and a colder signal for the January-March period does have some significance. We will monitor this development closely.
CANSIPS WINTER SEASON FORECAST UPDATE
Our second model is the CanSIPS model from the Canadian met-office. The name stands for Canadian Seasonal and Interannual Prediction System (CanSIPS). It consists of two coupled atmosphere-ocean-land physical climate models.
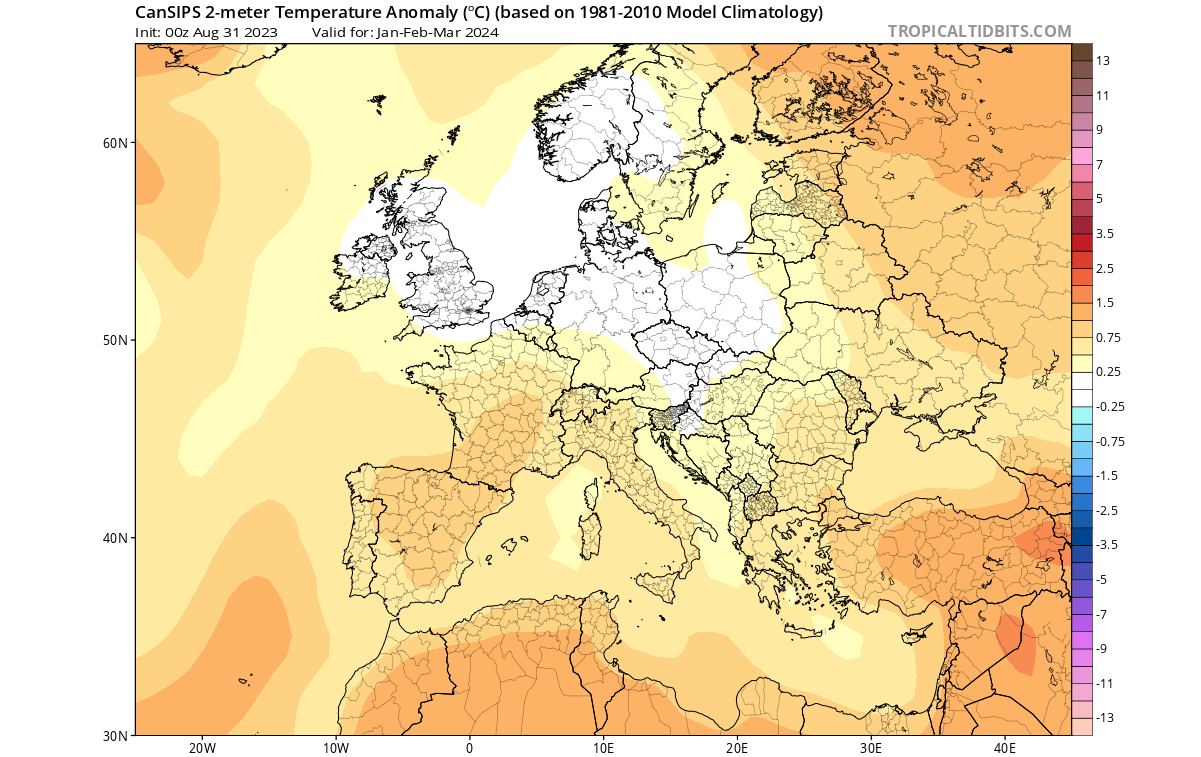
Since the ECMWF has shown a colder Winter signal in the January-March part of the Winter, we will focus this model on that period to see if it shows a similar forecast/solution.
This model shows an interesting Winter pattern similar to the 09/10 season, which we have already seen in the historical analysis. A high-pressure zone sits over Canada and Greenland, with low-pressure systems over the United States, North Pacific, and Europe.
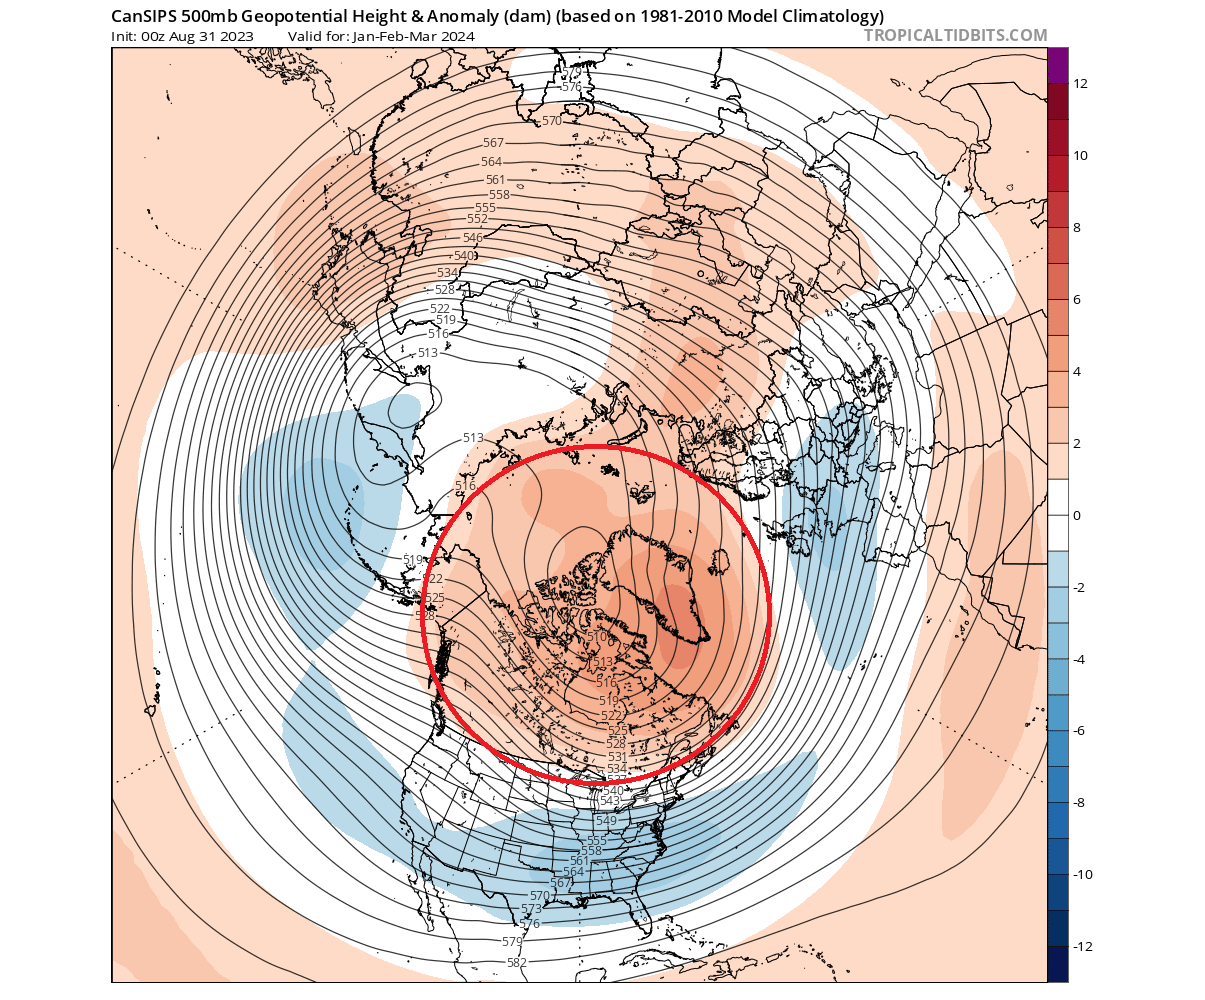
This is a blocking pattern with a good mid to late-winter cold scenario potential across the central and eastern United States and parts of Europe.
Looking closer at surface temperatures over Europe, we see the warm anomalies focused over the central and southern parts of the continent. No cold anomaly is seen in the forecast, but a neutral zone is present over parts of northern and central Europe under the low-pressure anomaly.
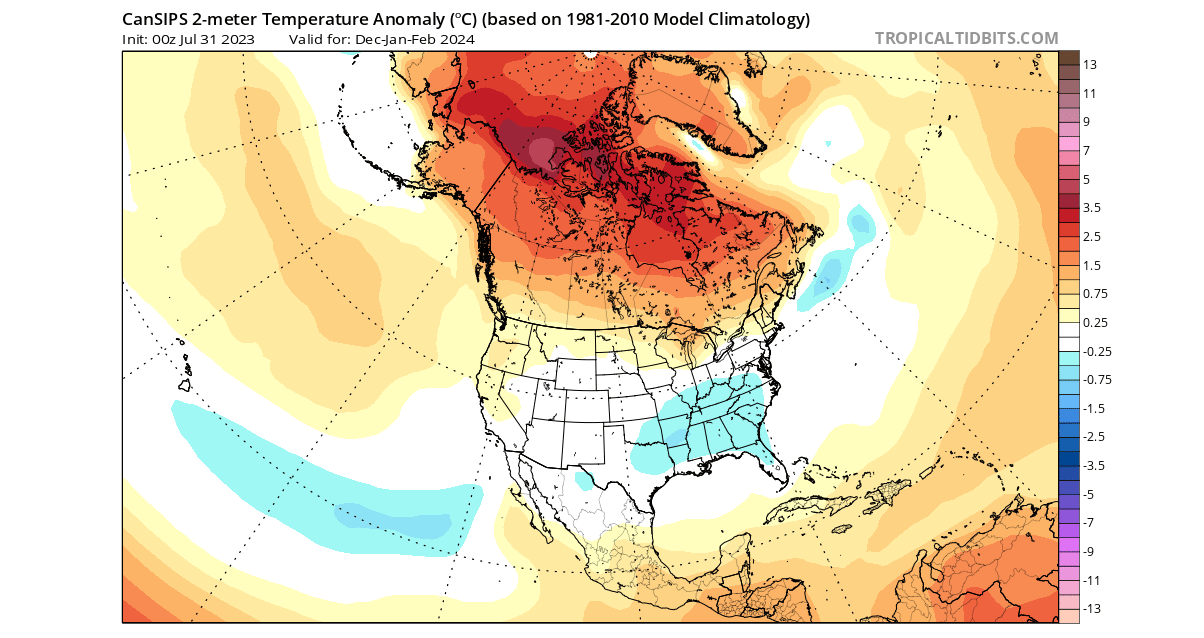
Over North America, the CanSIPS model forecasts a large area of warm anomalies across Canada and the far northern United States. But notice that it forecasts a larger cold air anomaly across the southern and eastern parts of the United States. This is very close to the ECMWF forecast.
Below is the CanSIPS forecast for February, the last official Winter month. You can see a much broader area of colder than normal temperatures, spanning much of the eastern United States and extending across the Midwest.
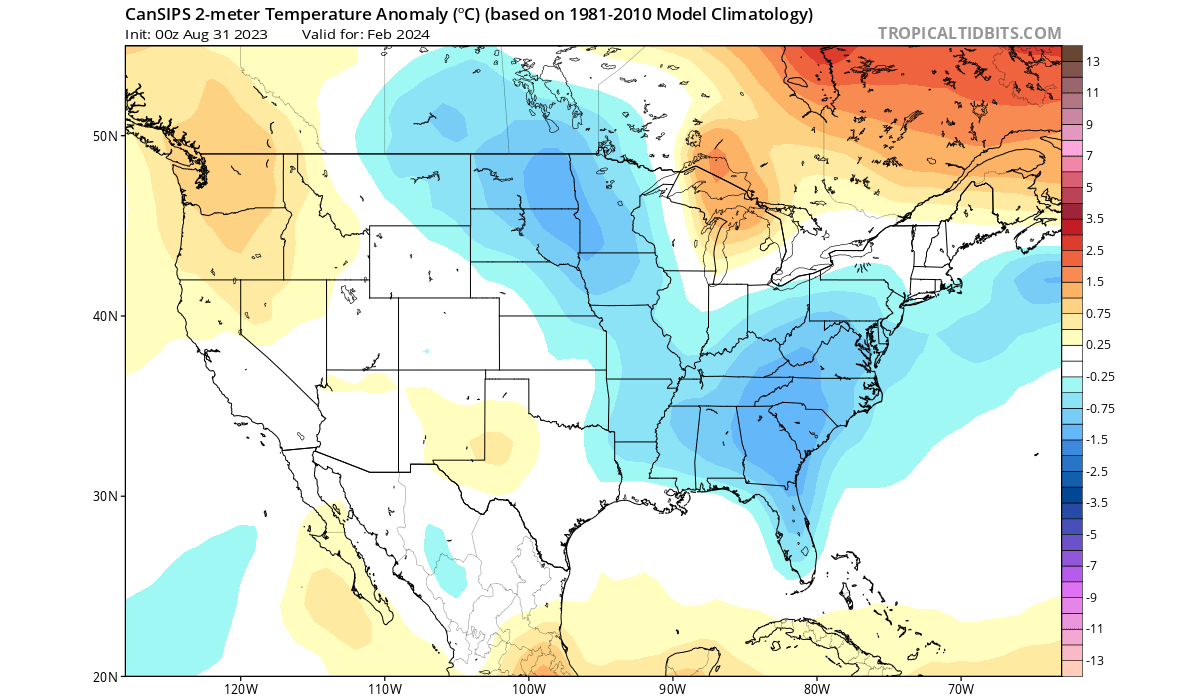
This shows that the Winter of 2023/2024 might be off to a slower start across the central and eastern United States. But current forecasts indicate colder temperatures and more snowfall potential in the mid and late part of Winter across the central and eastern United States.
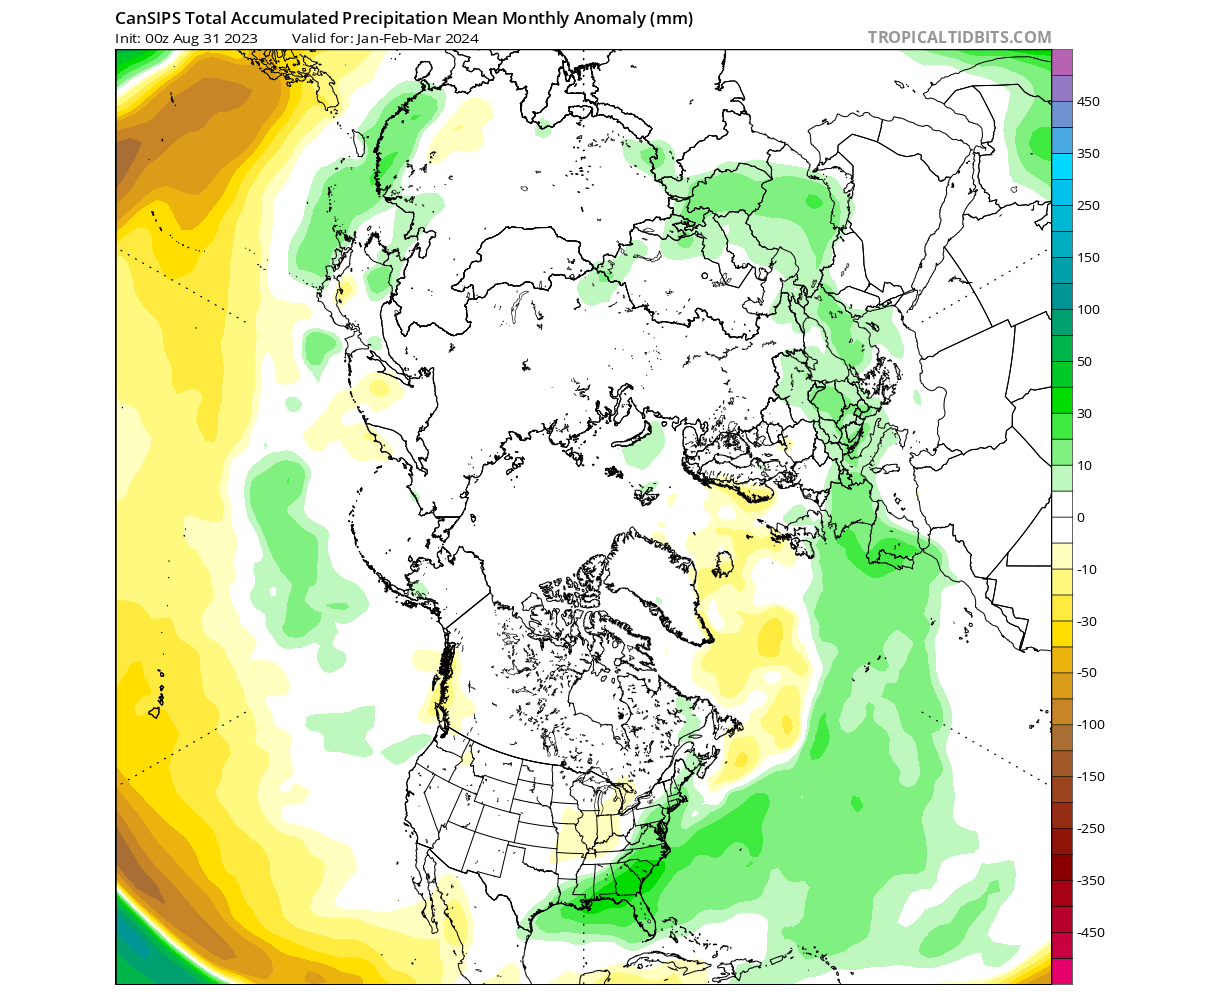
Looking at precipitation overall, you can see more precipitation across the southern and eastern United States and much of Europe. Drier conditions are forecast by CanSIPS across the Midwest and the Pacific Northwest.
Overall, the CanSIPS is very close to the general idea of the ECMWF. Other models also show the tendency to develop colder temperature anomalies later in Winter across the southeastern United States.
As always, the outcome will depend on all major factors coming together. We can see the El Niño playing its role and the QBO mixed in. What is a question mark for now is the potential for a Polar Vortex collapse event.
OFFICIAL NOAA WINTER FORECAST UPDATE
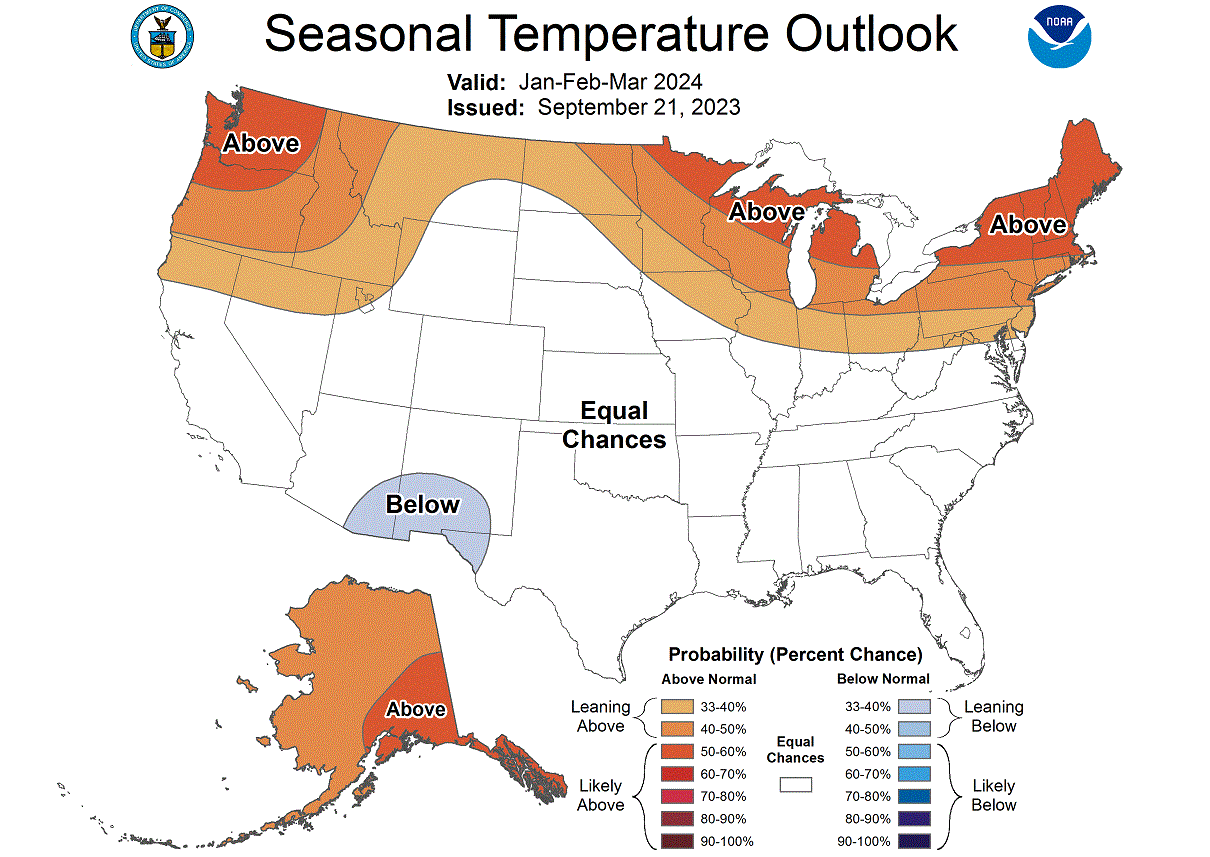
Below is NOAA’s official Winter 2023/2024 temperature forecast update for the United States released this month. Note that we chose to show the January-March period, as it currently looks to have more potential for colder scenarios.
The first image shows the temperature probability, with warmer chances in the northern United States. The southern half of the country is in a neutral zone, the same as the models above indicate. A colder signal is emerging in the southern United States, but this will likely shift further to the east as we get closer to Winter.
The official precipitation forecast is also quite similar to the models above. We see an equal-to-higher probability for more precipitation (and snowfall) over the southern and eastern parts of the United States. Less precipitation is expected across the northern parts of the United States.
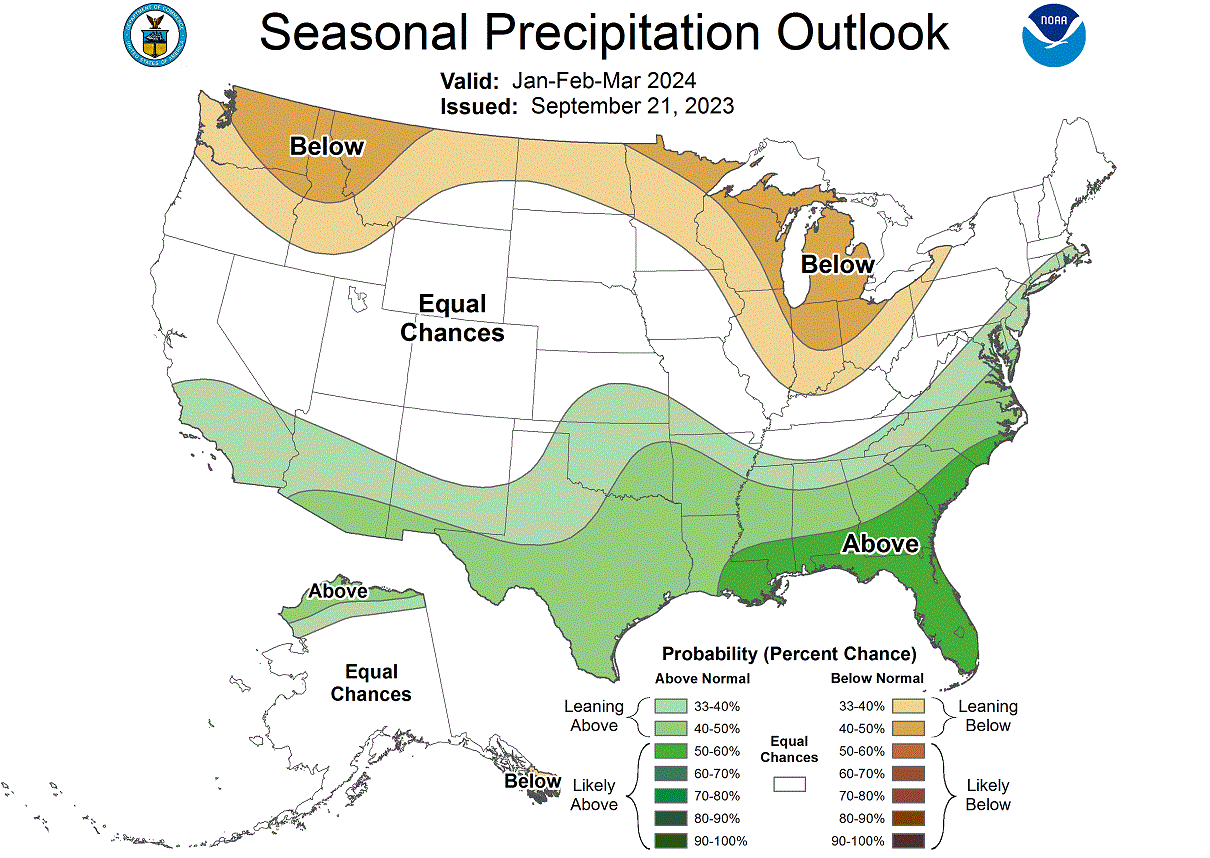
These outlooks from NOAA are usually more reserved, as they use more (different) model solutions, so the adjustment to a large-scale signal change is more gradual.
WINTER CONCLUSION
To answer the original question in the title, will this Winter really be colder than normal? The answer is worth only as much as the best forecast. But it does seem so at the moment.
But, of course, not everywhere. The best probability for a colder-than-normal Winter is at the moment over the central, southern, and southeastern United States. Better odds for that look to be in the January-March period.
That is based on the historical data for similar large-scale weather factors and the latest forecasts. The real extent of the cold anomalies cannot be determined at this range. But the signal is in the forecast, supported by past data analysis and known impacts.
As for Canada, it looks to be warmer than normal. But since the country is further north, it does not mean much now, apart from the changed snowfall distributions.
Europe also looks to be around the neutral to warmer-than-normal range, with a colder scenario more likely in the middle and later parts of Winter.
We will keep you updated on the developing weather trends in the coming seasons, so make sure to bookmark our page. Also, if you have seen this article in the Google App (Discover) feed, click the like button (♥) there to see more of our forecasts and our latest articles on weather and nature in general.
Don’t miss: