A strong oceanic anomaly is forming in the North Pacific, connecting into the global weather system. These strong anomalies can impact regional weather and marine ecosystems and will also impact seasonal weather from Autumn and into Winter 2024/2025.
Ocean anomalies are usually the result of pressure and weather changes. However, larger areas of unusual ocean temperatures can also be a sign of large-scale changes, which can have significance for future weather and even whole weather seasons.
We will look at the latest anomalies developing in the North Pacific, how they form, and what they can tell us about the weather for the upcoming weather seasons, especially Winter 2024/2025.
OCEAN AND ATMOSPHERE
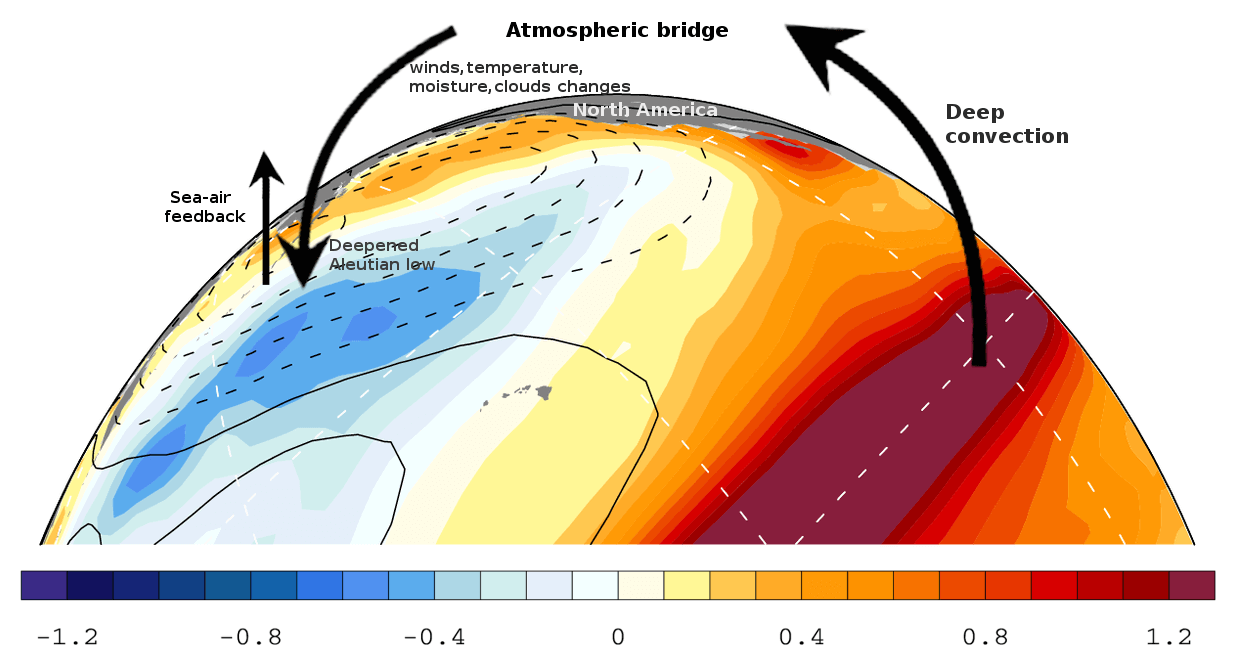
Oceans and the Atmosphere are connected on multiple levels. In this specific case, there is a known connection between the tropical regions and the North Pacific. Deep convection in the tropics influences the pressure patterns further to the north.
This is called an “Atmospheric Bridge.” The image below shows the connection between the tropics and the North Pacific. It is currently developing with opposite anomalies, with warmth in the northern Pacific and cooling starting in the tropics. But the process is the same.
In the image below, we have the Pacific-North American pattern (PNA). This pressure pattern is influenced by tropical activity and anomalies and helps to shape the weather patterns across the United States and Canada.
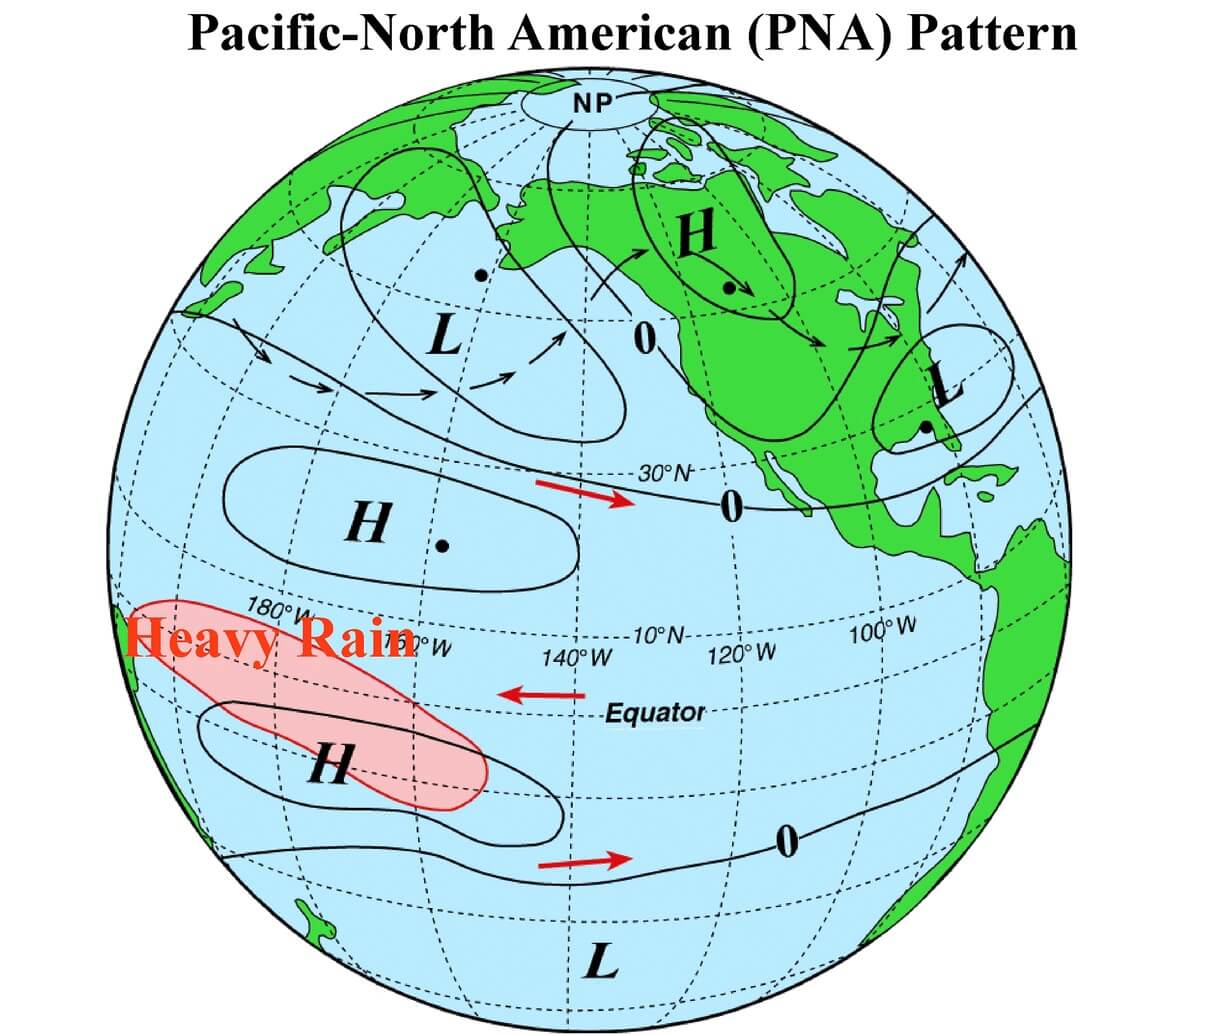
The reason we show you this is to emphasize the importance of ocean anomalies and their impact on the pressure and rainfall patterns, impacting our daily weather down the line.
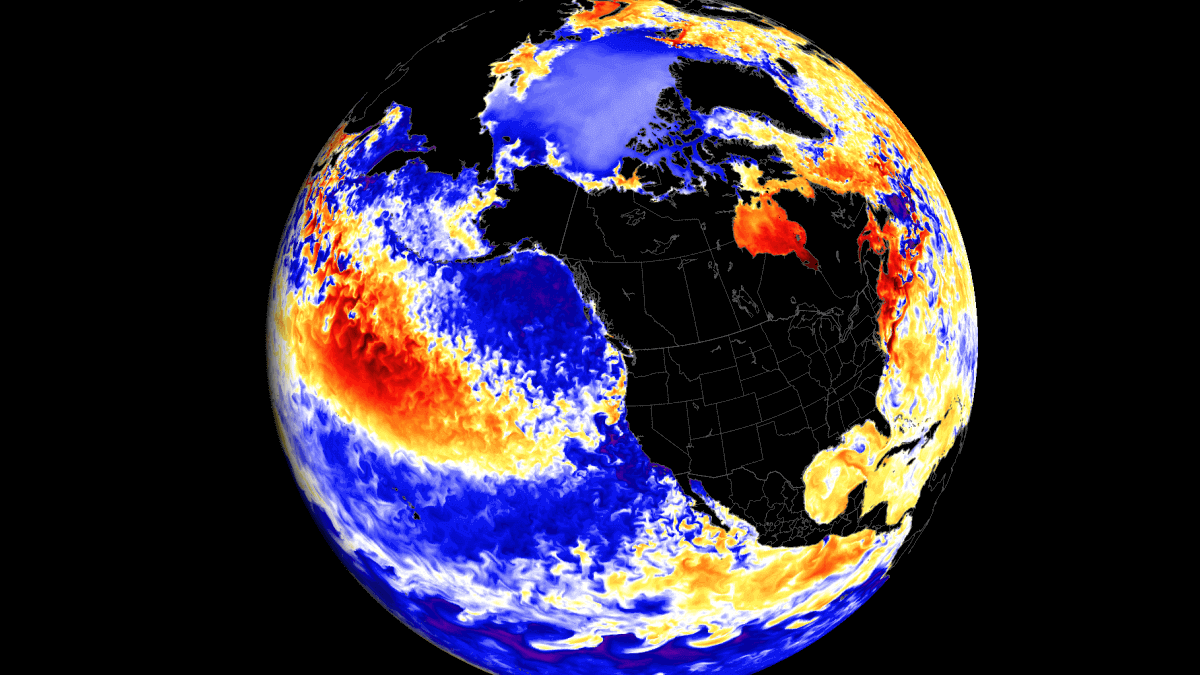
Below is a current global ocean temperature anomaly map showing where ocean temperatures are warmer/colder than normal. You can see an unusually strong warm anomaly in the North Pacific Ocean related to the atmospheric and oceanic changes in the past weeks.
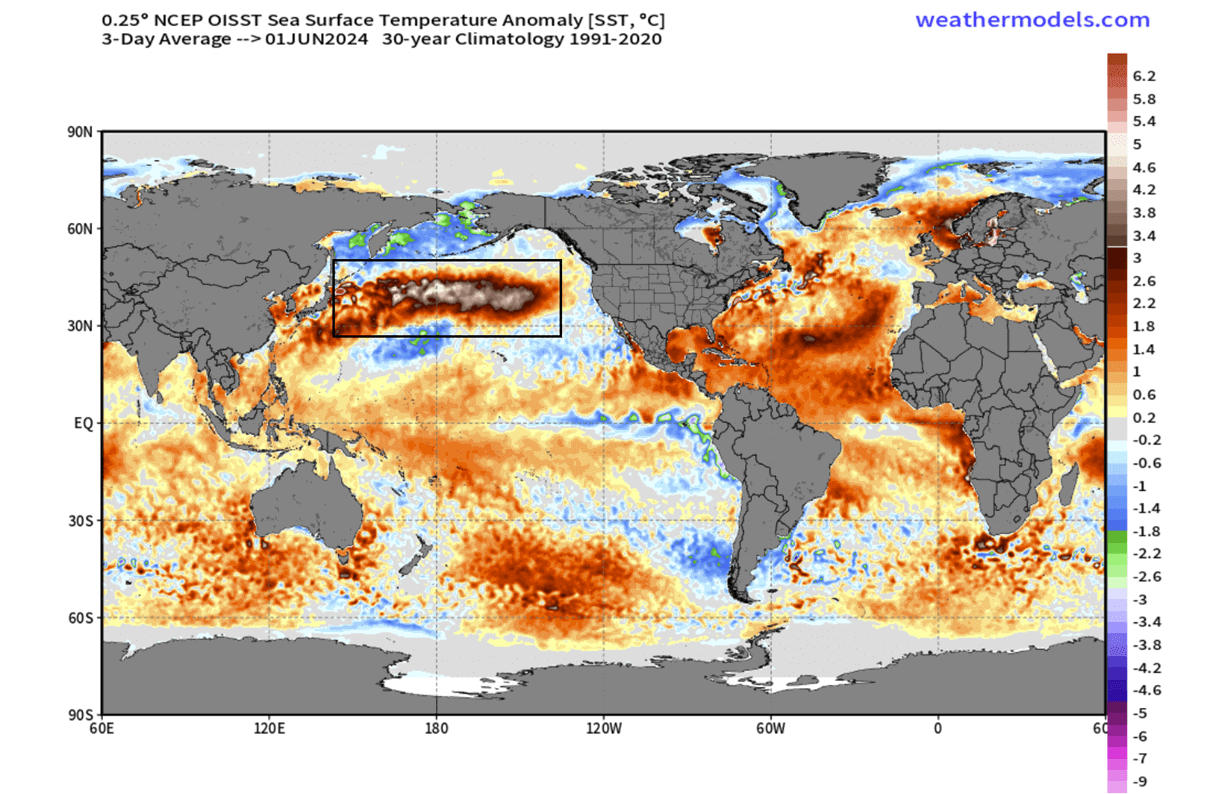
Looking closer at the Pacific Basin, we can see the nice temperature contrast between the tropics and the North Pacific. As mentioned, there is an actual connection, as tropical anomalies are usually reversed in the North Pacific. This is an example of a new “atmospheric bridge” in action, as the tropics shift into a cold ocean phase, and the North Pacific responds with a warm ocean event.

The video below shows the development of the temperature anomaly in the North Pacific in the last month. Notice the cooling of the tropics and the warming in the North Pacific, together forming an example of the “atmospheric bridge”.
All these current anomalies in the North Pacific are occurring in a special region that has known patterns and phases between cold and warm anomalies, called the Pacific Decadal Oscillation (PDO), and plays a major role in seasonal weather patterns.
PACIFIC DECADAL OSCILLATION
As the name suggests, The Pacific Decadal Oscillation (PDO) is an ocean pattern in the Pacific. More specifically, it covers the North Pacific Ocean, from the central regions to the west coast of North America.
The PDO is a term used to explain climatic events covering a large area of the Pacific Ocean over several decades. It has two phases: warm (positive) and cold (negative).
The image below shows a typical PDO pattern. A horseshoe anomaly pattern is present along the west coast of North America, which tells us which phase is currently active. Below is an example of a cold-phase PDO pattern, which has been active for the past few years.
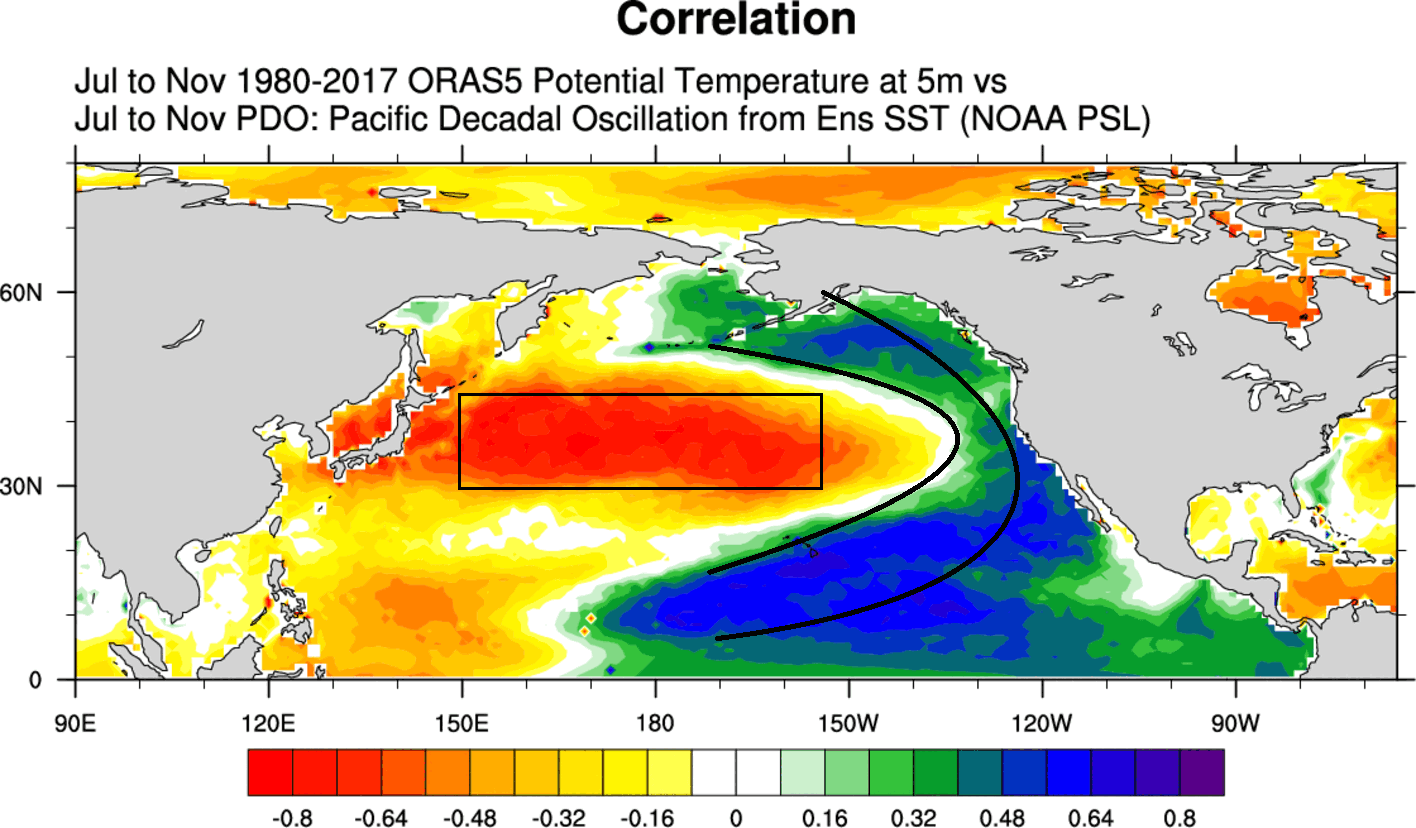
An opposite anomaly usually develops in the central North Pacific. So, in a cold phase, a warm pool develops over the central North Pacific, and a cold develops in a warm phase.
As we have seen in the anomaly images above, the central North Pacific features a strong warm pool, and cold anomalies are present along the west coast of North America. That signals a negative PDO phase.
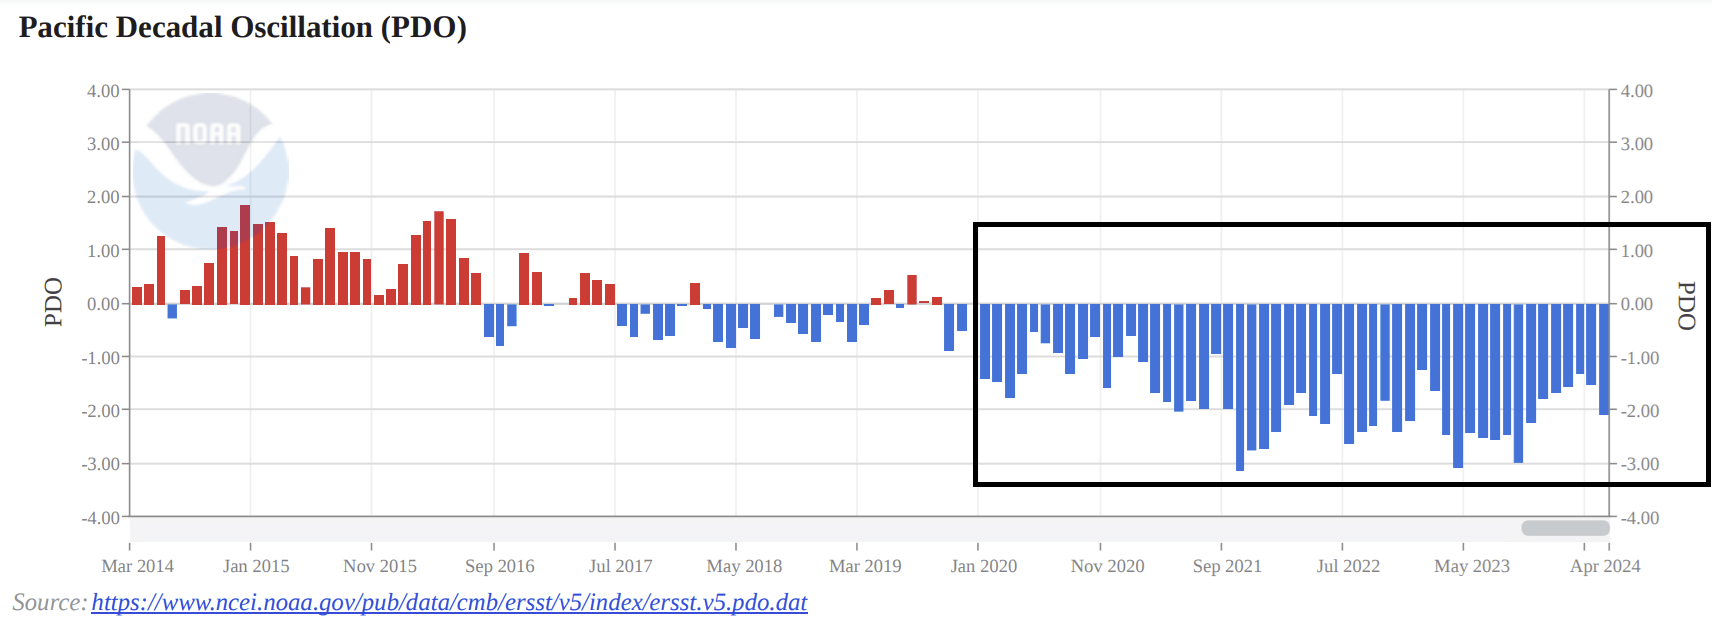
Below is a 10-year graph showing the PDO development since early 2014. You can see that the cold phase began powering up in early 2020 and still lasts today. The graph also shows the transition process from one phase to another, which takes some time.
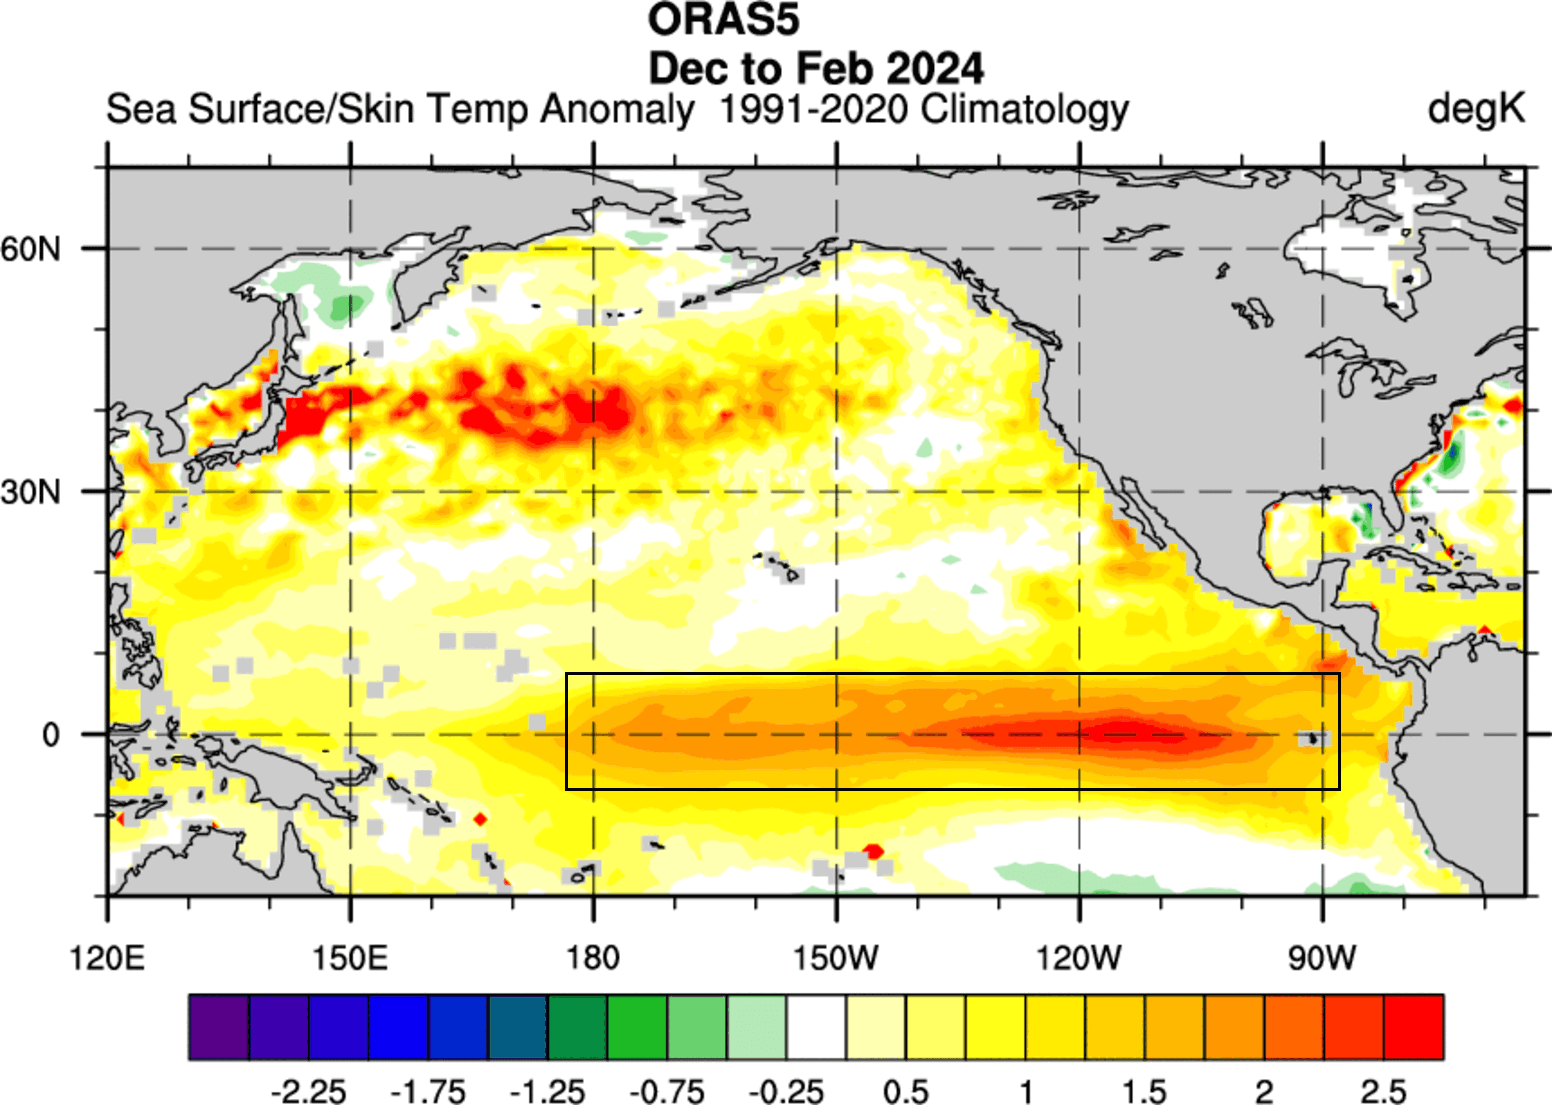
Below is the ocean temperature anomaly for the last winter. You can see a lack of a cold/cool horseshoe pattern along the west coast of North America. The tropical regions were also warmer than normal, thanks to the active El Niño event at the time.
But the latest forecast below for the next three months shows a proper negative PDO starting to appear again. The cold pattern is forecast to emerge along the west coast of the United States and Canada, and the tropics are shifting into a cold La Niña phase.
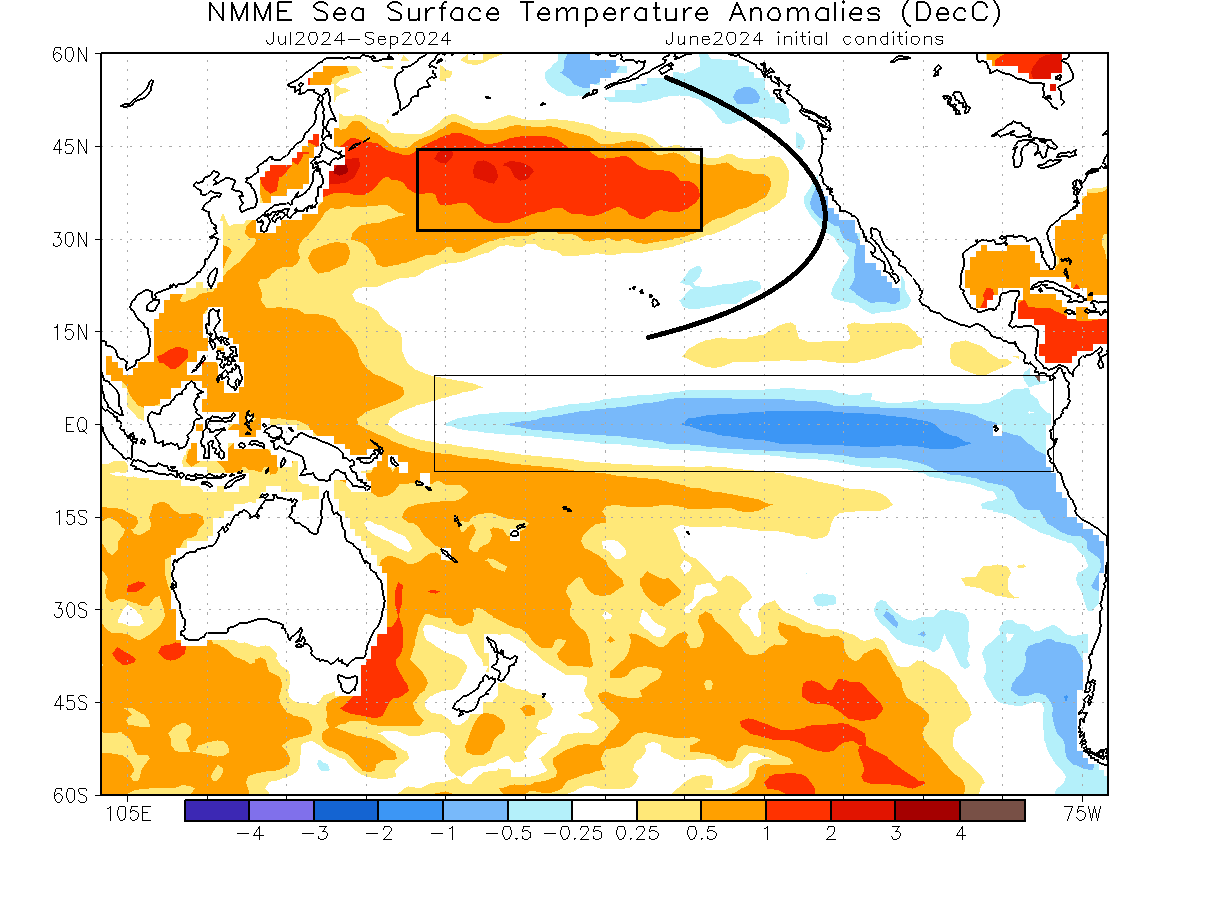
Negative PDO supports a warm pool developing in the North Pacific, providing favorable conditions for oceanic heatwaves and hot spots to develop. This means that we can use this information as an early indicator of certain atmospheric patterns to develop.
PDO AND NORTH AMERICAN WEATHER
But what is the weather importance of a negative PDO? First, the PDO is significant for the climate and seasonal weather patterns in the North Pacific and North America. It has a much less direct influence on Europe, for example, so we will focus only on North America, which has a proper known signal.
Below, you can see the linkage between the pressure patterns and the negative PDO during the Autumn season over the past 70 years. This basically shows the pressure pattern that corresponds to a negative PDO.
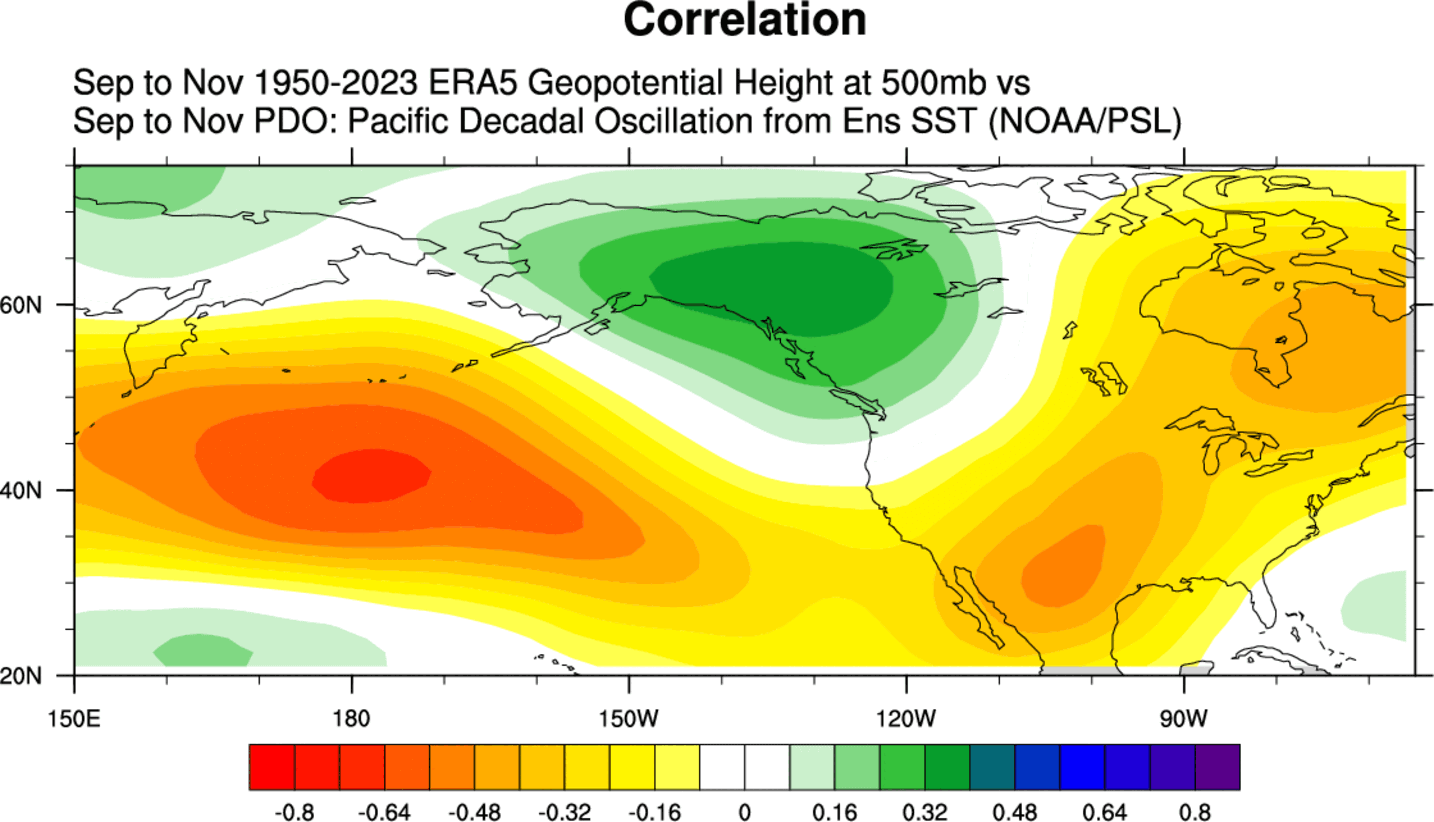
The signal shows that negative PDO supports a high-pressure system in the North Pacific and over the southern United States. But also a low-pressure area over western Canada and the northwestern United States, which helps to strengthen the polar jet stream.
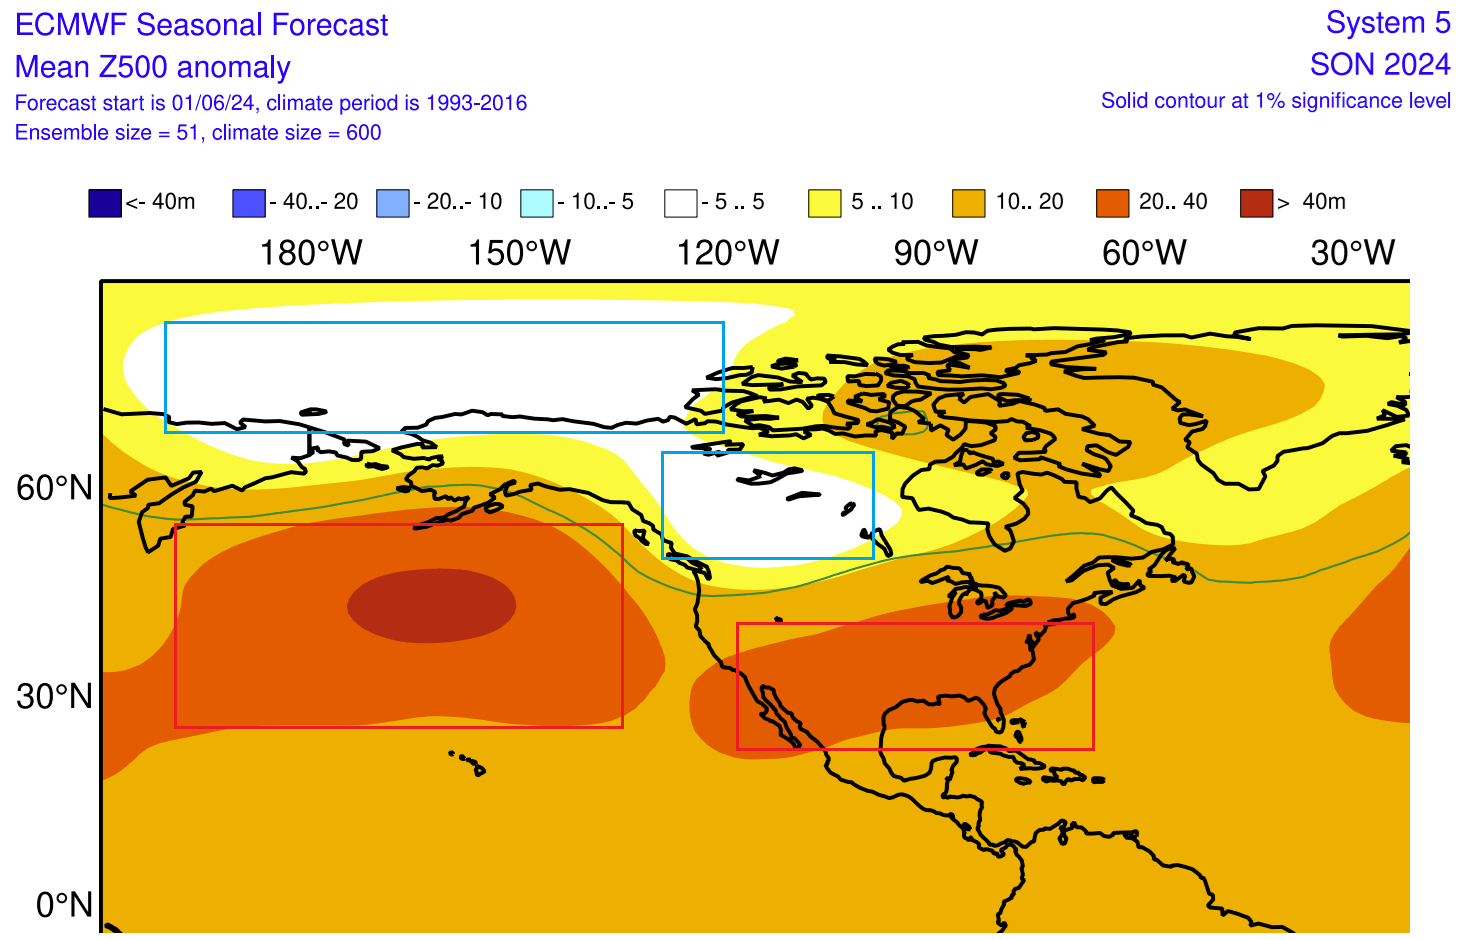
Below is the actual latest long-range forecast from the ECMWF for the same period (September-November). You can see that the forecast strongly resembles the PDO signal above. We have the low-pressure area over western Canada, and the high-pressure over North Pacific and the southern United States.
Looking now at the temperature signal below, we can see the negative PDO signature in the Pacific Ocean with a warm pool in the central North Pacific. Colder-than-normal temperatures are likely in the northwestern United States and western Canada. Over the southern United States, the cold PDO favors warmer-than-average Fall temperatures, extending into the Midwest and southern Canada.
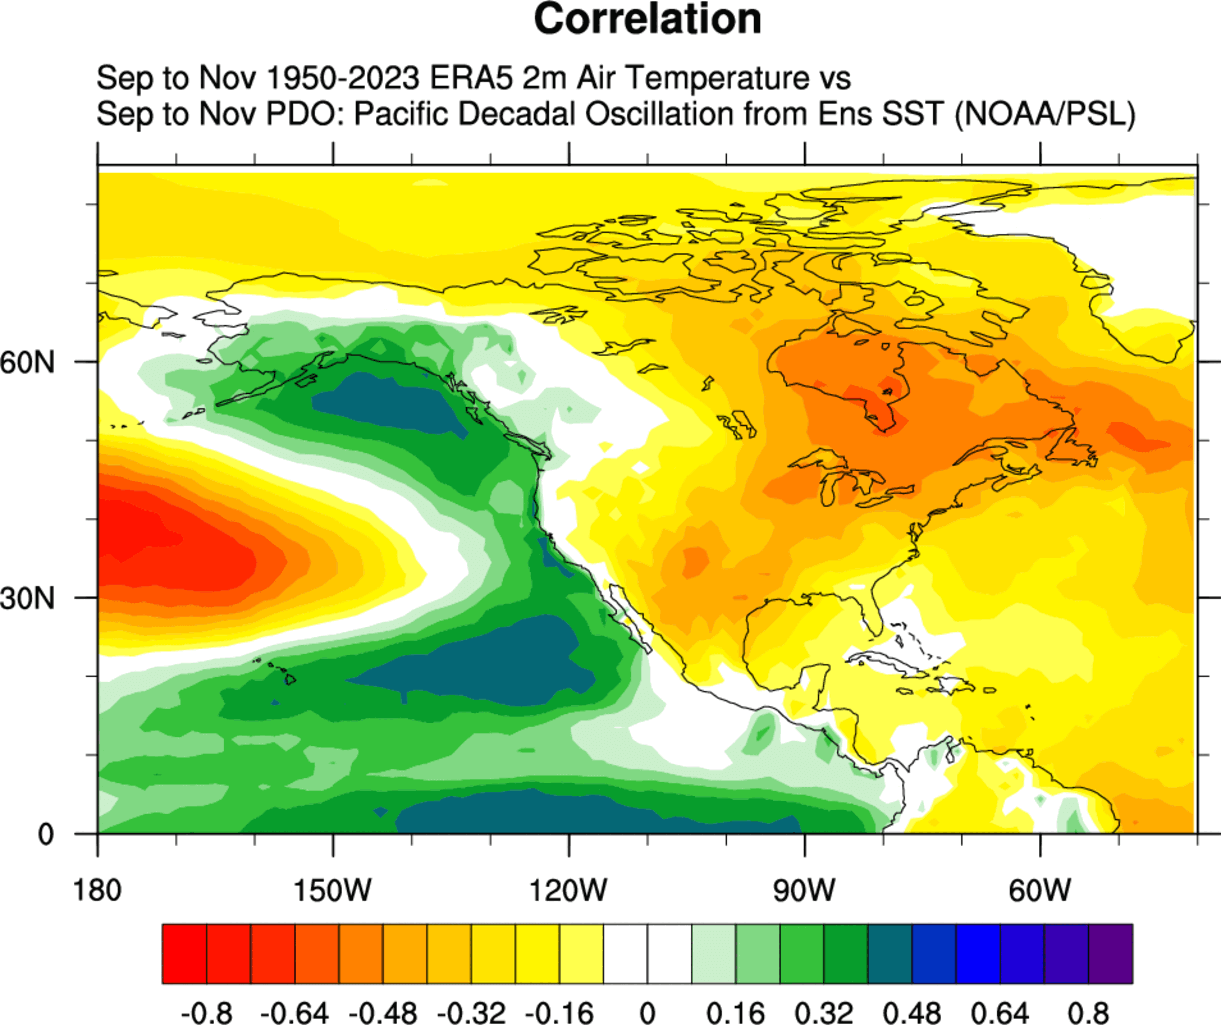
Of course, this is not exactly how every cold PDO Fall looks, as there are many other oceanic and atmospheric factors that shape a particular season. But we see the trend that this particular phase might favor.
Below is the latest long-range temperature forecast for the same period. You can see a very similar pattern, with neutral-cool anomalies hinted over the Pacific Northwest and in the ring pattern out over the ocean.
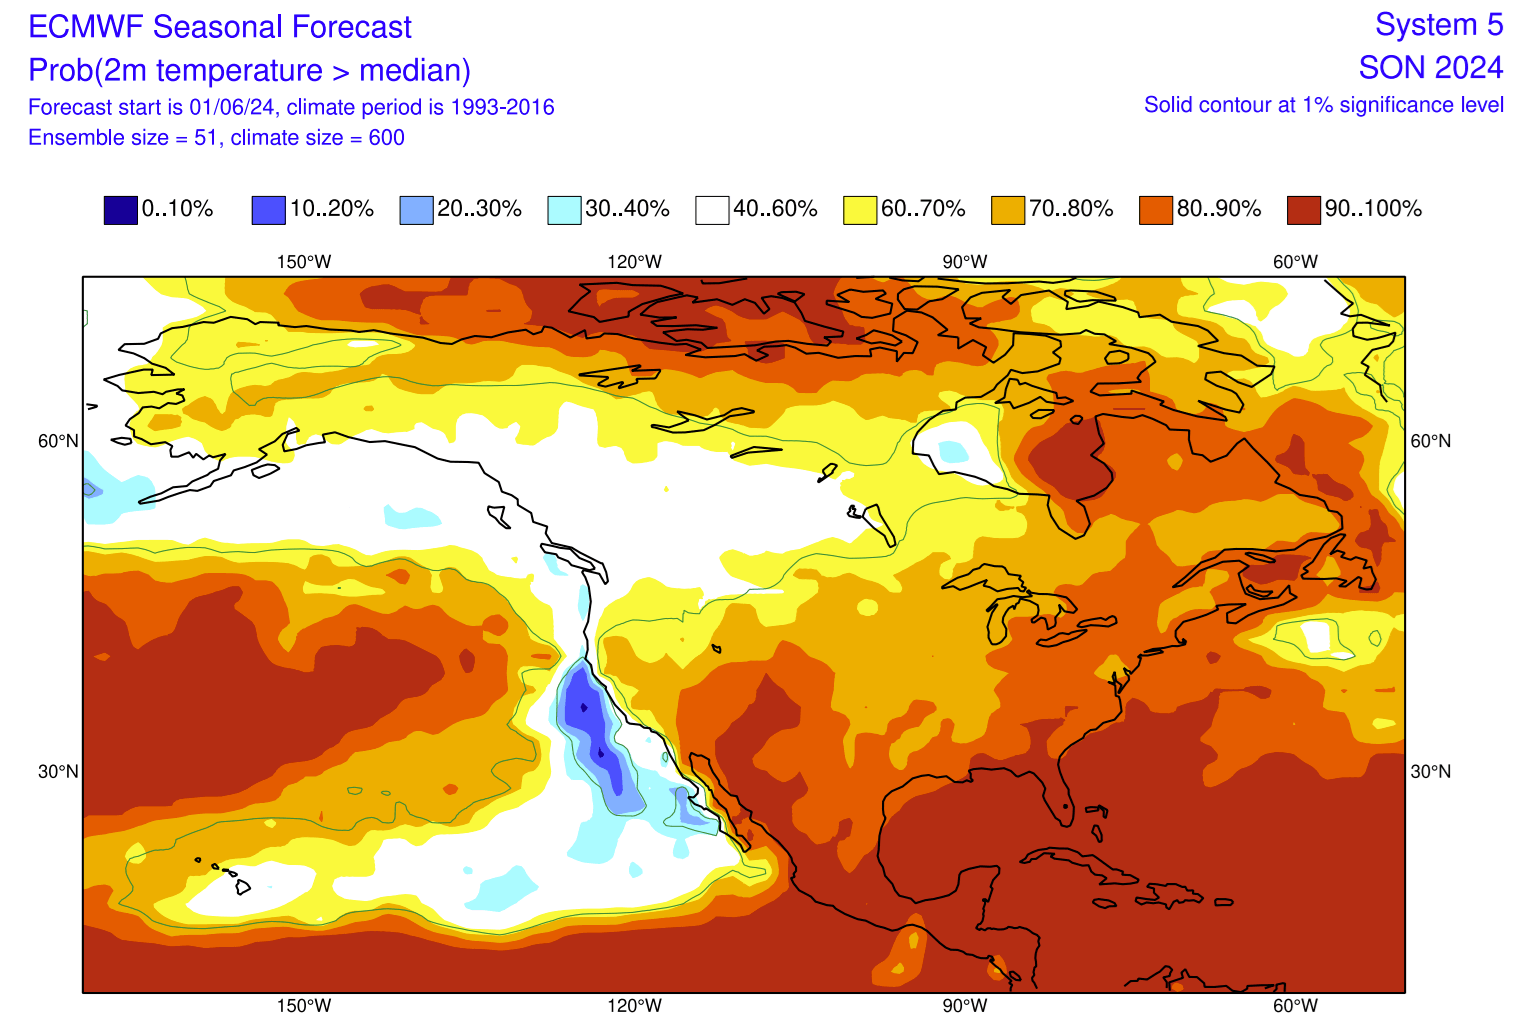
Warmer-than-normal temperatures are forecast over the southern United States and southeastern Canada. This temperature forecast shows a very clear PDO signature, just like the data above suggests. There are other factors at play, but we do see a clear PDO influence.
PDO also has a very important influence on precipitation. In a cold phase, we tend to see less precipitation over most of the United States. More precipitation is usually expected over the far northwestern and far northeastern United States, Florida, and northern Canada.
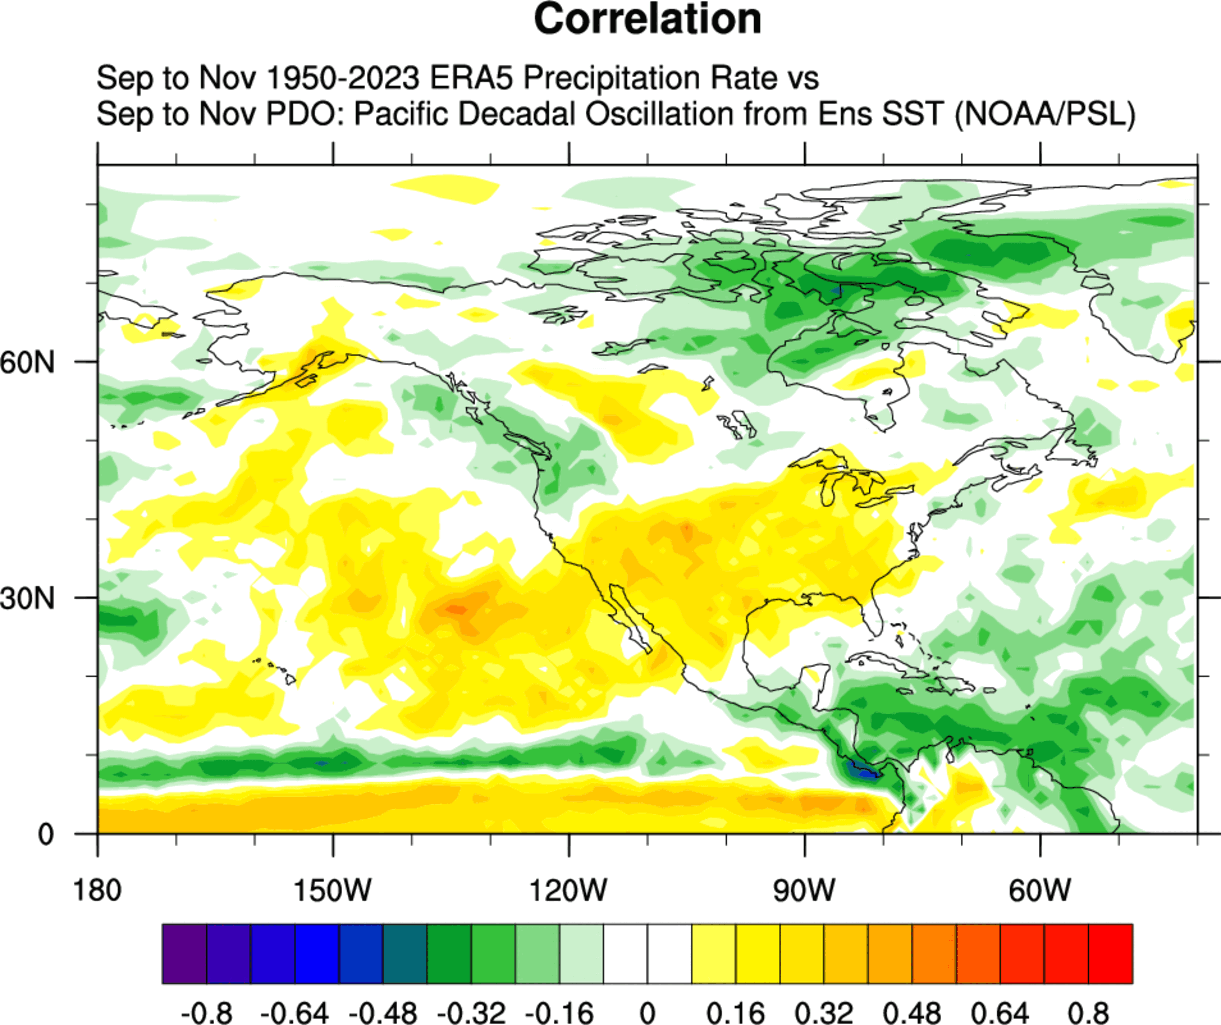
The precipitation forecast shows a very similar pattern. Less precipitation is forecast over much of the United States, but some indication of more precipitation is shown for the northwest, upper Midwest, and around Florida.

You can also see an area of much above-average rainfall in the Caribbean. This can potentially signal an active hurricane season with more tropical systems. But we will cover this in more depth in a separate article.
With the PDO influence growing over Autumn, we also have to look into the winter data and see what it shows about the impact of the negative PDO phase.
ECHOES INTO THE WINTER SEASON
First, we need to look at the ocean forecast. Below is the EMCWF ocean temperature forecast for December. You can see the typical cool/neutral horseshoe pattern along the west coast of North America and the warm pool in the North Pacific. This is the typical negative PDO pattern, along with the cold La Niña phase in the tropics below.

At this point, you might ask, what is the point of looking at the forecast for December, which is 6 months into the future? But ocean forecasts are generally much more reliable (as much as they can be) than the atmospheric forecast and have a known back-record to prove it.
We also look at several other forecast solutions to verify that they all agree in this scenario to a certain extent. Of course, we can only show one image in the article. So, we select the one that shows the most probable anomaly pattern.
Below is an example of a forecast that shows data from seven different forecasting systems for various future periods. You can see right away that they all agree on the overall general pattern in the Pacific, and these are not even all the forecasts available.
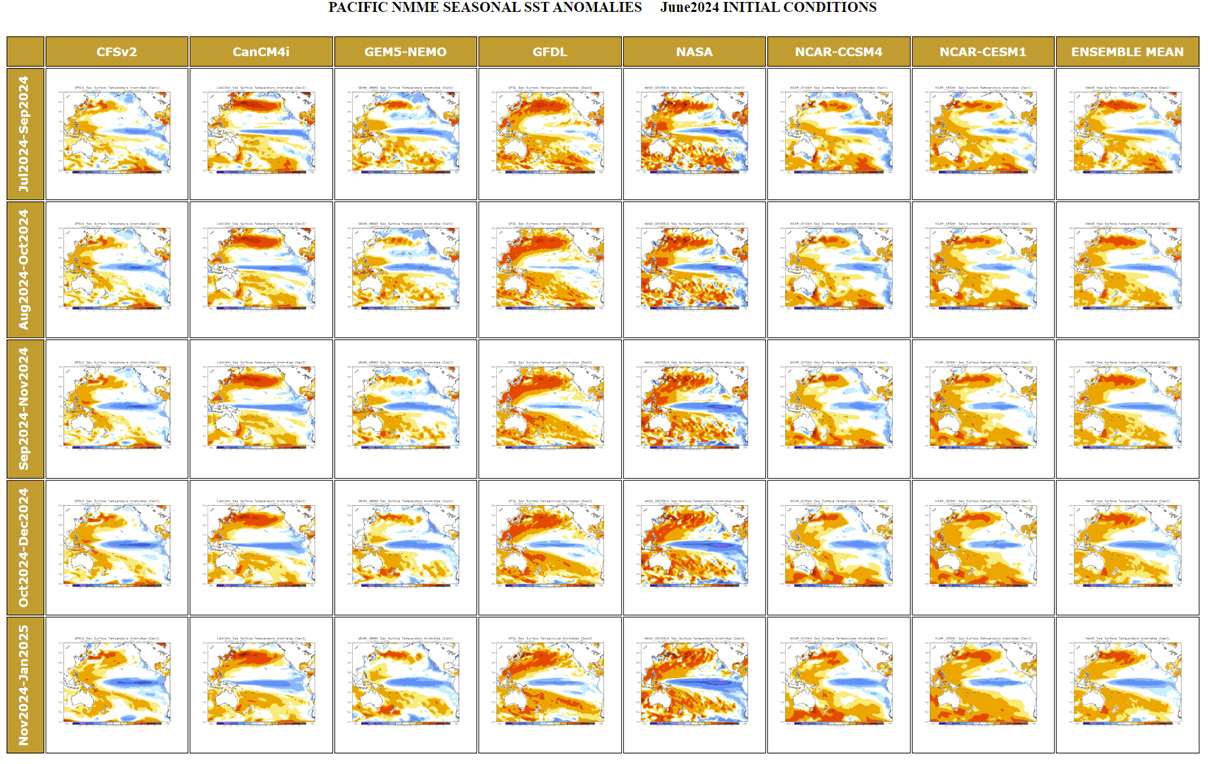
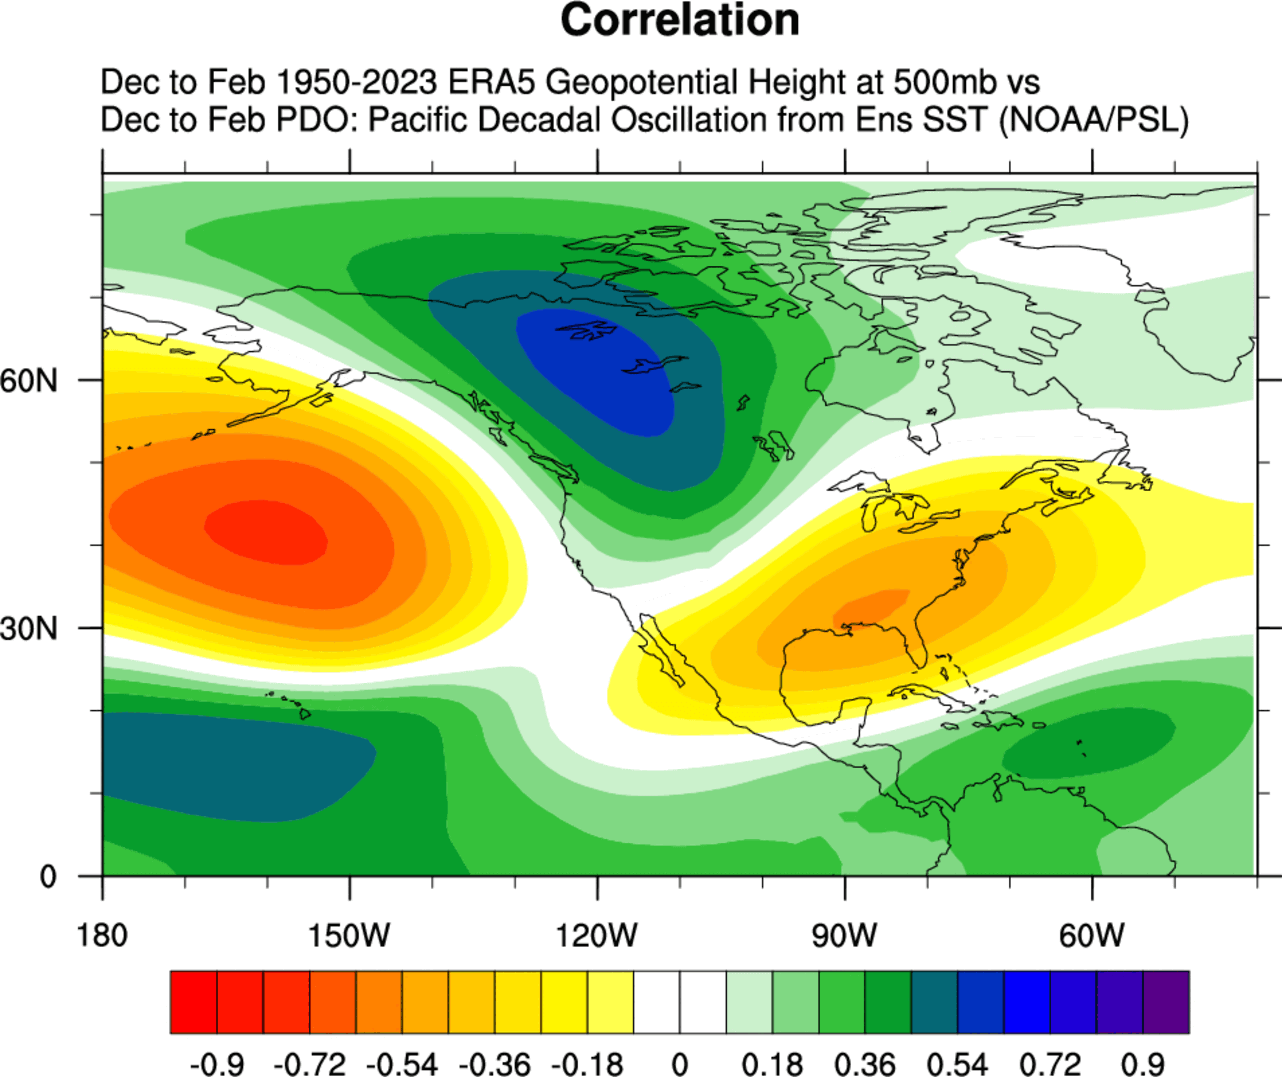
So, we can say with good confidence that we will have a negative PDO pattern continuing into winter 2024/2025. For that reason, we produced images from data over the past 70 years to find what is the negative PDO signal in the winter atmosphere.
The pressure pattern analysis shows the high-pressure system in the North Pacific and over the southeastern United States. A large low-pressure area sits over western Canada and extends the polar jet stream across the northern United States, pushing the cold air along with it.
When we look at the surface temperature anomaly, we can see the negative PDO favors colder winters across the northern and northwestern United States and western Canada. There is usually a milder winter over the deep south and the southeast of the United States in a negative PDO.

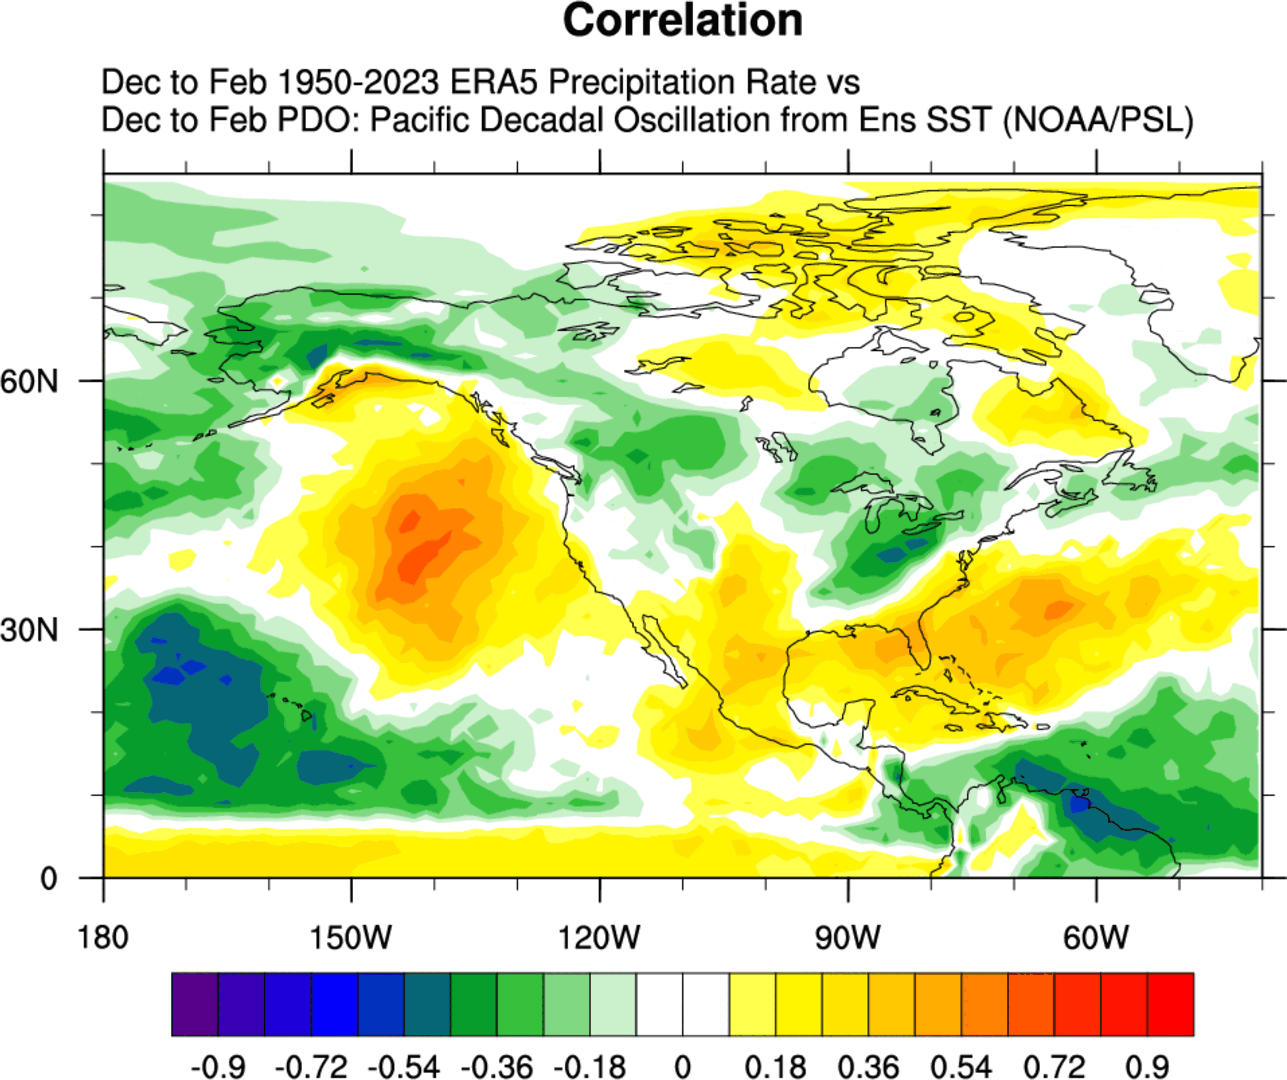
Looking at precipitation, we have wetter conditions over southern Canada, the northwestern United States, the Midwest, and the Northeast. Less precipitation is usually over the southern United States and northern Canada.
But as we are talking about precipitation in winter, we have to look at the snowfall trends during a negative PDO. Below is an image that shows the snowfall signal. As you can see, a negative PDO brings more snowfall into the western United States, the upper Midwest, and parts of the Northeast.

Of course, other factors determine the final winter outcome, especially the La Niña in the tropics. But the negative PDO and the La Niña usually complement each other, so their influence on the North American weather patterns is similar and complementary.
We will keep you updated on similar nature and weather events worldwide, so make sure to bookmark our page. Also, if you have seen this article in the Google App (Discover) feed, click the like (♥) button to see more of our forecasts and our latest articles on weather and nature in general.
SEE ALSO: