La Nina has begun to break down in the tropical Pacific Ocean. Cold anomalies are now weakening fast, but the weather influence will last well into the Spring season. A transition to a neutral phase is expected by Summer, with an El Nino likely to emerge in Fall, ready for the cold season of 2022/2023.
But what are these La Nina and El Nino events, and how can they change the seasonal weather across the entire world? As you will quickly find out, they are actually both just a part of a large old system that connects the ocean and the atmosphere called ENSO.
We will then look at the latest changing conditions across these ocean regions, and what the latest forecast shows for the coming months. You will see just how strong of an influence these oceanic anomalies can force on the weather signals, changing the course of weather on a global scale.
ENSO GLOBAL WEATHER IMPORTANCE
ENSO is short for “El Niño Southern Oscillation”. This is a region of the equatorial Pacific ocean, changing between warm and cold phases. Typically there is a phase change in around 1-3 years.
ENSO has a major influence on the tropical rainfall patterns (storms) and the complex exchange between the ocean and the atmosphere. We can observe large-scale pressure changes in the tropics with each new developing phase. After some delay, these changes affect the circulation over the rest of the world.
The image below shows the ENSO regions in the tropical Pacific. Regions 3 and 4 cover the east and west and together cover a large part of the tropical Pacific. Most analyses and forecasts are focused on a combination of regions 3 and 4, seen on the image as the Nino 3.4 region. Region 3 covers the eastern tropical Pacific, while region 4 covers the central and western parts.

Each ENSO phase has a different effect on the pressure and weather in the tropics. This translates to the overall global circulation with time, changing the weather patterns worldwide differently.
A specific phase (cold/warm) usually starts to develop between late summer and early fall and typically lasts until next summer. But some events can last even up to two years.
The cold ENSO phase is called La Nina and the warm phase is called El Nino. The name La Nina translates to “the girl”, and the name El Nino translates to “the boy”, indicating an opposite dynamic between the two phases.
We determine the ENSO phases by looking at the sea surface temperature anomalies (warmer/colder) in the ENSO 3.4 region, which you saw in the previous image above.
On the image below we have a direct comparison between the ocean temperature anomalies during a warm and a cold event. Both examples show realistic data, from the 10 strongest events for each phase.
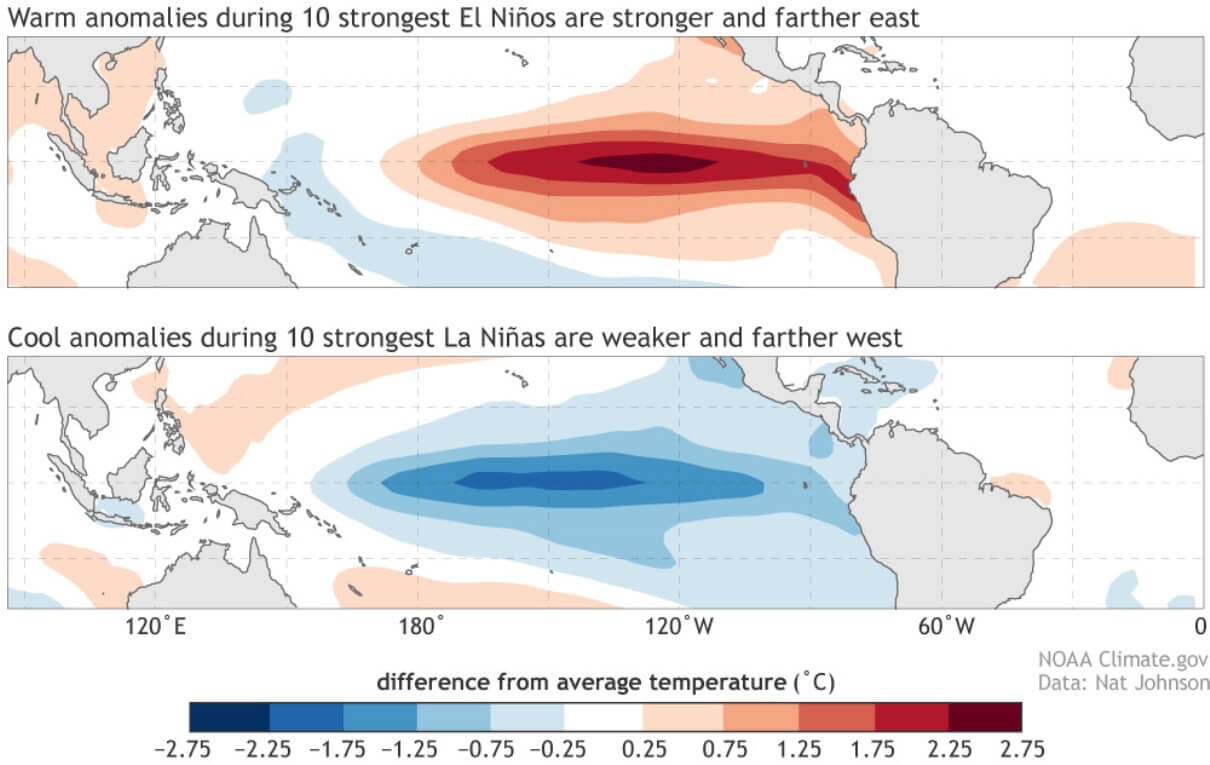
Typically, an El Nino develops stronger anomalies, which are focused more on the central and eastern regions. But while La Nina has weaker average anomalies, they typically peak more from the central to the western region.
But does ENSO shift between cold and warm phases? There is no simple answer, but we can say that it is a result of the complex dynamics between pressure patterns and winds. The tropical trade winds usually start or stop a certain phase, by mixing the ocean surface layers and altering the ocean currents and thus temperature.
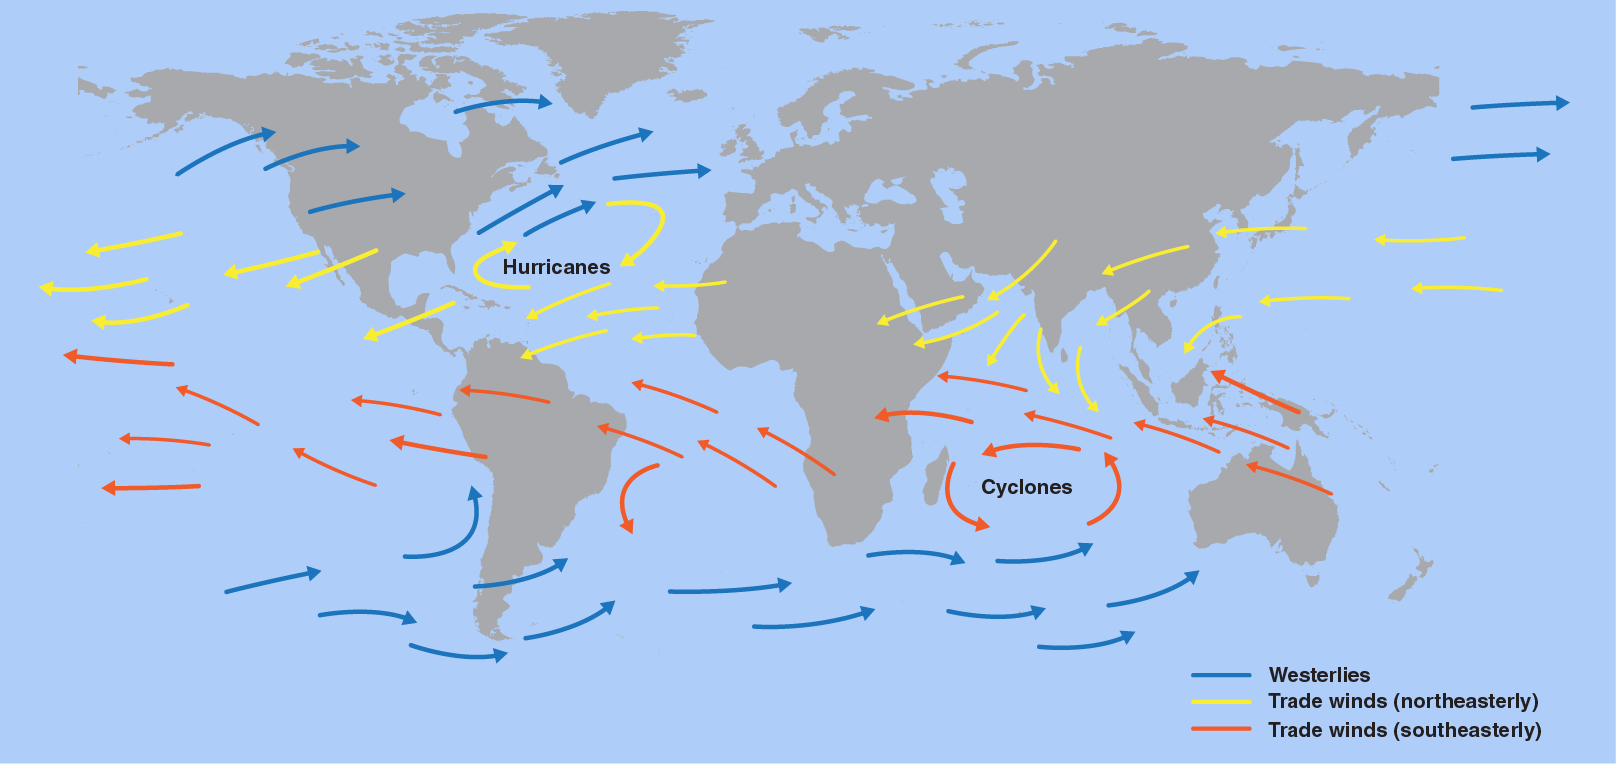
What are the trade winds? The trade winds are steady, and persistent winds, blowing towards (and along) the Equator in both Hemispheres. The image below from Weather.gov nicely shows a simplified schematic map of the global prevailing winds, with tropical trade winds in yellow and red.
We produced a map that shows the prevailing near-surface winds, based on the actual data in the past 4 decades. We can nicely observe the easterly trade winds in the Atlantic Ocean and in the Pacific Ocean, which help to drive the ENSO region warming and cooling.

When these easterly winds get stronger, they actually start changing the ocean surface currents, and they start pushing the water from east to west. This moves warm surface waters towards the west, bringing deeper (colder) waters closer to the surface to replace it.
This process is much better seen on the video animation below, which shows the ocean temperature anomalies from Summer to late Fall 2021. You can see new cooling starting in July, as the “waveforms” develop across the equatorial Pacific. They are formed as the surface water is being pushed west by the trade winds, now replaced by deeper colder water.
The image below shows the latest ocean surface currents and temperature in the ENSO regions. We can still see easterly currents, which are pushing the water towards the west, cooling the ocean surface. The easterly regions are usually always colder than the western due to stronger trade winds.

But the secret is not just in the winds themselves, as they are typically being driven by pressure changes. The ENSO phase directly responds to a special atmospheric pressure change, called the Southern Oscillation Index.
The Southern Oscillation Index or SOI represents the difference in air pressure measured at Tahiti (French Polynesia) and Darwin (Australia). The image below shows the location of the two pressure zones that are important for ENSO.

Positive SOI values mean that the pressure over the Tahiti side is higher than over Darwin in Australia. This corresponds to stronger easterly trade winds, supporting La Nina conditions.
But during an El Nino, we see lower pressure in the eastern Pacific and over Tahiti, and higher over Darwin, Australia. This produces a negative SOI value and weaker trade winds, which means less ocean cooling.
COLD LA NINA – LATEST DATA
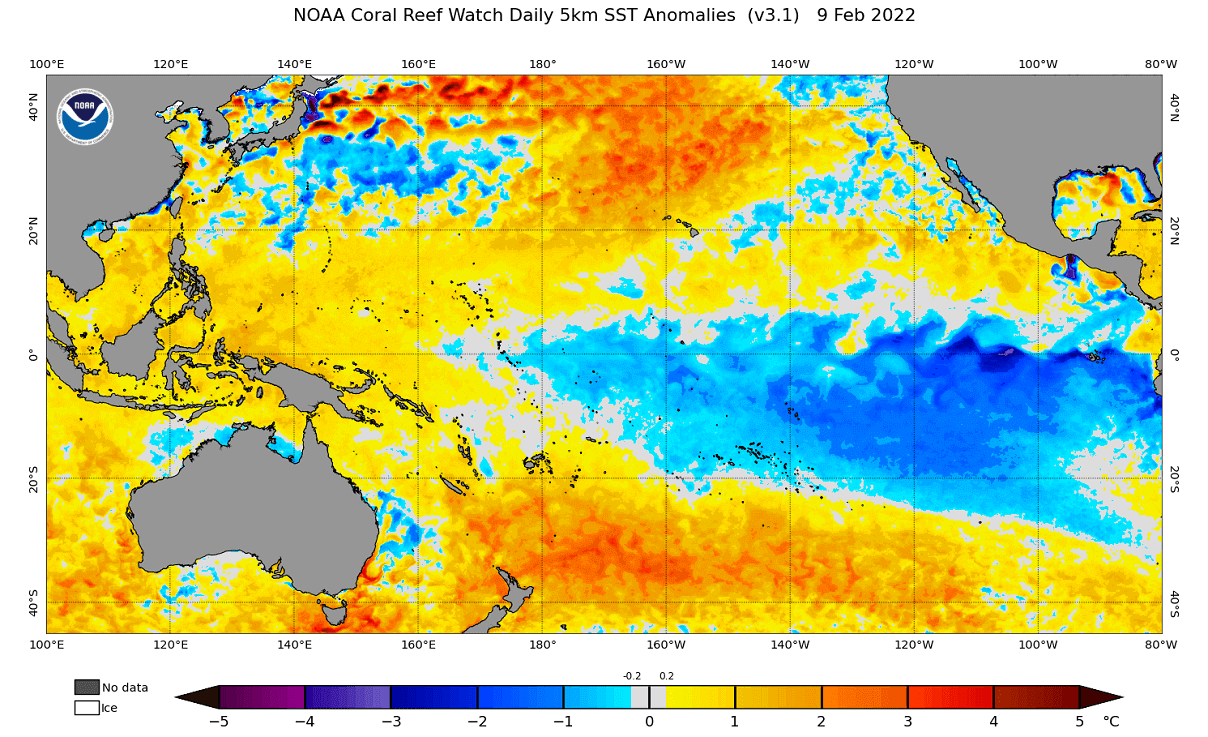
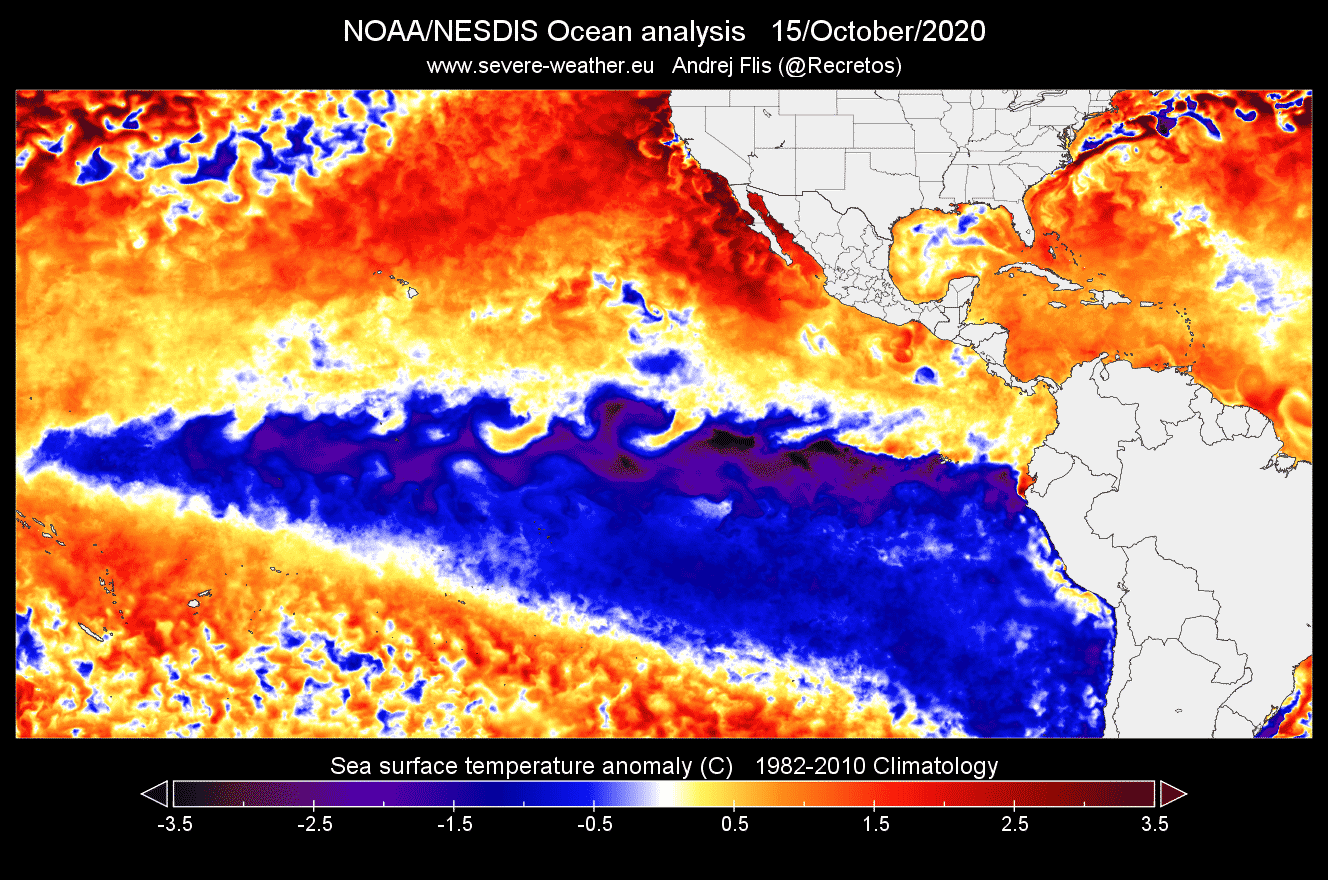
Current global ocean analysis reveals the continuing presence of cold ocean anomalies in the tropical Pacific. This is exactly across the ENSO regions, seen earlier above. The “wave-like” shapes of the cold anomalies indicate strong trade winds, pushing the surface waters from east to west, creating these ocean surface swirls.

Focusing on region 3.4, you can see the first La Nina from the 20/21 season on the image below. New ocean cooling began in Summer and Fall last year. That was the development of the current cold phase. Peak cooling was weaker in the current La Nina, as the second-year event is usually weaker than the first event.

The current cooling has been quite substantial and persistent from the beginning of the meteorological fall season. In the image below, we have the sea surface temperatures in the main ENSO 3.4 region. We can see a steady temperature drop since mid-November, reaching a bottom in early January before warming back up.

A change in the tropical trade winds in January has ended the cooling process, effectively starting the breakdown of the La Nina event.
But we have to remove the normal temperatures, to see the actual cooling, and the cold anomalies. The image below shows the temperature anomaly in the ENSO 3.4 region and reveals a stronger deviation from the norm since mid-November, due to stronger trade winds.

Breakdown of the cold anomalies began in early January, as the trade winds weakened. We can see on the image above that the cold ocean anomalies quickly subsided, as a response to weaker easterlies across the ENSO regions.
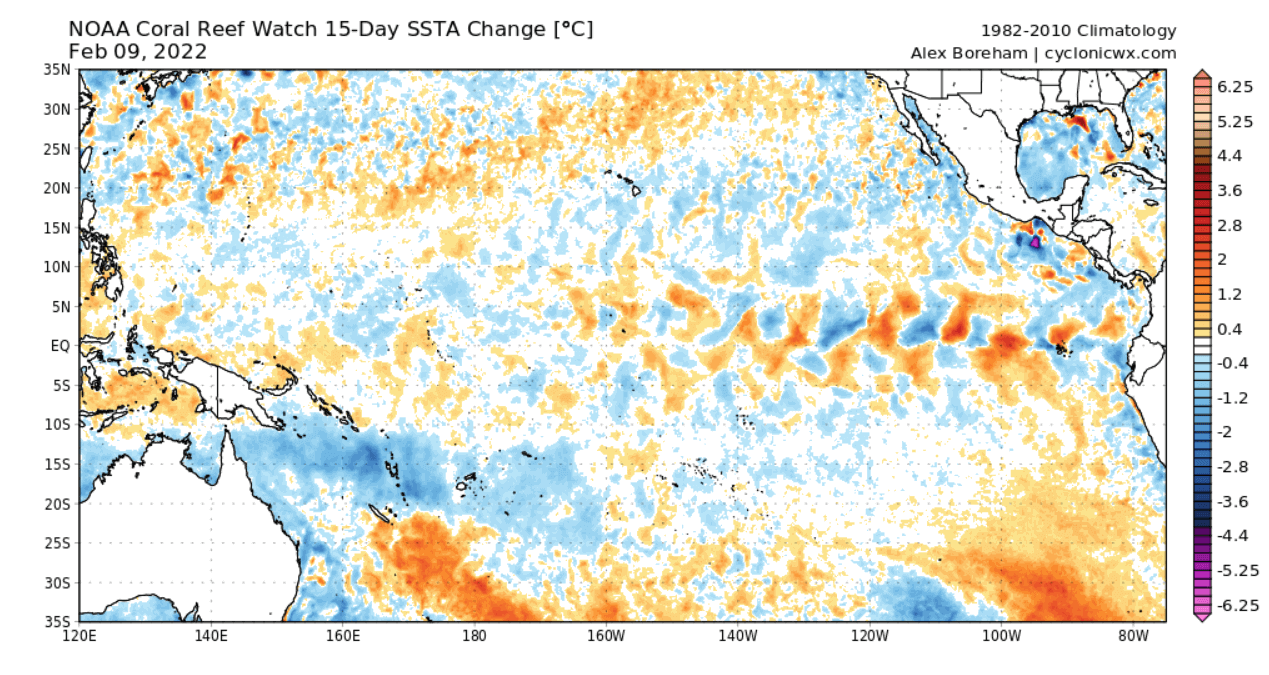
Below we have the latest anomaly analysis of the ENSO regions. You can nicely see the weaker cold anomalies in the central Tropical Pacific. Peak cold anomalies are now focused more towards the eastern regions, where the trade winds are still stronger.
We can compare the current state of the ocean anomalies with December below. Cold anomalies were much stronger in the central tropical Pacific region, also having a more compact shape. This central/westerly region is usually the first one to weaken.

Below we have a 15-day ocean temperature anomaly change. It shows mostly warming anomalies across the ENSO regions, continuing the breakdown of the La Nina.
But perhaps a stronger (invisible) process is developing below the ocean surface. On the image below you can see the temperature anomalies by depth across the tropical Pacific Ocean. The top analysis is for late December and the bottom analysis is for mid-January.
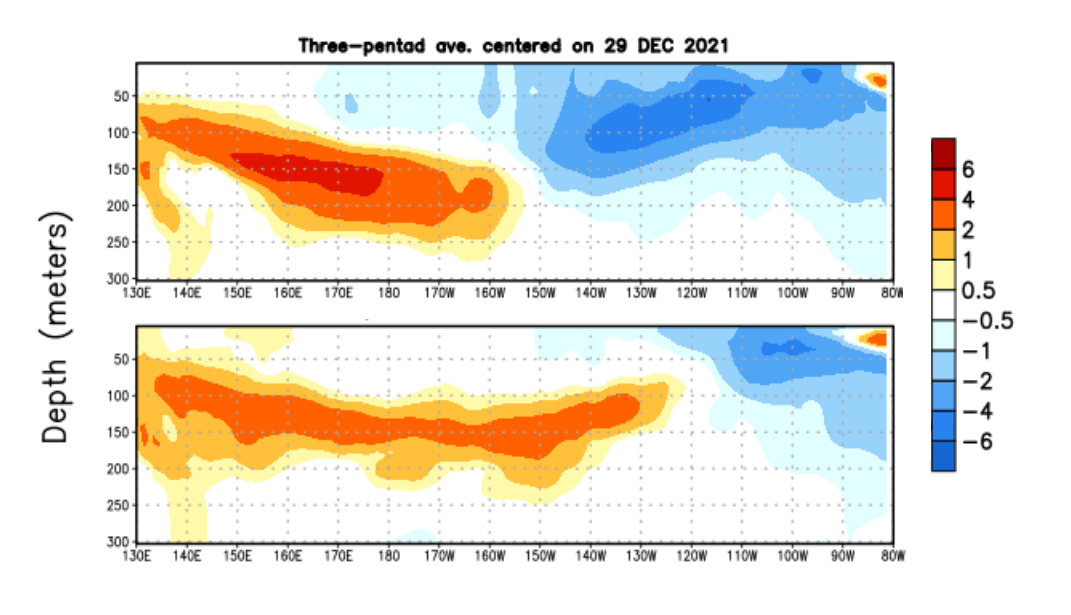
We can see a strong warm wave expanding below the ocean surface from the west, at around 80-200m depth. This is known as an oceanic Kelvin wave, and this is currently causing the breakdown of the La Nina.
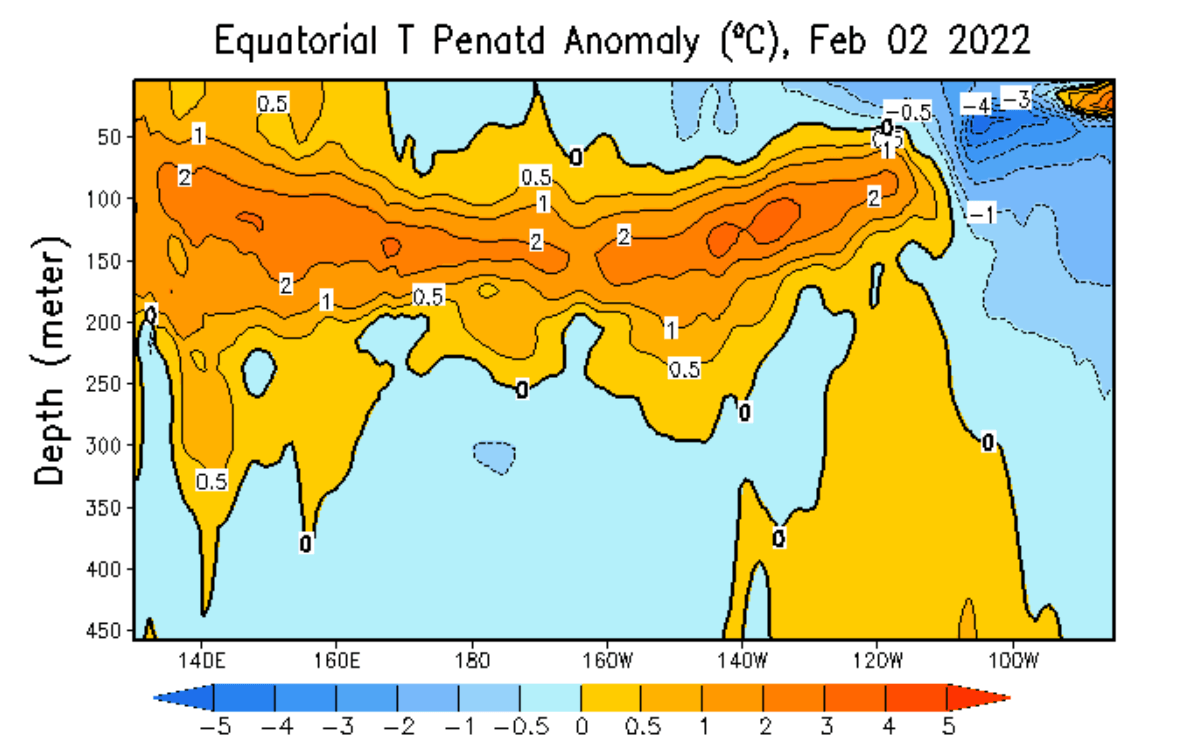
Looking at the latest high-resolution depth analysis under the ENSO regions, we still see colder than normal temperatures below the surface in the eastern region. But the warm anomalies have completely taken over, with a matter of time before they also start emerging at the surface.
One way to look at the whole ENSO region temperature strength is by looking at the ocean heat content. This also takes the water at depth into consideration, not just the surface temperatures.
And below we can see the cold anomalies developing in late Summer, and peaking in mid-October. Lately, the subsurface cold anomalies have weakened, indicating that the La Nina is already gone below the surface, with warm anomalies now building.

Based on all the available data, an official La Nina watch is still in effect, released by the NOAA’s Climate Prediction Center:
“La Niña is likely to continue into the Northern Hemisphere spring (77% chance during March-May 2022) and then transition to ENSO-neutral (56% chance during May-July 2022). La Niña is anticipated to affect temperature and precipitation across the United States during the upcoming months.”
Tracking the weather effects of these ENSO phases is not easy. It is not as simple as pointing at a certain weather event and simply calling it “ENSO influenced”. Global weather is a very delicate and complicated system, where everything can have (has) an influence on everything. But of course at quite different temporal and spatial scales.
Below we have an image that shows the average winter pressure pattern from multiple La Nina winters. The main feature is a strong high-pressure system in the North Pacific and low pressure over Canada.
That is the typical signature of the cold ENSO phase. Over Europe, we see lower pressure over Scandinavia and higher pressure over northwestern Europe, but that cannot be designated as a typical weather response from the La Nina.

The main takeaway is the strong high-pressure system in the North Pacific and lower pressure over western Canada and the northwestern United States. That sends the polar jet stream down over the northern United States.
But over Europe for example, the direct La Nina influence slowly fades, due to the generic weather pattern variability. The influence is still there, but it is typically highly mitigated/modified by the existing weather patterns in the North Atlantic.
This is exactly what we have seen this Winter season 2021/2022. Below we have a pressure anomaly analysis of the winter season so far. Notice the strong high-pressure system in the North Pacific, and the low-pressure zone over Canada.

The jet stream is bending between the two systems from Alaska down into the northern United States. This is an average picture from the start of the meteorological winter season on December 1st to the latest data available on February 8th.
Looking also at the temperatures for the same period, we can see a large pool of colder than normal air over most of Canada. That has formed also thanks to the high-pressure system from the La Nina and the changed direction of the jet stream.

This region of colder than normal temperatures was the main source of frequent cold air outbreaks in January and early February over eastern and central United States. Below we have global temperature anomaly for 2022 so far, where we can see most of the United States being colder than normal.

ENSO 2022 LONG-RANGE FORECAST
You now know what ENSO is and what its warm and cold phases are. So we are going to focus on its evolution through the current upcoming Spring season and see what the most recent forecasts show further into 2022.
Below we have the ocean temperature forecast for Summer 2022, from the ECMWF. It shows an emerging warm anomaly across the eastern equatorial Pacific Ocean. Some cold anomalies can be seen south of the equator and towards the west, but these are just leftovers of the current La Nina.

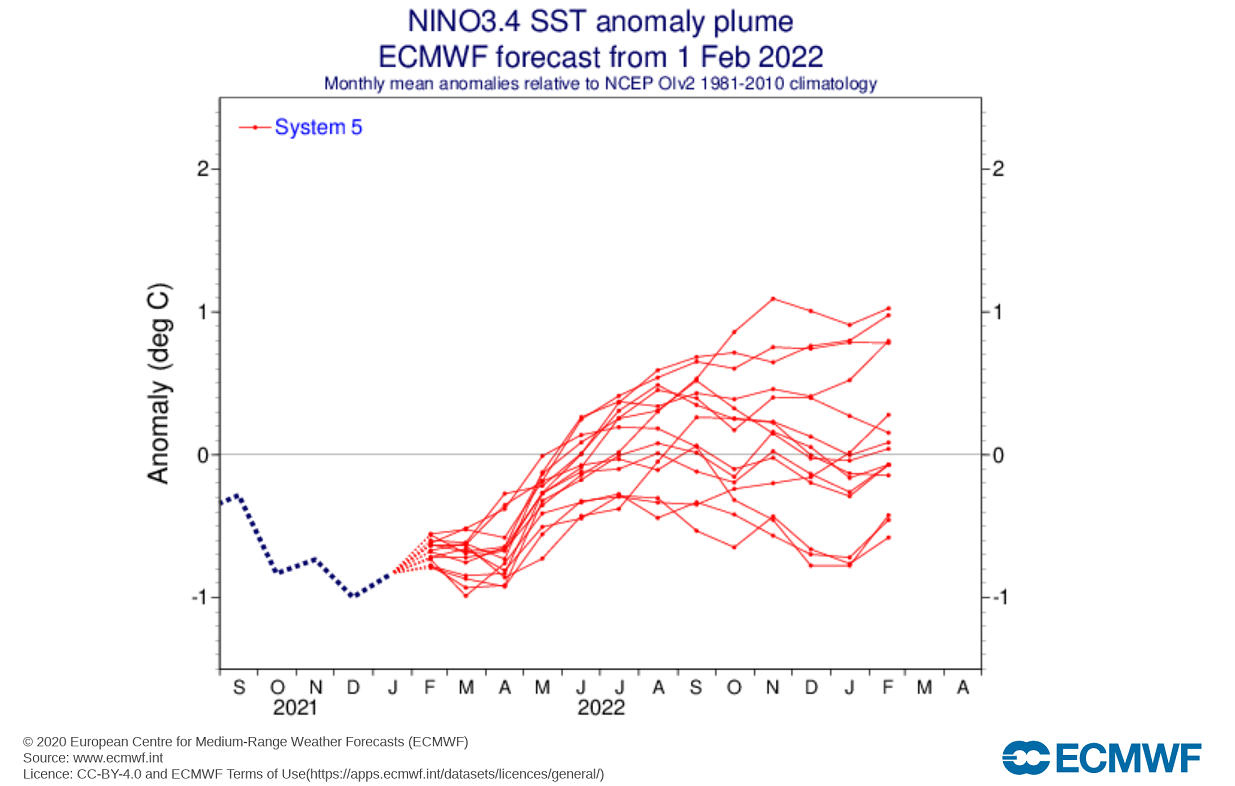
The ENSO analysis and ensemble forecast below from ECMWF shows that La Nina began to quickly develop during late Fall, reaching peak cooling in mid-Winter. The forecast does show a quick return to neutral conditions by late Spring. A new warm phase (El Nino) is hinted at, with anomalies reaching above +0.5 degrees.

But we have to add that the ECMWF ensemble forecast above is for the eastern (NINO 3) region. For any phase (warm/cold) to be officially defined, it has to meet or exceed the 0.5 degrees threshold on a seasonal time scale.
The ENSO forecast from the United States CFSv2 is much different. It shows the current cooling to simply continue into 2022. It sustains the cold anomalies over Summer, trying to make this a 3-year La Nina event.

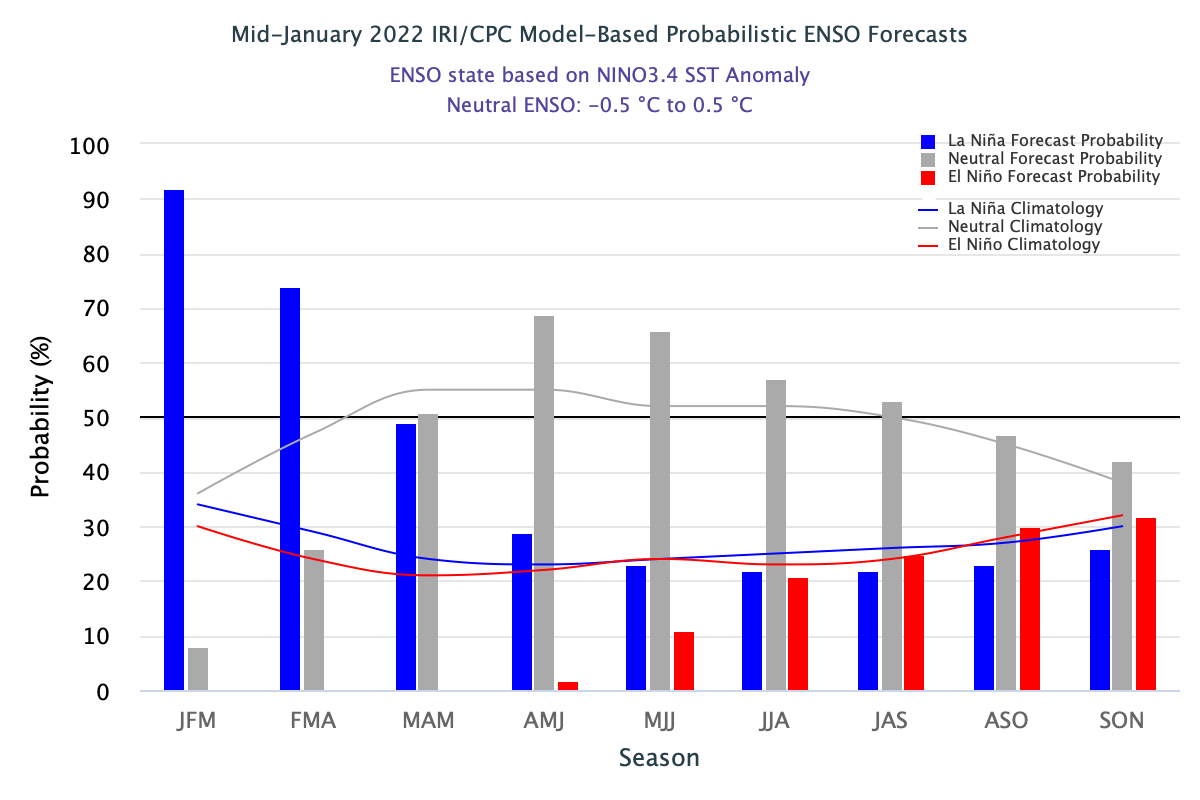
The CPC/IRI official probabilistic ENSO forecast shows the current La Nina lasting over the late winter season into Spring 2022. What is interesting is the transition into summer, where we do see the chances of an El Nino increasing, just like on the ECMWF model forecasts above. It is typical for a new phase to emerge in late summer/fall with seasonal pressure changes.
The image below is a consolidated analysis and forecast image from multiple North American seasonal models. It also shows the La Nina reaching the coldest phase in the mid-winter season. But going ahead into 2022, we see a return to the neutral phase (between 0.5 and -0.5), with an increased chance of an El Nino developing later in 2022.

The CFSv2 forecast stands out by extending the cold conditions, as mentioned above. It is unlikely to have a third-year La Nina, so chances are better for an El Nino emerging, compared to having another cold event. But weather can always surprise us, and we will soon see if the model will change its forecast or will the rest adjust down.
The most recent ECMWF extended seasonal forecast actually shows the cold phase ending in Spring 2022. Going ahead, there is a high forecast spread, with the average staying in the neutral zone. The only certain thing is the end of the cold phase.
Trends are in favor of a proper warm phase (El Nino) developing in the second half of 2022. Especially with the cold anomalies already gone below the surface, replaced by warm anomalies.
An El Nino is currently more likely in late 2022 and especially during the next winter season than an extended La Nina. So it’s time we look at how they actually differ from each other, both in the Ocean and in the Atmosphere.
LA-NINA VS. EL-NINO
To fully understand the ENSO, we must understand both its phases. The forecasts show an increased chance of an El Nino in late 2022. This is why we will look at the main difference and the typical weather influence of the El Nino versus a cold La Nina phase that we are currently in.
Below we have two real analyses of ocean temperature anomalies. First is the strong La Nina from last year, and the second is the strong El Nino event during the 2015/2016 winter season.
We can see a strong contrast and two different patterns over the same area of the ocean. Cooler than normal ocean temperatures during a La Nina, and warmer than average temperatures during an El Nino. As we will see later, their influence on the weather is also almost very much “reversed”.
Below is the strong El Nino event during the 2015/2016 winter season.

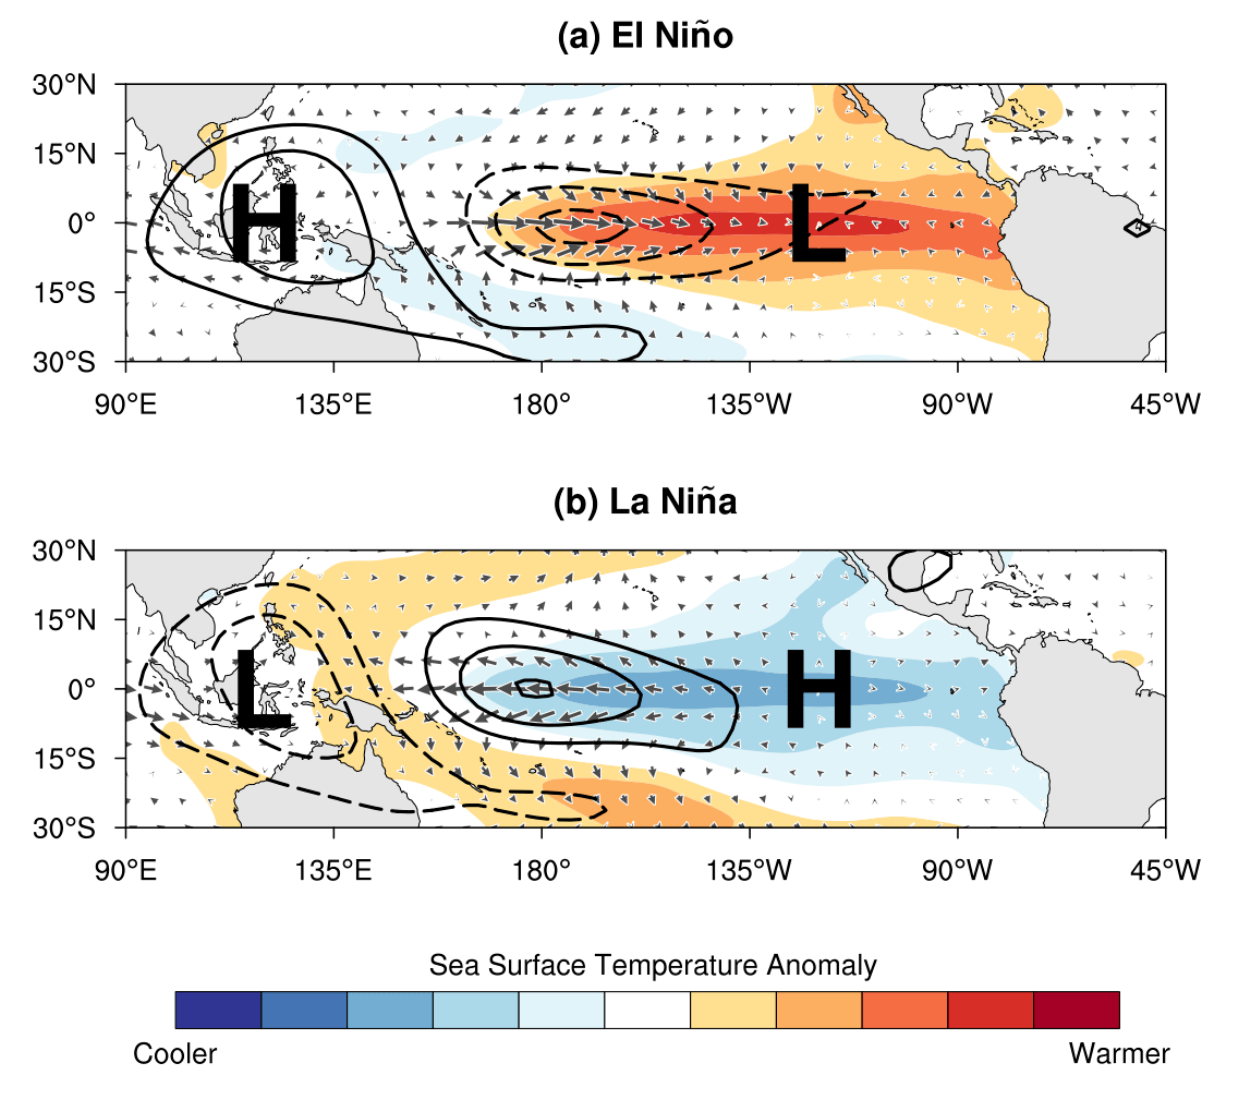
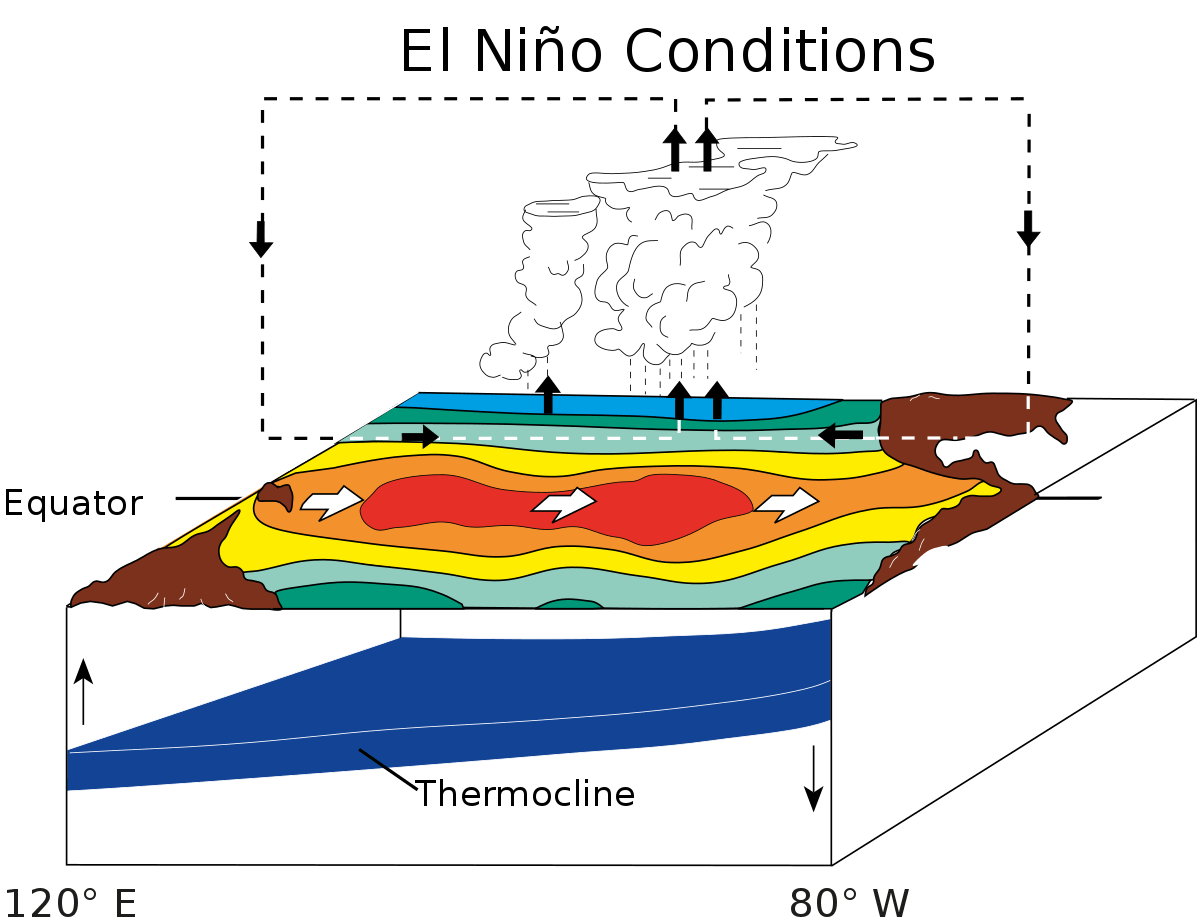
But besides the temperatures, one of the main differences can of course be found in the tropical pressure patterns. During an El Nino, the pressure over the central/eastern tropical Pacific is lower, with more rainfall and thunderstorms.
But during a La Nina, the pressure over the equatorial Pacific is high, creating stable conditions and less precipitation. This obviously translates into the global circulation over time, affecting the weather seasons on both Hemispheres.
Strong trade winds are also important because they affect the food chain across the tropical Pacific regions and on both American continents. Strong trade winds mean that deeper and cooler water rises up to the surface, replacing the water that was “pushed away” by the winds.
This process is known as upwelling. Upwelling is a vertical transport process, which helps to bring cooler waters and nutrients from the deeper layers to the surface. The image below by NOAA nicely shows the process.
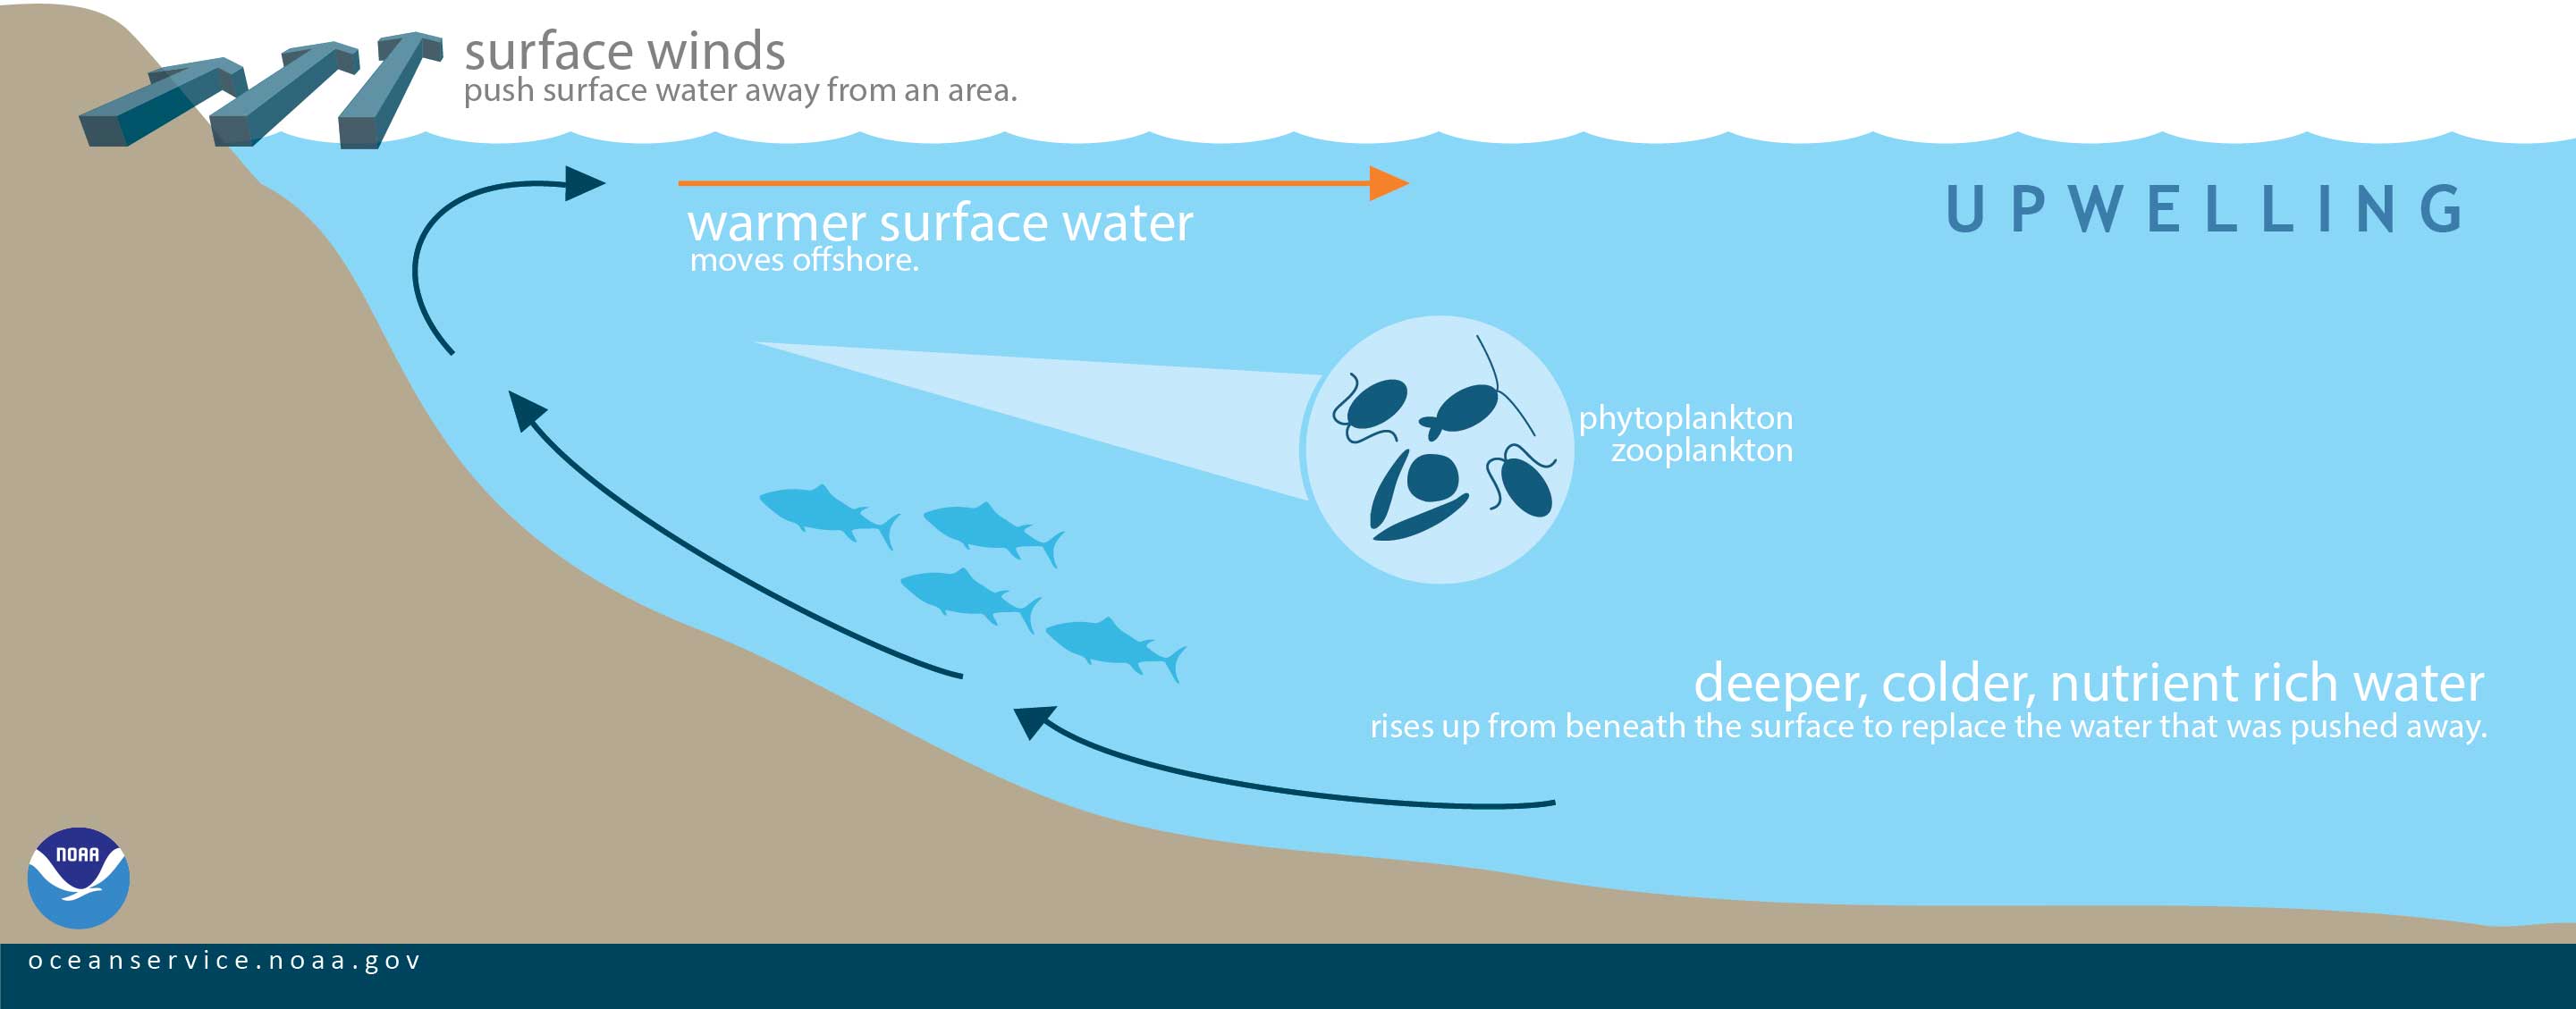
Water that rises to the surface as a result of upwelling is typically colder and is quite rich in nutrients. These nutrients can “fertilize” the surface waters, supporting higher biological productivity.
We can see this upwelling effect directly when comparing the temperature by depth during a La Nina and an El Nino event. The first image below shows the water temperature by depth during the 2015/2016 El Nino event. We can see much warmer waters in the upper-oceanic layers, and cooler waters staying deeper down.

But the subsurface analysis of the current La Nina event in October 2021 shows a much different picture. You can nicely see how the 20°C threshold is much closer to the surface. This is due to the upwelling effect, as the trade winds cause the deeper colder water to rise closer to the surface.
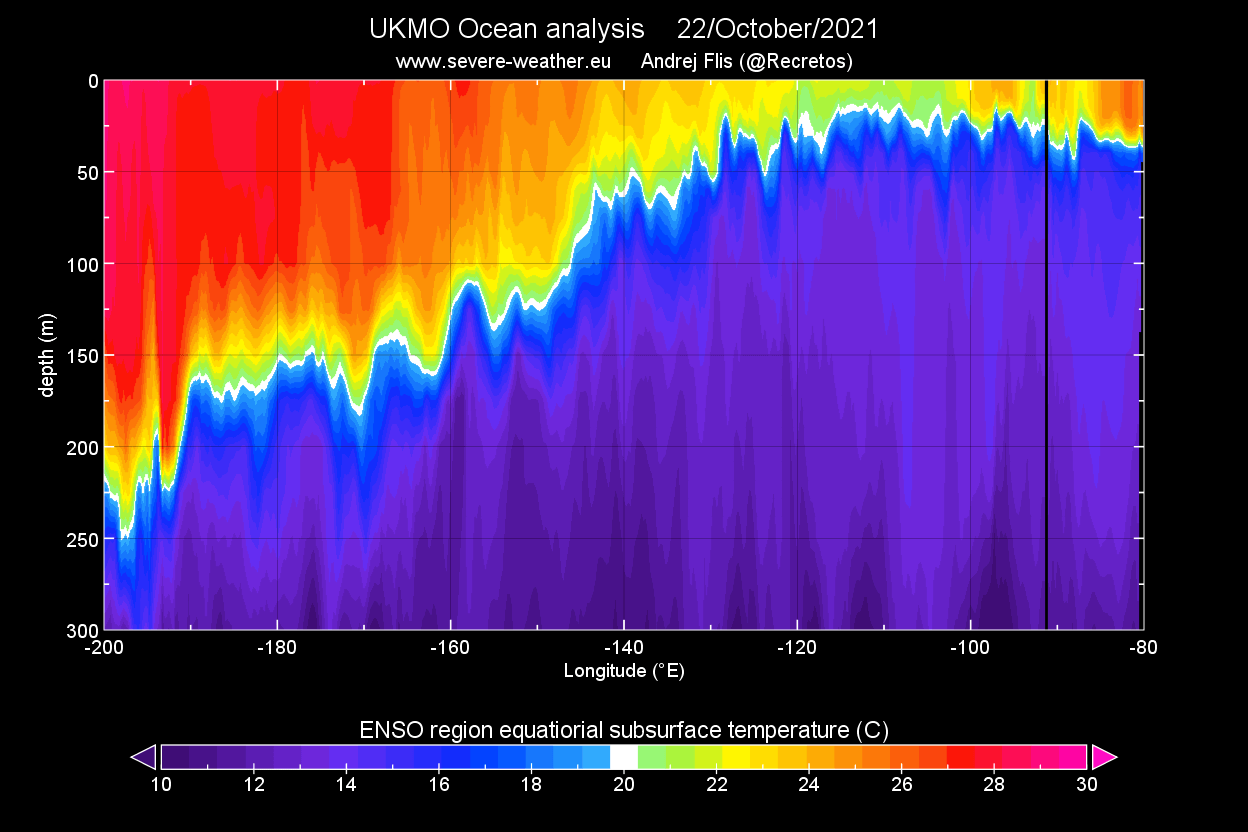
The layer between the warmer and colder waters is called the “thermocline”. This is a thin layer in the ocean, where the temperatures start to drop significantly. It basically separates the upper warm and deeper cold layers.
During an El Nino, seen in the image below, the thermocline layer is pushed deeper down. That is due to the warmer waters from the west entering the region, keeping the upper-ocean layers warmer than normal.
DIFFERENT WEATHER OF THE ENSO PHASES
Here we have to add, that an ENSO phase is not just a pure “influencer” for our weather. It can also be viewed and interpreted as one of the responses to the overall global state of the atmosphere and ocean circulation.
But generally, ENSO does exhibit an important influence on the Jet stream in the Pacific Ocean, and consequently also downstream and upstream around the world.
The jet stream is a large and powerful stream of air (wind) at around 8-11km (5-7mi) altitude. It flows west-to-east around the entire Northern hemisphere, affecting the pressure patterns and their evolution, directly shaping our weather at the surface.
Below is an example of the jet stream in winter at the 300mb level (9km/5.6mi altitude). In this example, the jet stream is bent quite far down over the central United States, which brings along colder air from the north/northwest. It is curved upwards over northwestern Europe.
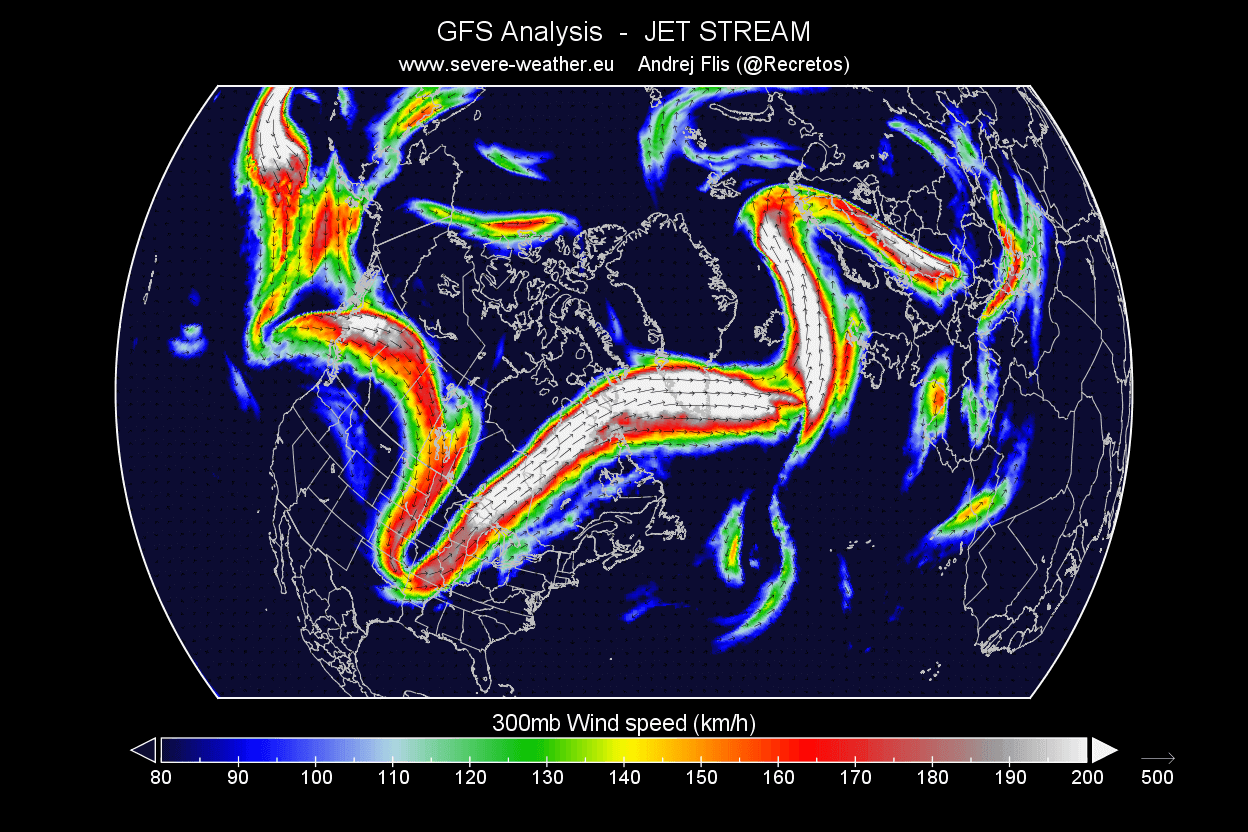
Such formation brings colder weather to the central United States and stormy weather to the UK and Ireland.
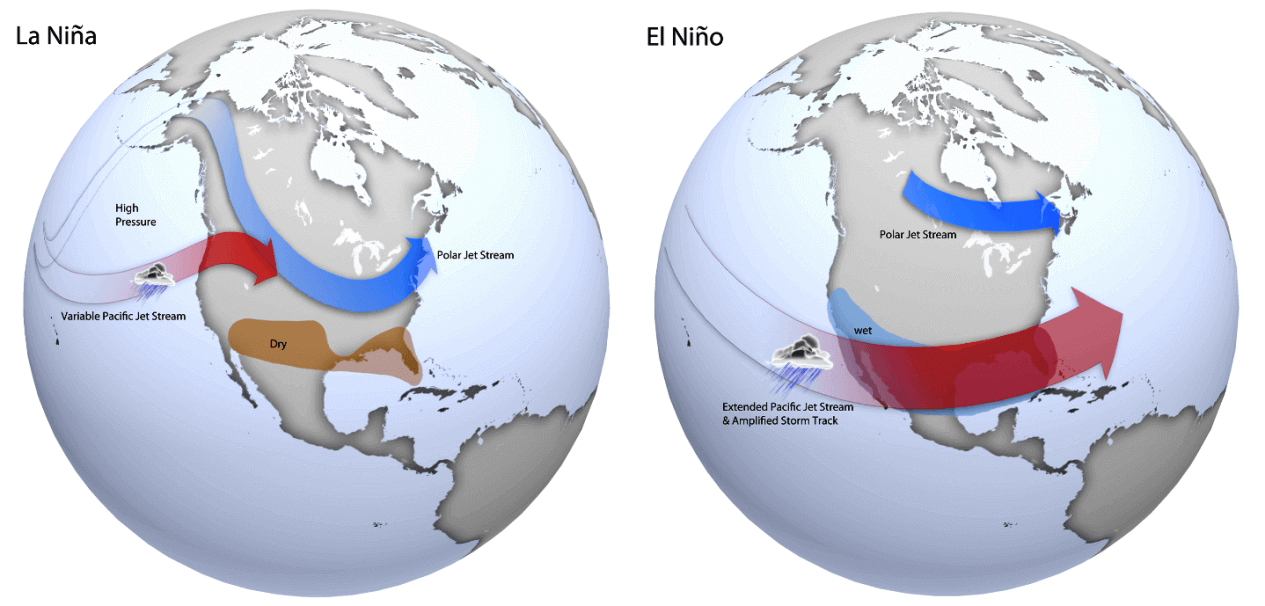
Comparing the two phases of the ENSO on the next image below, we can see that they typically produce an entirely different jet stream pattern across North America. We will focus on this region because the ENSO has a major/direct influence on the position of the jet stream over the continent.
La Nina features a stronger and extended polar jet stream from Alaska and western Canada down into the United States. But the El Nino features a stronger Pacific jet stream and an amplified storm track over the southern United States.
LA NINA WEATHER PATTERN
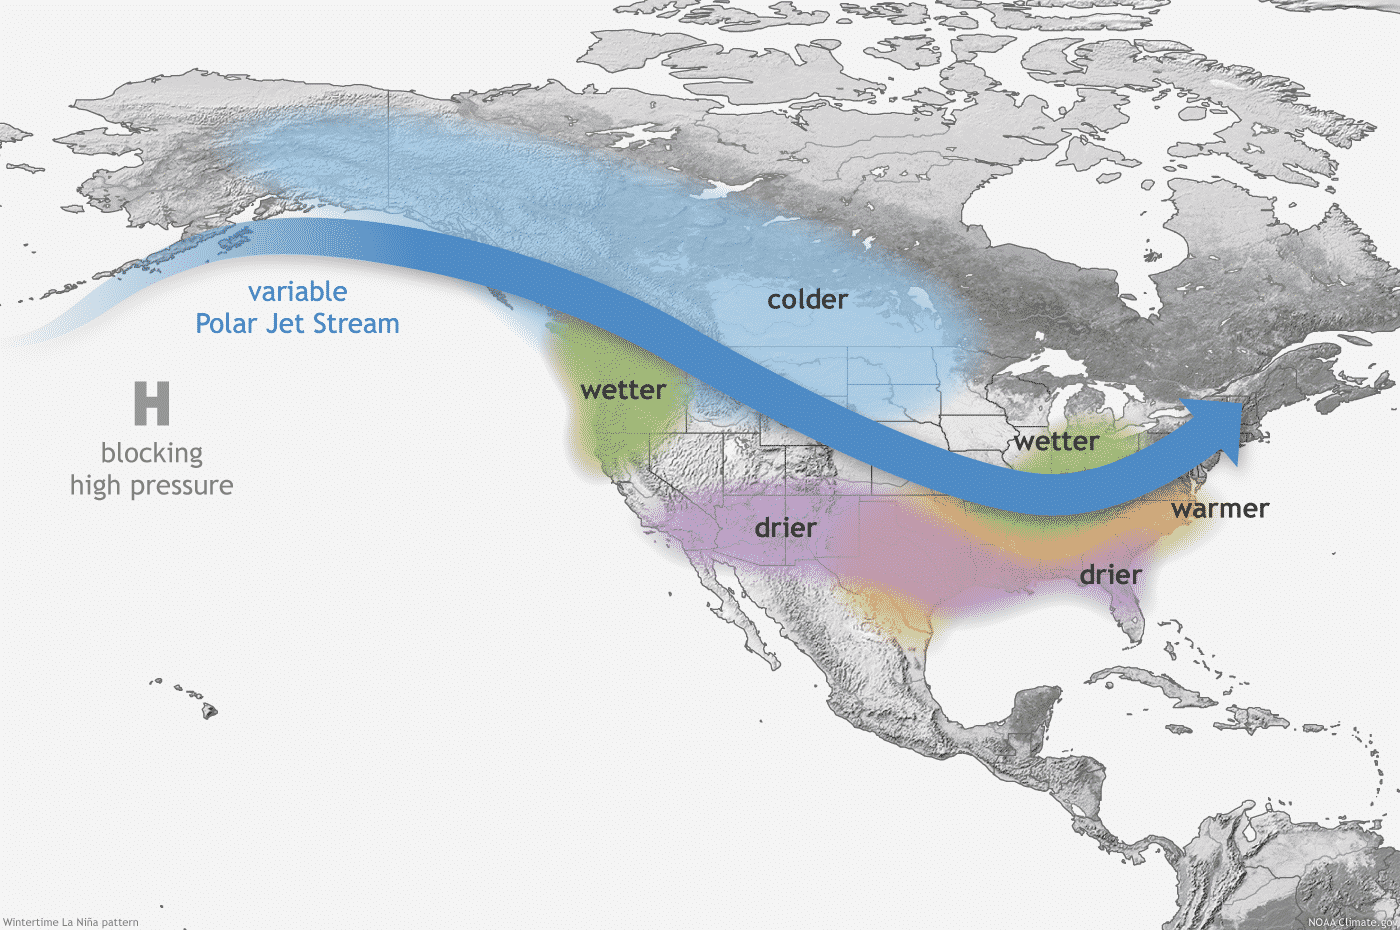
Looking closer at the La Nina weather signature below, we can see that its main feature is a strong and persistent high-pressure system in the North Pacific. That bends the jet stream from the northwest down to the southeast, creating a colder north/warmer south weather pattern over the United States.
Alaska, western Canada, and the northern United States typically get a colder than normal winter, with more precipitation. Southwestern and the southern United States usually experience warmer and a bit drier conditions during a La Nina winter season.
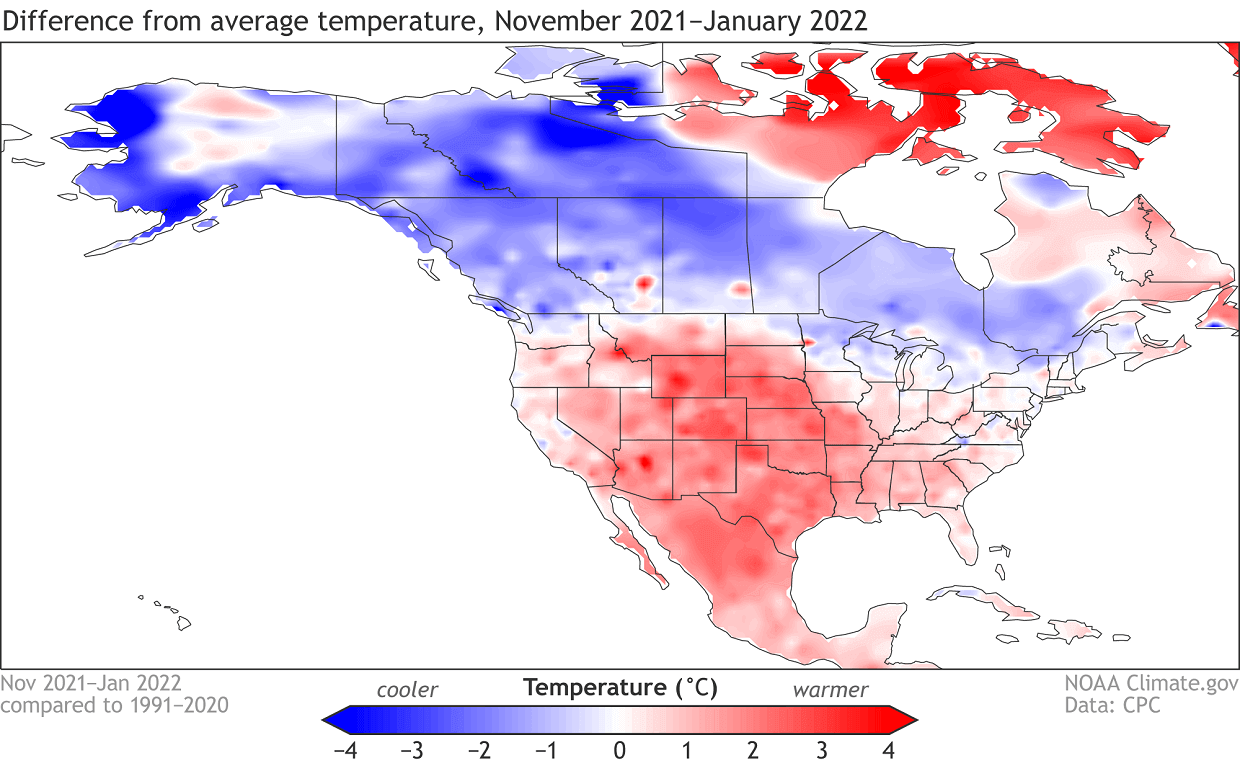
Below we have the temperature anomaly analysis for North America in November 2021 to January 2022 period. It nicely shows a very similar temperature pattern to the average expected La Nina response above. Image is by NOAA Climate.
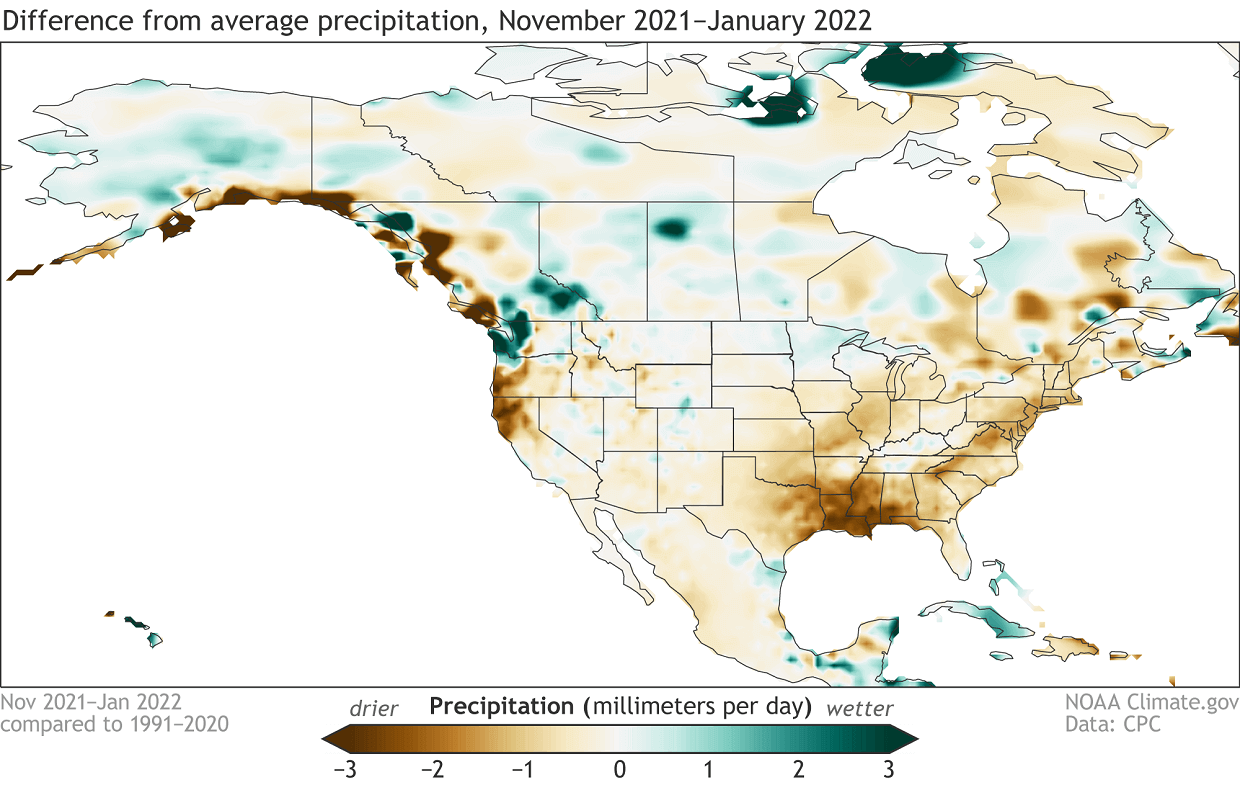
Precipitation-wise, it is also a good fit with the expected La Nina pattern, as we see drier conditions across most of the southern and southeastern United States.
A difference in the jet stream also changes the snowfall potential over the continent. The colder air is more easily accessible to the northern United States, which also means that it has an increased snowfall potential during a La Nina winter, seen on the average pattern below.

Especially areas like Alaska, western Canada, and the northern United States benefit from the jet stream above to produce weather patterns with more snowfall. The graphic above is by NOAA-Climate.
EL NINO WEATHER PATTERN
On the other hand, during the El Nino winter season, we have a strong and persistent low-pressure area in the North Pacific. That pushes the polar jet stream further to the north, bringing warmer than normal flow to the northern United States and western Canada. The southerly Pacific jet stream is amplified, bringing storms with lots of precipitation and cooler weather to the southern United States.

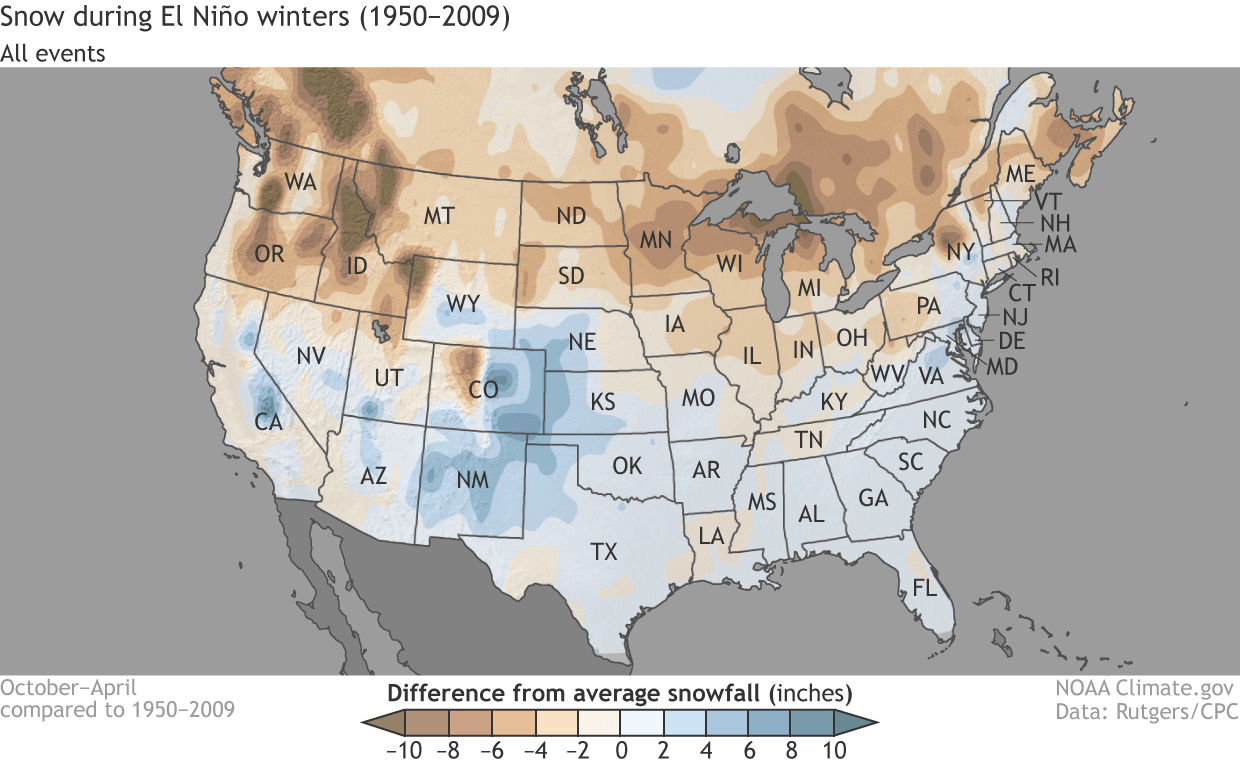
Looking at the average snowfall for an El Nino winter, we can see a much different picture than with the La Nina. There is less snowfall in the northern United States during the El Nino seasons. Mostly warmer than normal and drier than normal conditions in the north limit snowfall. But there is more snowfall in the west-central United States and in the parts of the eastern United States, with cooler weather and more moisture.
After passing Canada and the United States, the jet stream moves into the North Atlantic, where it can take different paths towards Europe. A lot depends on the overall circulation pattern and the existing pressure systems in the North Atlantic.
This is where ENSO generally perhaps loses its direct influence over Europe, as regional systems in the Atlantic interfere.
But it usually still has an important influence, as it changes the position of the entering jet stream from the west. The jet stream can merge with the pressure systems in the Atlantic, helping to create a whole new weather pattern for Europe.
Typically, the main problem is that the final outcome is far more unpredictable in this zone than over North America, which feels a much more direct and predictable influence.
UNITED STATES TORNADO SEASON 2022 – ENSO INFLUENCE
As history shows, ENSO can also have a profound influence on the Spring tornado season in the United States.
Below we have a very interesting image from NOAA Climate. It shows a frequency of hail and tornado events during the spring season in the United States, during El Nino and La Nina seasons.
It is quite interesting to see, that in a La Nina spring season, there is a substantially higher frequency of hailstorms and tornado events. The highest frequency can be found in the south-central parts of the United States.
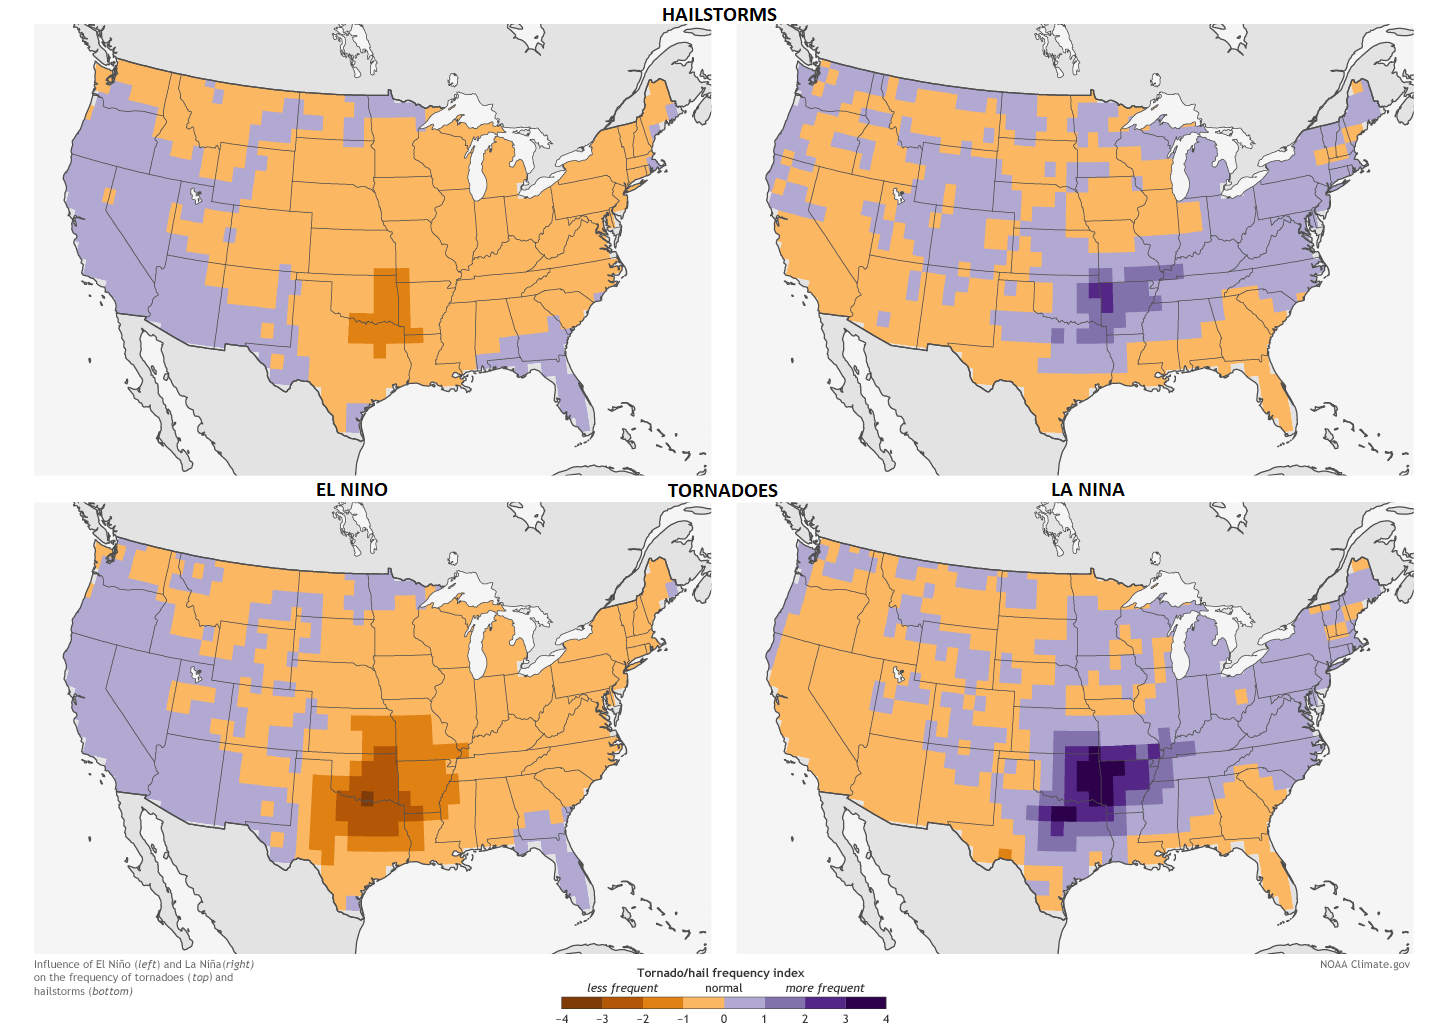
This nicely outlines the Tornado Alley. This is a nickname given to an area in the southern plains of the central United States that consistently experiences a high frequency of tornadoes and other severe weather events each year.
But why are there more tornadoes and other severe weather in the southern United States during a La Nina?
A lot has to do with the weather pattern we have seen earlier during a typical La Nina season, promoting a high-pressure system in the North Pacific. That typically corresponds to the pressure drop over western Canada and the northwestern United States.
This can act as a source region for frequent cold fronts, which move from western Canada down towards the south-central United States. There the cold front meets warm moist air coming up from the Gulf of Mexico.
Thanks to the change in the jet stream, this produces a very volatile combination with a lot of available thermal and wind energy for the storms to become severe and tornadic.
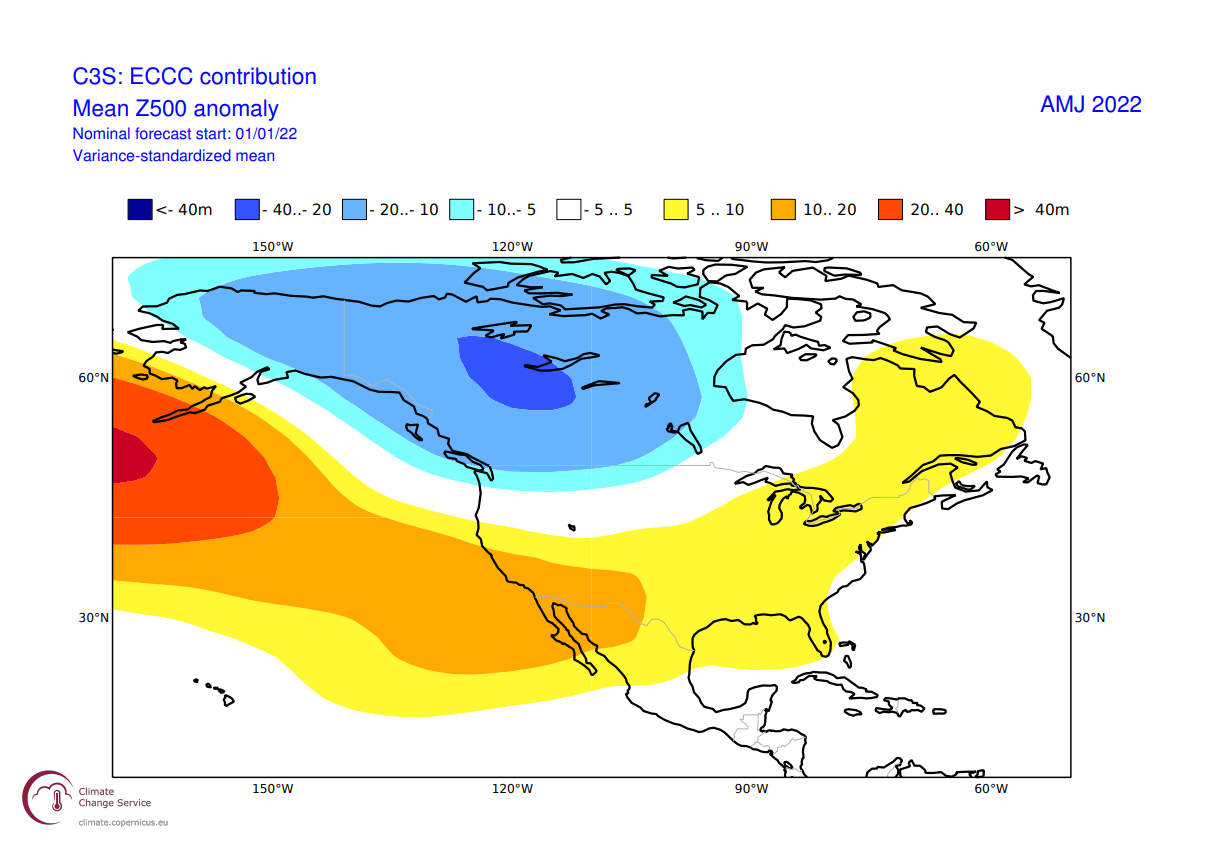
The image below shows the April-May-June pressure forecast from ECCC. We can see the lower pressure over western Canada, extending down into the northwestern United States. This sustains the cold pool in western Canada, fueling frequent cold fronts in spring.
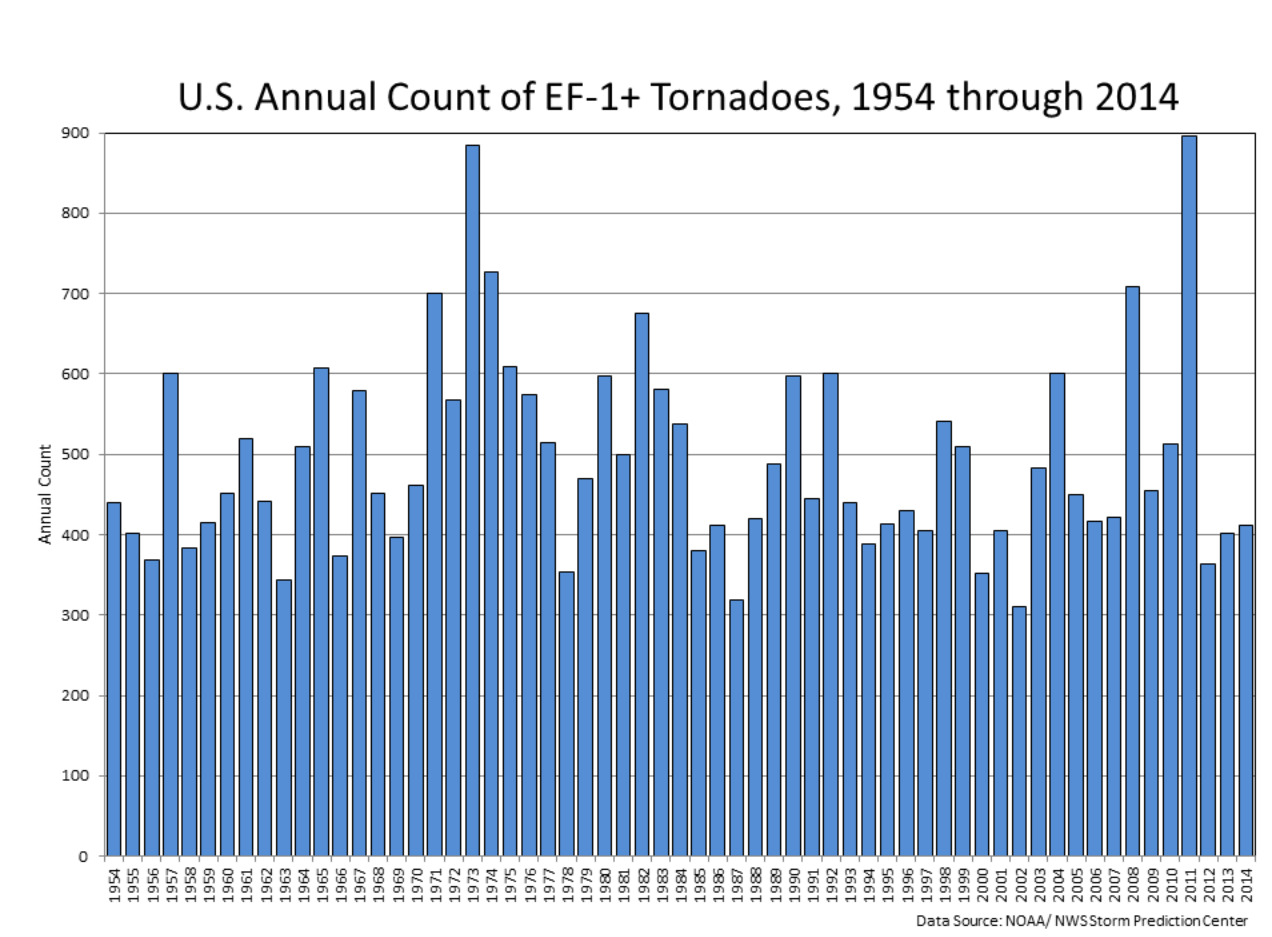
Below is also a graph that shows annual tornado numbers in the United States from 1954 to 2014. Looking at the years, we can see that from the top 5 most active tornado years, 4 were La Nina years.
LA NINA 2022 SEASONAL WEATHER INFLUENCE
We will quickly extend our look into the seasonal trends for Spring 2022, using the ECMWF forecast. The period in question is the meteorological spring season, covering the March-April-May period.
The latest long-range forecast data was issued earlier this month by EMCWF. As we can see below on the pressure pattern forecast, the strong high-pressure system in the North Pacific is still present. That is the fingerprint of the La Nina and is likely to stay present well into the Spring season. Notice the much lower pressure over most of Canada, curving the jet stream into the northwestern United States.
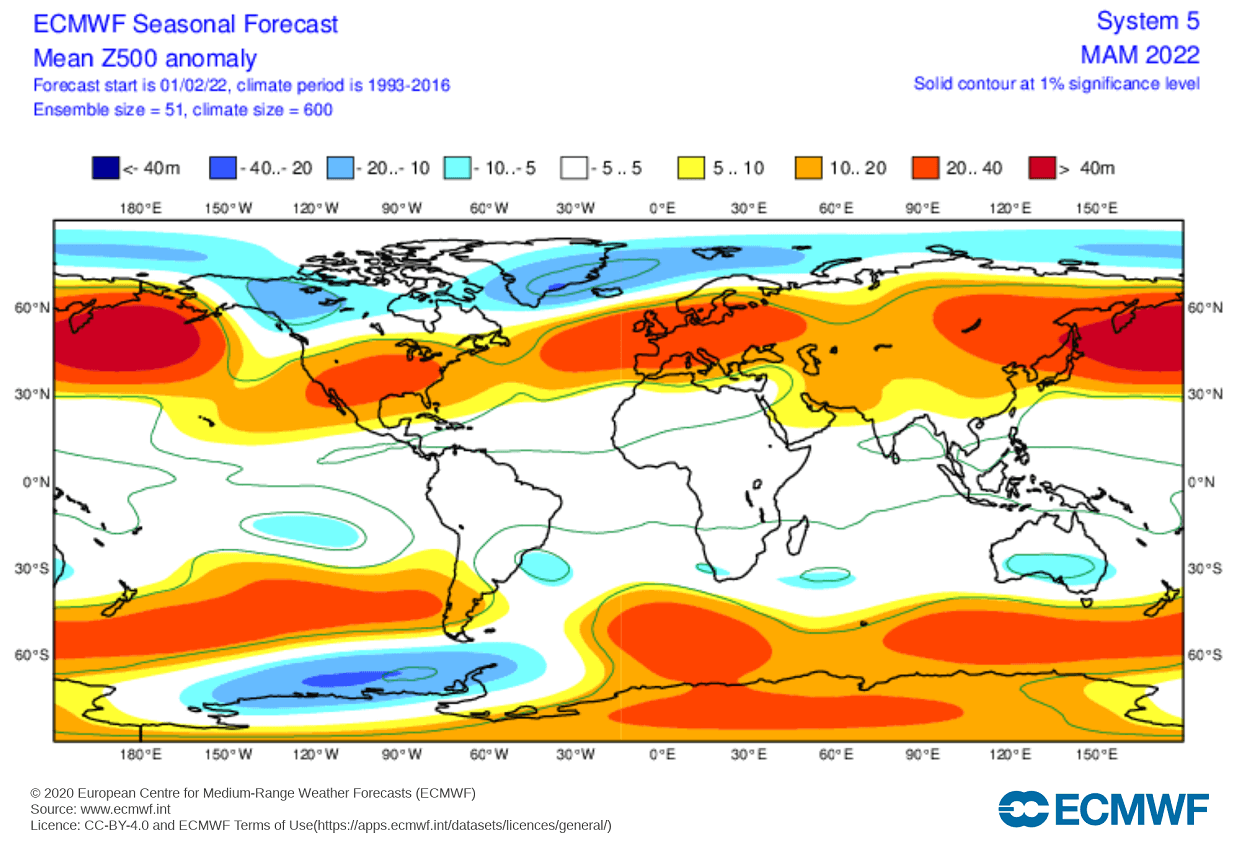
Lower pressure extends into Greenland, keeping the jet stream more the north, and allowing a high-pressure area to expand over much of Europe.
The airmass temperature forecast below shows North America divided into two parts. Western Canada is forecast to be colder than normal. Thanks to the jet stream, there is a high chance of the colder air extending south, into the parts of the northern United States, over the Midwest into the northeastern United States. The Southern United States is forecast to be warmer than normal.
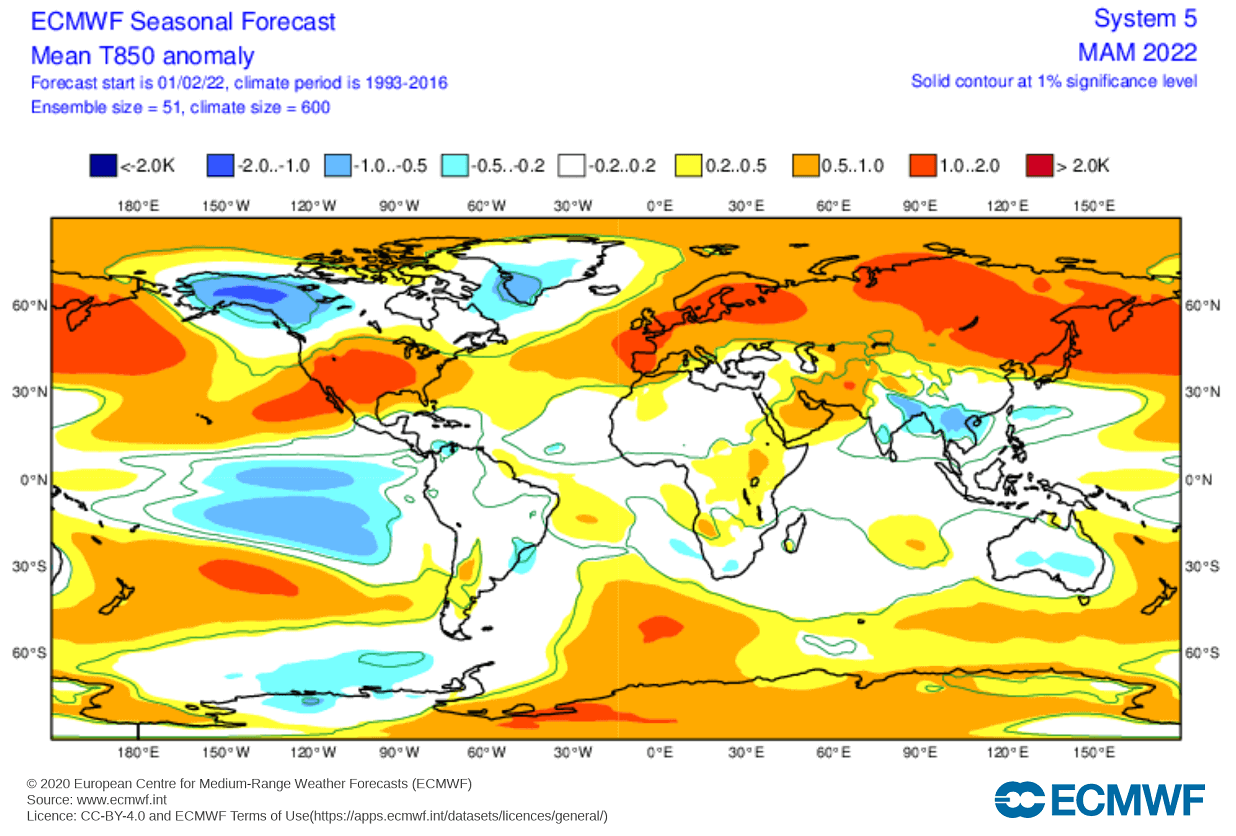
Europe is seen with warmer than normal temperatures, under the high-pressure system. Drought conditions are a worry if this high-pressure area over the continent becomes a semi-permanent feature into early Summer.
Below is the official Spring temperature outlook for the United States by NOAA. It shows the temperature probability, with colder to equal chances in the northern United States. The southern half of the country and the northeast have a higher probability of warmer than normal weather, as seen in the models above.
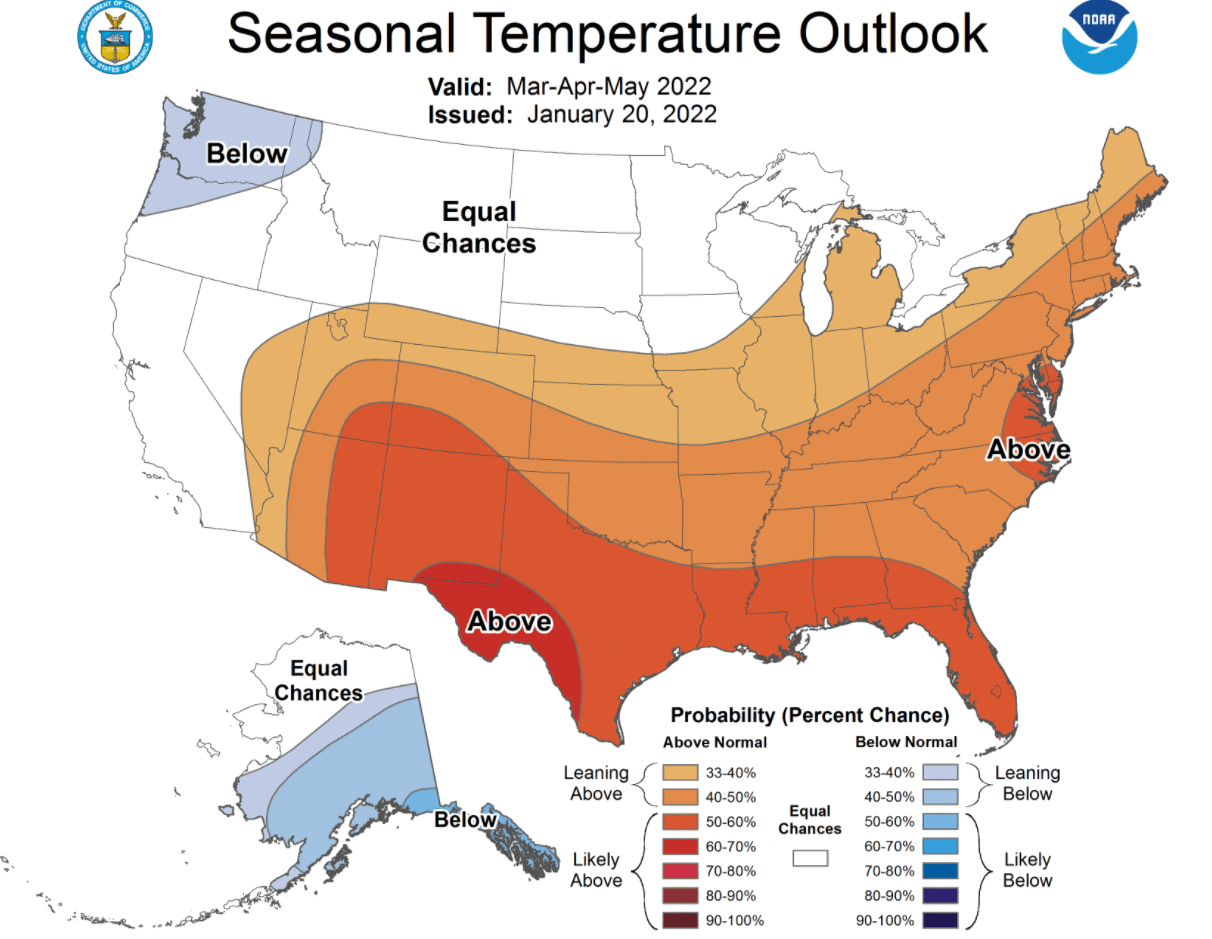
The official precipitation forecast is also quite similar to the model forecast. We see an equal-to-higher probability for more precipitation in the northwestern and the easter United States. The southern United States is forecast to have a drier than normal spring season, especially in the southwest.

Both the actual weather and the forecast show a clear sign that La Nina is having a strong presence in the atmosphere. It will extend its influence into the Spring season in the United States and the entire Northern Hemisphere.
But the confidence is growing for a very different winter season next year. A warm anomaly is already developing in the tropical Pacific Ocean below the surface, increasing the chance for an El Nino emerging in the second half of 2022.
We will keep you updated on the global weather development, so make sure to bookmark our page. Also, if you have seen this article in the Google App (Discover) feed, click the like (♥) button to see more of our forecasts and our latest articles on weather and nature in general.
SEE ALSO: