Based on the latest data, NOAA has released an El Niño advisory showing a rapidly growing El Niño anomaly. A strong El Niño event is expected to develop, with weather impacts spreading across the United States, Canada, and Europe in the Fall and Winter 2023/2024 seasons.
Ocean anomalies have long been known to play an important role in atmospheric circulation and our weather on smaller and larger scales. That is especially true during the Winter season when the pressure systems are strongest.
An El Niño event can also be used as an indicator, not just the cause, as it tells us what the current state of the atmosphere is that produced it in the first place. You will see how El Niño is currently growing and how it is expected to influence the upcoming cold weather season of 2023/2024.
A STORY OF THE OCEAN AND ATMOSPHERE
El Niño is a warm phase of the ENSO, which stands for “El Niño Southern Oscillation.” This region of the equatorial Pacific Ocean regularly shifts between warm and cold phases. Typically there is a phase change around every 1-3 years.
The image below shows the ENSO regions across the tropical Pacific. Regions 3 and 4 expand over the east and west tropical Pacific. The main region is seen in the image as the Nino 3.4 region. This is where the main strength of a warm/cold event is calculated from.

Each ENSO phase influences the pressure and weather in the tropics differently. This affects the overall global circulation over time, changing the weather patterns worldwide.
A (cold/warm) phase usually develops between late Summer and early Fall. It then lasts until Spring, but some events can last up to two or three years.
The cold ENSO phase is called La Niña, and the warm phase is called El Niño. Besides the ocean temperatures, one of the main differences between the phases is the pressure patterns they promote, seen below as high (H) and low (L) pressure zones.
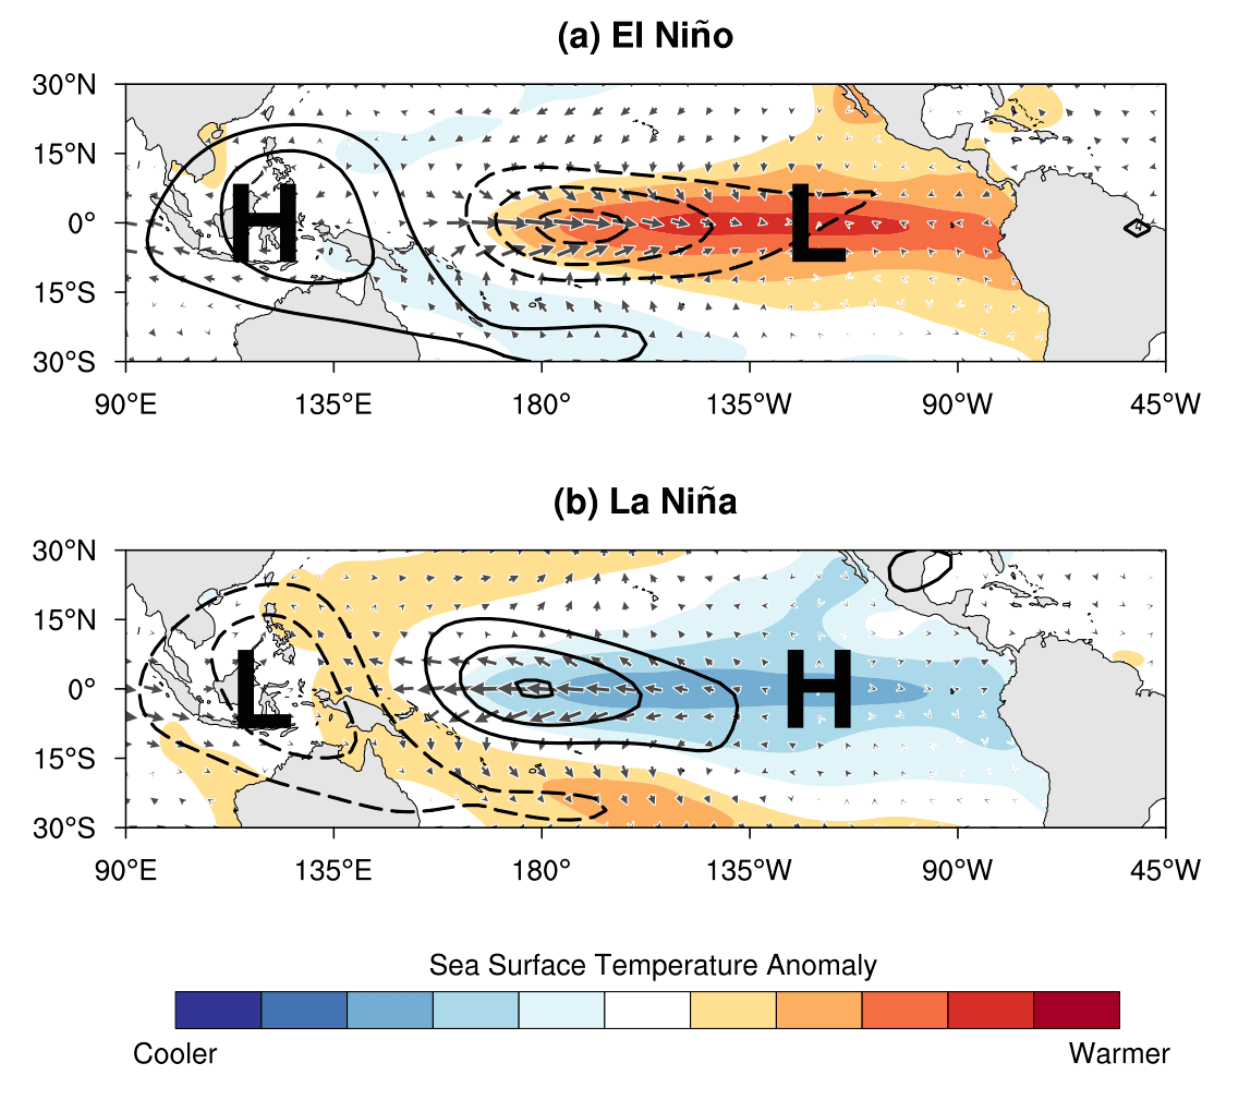
During an El Niño, the pressure over the tropical Pacific drops, with more rainfall and storms in this region. But during a La Niña, the pressure over the equatorial Pacific rises, creating stable conditions and fewer storms.
These pressure changes translate into global circulation over time, affecting seasonal weather over both Hemispheres. We can observe a global shift in pressure patterns during the emergence of an ENSO phase. But it is usually more influential during the peak of its phase in Fall and Winter.
The following image below from NOAA Climate shows the typical circulation during an El Niño event, which will be the dominant phase for the next ten months at least.
Rising air in the eastern Pacific causes more storms and precipitation and lowers the pressure over that region. At the same time, the air is descending in the western Pacific, causing stable weather and high-pressure conditions.

This way, ENSO has a strong impact on the tropical rainfall and pressure patterns, affecting the ocean-atmosphere feedback system. Through this ocean-atmosphere system, the ENSO influences the weather globally.
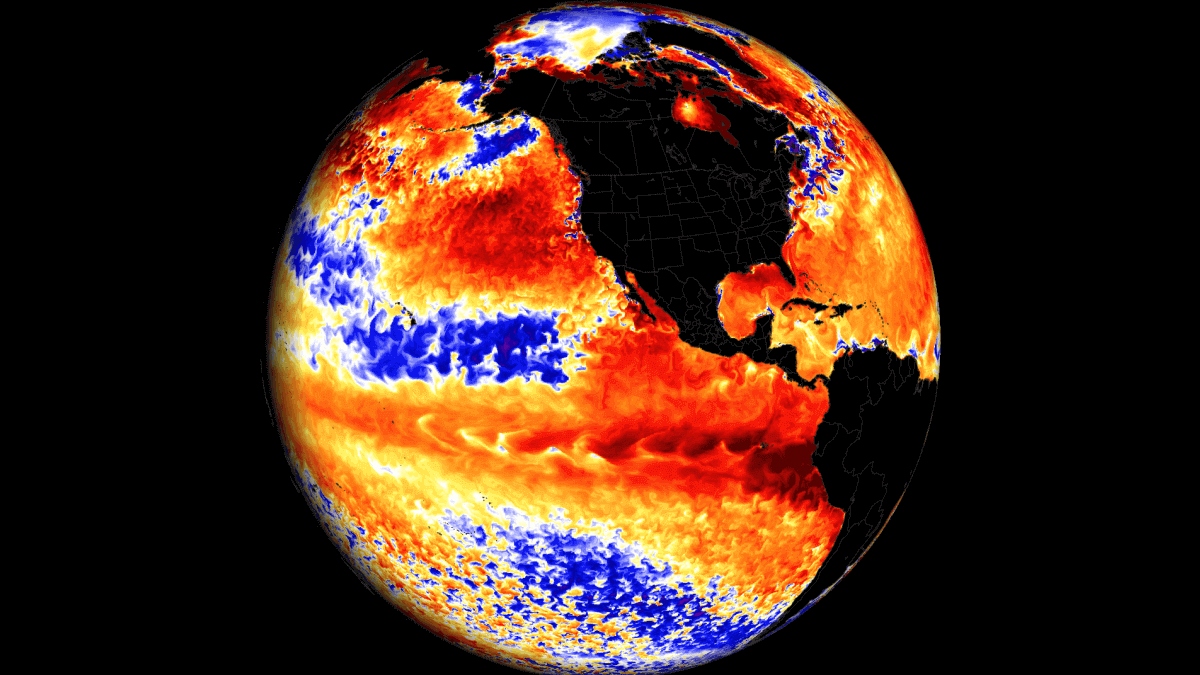
So how does the El Niño currently look in nature? To see that, we need to look at the ocean surface temperatures and how warmer/colder they are from the long-term average (anomaly).
Below you can see the latest ocean anomalies across the Pacific Ocean. You can see the El Niño as a belt of strongly warm anomalies across the central and eastern tropical Pacific Ocean.

This change in ocean temperature is also an effect of several large-scale atmospheric and oceanic changes. So an El Niño can also be seen as an indicator of certain atmospheric changes that later bring us the expected weather changes.
WINDS OVER THE OCEAN
But how can ENSO shift between cold and warm phases so rapidly? The simplest answer is that it happens because of a complex relationship between pressure, winds, and ocean currents.
Global trade winds usually start or stop a certain ENSO phase by overturning the ocean surface layers and changing the ocean currents. Trade winds are steady and persistent winds, blowing towards (and along) the equator in both Hemispheres.
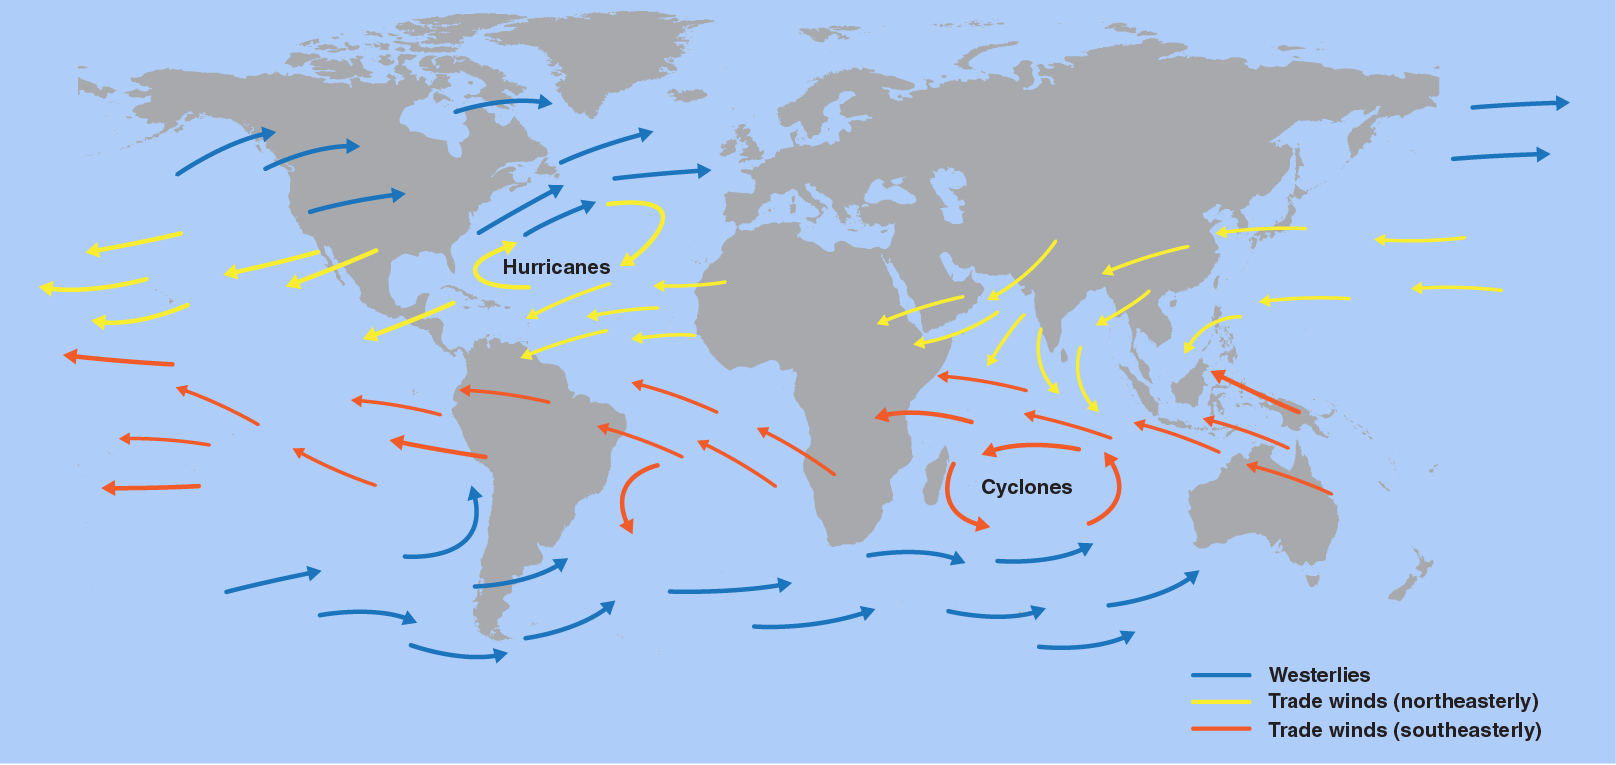
But the key here is not just in the winds, as pressure differences drive them. Thus, the ENSO phase directly responds to an atmospheric pressure change called the Southern Oscillation Index (SOI).
Below is the zonal (westerly) wind anomaly forecast for the tropical Pacific region. You can see a strong positive anomaly marked in the ENSO regions. That supports further warming of the central and eastern ENSO regions.

You can see the effects of the trade winds in the video below. It shows the ocean temperature anomalies from late Winter to mid-Summer 2023.
The cold La Niña anomalies quickly broke down over the Winter, with warm anomalies emerging in early Spring. Notice the motion of the anomalies, being driven by the trade winds.
OCEAN ANOMALIES TOP AND BOTTOM
Another important aspect of ocean changes is the sea level height. In the image below, you can see sea level height anomalies from the Sentinel-6 satellite. You can see a strong ocean sea level rise in the easterly tropical Pacific, a clear sign that El Niño is active. This is the latest image currently available. Image by NASA JPL

As described by NASA: The data shows Kelvin Waves 2 to 4 inches (5 to 10 centimeters) high at the ocean surface and hundreds of miles wide, moving from west to east along the equator.
But what are these Kelvin waves?
The best example of an oceanic Kelvin wave in action can be seen in the image below. It shows the subsurface ocean temperature anomalies in early April. The large below-surface warm pool is the Kelvin wave, growing larger and spreading towards the east and up to the surface, where it comes to the surface.
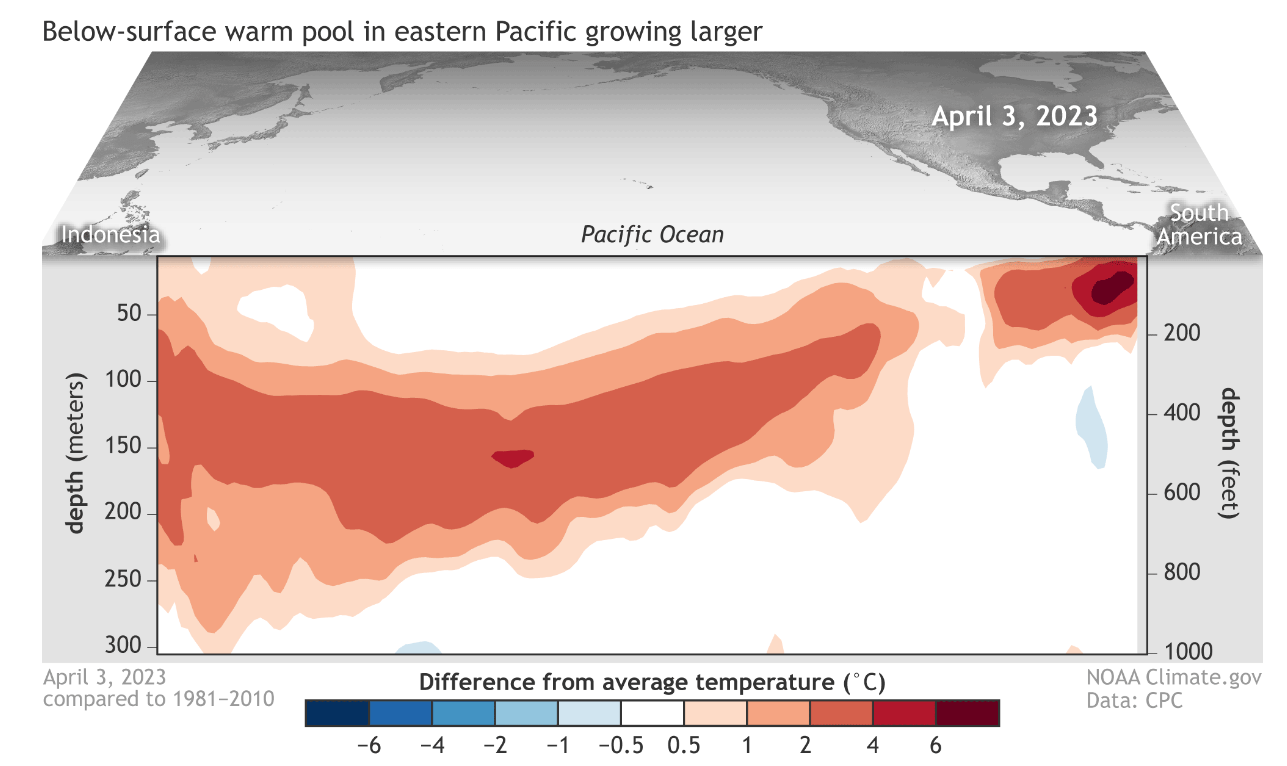
A strong subsurface warm pool is the main pre-condition to kickstart an El Niño event. Therefore, the atmospheric winds and ocean currents across the tropical Pacific are closely monitored.
The changes in the ocean heat content are mainly due to the expansion and rise of the strong subsurface warm pool, seen in the previous image. That also causes the sea level height to increase, usually associated with warmer waters.
The latest subsurface data shows how the Kelvin wave has developed now. You can see warm ocean anomalies by depth, covering most of the top 150 meters (500 feet) of the equatorial Pacific in warmer than normal waters.

This has prompted NOAA Climate Prediction Center to issue an official El Niño watch in April. The watch was upgraded into an Advisory in July, with the latest outlook giving a greater than 95% chance of El Niño impacting the next Winter season of 2023/2024.
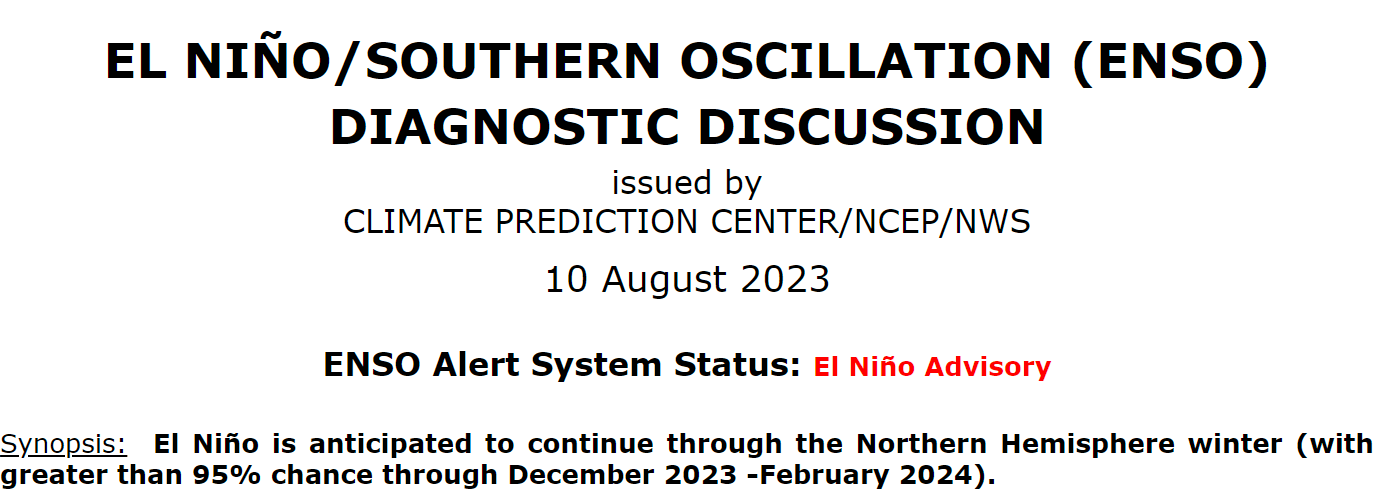
In their latest discussion, they write: “The most recent IRI plume indicates El Niño will persist through the Northern Hemisphere winter 2023-24. Given recent developments, forecasters are more confident in a “strong” El Niño event.”
It means that the current and expected atmospheric conditions will be favorable for a strong El Niño event to develop and impact the upcoming weather seasons into 2024.
THE El Niño STILL GROWS
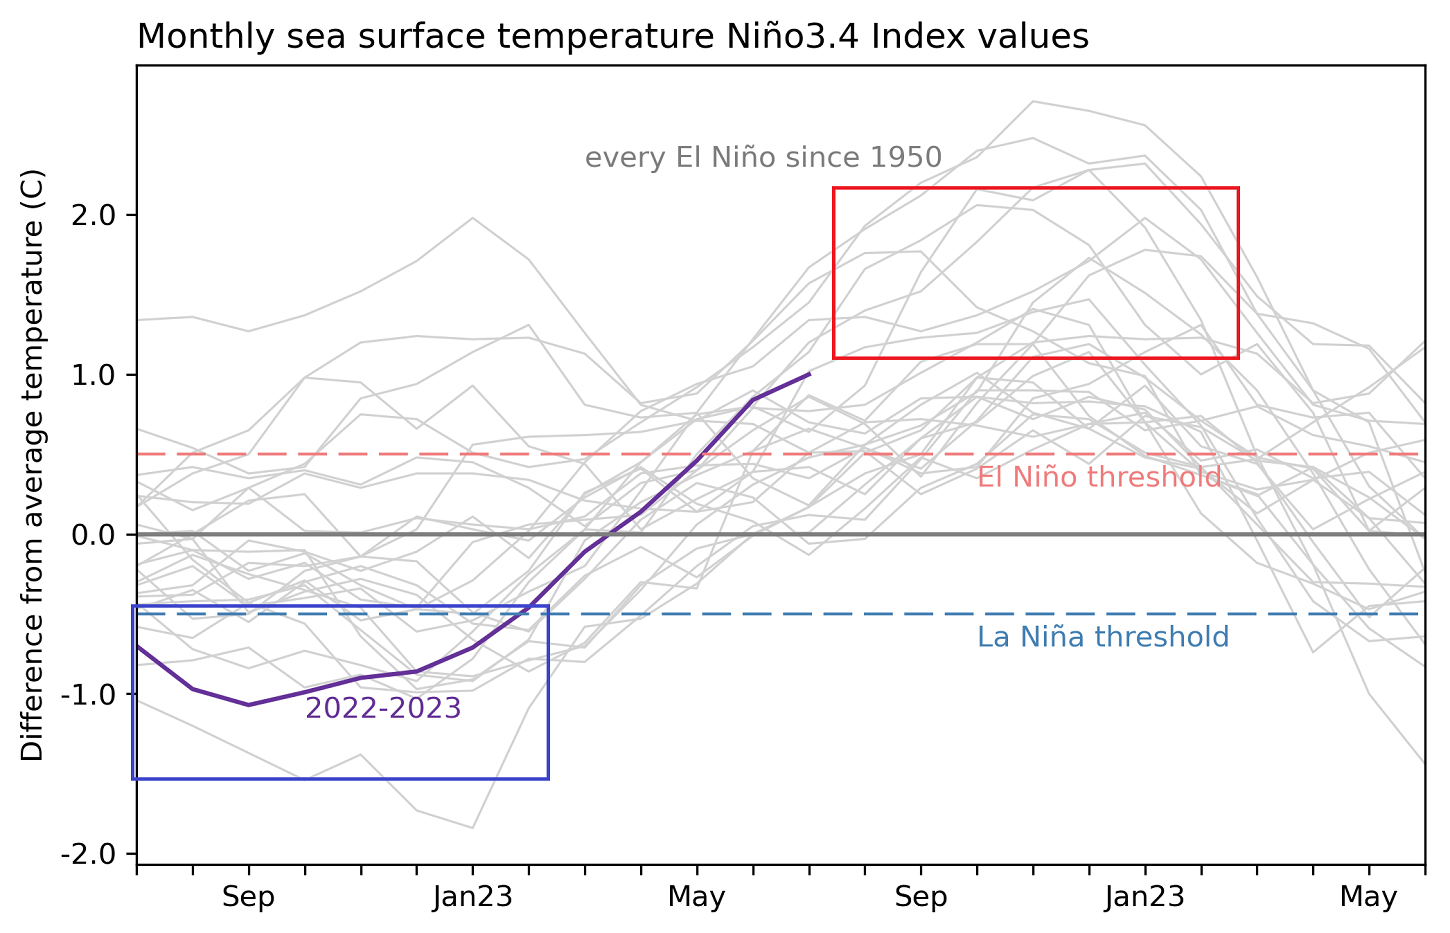
Below you can see the ENSO region anomaly data for the 2022/2023 seasons. Notice the rapid rise in ocean temperatures, as the region was still coming out of an active La Niña phase from last Winter. The grey lines show all first-year El Niño events since 1950, giving a projected/expected development trend.
Looking more closely at the latest high-resolution analysis of the ENSO regions below, you can see a strong warm belt across the equator. And not only that, you can see strong warm anomalies are present in the eastern parts of the ENSO regions, exceeding 5 degrees Celsius.
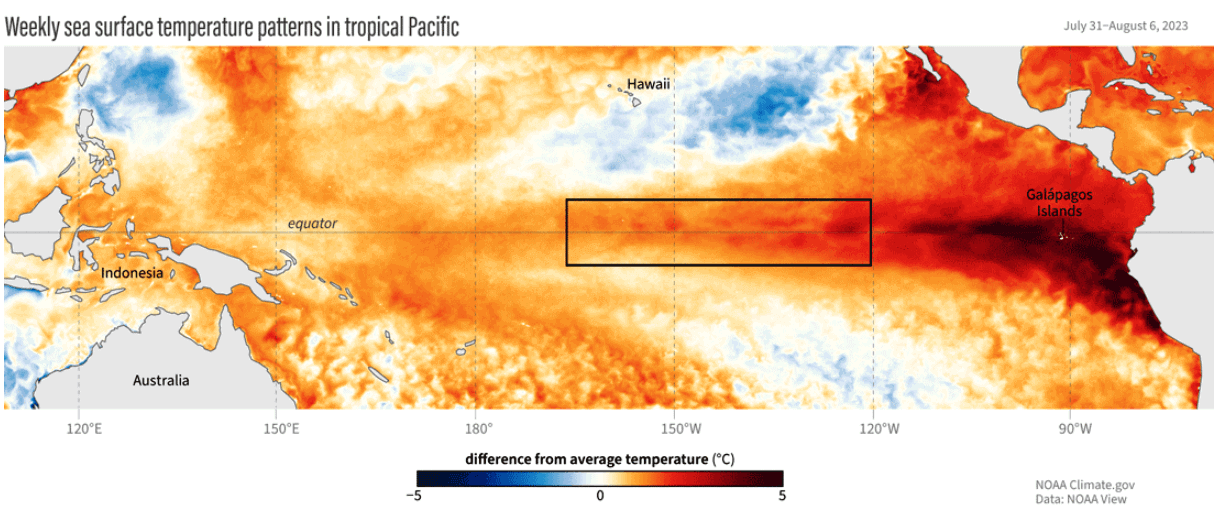
The black-marked area is the ENSO region 3.4. That is the region where the main stats are calculated, and we can determine the event’s strength.
Another way to look for El Niño is actually in the atmosphere. Below is a graphic that shows the usual atmospheric circulation during an El Niño event.

You can see strong rising motion in the eastern and central tropical Pacific, creating clouds and precipitation. Over the western Pacific and the Indian Ocean, you can see strong descending (sinking) motion. That causes less clouds and drier weather.
The next image below is an ECMWF forecast for September 2023. In simplified terms, it shows the atmospheric motion at the 200hpa pressure level (~13km/8 miles). The blue/green colors show a rising motion, while the brown hues show a sinking motion. Image by meteorologist Ben Noll

This shows that the expected atmospheric pattern looks like a typical El Niño pattern. This forecast shows that El Niño is starting to also be present in the atmosphere, right on time for Fall and especially the Winter 2023/24 weather season.
But other areas around the globe also have strong and unusual anomalies.
GLOBAL OCEANS IN TURMOIL
While El Niño is growing, the global oceans around it are also in distress. Some regions, like the Atlantic Ocean, even reach unusual values for this time of year.
Below is the latest global ocean analysis from NOAA, and we have marked three important areas to watch. First is the North Pacific, currently running very unusual warm anomalies. Second, is the North Atlantic, where you can see a strong anomaly area from the equator to the polar circle.

Last but not least, you can see the ENSO regions and the developing El Niño warm anomalies. But overall, the global oceans are exceptionally warm this year.
The image below shows the daily sea surface temperatures globally for 2023. Notice the period since early April is the warmest in the past 40 years and likely even more. And this is with the El Niño just starting to develop.
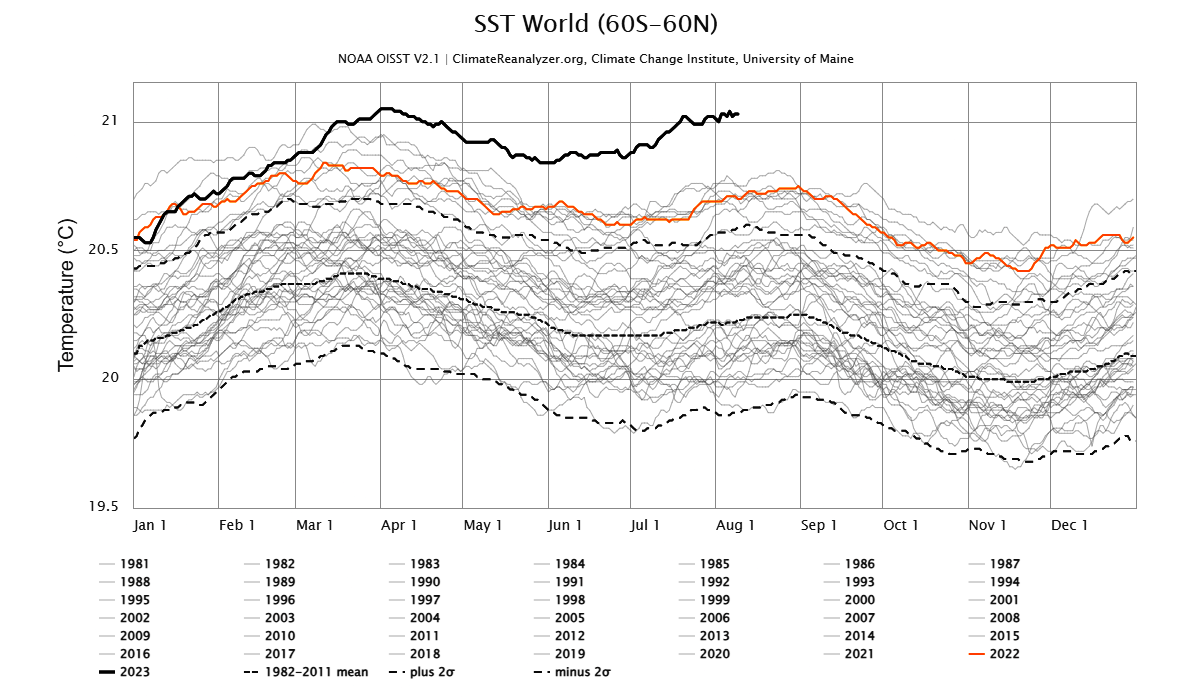
This is a very unique situation, with abnormally warm North Pacific, North Atlantic, and the rest of the globe running warmer on average. Usually, there is a larger contrast with an El Niño, but this year, the oceans are already running record warmest, without the El Niño fully developed yet.
We are entering uncharted waters with such a global configuration, so this El Niño might be something we have not seen before.
So how strong will the 2023/2024 El Niño event be?
El Niño 2023/24 LATEST FORECAST DATA
Below is the latest seasonal forecast for the main ENSO region. The ECMWF forecast average takes it over 2 degrees anomaly by early Winter, which is considered a strong El Niño event. The stronger the event is, the stronger its seasonal weather impact usually is.
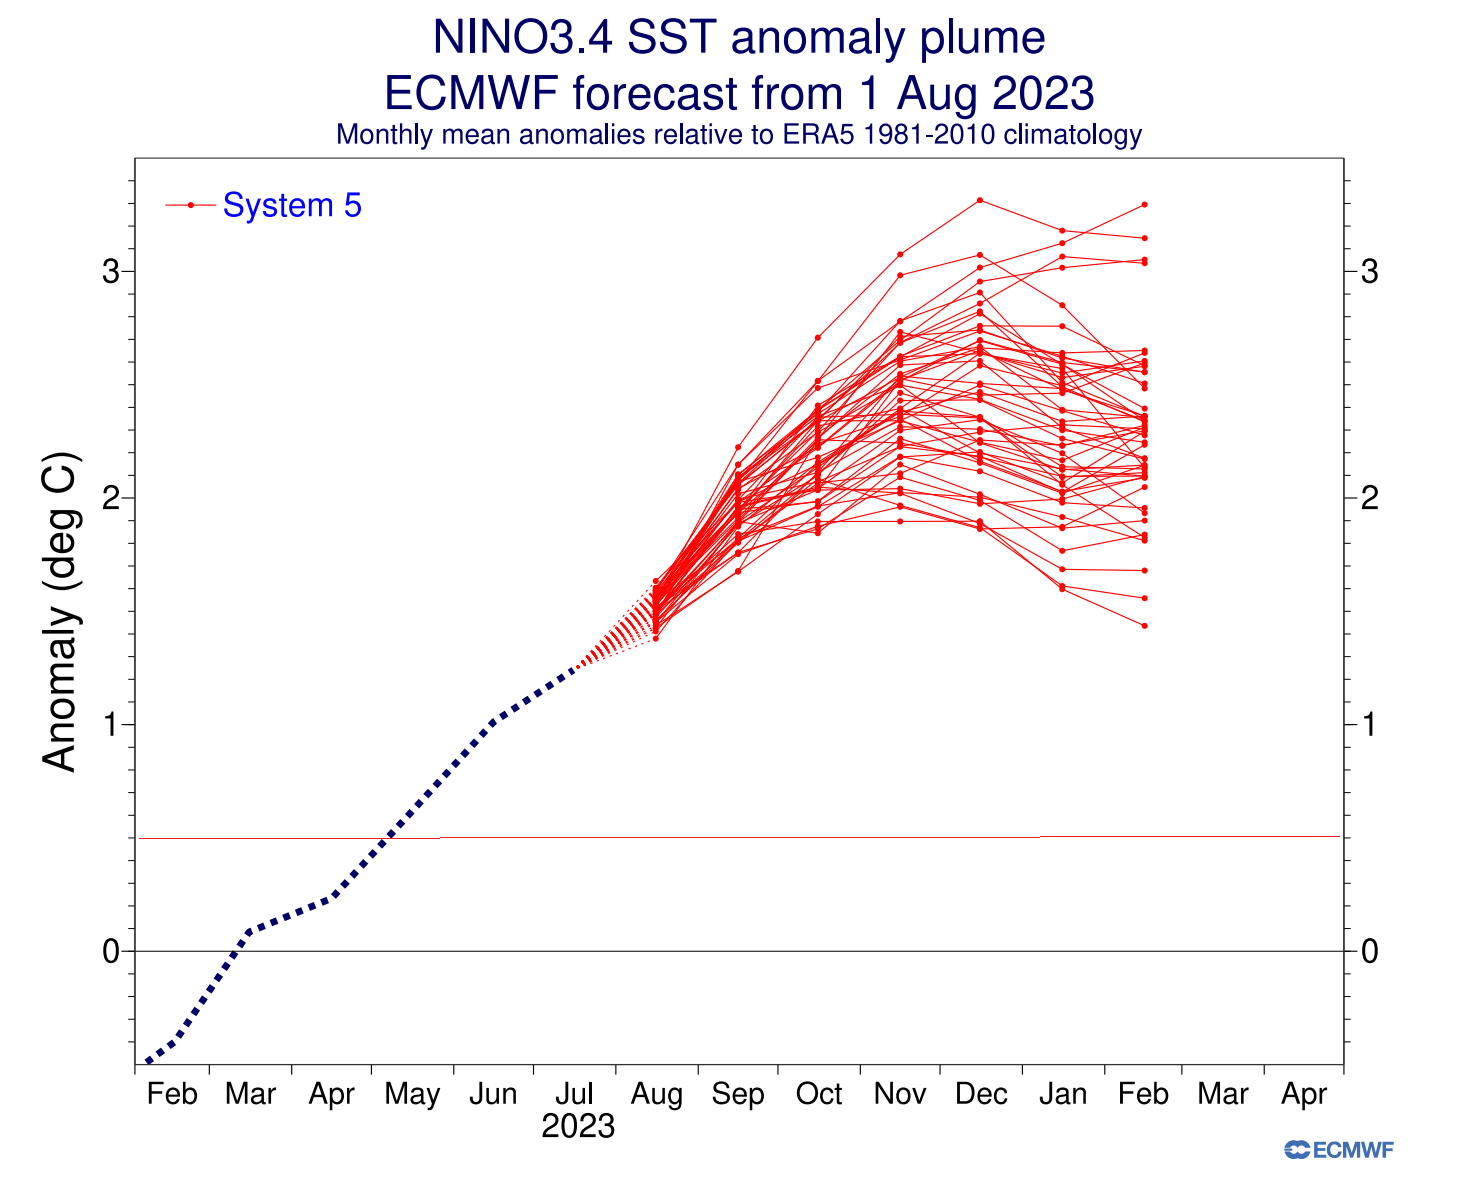
Looking at the extended seasonal ENSO forecast from ECMWF, you can see the ensemble consensus for a strong El Niño event. The red horizontal line is the El Niño threshold (+0.5 degrees). The anomalies are forecast to peak into the strong territory, lasting at least into early Spring of 2024.

But we can see a fast dropoff in Spring 2024, so for now, there are no forecast indications that this will be a “Super El Niño” or a multi-year warm ENSO event.
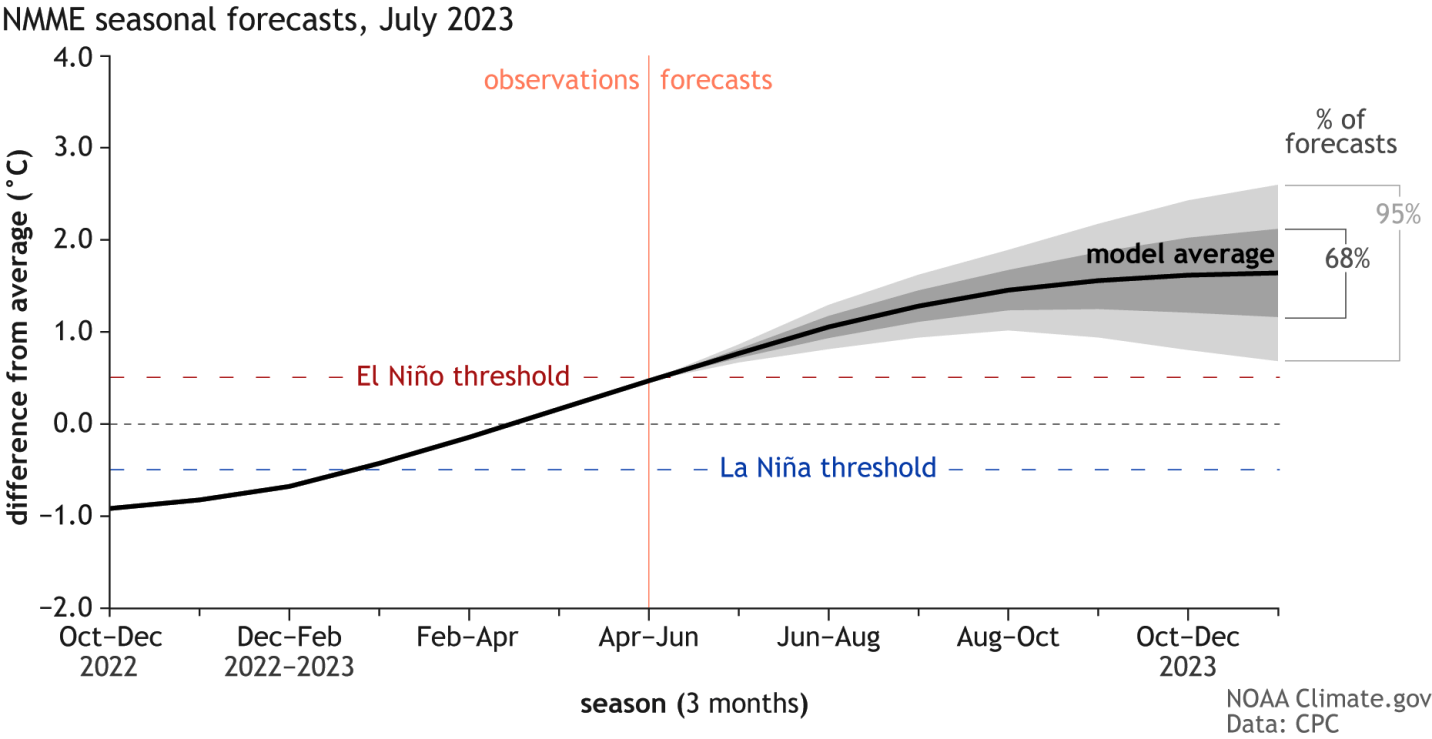
As the top two images are forecasts from the European ECMWF model, we also have the forecast from the North American NMME model system. It perhaps shows a weaker forecast than the ECMWF, but still a moderate to strong El Niño event, lasting over the Winter season 2023/24.
The IRI official probabilistic ENSO forecast shows a full El Niño mode into 2024. The marked seasons span late Fall, Winter, and early Spring. It shows a high probability of an active El Niño event and all of its seasonal weather impacts.

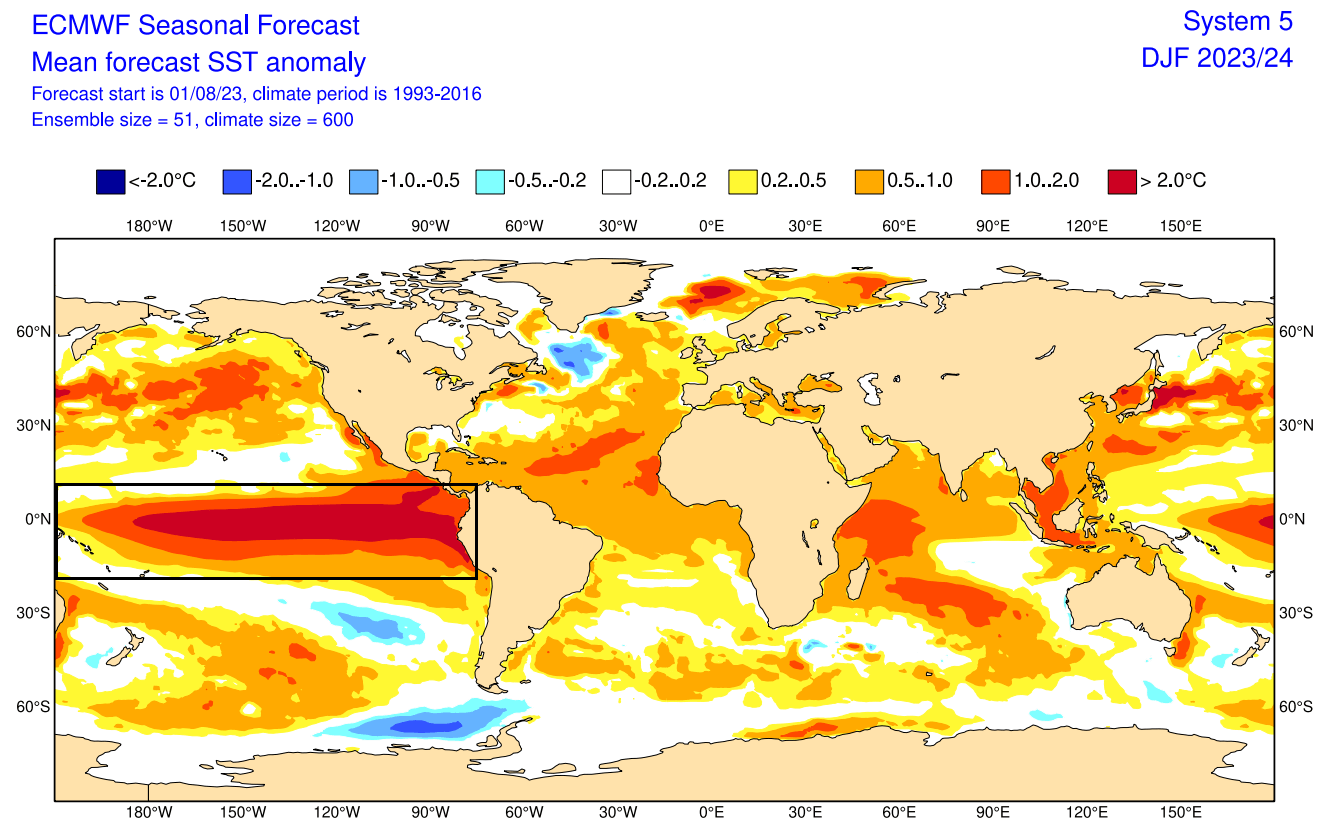
Looking at the Winter 2023/24 ocean forecast by the ECMWF, you can see a strong El Niño event expanding across the entire tropical Pacific. An event of this magnitude is strong enough to have a profound atmospheric response.
Also, looking at the subsurface forecast below by the CFS, we can see a strong warm pool being present in the top 150 meters (500 feet). This also signals a very healthy El Niño event, becoming one of the main weather drivers over the Winter season.

We know what to expect in the oceans based on all this forecast data. But what can we expect in the atmosphere, based on the upcoming El Niño event?
El Niño ATMOSPHERIC WEATHER PATTERN
During the El Niño winter season, there is typically a strong and persistent low-pressure area in the North Pacific. That pushes the polar jet stream further north, bringing warmer-than-normal temperatures to the northern United States and western Canada.

But the southerly Pacific jet stream is extended and amplified during an El Niño, bringing low pressure and storms with lots of precipitation and cooler weather to the southern United States.
You can see exactly that in the jet stream anomaly forecast below from the Copernicus system. It shows the typical strong subtropical jet stream over the southern United States. Image by meteorologist Ben Noll.

A stronger subtropical jet supports moisture transport into the southern United States and thus increasing the odds for snow events in the southern states and across the Mid-Atlantic. That is if there is enough cold air available.
We can also see the typical El Niño weather patterns in the latest pressure forecast for the meteorological Winter season. Below you can see low pressure over the North Pacific, the United States, and northern Europe.
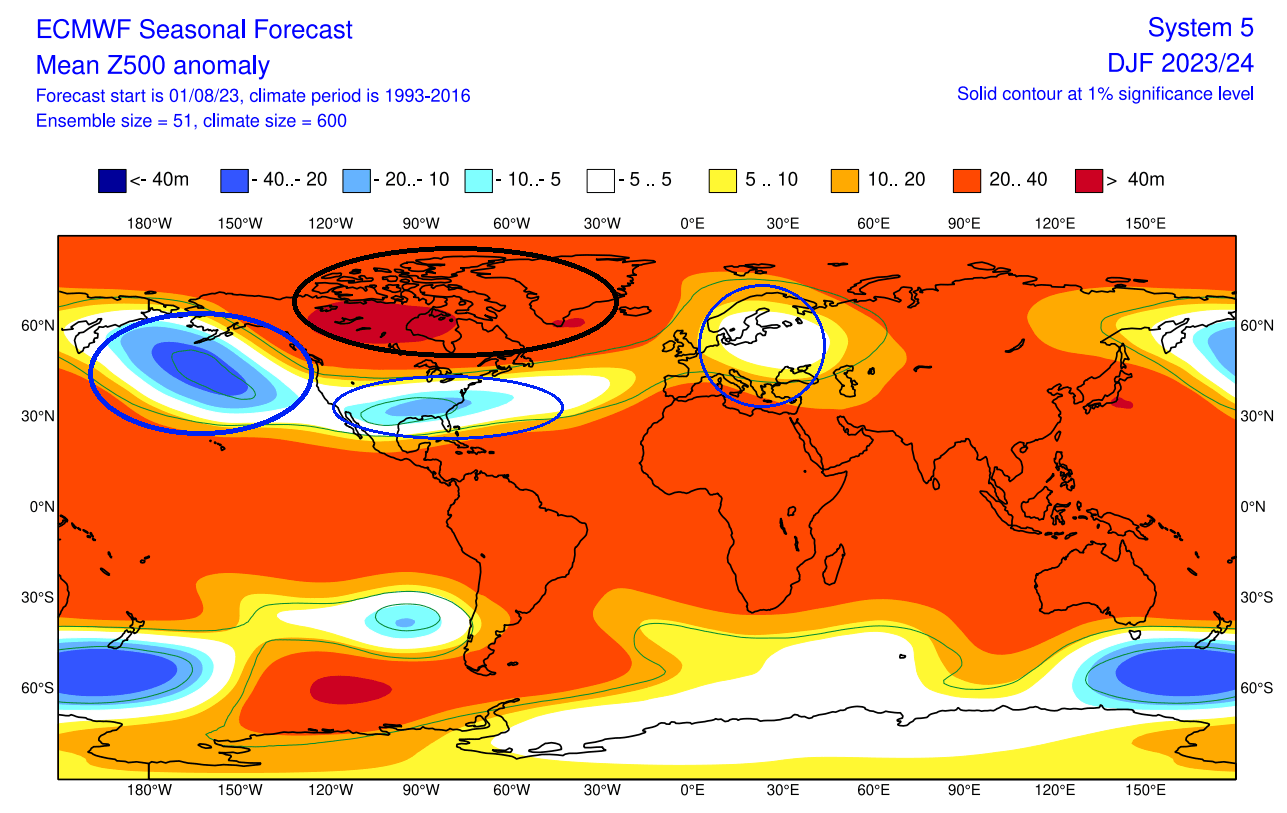
This is the most textbox pressure pattern you can expect from an El Niño event. Such a pattern has good potential for proper winter weather in the mid and late-winter seasons across the United States and parts of Europe.
Looking at the January 2024 pressure pattern forecast from Copernicus EU data, you can see a very strong-looking cold weather pressure anomaly. Blocked northern regions and low pressure with cooler/colder weather spanning the United States and parts of Europe.

A pattern like this would bring colder temperatures and more snowfall across the central and parts of the southern United States, especially across the Mid-Atlantic and the northeastern United States.
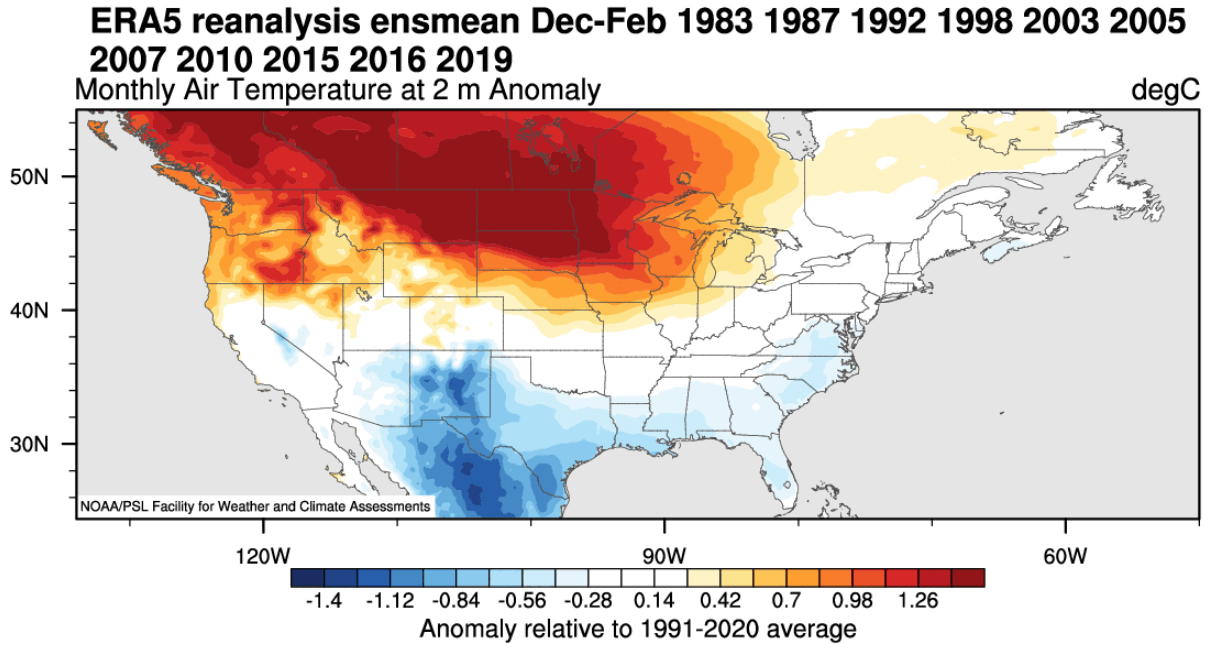
Looking at the temperature anomalies in an El Niño winter, you can see colder temperatures in the southern half of the United States and parts of the eastern United States. The country’s northern half is warmer than usual, with warmth spreading into southern Canada.
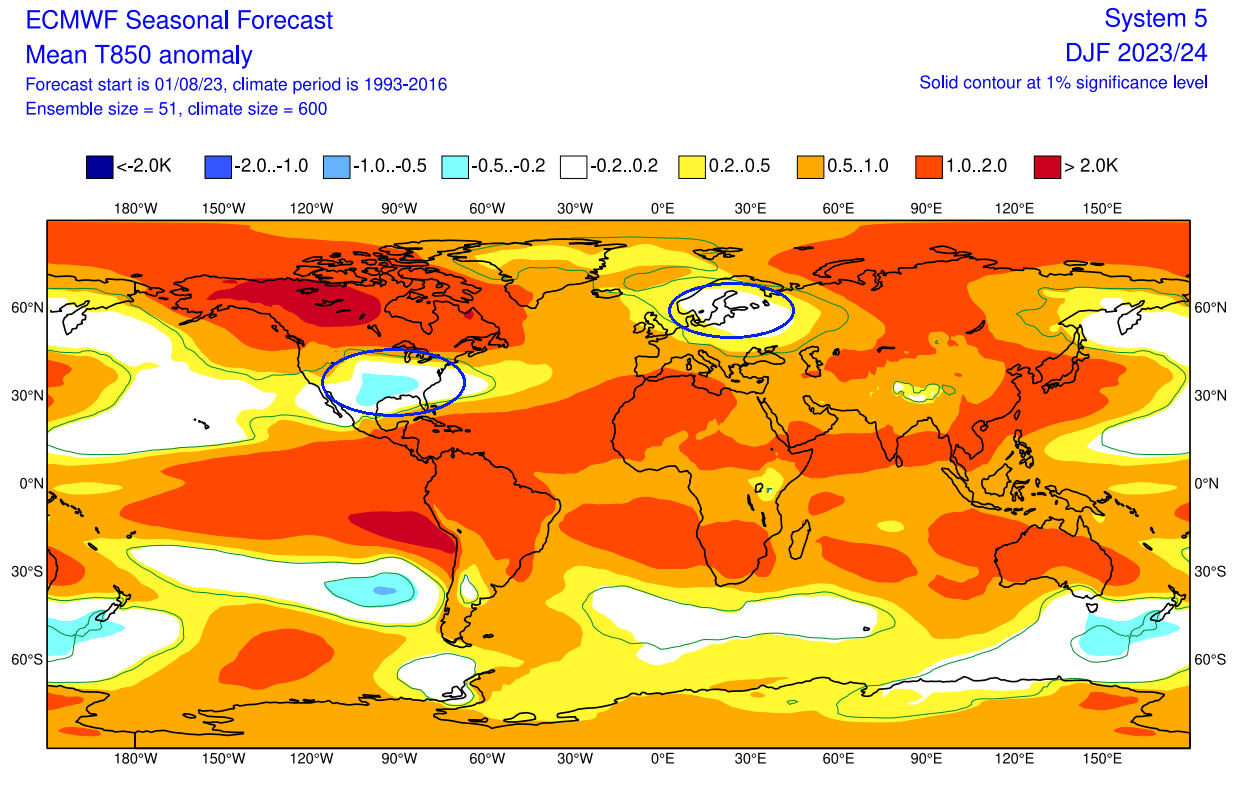
The latest temperature forecast for the Winter season shows a very similar pattern. You can see colder temperatures over much of the southern and central United States and warmth in Canada. Cooler temperatures are also indicated over northern Europe.
Precipitation-wise, an average El Niño winter brings more precipitation to the southern half of the United States, especially in the Southeast. However, drier winter conditions prevail in the northwestern United States and around the Great Lakes, opposite a La Niña’s influence.

El Niño also changes the Winter snowfall patterns, as seen in the image below. In the left image, you can see snow depth anomalies in inches across the United States for the Winter period. You can see a tendency for more snowfall across the southern United States, the Ohio River valley, and much of the northeastern United States.
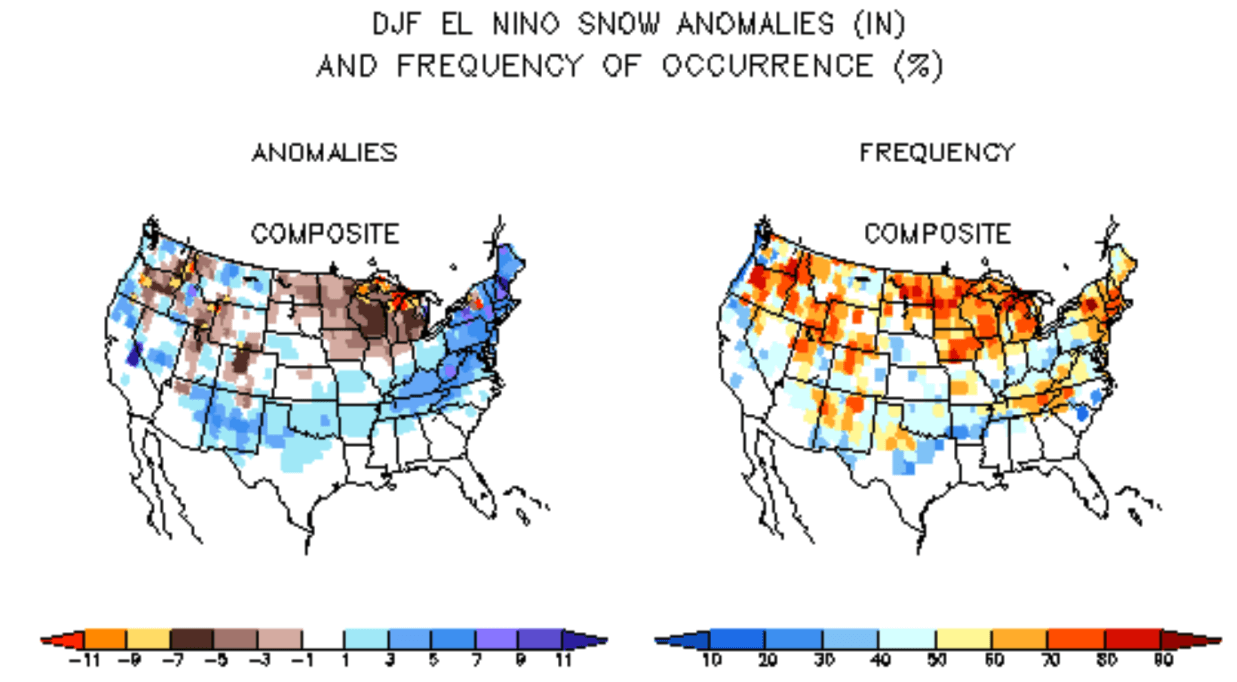
That is mainly due to low-pressure systems trailing across the southern United States. More moisture increases the chances of snowfall in the southern half if cooler air is available. But a lot depends on the availability of the cold air to the north.
Less snowfall is usually seen across the northwestern United States, especially over the upper Midwest and around the Great Lakes.
The image on the right shows the frequency of such snowfall anomalies, giving more confidence to the northern United States for such scenarios.
EUROPE AND ENSO IMPACT
After passing Canada and the United States, the jet stream moves into the North Atlantic, where it can take different paths toward Europe.
The ENSO effects are much less direct in Europe than in North America due to the distance. That is why we focus more on North America to track direct (and more predictable) weather changes.
But still, looking at the historical connections of ENSO to Europe, we produced some graphics below. First is the Winter pressure anomaly signal. It shows a high-pressure tendency over most of Europe, with the subtropical ridge expanding during an El Niño winter season.

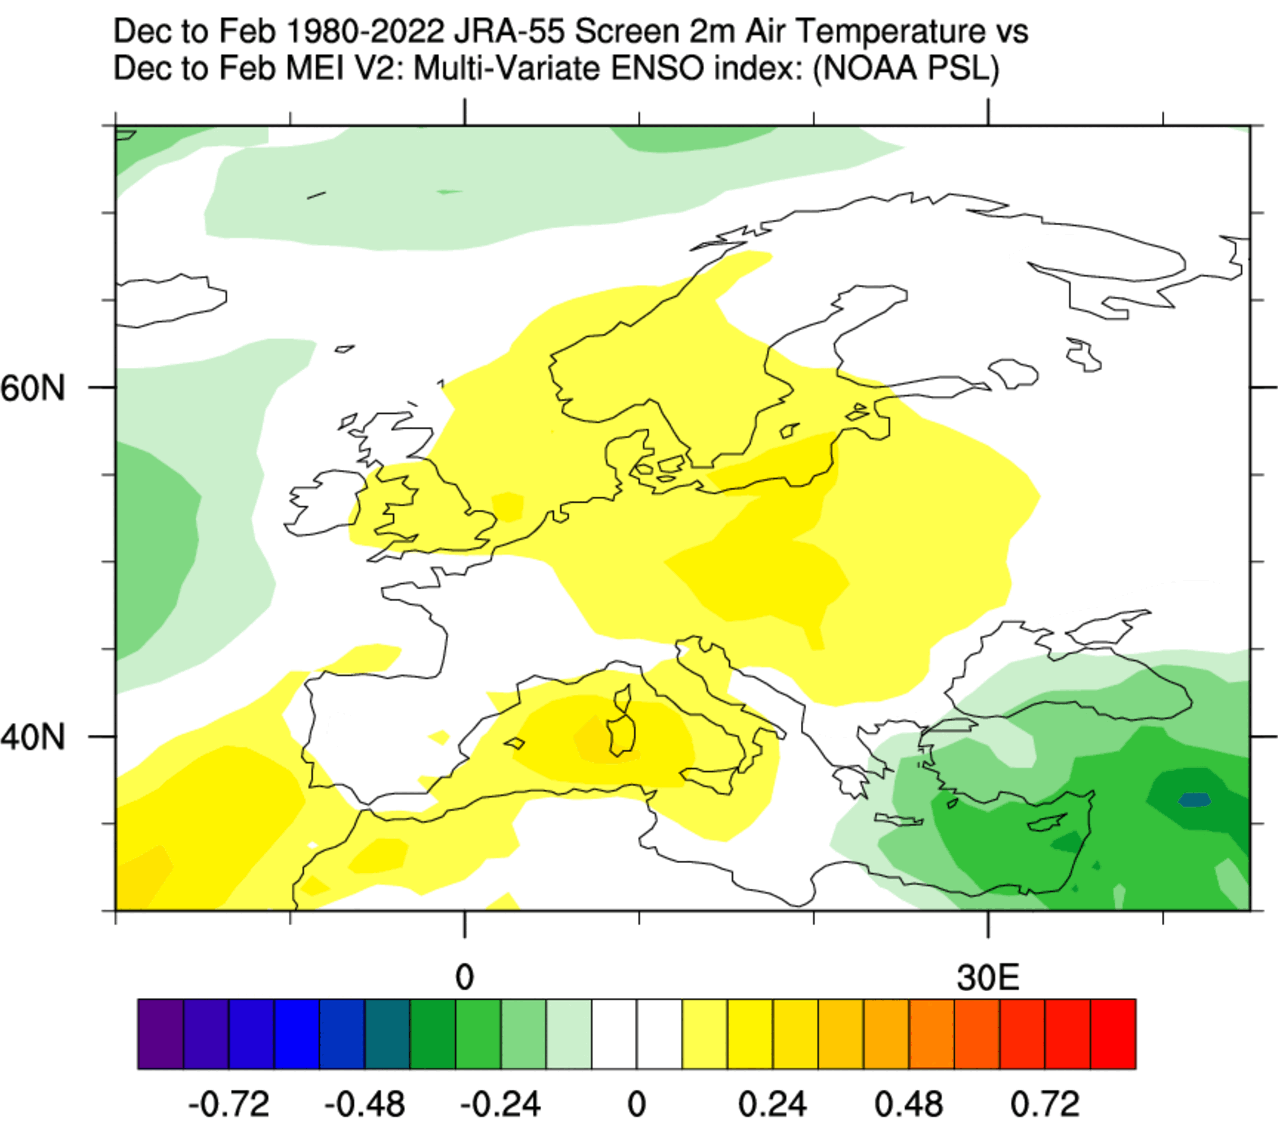
The following temperature is, of course, warmer than average over much of the continent. But the signal has a weak strength, as the ENSO influence loses most of any direct impact this far out. So while there is a signal in the average, it cannot be used for any direct weather pattern forecasts over Europe.
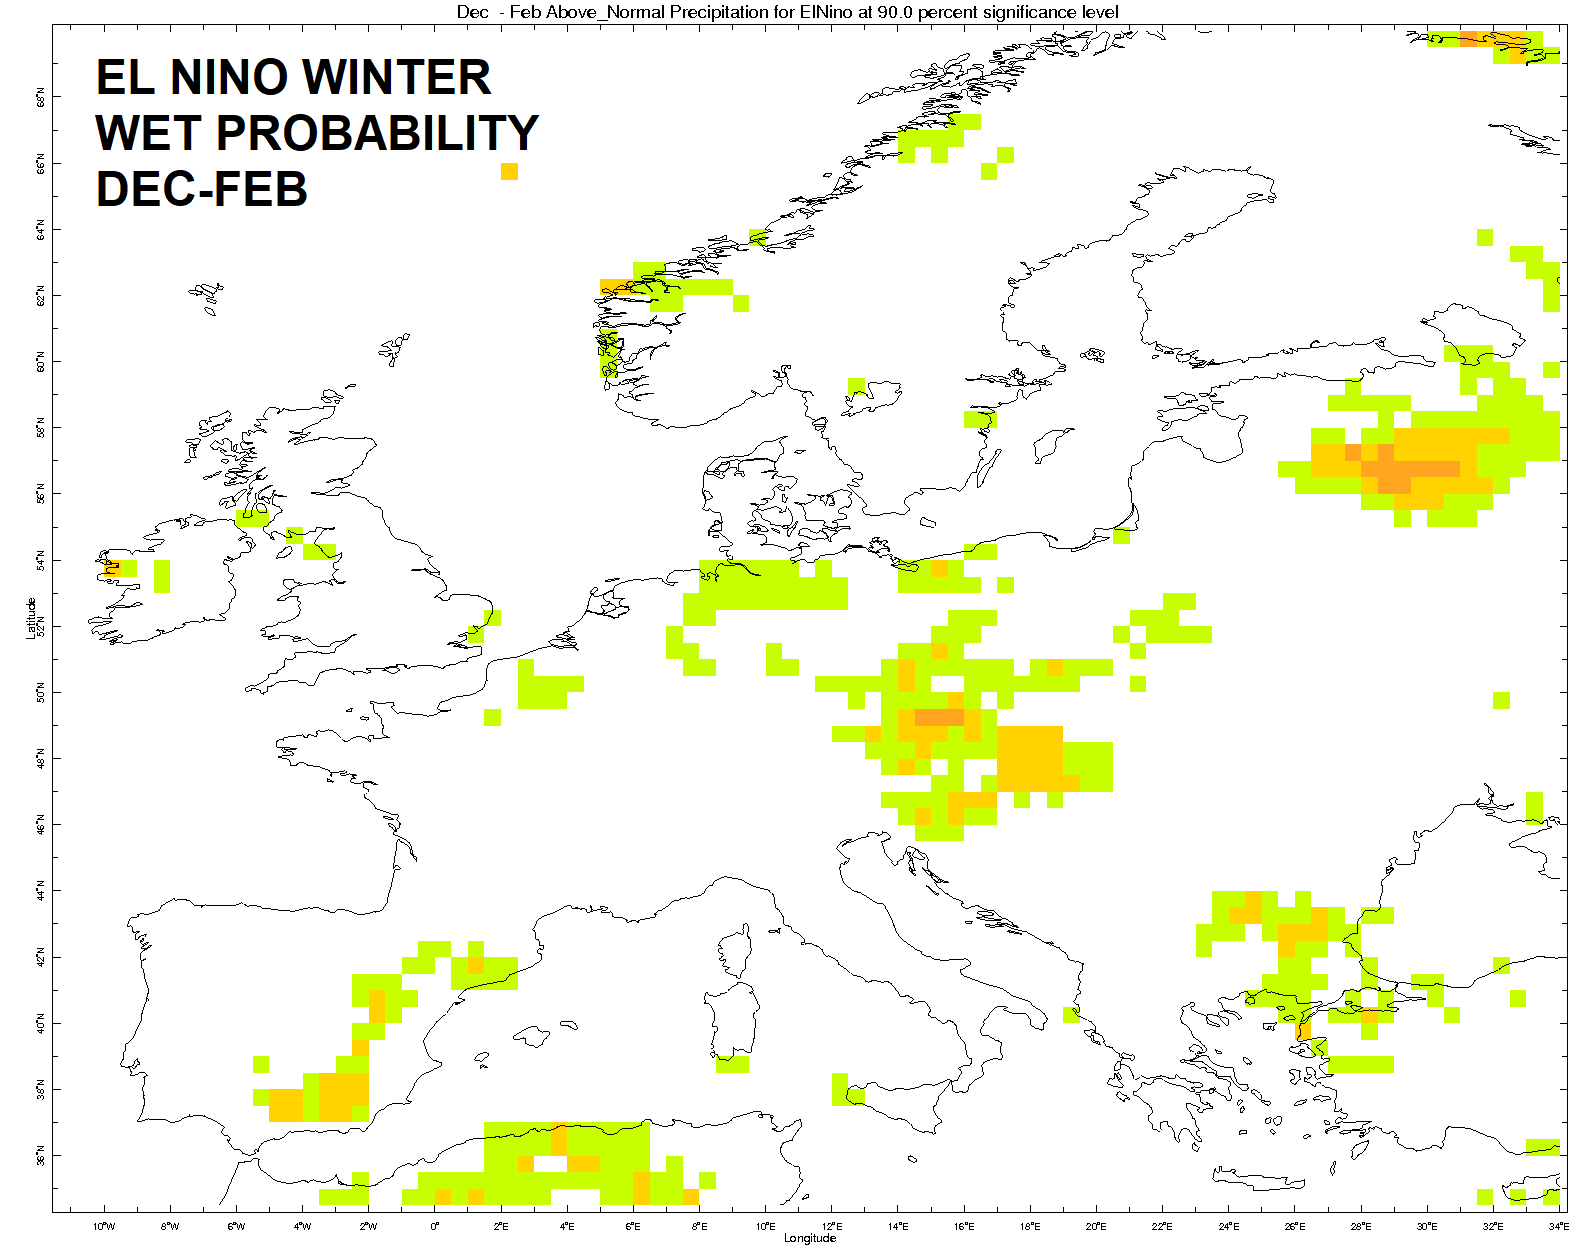
Looking at the precipitation, you can see the precipitation probability below. Based on past data, it shows areas of increased precipitation in Winter during an El Niño event. You can see more precipitation over central Europe and the southwest.
The next image shows the probability of less precipitation and drier winter conditions than usual. In an El Niño winter, there is less precipitation over southeastern Europe and Scandinavia.

As El Niño changes the weather globally, hardly a corner of the world does not feel its effect. But the weather changes in parts further away are less predictable. That is because local weather systems play a specific role, as well as other global weather drivers; the further away from El Niño you go.
We will keep you updated on global weather development and long-range outlooks, so make sure to bookmark our page. Also, if you have seen this article in the Google App (Discover) feed, click the like (♥) button to see more of our forecasts and our latest articles on weather and nature in general.
Don’t miss: