Meteorological Autumn starts in September, but we are already tracking the large-scale factors at work that will impact the coming weather seasons. Looking ahead, we can already see the return of the La Niña in the Pacific. It is forecast to influence the Autumn weather patterns over the Northern Hemisphere, especially North America, which will continue into the Winter of 2024/2025.
The meteorological Autumn covers three months, from September to November. This is the transition season from the warmest part of the year to the coldest part of the year.
As mentioned, an important player for Autumn weather this year will be the La Niña, which has a known history of Autumn impacts. So, before going into the forecast, we will quickly look at how La Niña works and what its history of impacts can show us for the future.

COLD LA NINA RETURNS
La Niña is a cold phase of the large and powerful oceanic ENSO oscillation. It is a region of the tropical Pacific Ocean that shifts between cold and warm phases. The cold ENSO phase is called La Niña, and the warm phase is called El Niño.
We determine the ENSO phase by the temperature anomalies (warmer or colder) in the ENSO 3.4 region, which you can see in the image below. The image also shows all the other ENSO regions. The main regions are 3 and 4, and together, they cover a large part of the equatorial Pacific.

Below, you can see the typical circulation during a negative ENSO event (La Niña). Air is descending in the eastern Pacific, creating stable and dry weather conditions, while rising air in the western Pacific causes frequent thunderstorms and plenty of rainfall. Image by NOAA Climate
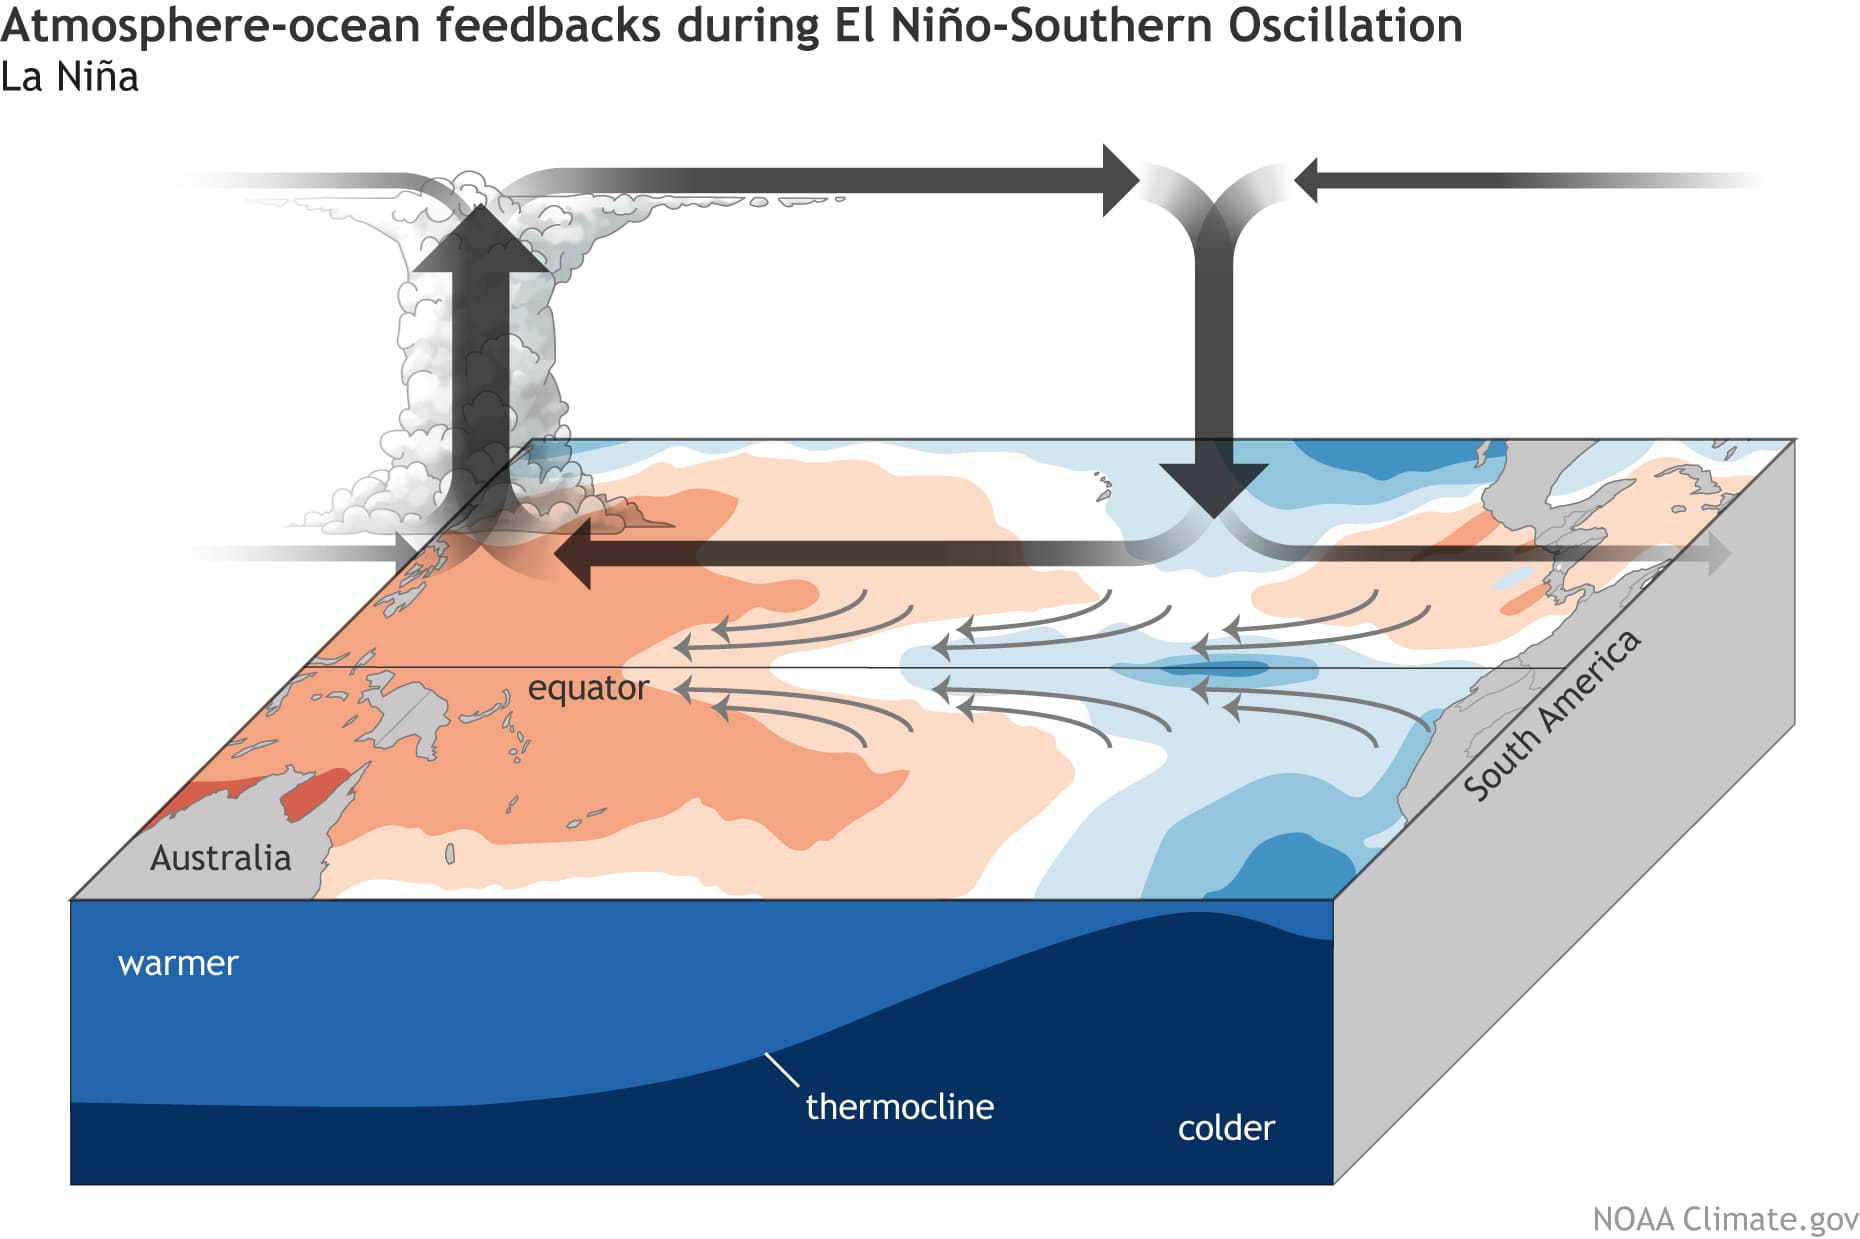
This way, ENSO has a major impact on the tropical rainfall and pressure patterns, impacting the very delicate ocean-atmosphere weather system. This ocean-atmosphere interaction system distributes the ENSO influence globally over our weather seasons.
The image below shows the latest ocean temperature anomaly analysis. It reveals colder-than-normal surface waters in the central and eastern ENSO regions. You can see the cold anomalies have a “wave-like” shape. This is because of the strong easterly trade winds that push the waters towards the west, creating swirls on the ocean surface.
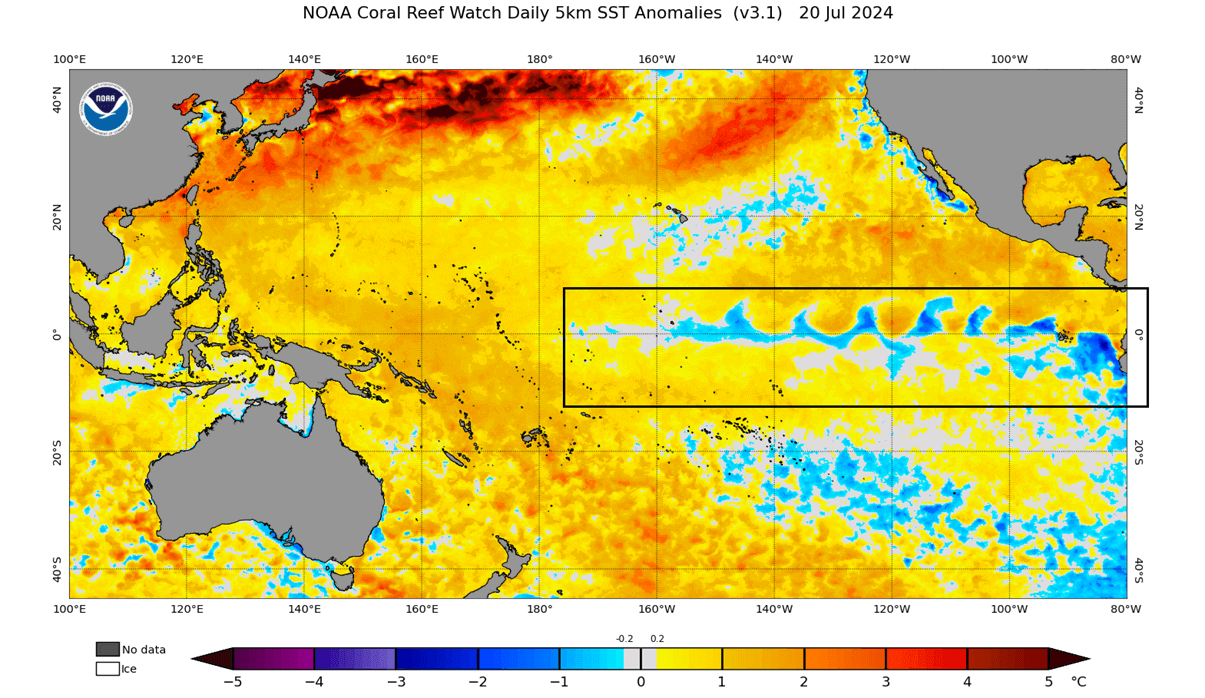
Some of the warm patches in the tropical Pacific are continuing from the strong El Niño, which has now dissipated. The El Niño was active over last Autumn and into Winter and weakened into Spring 2024.
We produced a high-resolution animation showing the ocean temperature anomaly development across the ENSO regions in the Pacific this Spring. You can see the shift from the warm ocean anomalies into more cold areas starting to appear. This was the rapid breakdown of the warm ENSO phase.
Below is an analysis/forecast image from NMME, which shows the breakdown of the warm phase and the forecast of the main ENSO 3.4 region. We can see the continued negative anomalies and cooling forecast over Autumn and Winter 2024/2025. The forecast average is staying well within the La Niña threshold (-0.5 or colder).
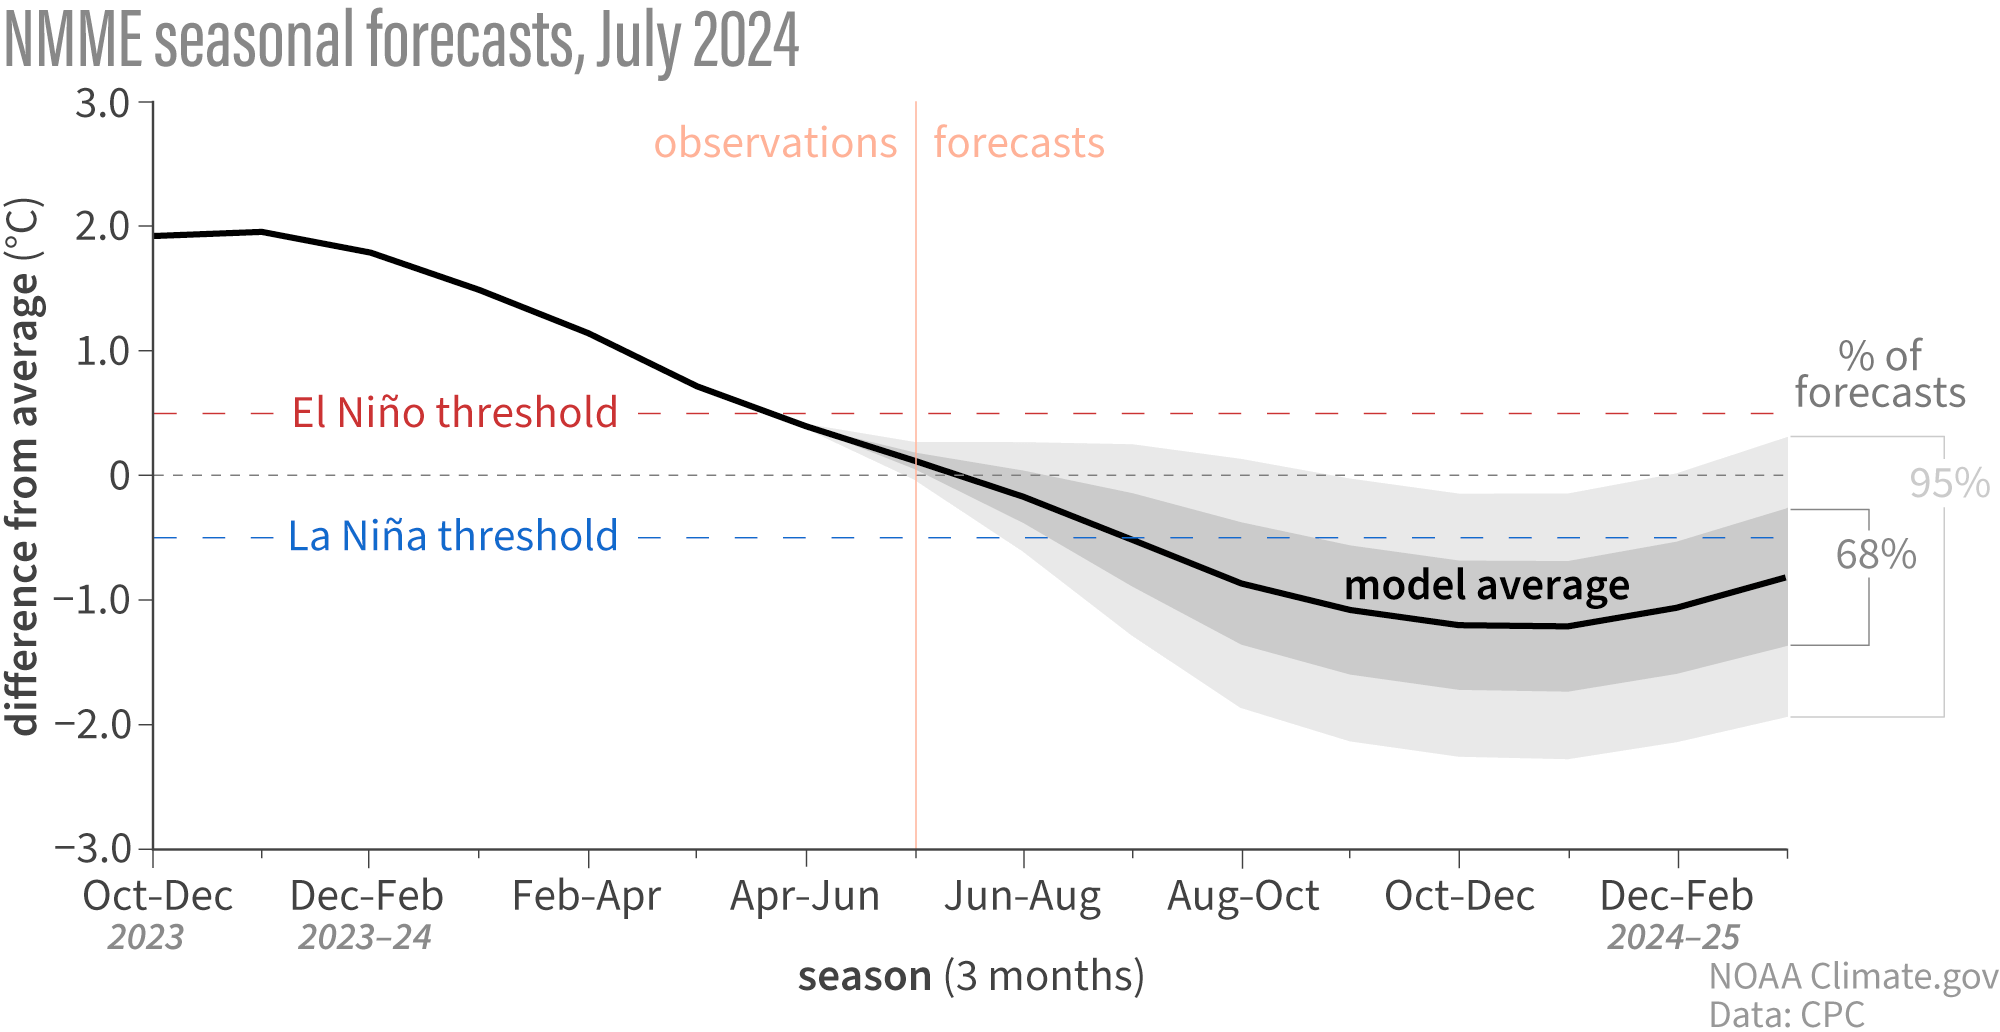
The actual ocean temperature forecast for Autumn from NMME shows that a La Niña anomaly is present. It is not as strong as some from past years, but it is strong enough to impact both the ocean and the atmosphere, as we will see in the forecast part of the article.

Knowing that we will have an active La Niña event again, what did its seasonal influence look like in the past?
WEATHER PATTERNS IN A LA NINA AUTUMN
Several autumn/Winter seasons have had an active La Niña phase. This gives us an opportunity to examine past data to see how the Autumn weather patterns usually develop under a La Niña.
We produced special graphics that show the correlation between the ENSO and global geopotential height in the September-December period. Simplified, it shows the prevailing signal during an active ENSO phase. In this case, the colors represent a La Niña signal.
First, we have the pressure pattern, covering the Autumn and early Winter period. The two features that stand out are the North American pattern and the North Atlantic pressure pattern.

In the North Atlantic, a high-pressure system extends from the ocean up north into Greenland. West of it, a lower pressure area covers Canada and the northeastern United States, and a high-pressure system extends from the North Pacific into the southern United States.
This later brings the jet stream further down into the northern United States as Winter starts, but more on this in our early Winter forecast article next month.
Next, we have the temperature patterns. The below-normal temperatures over Alaska and parts of Canada are not surprising due to being under a low-pressure area. The western United States is warmer, with cooler anomalies trending towards the northeastern and far northwestern parts of the Country.

There is a cool signal over most of Europe due to the prevailing northerly flow from the high pressure in the North Atlantic. But, the ENSO phases do not directly influence the weather patterns over this region as they do over the United States and Canada.
Precipitation patterns in a La Niña Autumn season are more “dipole” like. We can see a drier-than-normal pattern over most of the central and southern United States and wetter conditions over the northwestern and far northeastern United States and Canada.

Over Europe, we see a drier trend over the west and more precipitation in the central/east parts.
Knowing what La Niña is and how it can change our weather seasons, we will now examine the actual forecasts to see if we can find its influence on the coming Autumn 2024 weather season.
AUTUMN 2024 LONG-RANGE FORECAST
For the Autumn 2024 early forecast, we decided to focus on the two main (or most used) seasonal models: The ECMWF model from Europe and the NMME, which is a combined forecast from several different North American models. Forecast images are from the Copernicus Climate EU project and the CPC/NCEP.
All these forecasts are an average picture over the course of 3 months (September-October-November) and show the general prevailing weather pattern forecast for the meteorological Autumn. This only shows/implies how the weather patterns might look 40-60% of the time during the weather season.
The ECMWF model is regarded as one of the most reliable long-range forecast models. Based on more than a decade of our experience, it is very good and is the most used seasonal forecasting system for a reason.
But no long-range/seasonal forecast can ever be deemed “reliable”. We are only looking at trends and how weather patterns might evolve on a large scale, so we don’t use this long-range data to forecast weather in a specific city on a specific day and hour.
The pressure pattern forecast shows the typical La Niña high-pressure system in the North Pacific, with another high-pressure area extending from the western United States into southeastern Canada. This pattern is very similar to the historical analysis we did above. It also has a low-pressure zone hinted over Alaska and western Canada.
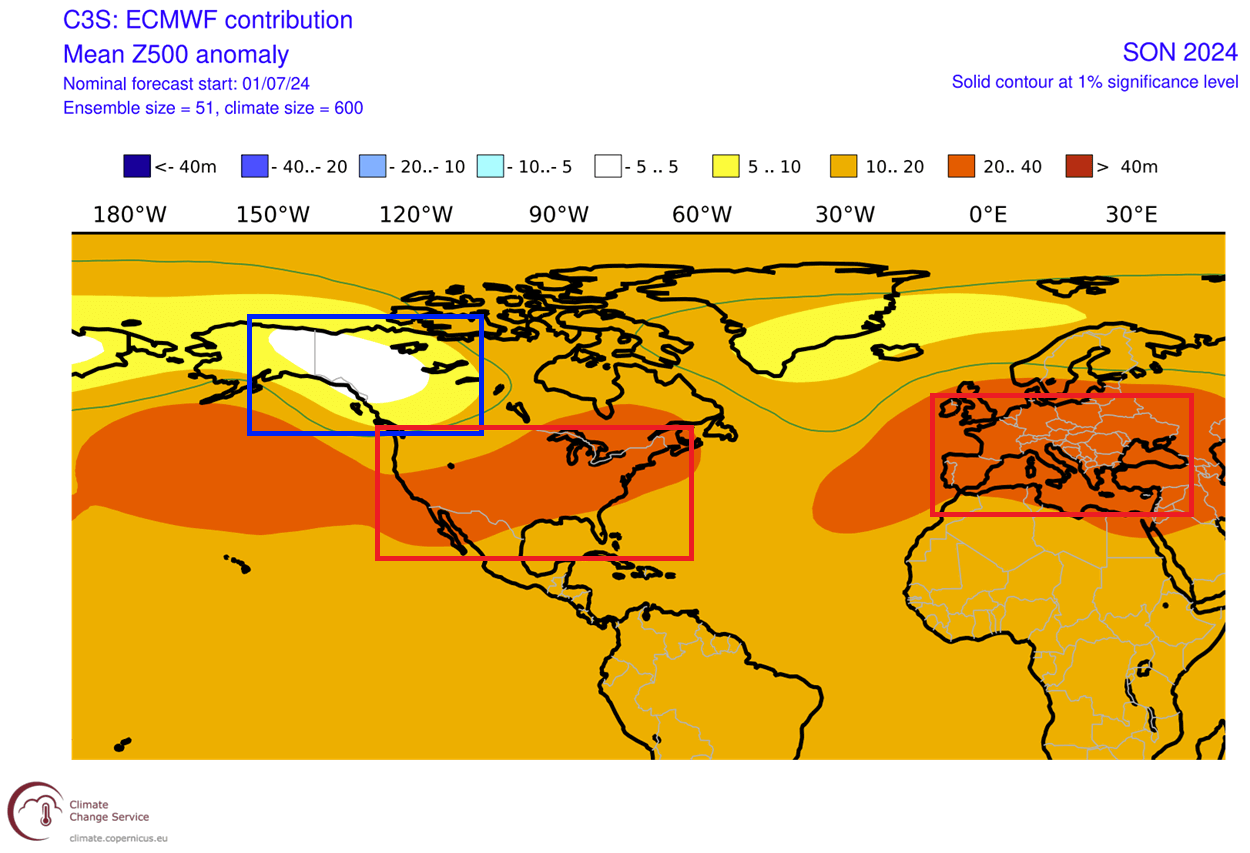
In the European sector, a high-pressure zone extends from the Atlantic into Europe. As a response, the low-pressure zone is moved further up to the north over south Greenland and Iceland.
The surface pressure anomaly also shows an interesting pattern over the tropical Pacific. A broad high-pressure area is forecast to cover the region. This indicates a La Niña-type pattern. This way, we can look for the La Niña influence on the tropical surface level circulation and its presence in the atmosphere.

ECMWF TEMPERATURE AND PRECIPITATION FORECAST
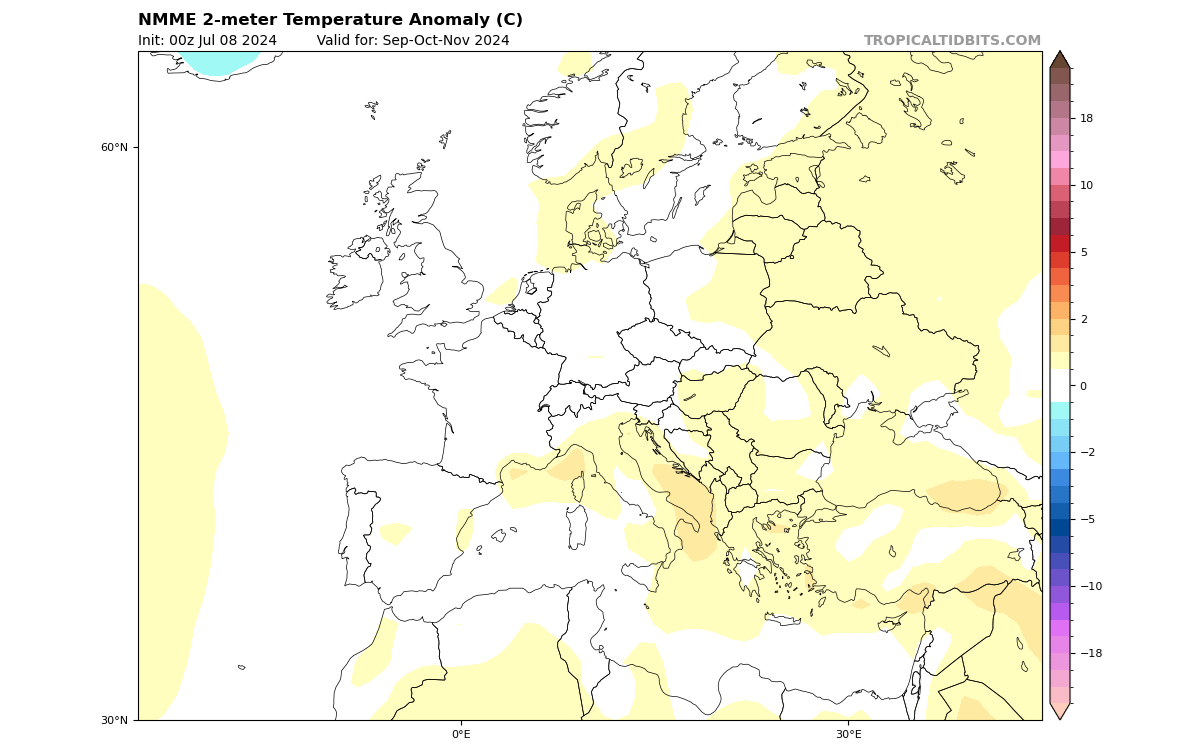
First, looking at Europe, we can see warmer-than-normal surface temperatures over much of the continent. This is due to a high-pressure area over the North Atlantic extending into Europe that the ECMWF pressure forecast shows.
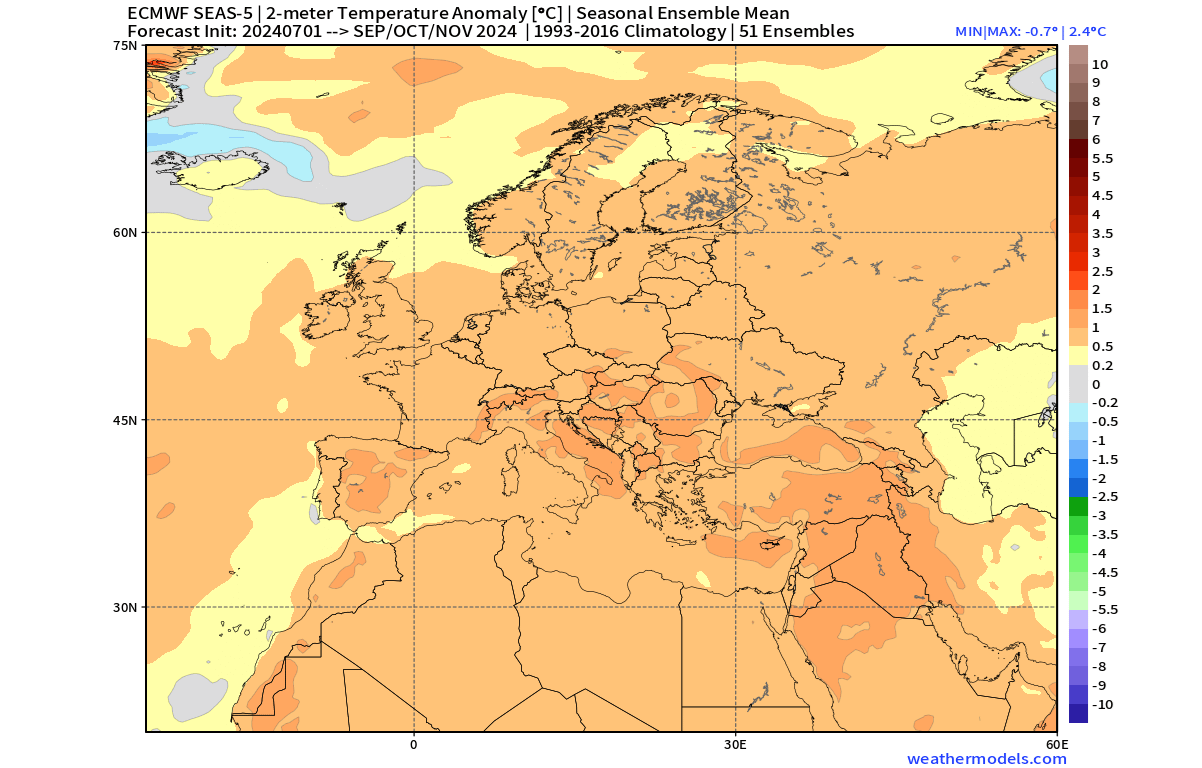
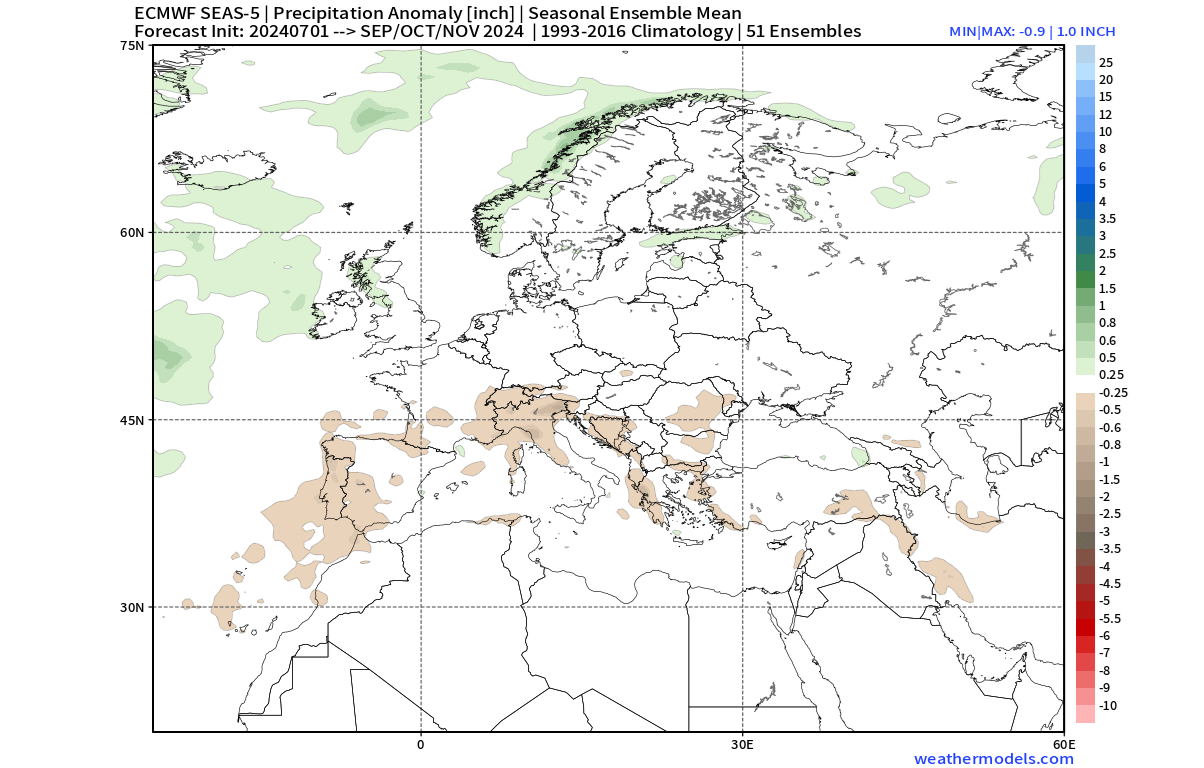
The precipitation forecast shows a drier Autumn over much of southern, western, and parts of central Europe. At the same time, a low-pressure zone is forecast to bring more precipitation to northern parts and over the UK and Ireland.
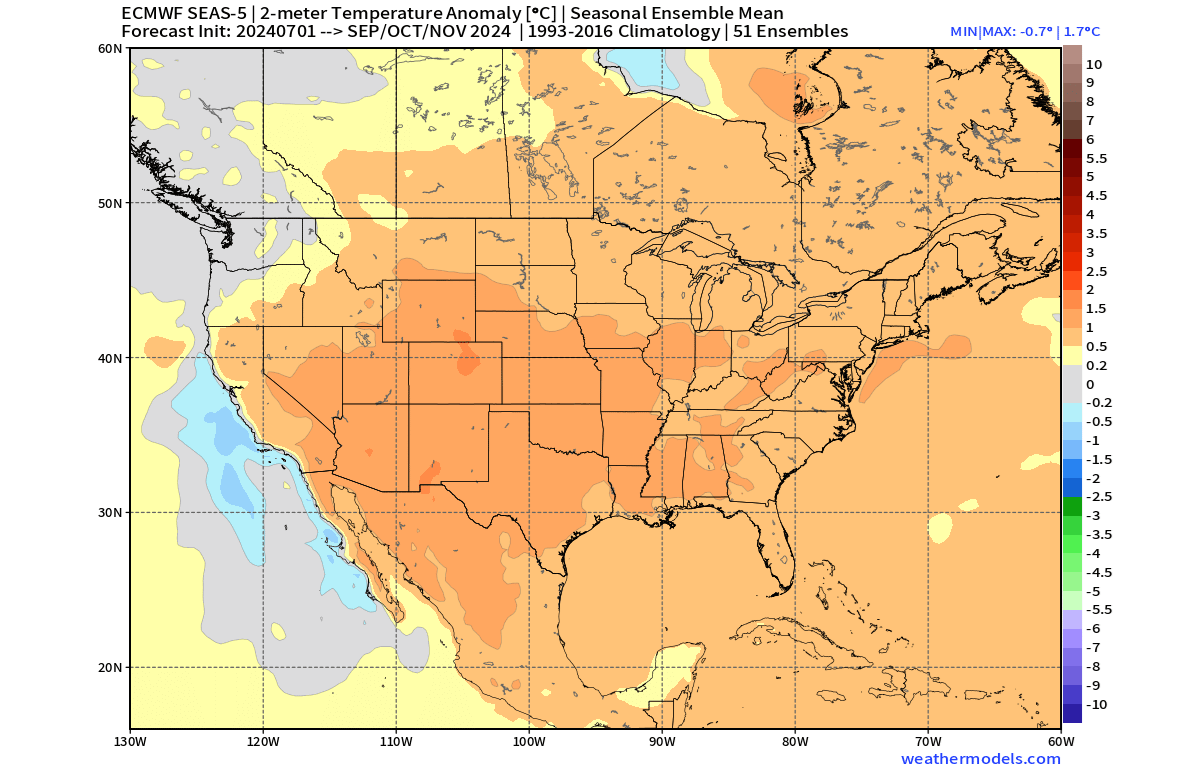
Over the United States, we see the core of the warmer temperatures in the west, under a high-pressure system. Warm anomalies also extend into the eastern United States and eastern Canada. But the United States and western Canada remain in a neutral area, under the influence of the returning polar jet stream.
Looking at precipitation, we have wetter conditions over the northwestern United States, upper Midwest, east coast, the northeastern United States, and eastern Canada. Less precipitation than normal is forecast over the southern half of the United States under the influence of a broad high-pressure system.
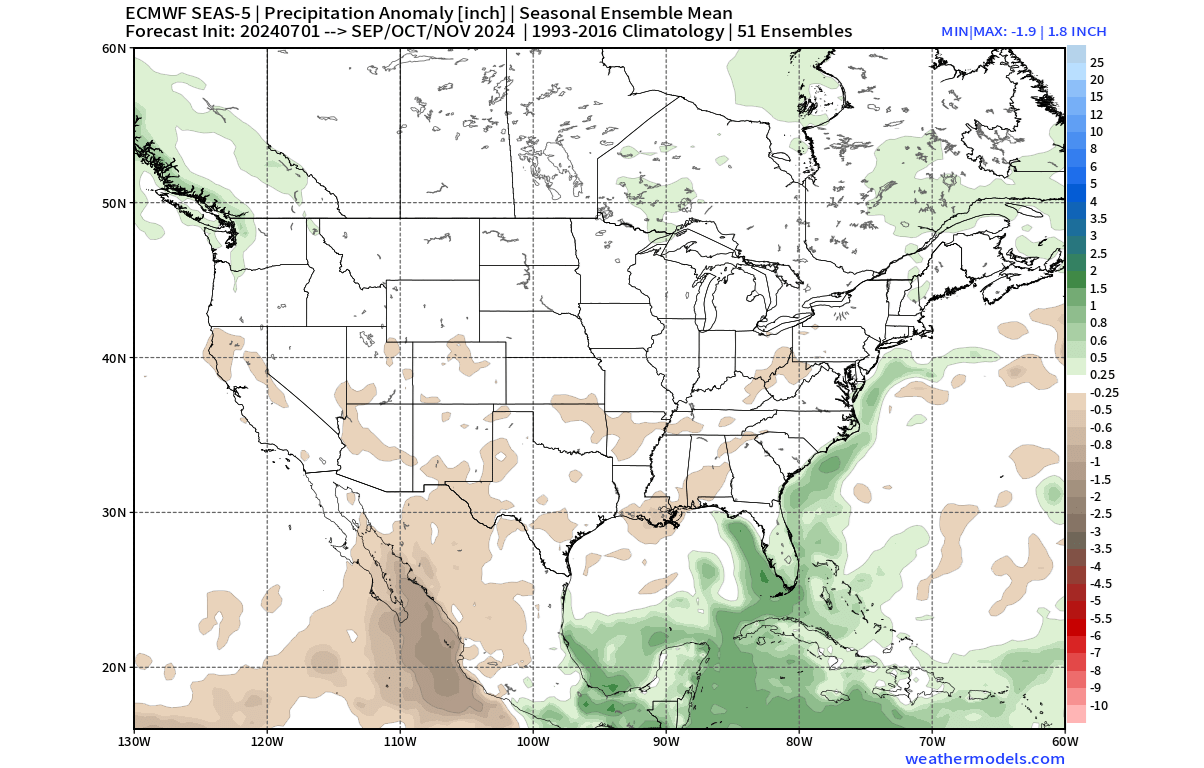
It is interesting to see more precipitation in the Gulf of Mexico and in the western Caribbean. This is part of the tropical systems development region. We can interpret this as a potential signal for more tropical activity in the later part of the Hurricane season.
NMME AUTUMN 2024 SEASONAL FORECAST
In contrast to the European models, we tend to use the NMME model system. It stands for North American Multi-Model Ensemble (NMME). It combines several individual models to show an average picture from different solutions.
This forecasting system covers more scenarios, but the drawback is that the forecast image can get heavily diluted at longer ranges. That is due to the strong differences in the forecast, which is produced from very different models in the mix.
First, looking at Europe, the surface temperatures forecast shows warmer than normal areas over the southern and eastern parts of the continent. The central and western parts show normal Autumn temperatures throughout the season.
Looking at precipitation, we see mostly wetter Autumn conditions across the northern and central parts of the continent. This shows a likely positive NAO pattern, with a low-pressure system in the North Atlantic or further over Northern Europe. This is similar to the ECMWF but with more precipitation in central parts.

Going now to North America, the temperature forecast below shows a warmer Autumn over the western and southwestern parts of the United States. Parts of the Midwest, the eastern United States, and the Northeast all show normal temperatures, in line with the expected La Niña influence.

The precipitation forecast for North America shows a very “diluted” forecast due to many models in the mix. But the trends are visible, with less precipitation over the southern United States and parts of the Midwest, with more precipitation likely over the northwest and the east coast.

This again shows some support for the ECMWF forecast, which does trend toward a visible La Niña influence in the overall Autumn 2024 weather circulation.
FALL 2024 OFFICIAL OUTLOOK
Below is the official Autumn 2024 temperature outlook from NOAA/CPC for the United States. The forecast shows a warmer-than-normal Autumn season over the western United States, with the belt of warm anomalies extending over the south and up into the northeast.
We can also see a neutral temperature zone in the upper Midwest. That does indicate a chance of more cold fronts coming down from the northwestern United States and western Canada towards the central regions as the low-pressure area over Canada gets stronger towards Winter.
It could also mean earlier snowfall than normal in the northern United States close to Winter.
Precipitation-wise, the NOAA Autumn 2024 outlook shows drier conditions in the western and central United States. Wetter conditions are expected mostly on the east coast of the United States and over the northwest.
This is a similar precipitation pattern to past La Niña Autumns. But there is one more large-scale factor that has a very important weather role and emerges every Autumn, also impacting the entire Winter season.
THE RETURN OF THE POLAR VORTEX
The Polar Vortex re-emerges every Autumn and plays a key role in weather development in late Autumn, over the Winter, and into Spring. So, for this reason, we have to take a quick look at its importance and early forecast.
The Polar Vortex is a large cyclonic area that is spinning over the entire Northern Hemisphere, from the ground up to the top of the stratosphere, reaching over 50km/31miles in altitude.
Below is an image that shows a 3-dimensional model of the Polar Vortex, extending from the lower levels up into the stratosphere. The vertical axis is greatly enhanced for better visual purposes. This image shows the actual structure of the Polar Vortex, otherwise invisible.

In the example above, the Polar Vortex was undergoing a temporary warming event. These events can disrupt the Polar Vortex, weakening its circulation and changing the weather patterns below.
A strong Polar Vortex usually means strong polar circulation. This usually locks the colder air into the polar regions, resulting in milder seasonal conditions for most of the United States and Europe.
In contrast, a weak Polar Vortex can disrupt the jet stream pattern, making it harder to contain cold air that can now escape from the polar regions into the United States or Europe.

We usually look at the wind speed within the stratospheric Polar Vortex to determine its strength. The stronger the Polar Vortex, the stronger the winds that it produces in the stratosphere, and the stronger its impact.
It is the same for the opposite scenario, with a weaker Polar Vortex having weaker stratospheric winds. So, by looking at the wind speed forecast in the stratosphere, we can assess the state of the Polar Vortex and find early hints of its impacts.
Below is the stratospheric westerly wind speed forecast for the upcoming seasons. You can see an interesting trend developing. This ECMWF forecast for the 10mb stratospheric zonal winds shows a below-average Polar Vortex strength in late Autumn and early Winter.
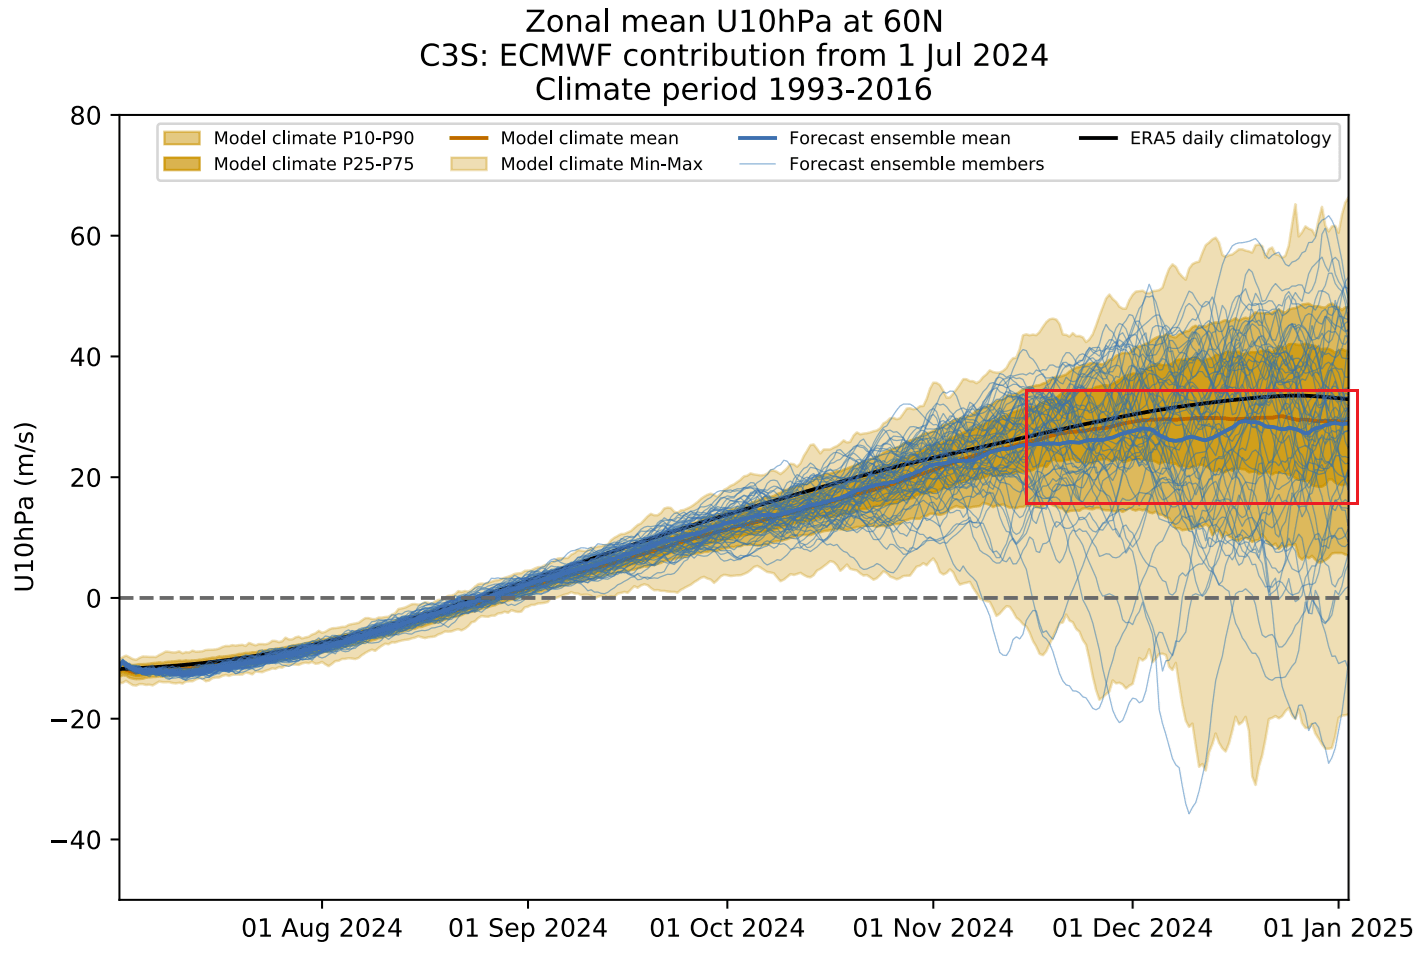
Another respectable forecasting model for the Polar Vortex is JMA. As you can see in its forecast below, it also shows a weakening trend for late autumn and early winter with the below-average wind speed of the Polar Vortex. So this is one thing to look out for in the coming weeks and months as the updated forecasts are released.
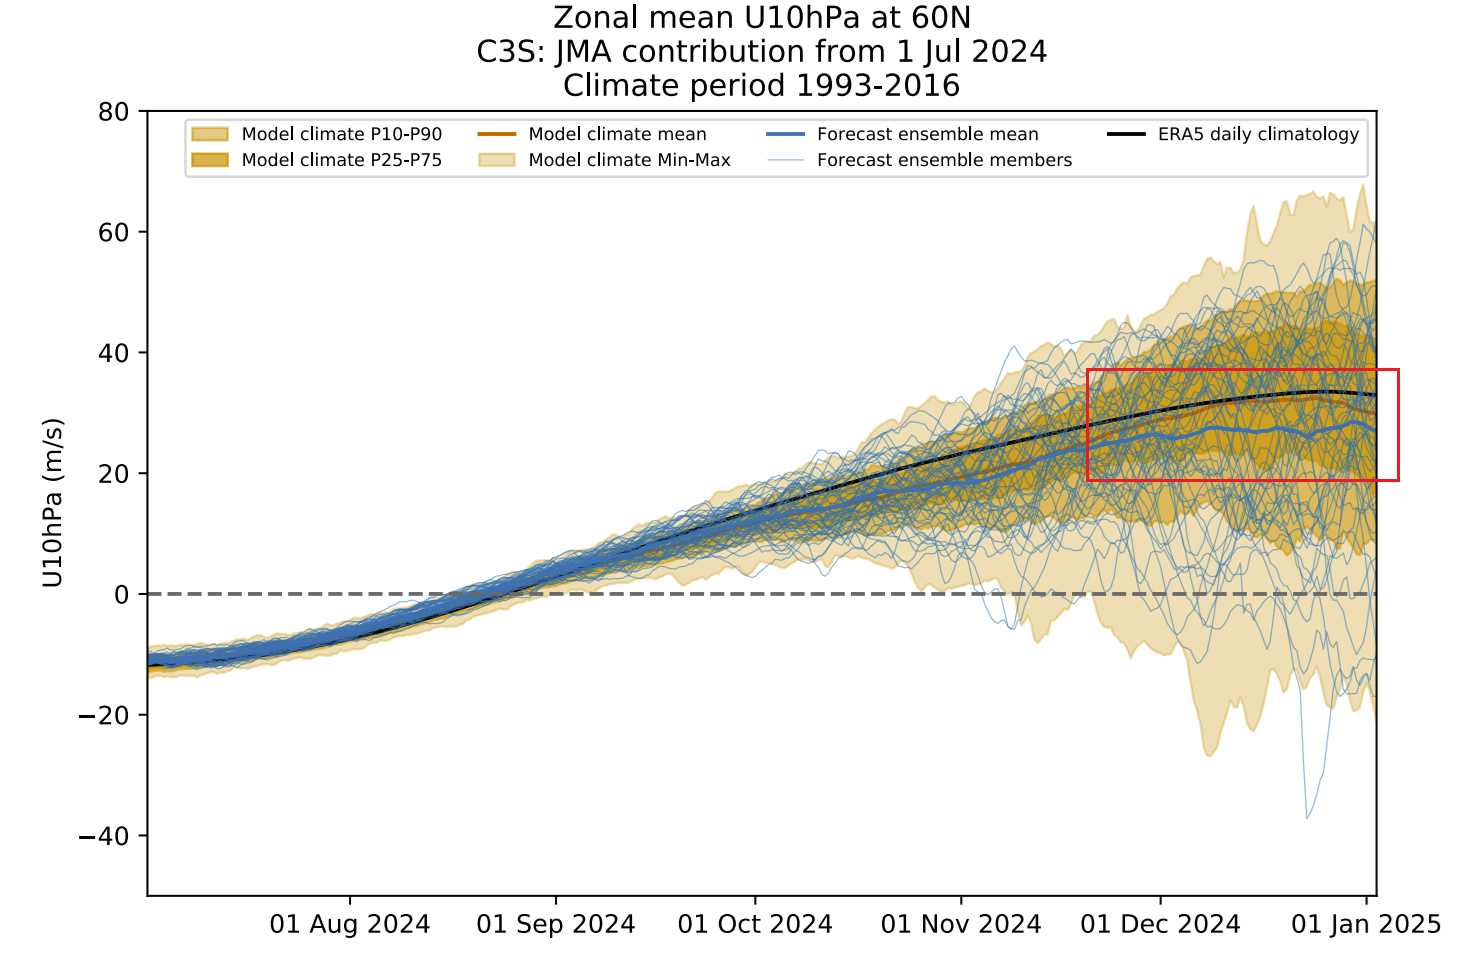
As winds are directly related to the strength of the Polar Vortex, we can see this as a signal for a weaker-than-normal Polar Vortex. This would imply a potentially more disrupted weather pattern and a chance of high-latitude blocking, creating more potential for a cold air intrusion or below-normal temperatures in parts of the United States and Europe.
It gives us a signal to watch, as these dynamics can have a large-scale and long-lasting impact on the weather patterns during late Autumn, Winter, and even into Spring.
We will keep you updated on the global weather pattern development for the coming seasons, so make sure to bookmark our page. Also, if you have seen this article in the Google App (Discover) feed, click the like button (♥) there to see more of our forecasts and our latest articles on weather and nature in general.
SEE ALSO:
Early data shows a Weaker Polar Vortex could develop for Winter 2024/2025