North America is still feeling the weather impacts of a strong Stratospheric Warming event. These effects are forecast to slowly phase out in May, while still affecting the weather over North America. But new weather patterns are forecast to develop over the U.S. and Canada in early Summer.
We tracked large-scale pressure changes over North America as the result of the collapse of the Polar Vortex, caused by the rapid rise in temperature and pressure in the stratosphere in early March.
The latest forecast shows a final connection between the high-pressure anomalies from the stratosphere and the weather patterns in lower levels. As the stratospheric warming effect slowly moves out of the Atmosphere, we can already see a surprisingly dynamic pattern emerging in the forecast for early Summer over North America between the east and the west.

THE POLAR VORTEX COLLAPSE AND EFFECT
The Polar Vortex is a name that explains the atmospheric circulation above the Northern (Southern) Hemisphere. It extends high into the middle and upper layers of the atmosphere. The lowest layer is called the troposphere, where all weather events occur. But above that, we have the stratosphere, a deeper and drier layer.
For this reason, we separate the Polar Vortex into an upper (stratospheric) and a lower (tropospheric) part. They both play their roles differently, so we monitor them separately. But, both parts together form the circulation across the Northern Hemisphere during the colder part of the year (October-March).

The best way to understand the Polar Vortex is to visualize its structure. In simple terms, “Polar Vortex” is a name that describes the broad winter and cold weather season circulation over the northern (and southern) hemispheres, extending into Spring.
Below is a 3D image example of the Polar Vortex in late February. The vertical scale in the image is enhanced for better visual presentation. But it shows the actual structure of the Polar Vortex, and how it began to get deformed under rising pressure in the Stratosphere, losing its usual circular shape.

To simplify, all you need to know is that the upper and lower parts of the Polar Vortex are connected. Changes in the upper part can significantly impact the weather anomalies in the lower parts of the atmosphere and the weather at the surface.
In mid-March, a strong Sudden Stratospheric Warming event (SSW) began. As the name suggests, an SSW event marks a rapid rise in pressure and temperature in the stratosphere. When strong enough, this event can collapse the Polar Vortex circulation, impacting the weather patterns below for the weeks ahead.
Below is the mid-stratosphere (31km/18.5miles) analysis for mid-March. It shows the stratospheric high-pressure system (H) taking over the polar regions and splitting the Polar Vortex into two separate cores (L). This is the stratospheric warming even at its peak power, with the warming wave completely taking over the mid-stratosphere.

Such a strong, warm anomaly can only be caused by stratospheric warming events. And this event was unusually strong for this time of year compared to previous early Spring SSW events.
Below is a 3D vertical structure analysis, where you can see the SSW impact in full effect. The image shows a deformed and broken shape of the Polar Vortex. You can also see a “void” in its central area, which is the presence of a high-pressure anomaly and the warming wave that broke down the Polar Vortex.

For an even better visualization of what a Polar Vortex collapse looks like, we produced the video below. It shows the full 16-day sequence of the stratospheric Polar Vortex breaking down under the strength of the Stratospheric Warming event.
But how can such a strong event far above in the stratosphere impact the weather below?
CRASHING DOWN FROM THE STRATOSPHERE
Below is a typical stratospheric warming event analysis from a study by Dr. Amy Butler and co-authors. As an SSW occurs, it raises temperature and pressure in the Stratosphere. But, those effects progress downwards over time and reach the lower levels. The image shows the typical downward progress of a stratospheric warming event, bringing high pressure down to the lower levels.

Keeping it simple, the main impact after an SSW event is a high-pressure system at the surface over the north. A manifestation of a high-pressure system in the lower levels can mean a disruption of weather patterns and strong changes in the jet stream.
The best way to follow SSW effects development is to look at atmospheric changes over time. Below, you can see the pressure anomaly in the atmosphere since April 1st. You can see the large high-pressure anomaly in early April, which is the main anomaly of the 2025 Stratospheric Warming event.

The stratospheric pressure anomaly has since slowly moved downwards, impacting the weather patterns as it connects with the lower layers.
We also have to look at a longer time period to see the whole picture of this event. Below is an image that shows the pressure anomalies across the atmosphere over time, similar to the example above, but at a longer period and also with a forecast.
Negative values indicate lower pressure (blue anomalies), and positive values indicate higher pressure (red colors). We have altitude from the ground up to the top of the Stratosphere (~46km/28mi). You can see a strong high-pressure anomaly in the stratosphere from early March all the way into mid-April.
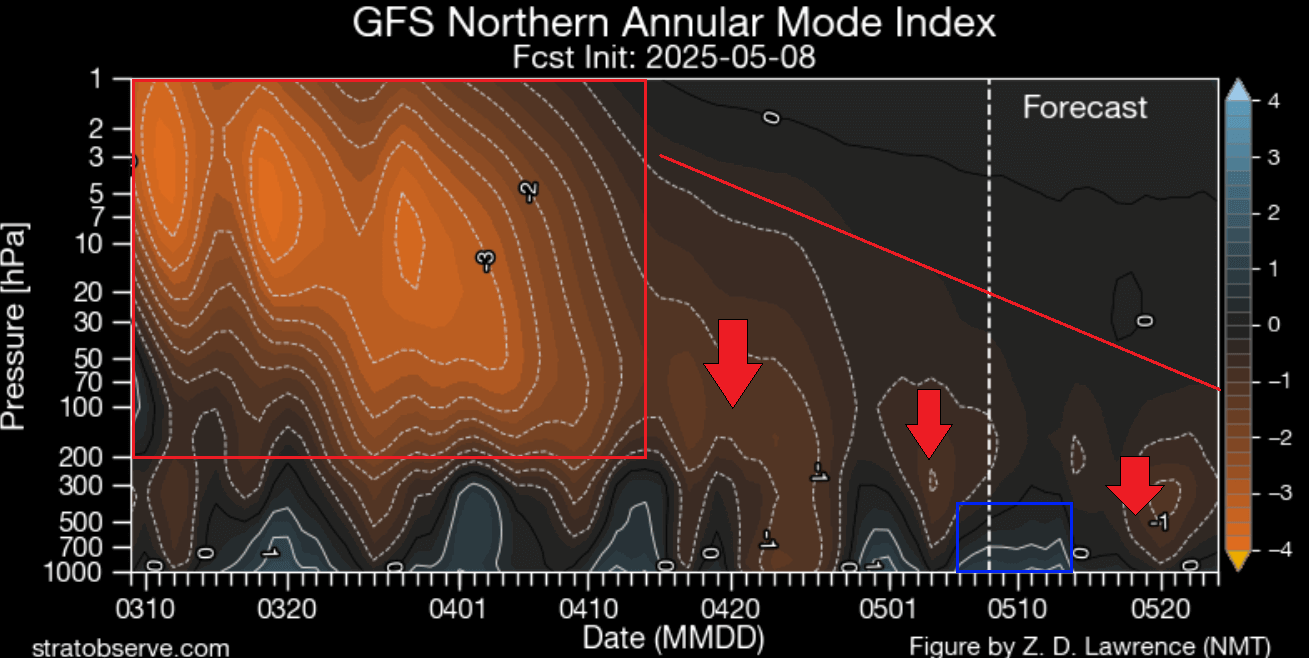
That large mass of high pressure is the stratospheric warming anomaly, and you can see how its impact slowly moved downwards to the weather layer (below 100-200hPa). It impacts the lower levels in waves, playing a role in the weather patterns.
The forecast part of the graphic shows a new downward connection of the high-pressure anomaly into the second half of May, connecting down into the weather layer. After that, the visible impacts of the stratospheric event will slowly phase out.
This shows the textbook downward progress of a high-pressure anomaly after a stratospheric warming event. The image below shows the typical temperature anomaly 0-60 days after a stratospheric warming. This is an average image of several different events, but it gives an idea of what we can usually expect.

You can see a very clear signal of below-normal (cooler) temperatures in the 60 days following a Stratospheric warming event. This is just the average image of several events, but it shows a clear tendency for more frequent disturbances and cooler events over the United States and Canada.
At this point, we can now look at the actual weather maps and forecasts, how the May weather patterns are expected to unfold, and also the latest trends for early Summer over the U.S. and Canada.
MAY 2025 WEATHER PATTERNS
Below is the latest pressure anomaly forecast for the next few days. You can see a low-pressure area over the polar regions, with a ring of high pressure around it. This pattern enables a high-pressure ridge to build over the Northern United States and southern Canada.

The low-pressure systems are more dispersed, and we can see 3 main low-pressure areas over North America. One is over the Pacific Northwest, one is over the southern United States, and there is also an extension over northeastern Canada.
Looking at the temperature anomaly for the next 5 days, you can see a colder-than-normal airmass over the southern and eastern United States. A much warmer than normal airmass is forecast to expand underneath the high-pressure anomaly over the northern United States and south-central Canada.

Below is the surface temperature anomaly for Monday, and you can see a large airmass of unseasonable warmth over the northern and north-central Plains, extending into the upper Midwest and over south-central Canada.

At the same time, a low-pressure area over the southern United States will bring normal to below-normal temperatures to the southern United States and the East Coast. A cool anomaly is also forecast in the northerly flow over the Northwestern United States, reaching into northern California.
Below is the temperature forecast image. It shows surface temperatures on Monday at midday. You can see the large warm “bulge” over the northern United States and southern Canada, with temperatures reaching from mid-80s to low 90s even. This is far above the normal temperatures in that region for this time of year.
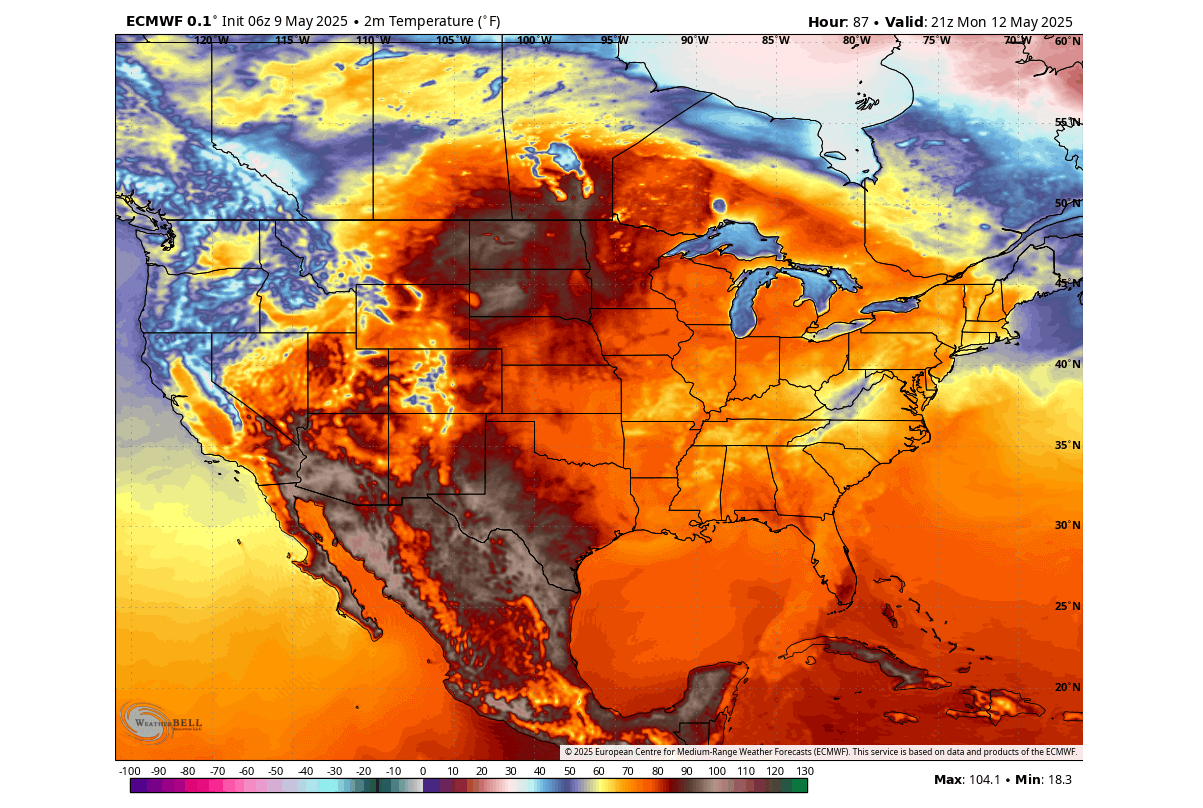
You can also see temperatures in mid to high-60s over the eastern United States, with high 30s to low 40s over the northwestern United States and parts of northern California.
The high-pressure anomaly will also bring stable weather, with drier conditions over much of the central and northern United States in the next 5 days. A large area of precipitation is forecast over the southeastern and eastern United States, influenced by the low-pressure system moving over.

But as the pressure anomaly from the stratosphere connects deeper down in mid-May with a new wave, another round of pressure changes is expected across North America.
MID-MAY PRESSURE WAVE
First, we will look at the pressure anomalies across the atmosphere. The image below is the day 10 forecast, which shows the pressure anomalies from the surface up to the top of the Stratosphere in the sub-polar belt. You can see a high-pressure anomaly connected to the lower levels in the North Atlantic and Greenland. Next to this anomaly, you can see a low-pressure area over North America.

Below is the latest pressure anomaly forecast for mid-May in the 10-15 day range. You can see a strong high-pressure anomaly over the North Atlantic, building into the polar regions. A ridge will also build into the polar circle over the west, initiating a colder airmass to transport down into Canada and towards the northern United States.

Below is the 5-day surface temperature anomaly forecast for next week. You can see the central and eastern United States and eastern Canada are forecast to have above-normal temperatures under the high-pressure anomaly.

But an area of below-normal temperatures is starting to expand from western Canada downwards into the northern and western United States.
You can see this much better in the single-day temperature forecast for the end of next week. The forecast shows above-normal temperatures over the south-central and eastern United States. But you can see an unseasonably cool airmass expanding across Canada, into the northern and western United States, and into the upper Midwest.

The true nature of this airmass is seen in the next forecast below, which shows morning temperatures on day 10. This is a single-run forecast, so it is not a fixed prediction, but it serves as a nice example of what the potential is of this weather pattern.
As you can see, the morning temperatures are in the mid-60s to mid-70s across the eastern and southern United States. But you can see morning temperatures in the low 40s to mid-30s over the western United States and the upper Midwest. You can also nicely see where the cold front is, leading the colder air to advance.

The main rainfall area in this period is forecast over the northern and north-central United States and south-central Canada. This is mainly associated with the arrival of the cold front from the north.

Less rainfall is forecasted over the southern plains, the south coast, and the deep southeastern United States.
Once a cold front is unleashed from the north, if the high-pressure system is positioned properly over the east, it can lift up into Canada, allowing the further expansion of cooler air and lower pressure into the eastern United States.
A COOLER SPRING END
Below is the latest pressure anomaly forecast for the third week of May. You can see a strong high-pressure anomaly over eastern Canada, which is forecasted to further evolve from the previous week. There are also other marked high-pressure regions that are building around the polar circle.

Below is the 5-day surface temperature anomaly forecast for the same period. This is an ensemble forecast to show the prevailing trend in the forecast. You can see an expansion of the cooler airmass all across western and southern Canada, into the northern and eastern United States.

This is starting to look similar to the image above that showed the temperature pattern 0-60 days after a stratospheric warming event. What we see in the forecast are likely the final effects of the strong stratospheric events.
We can also look at the single-run forecast to find potential scenarios. You can see below that the ECMWF forecast shows an unseasonably cold airmass spreading across the eastern United States. As said, this is not a fixed prediction, but it serves as a high-resolution forecast of a possible scenario in such a weather pattern.

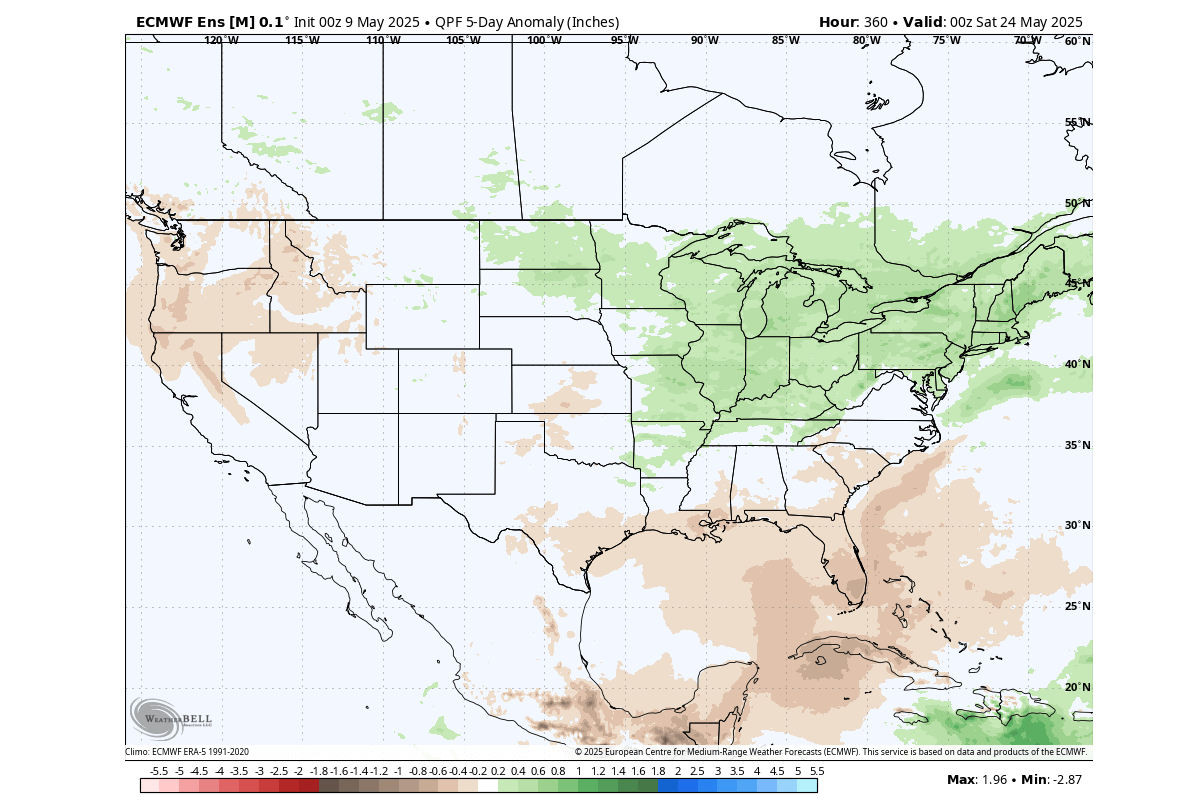
The main precipitation area usually follows weather disturbances. And in this period, the forecast shows more rainfall over the northern and eastern United States, associated with the low-pressure area and the expanding cooler airmass.
May is also the last month of the meteorological Spring. The warmest 3 months of the Northern Hemisphere are June, July, and August. And for that reason, this period is also the meteorological Summer. We will use extended range forecasts to look at the trends for early summer.
SUMMER 2025 APPROACHING
Below is the extended range pressure anomaly forecast for the end of May, from the ECMWF model. It shows a continued trend for below-normal temperatures over the eastern United States. That also indicates a more unsettled pattern with more precipitation over the east. The main area of above-normal temperatures is forecast over the southern United States and up across the Plains.
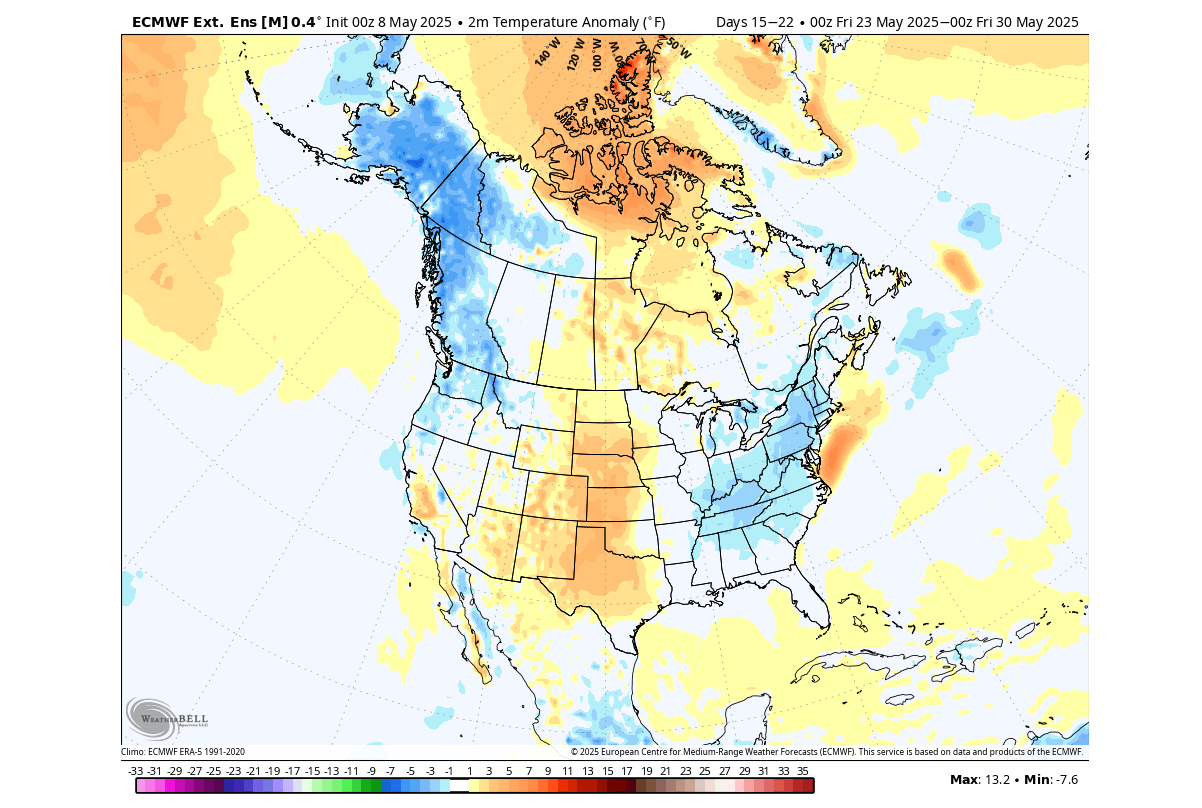
Another continued area of below-normal temperatures is forecast for western Canada and the northwestern United States.
This brings us to the start of the meteorological Summer season. Below is the pressure anomaly forecast trend for early June. You can see the high-pressure area focused over the western United States. At the same time, we see a low-pressure trend starting for the eastern United States.

Such a pattern usually brings a stable and hotter summer to the western and central United States and southwestern Canada. But a low-pressure axis tends to bring more unsettled periods for the eastern United States and southeastern Canada.
Below is the temperature forecast trend for mid-June. It nicely shows the resulting weather from having a ridge in the west and a low in the east. The bulk of the heat is positioned over the western and central United States, with milder temperatures over the eastern U.S. and a higher chance of rainfall.
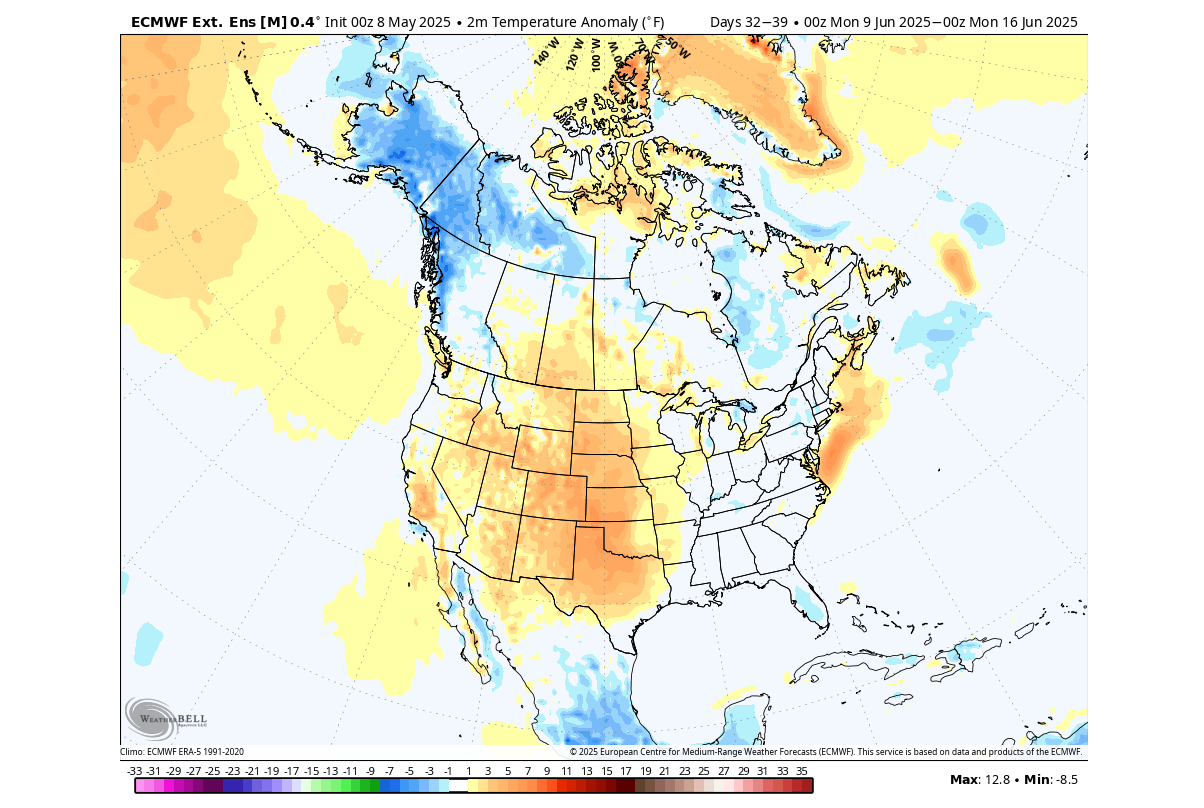
We can also take a look at the official long-range model of the United States NCEP center, the CFSv2. Its temperature forecast for June shows the same pattern, with the main area of above-normal temperatures over the west, and a more tame early summer pattern over the eastern United States.

These are early indications of potentially more dynamic summer weather patterns over the United States and Canada. We will publish a separate article on the Summer 2025 trends, with more in-depth analysis and forecasts for the whole season.
Forecast Graphics in the article are from WeatherBell Maps using a commercial license and Tropical Tidbits.
We will keep you updated on the global weather pattern development, so bookmark our page. Also, if you have seen this article in the Google App (Discover) feed, click the like button (♥) there to see more of our forecasts and our latest articles on weather and nature in general.