As July starts and the Independence Day celebrations approach, an unprecedented atmospheric phenomenon has locked the central and eastern United States into a severe, multi-day thermal feedback loop. A powerful and a historic Heat Dome has parked over the nation.
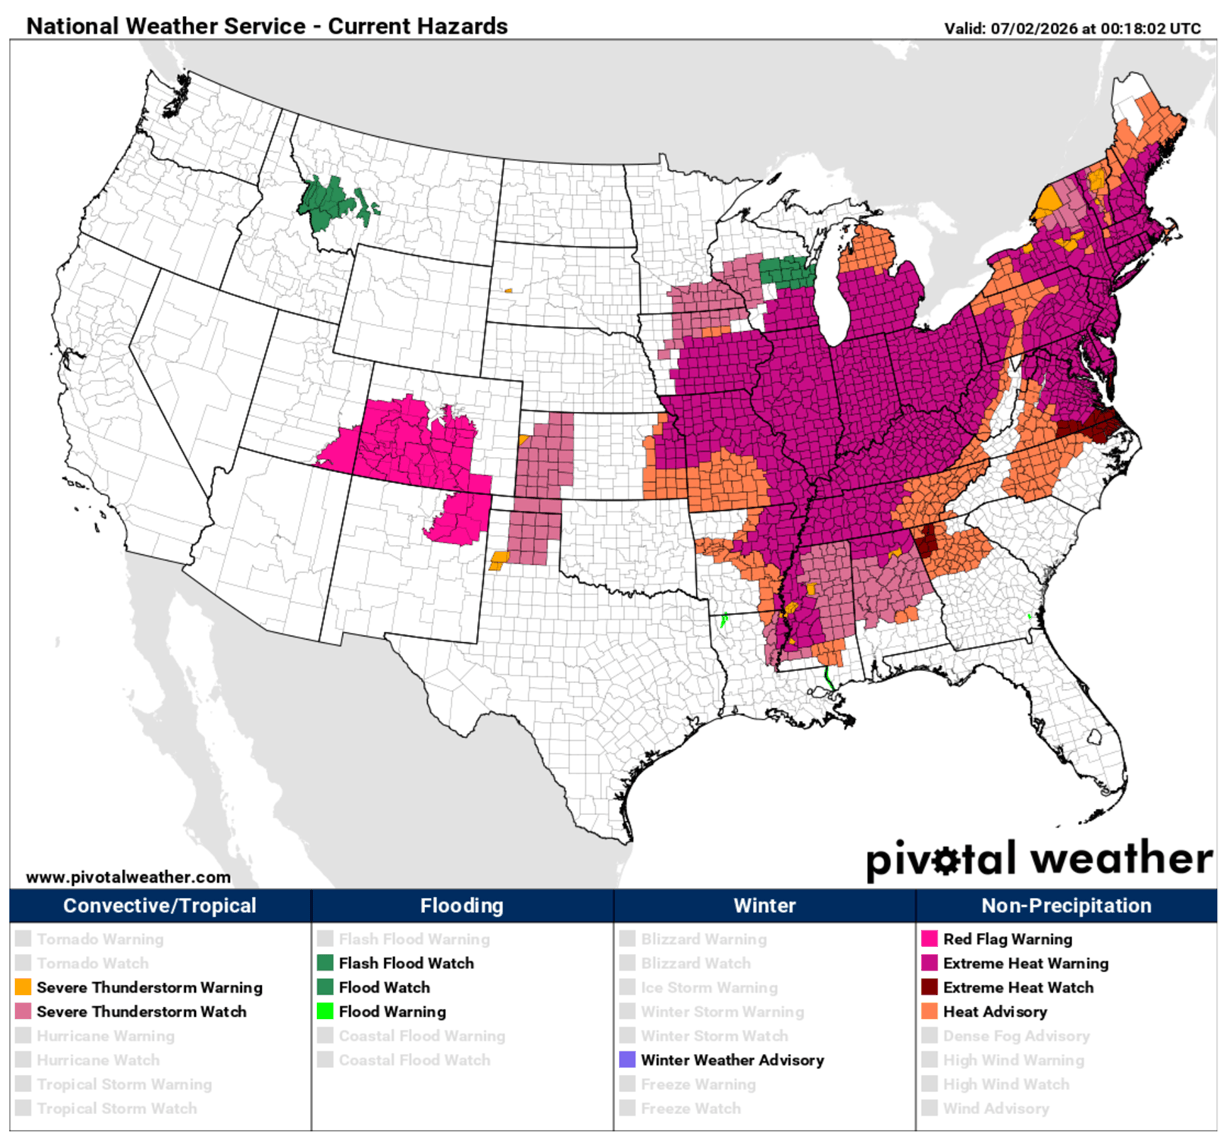
The blocking High pattern has a high-pressure atmospheric ‘lid’ that has stalled directly over the country, trapping intense surface heat and soaring humidity across more than two-thirds of the contiguous US. With temperatures and humidity increasing, a historic heat dome is pushing extreme, life-threatening conditions into major metropolitan corridors, directly impacting more than 200 million Americans.
The timing of this significant meteorological anomaly presents a severe logistical challenge and emergency. As the nation converges for major outdoor gatherings, including historic Fourth of July weekend celebrations and high-profile FIFA World Cup matches, peak daytime heat indices are climbing to oppressive levels of 105-115 °F.
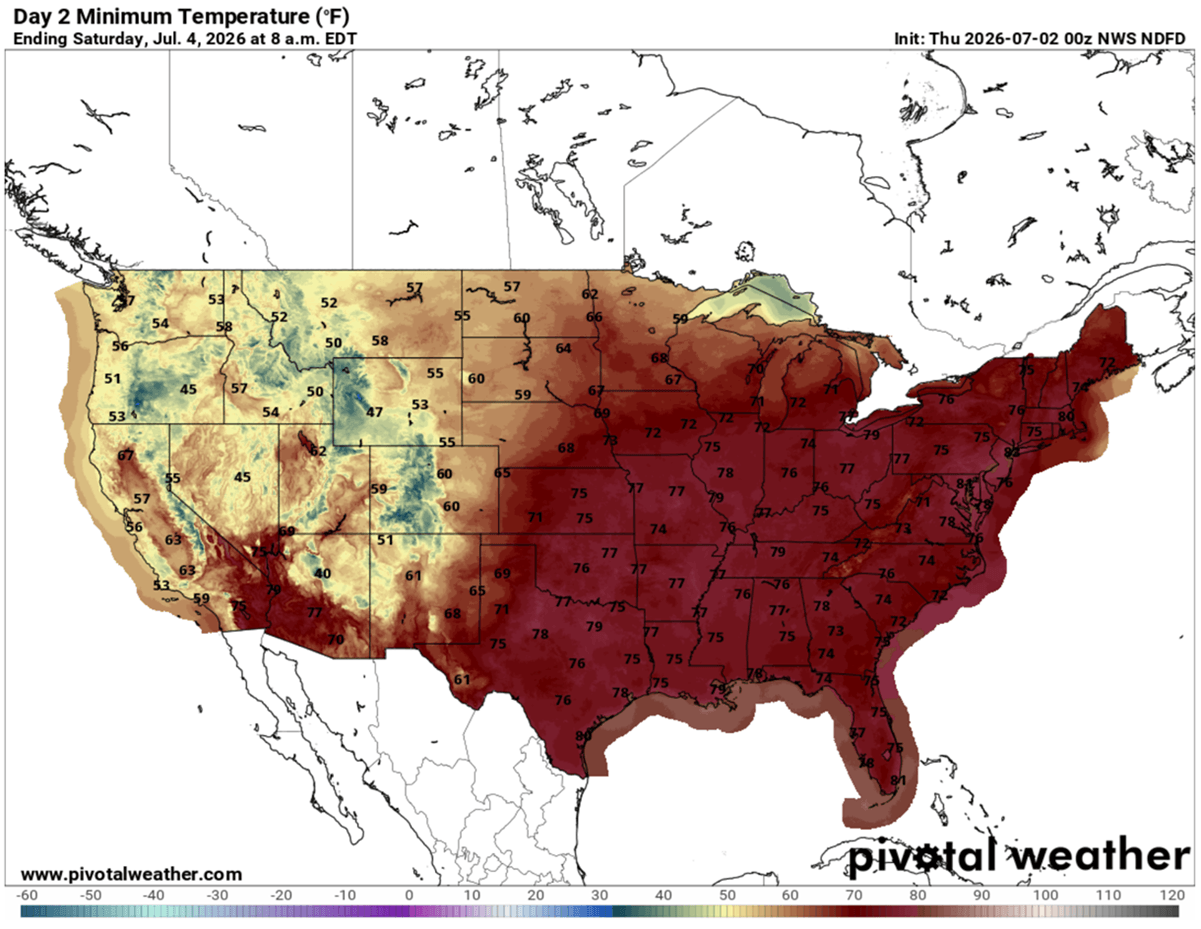
To further compound the danger, meteorologists warn that overnight lows are failing to drop below 75°F or 80°F in dense urban microclimates, leading to cumulative heat stress on the human body.
The scope of this multi-regional emergency has forced the government to intervene because the widespread, nonstop operation of residential air conditioning is compounding an already elevated electricity baseload demand. This puts the grid infrastructure under critical strain, so directives were issued to temporarily bypass certain environmental restrictions, allowing power plants to run at full capacity and activating emergency backup diesel generators to prevent cascading blackouts.
The combination of extreme heat and exceptionally high humidity will also cause severe heat stress for wildlife and livestock, with the heat index approaching 115 °F. More than 230 million people will be experiencing daytime highs above 90 °F. The following days will challenge 100+ daytime heat records across the nation.
The primary corridor of excessive heat is I-95 (New York City, Washington, D.C., and Philadelphia), as well as major hubs in the Midwest, such as Chicago, Detroit, and St. Louis.
Before we dig into the details of the pattern evolution across the United States, let’s examine the main driver behind these extensive warm waves and heatwaves.
What is the Mechanism of the Heat Dome?
When significant, record-breaking heatwaves occurred in the United States, Canada, and Europe in the past, the Heat Dome was a contributing factor. The heat dome is usually the dominant feature of summer weather patterns on both continents.
We refer to this phenomenon as a heat dome when extremely high temperatures develop. Here’s how it works and why understanding it on a broader scale is essential.
The upper-level ridge pattern, or very warm air mass in the higher altitudes, also known as the Upper High (or blocking High), usually forms the heat dome. This weather pattern brings high, and sometimes record-breaking, temperatures to the region below.
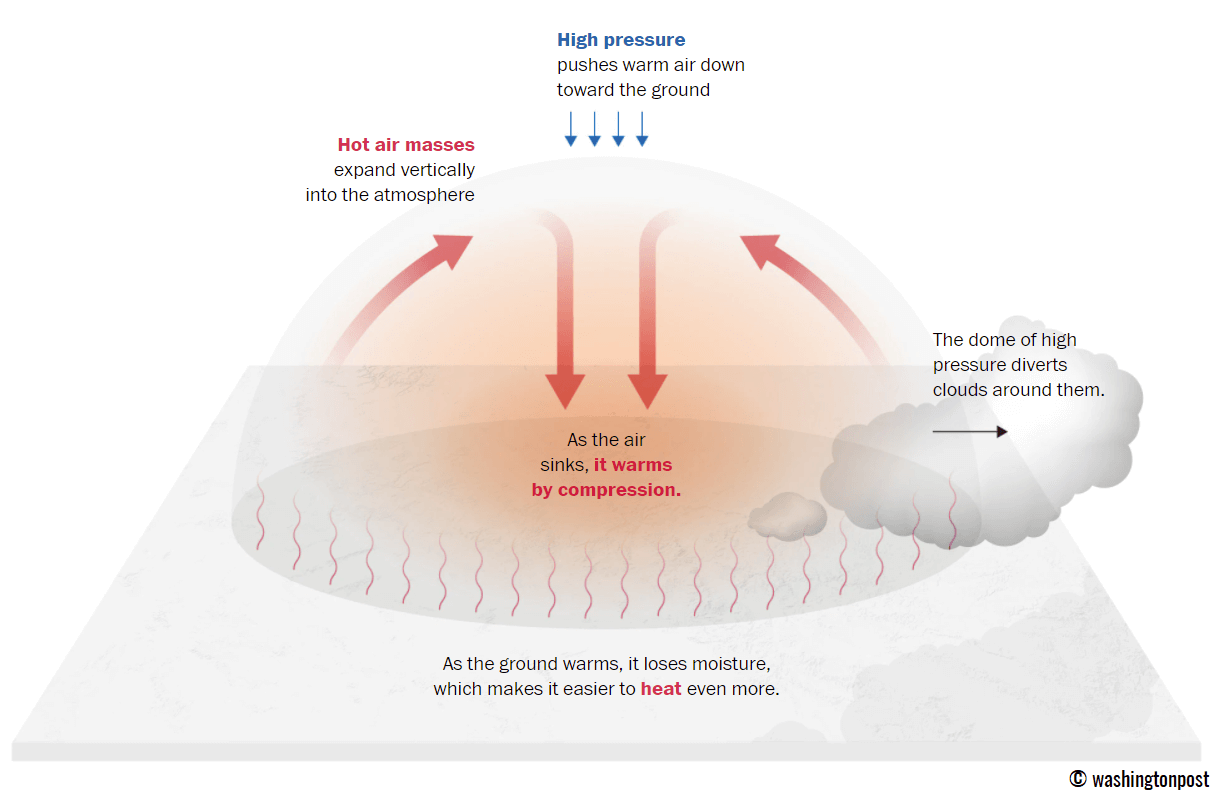
This term is used when a broad area of high-pressure air parks over a large portion of the continent. If the event is remarkably stable and extreme, it usually lasts several days or weeks.
The heat dome works like a lid on a pot. The extensive dome traps warm air at all levels underneath, with layers sinking toward the ground. Therefore, the air mass becomes anomalously warm at the lowest elevations and extremely hot near the surface.
How does a heat dome impact the life underneath?
Excessive heat in heat domes can significantly impact human health and be dangerous to particularly vulnerable populations, such as elderly individuals, children, and those with pre-existing health conditions that can be worsened by extreme heat.
Due to prolonged exposure to high temperatures, construction workers, farmers, and other long-hour outdoor workers are at increased risk of heat-related illnesses. People living in poverty are also more susceptible to the fatalities of heat domes, as their houses are often built with heat-trapping surfaces such as concrete and asbestos.
Heat exhaustion occurs with prolonged exposure to high temperatures. It leads to dehydration, dizziness, and, in more severe cases, heat exhaustion can progress to heat stroke.
High relative humidity during a heatwave can also significantly affect the body. For this reason, we use the Heat Index to represent the perceived feel of scorching-hot temperatures and high humidity. It illustrates the natural relationship between temperature and humidity.
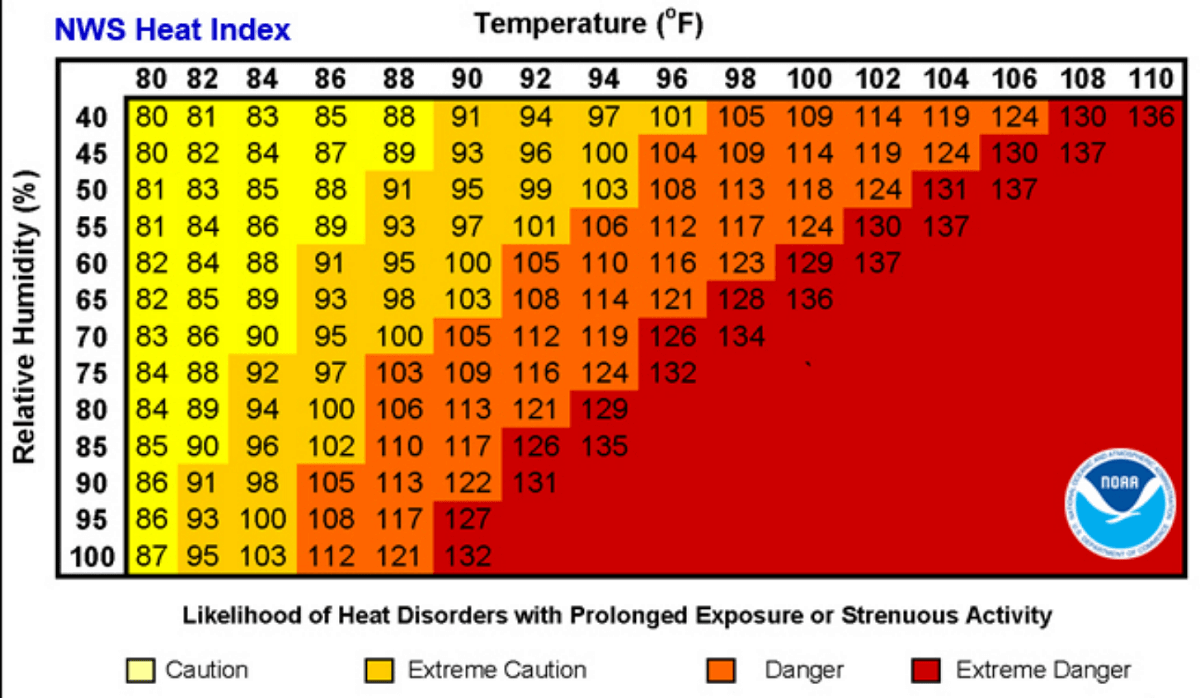
As we can see, when the air mass has a temperature around 90°F, humidity below 60% is much less challenging than when humidity is very high, e.g., above 80%. Thus, the actual feel temperature would be near 113 degrees F.
Heat waves have also been associated with increased rates of heart attacks, strokes, and respiratory illnesses.
Our additional article, Health risks during a heatwave and sweltering hot weather, provides further details on the health risks.
A historic Heat Dome grips 200+ million Americans for Fourth of July celebrations, Heat Index soars past 110 °F
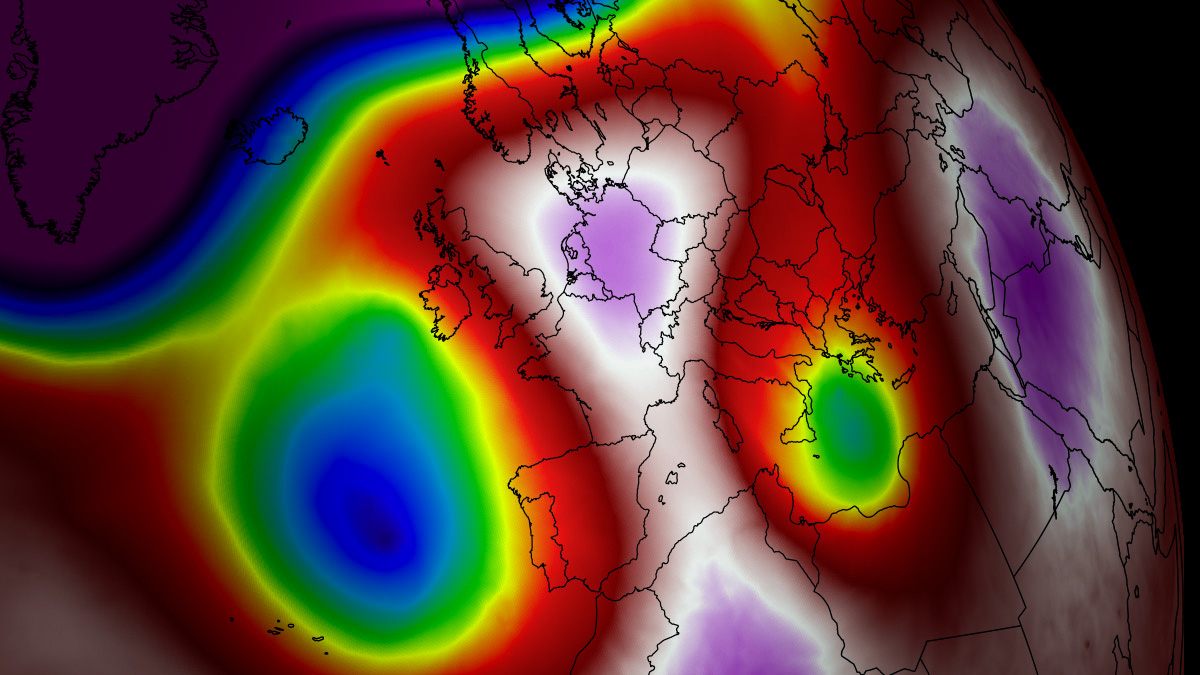
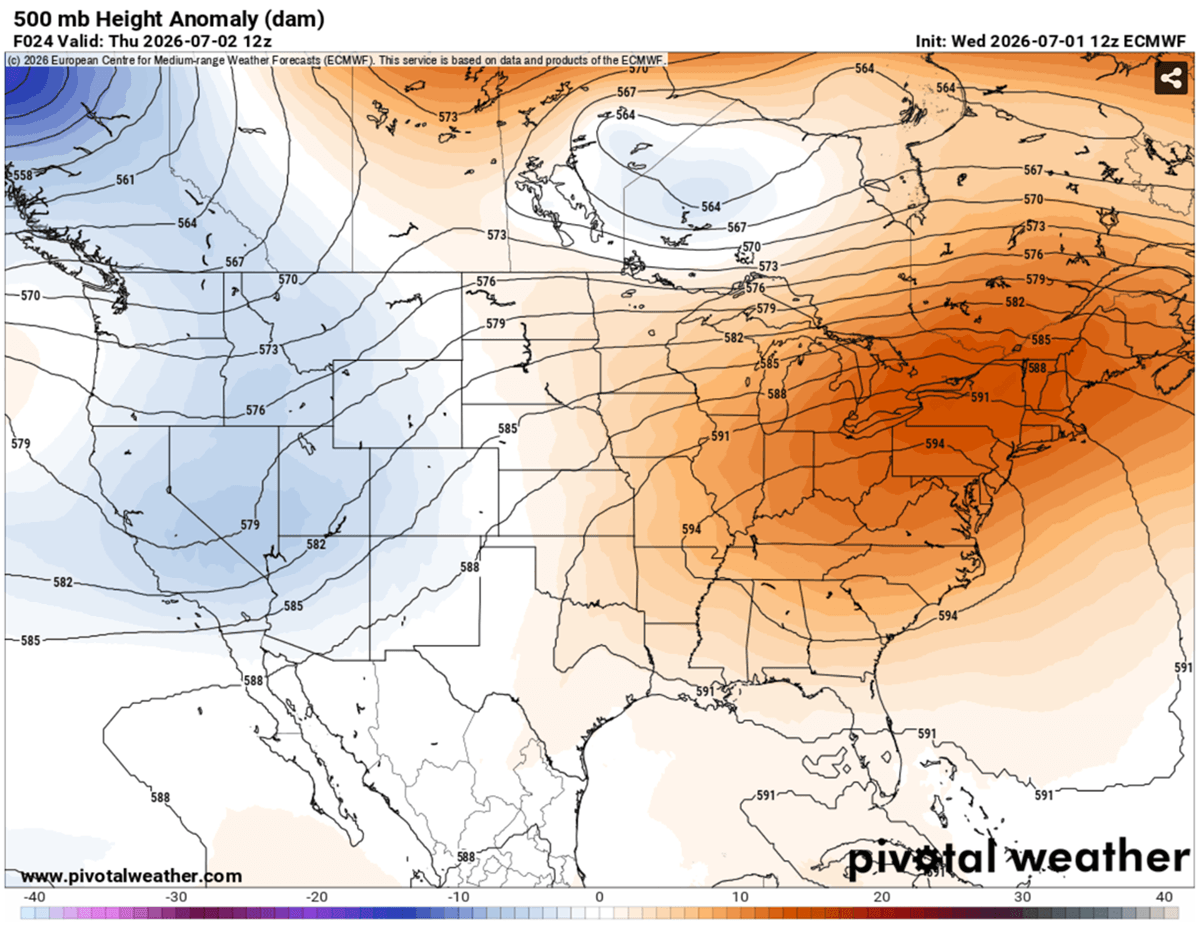
The general weather picture over the Contiguous U.S. for the Fourth of July weekend and the historic Independence Day celebrations indicates a deep upper wave emerging into the Pacific Northwest and western CONUS, while to its east a broad area of high pressure is forecast to gradually develop beneath the upper ridge.
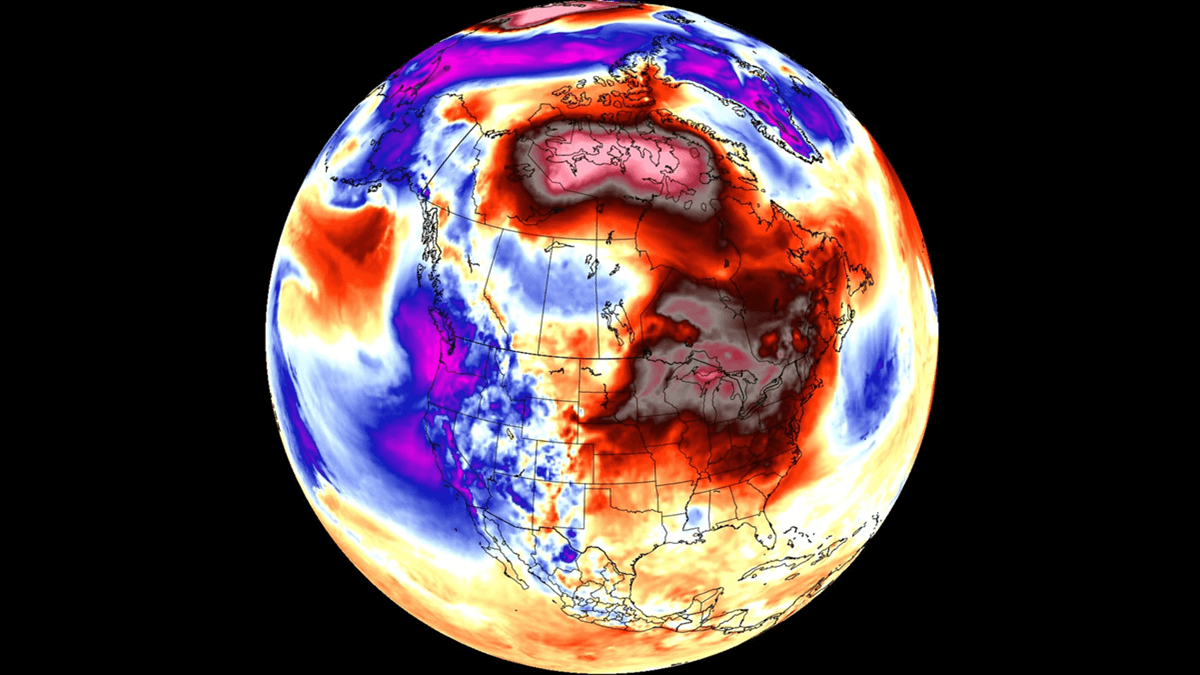
At the same time, a historic Heat Dome formed aloft. Thus, it stabilizes the ridge and strengthens its core even further, trapping a much warmer, high-humidity air mass beneath. It leads to increased sweltering hot conditions and severe heat stress.
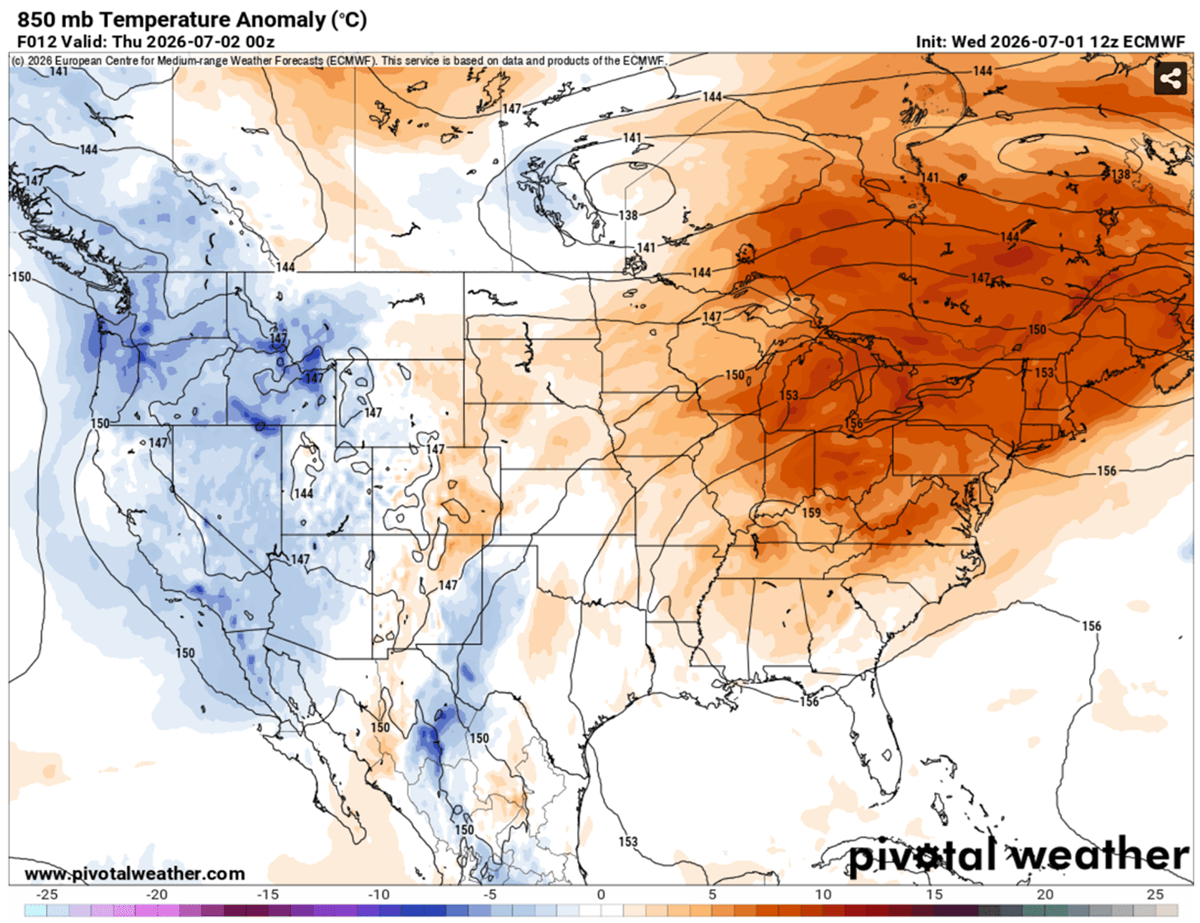
The warmest air mass first spreads across the central U.S. and Midwest, the Great Lakes and the Northeast U.S., and eastern Canada. From Thursday through Sunday, the highest anomalies reach around 10-15 °C above normal at the 850 mbar level. Precisely across the Great Lakes, the Northeast, and Ontario, Canada.
This translates into significantly warmer surface temperatures, with readings already pushing into the mid-90s to near 100 °F in some places this week. And those will continue to increase through Sunday as the Heat Dome aloft traps more heat and high humidity beneath it. Heat Index will exceed 110 °F in many states.
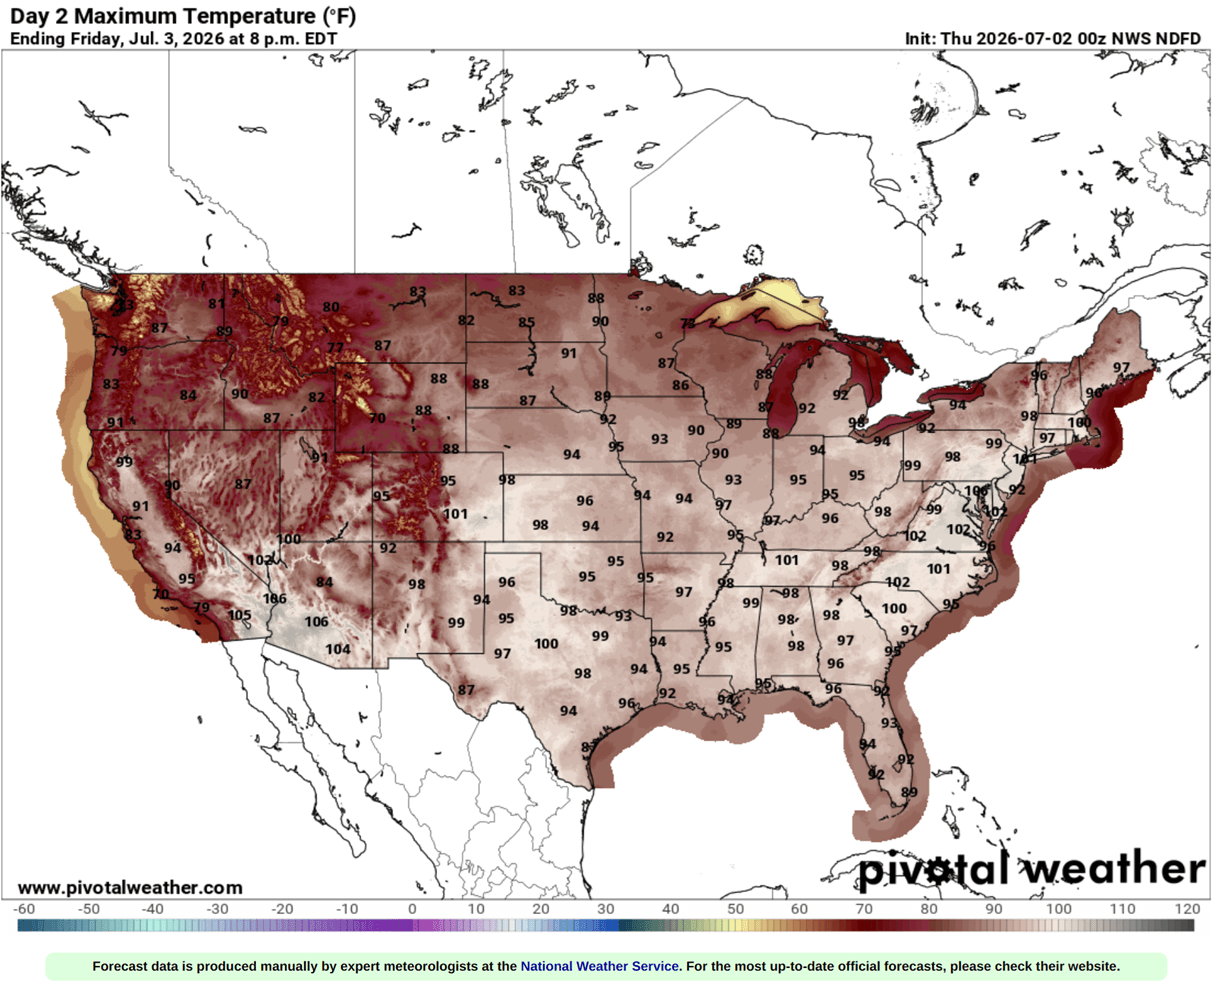
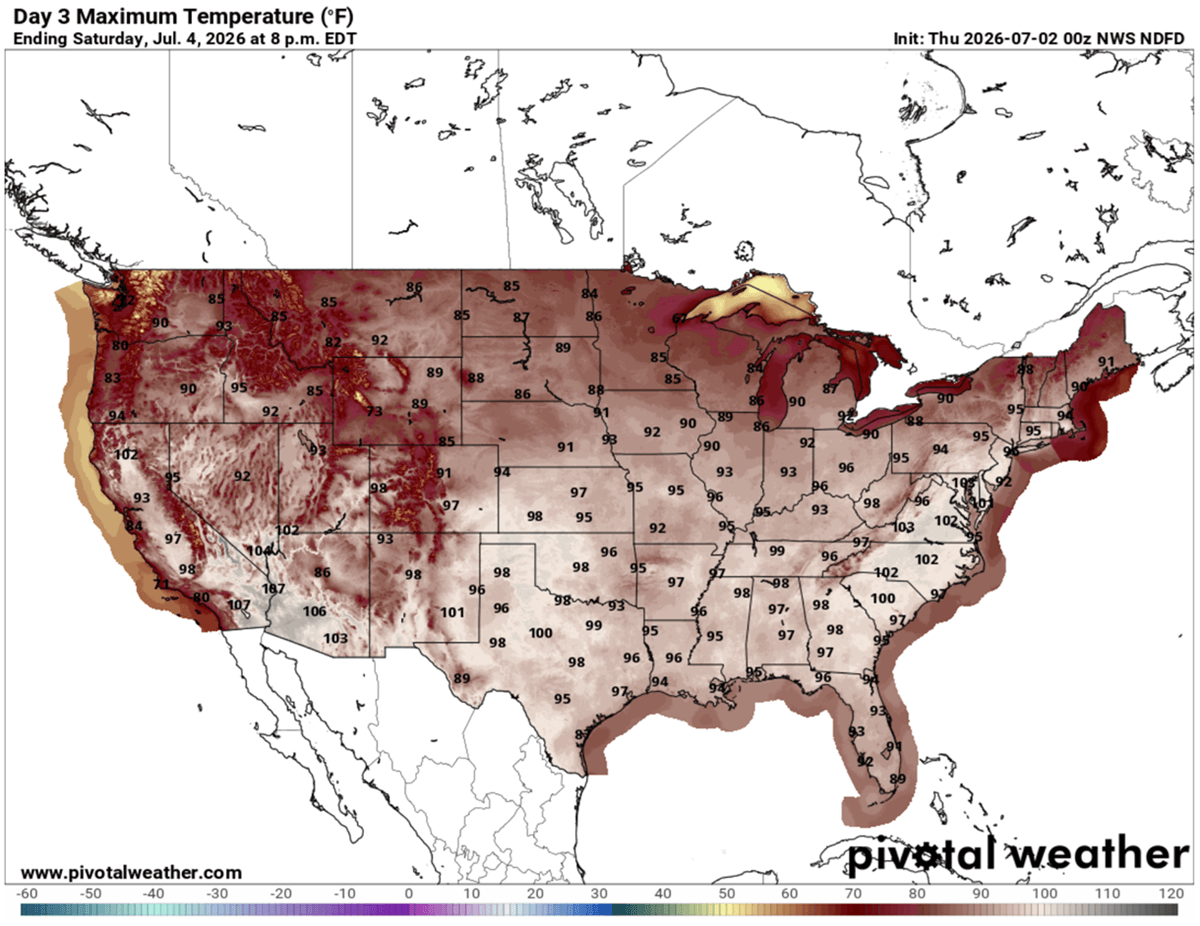
The following chart hints at peak temperatures on Friday afternoon; upper 90s to around 103°F are expected across a large part of the country. The most extreme values are from Texas across the Southeast U.S. to the East Coast, where the highest moisture is present.
Highs into the mid to upper 100s across the southwestern states and upper 80s to low 90s across the northern Plains and Upper Midwest.
The concerning aspect of the ongoing heatwave is the very high humidity, which has resulted in a significantly elevated Heat Index. The eastern two-thirds of the US will experience an index above 100 °F to nearly 110 °F. This is the result of an overheated air mass trapped underneath the Heat Dome as July starts.
High humidity will also prevent overnight lows from dropping below 75°F or 80°F, which adds to heat stress for tens of millions from the Great Plains across the Mississippi Valley and the Southeast U.S. to the Northeast United States.
Scorching hot weather is forecast to continue into the weekend’s historic Fourth of July national celebrations, with temperatures ranging from the upper 90s to the low 100s across the south and east CONUS. More than 200 million Americans will be under extreme heat.
The Southeast U.S. and the East Coast will see particularly excessive heat, as the Heat Dome aloft parks over the region for days. The air mass beneath will be trapped and ‘overheat,’ which is a typical occurrence during intense Heat Dome events.
After the weekend and early following week pattern, the general trends in global weather models indicate some uncertainties regarding the persistence of the heat dome. However, the general idea is that the upcoming heatwave could persist into the early days of next week.
We will continue to monitor the evolution of the weather pattern and update the forecasts accordingly.
Stay tuned for updates.
PivotalWeather, and WXcharts provided images used in this article.
See also: