Have you ever wondered which part of Europe has the highest annual number of days with thunderstorms? Do you want to know how thunderstorm activity changes throughout the year? A newly published study in the Journal of Climate entitled A Climatology of Thunderstorms across Europe from a Synthesis of Multiple Data Sources led and authored by Dr. Mateusz Taszarek, answers these questions.
By combining multiple data sources, including human observations of thunderstorms (SYNOP reports), numerical weather model output (ERA-Interim reanalysis), lightning data (EUCLID and ZEUS networks), and severe weather reports (European Severe Weather Database), scientists determined that the highest frequencies can be found predominantly along the Italian peninsula, the eastern shores of the Adriatic Sea, and the southern slopes of the Alps.
The plains and hills of Friuli are the hot spots in Europe, with more than 50 days of thunder occurring each year. Other regions with more than 35 thunderstorm days are typically in the foothills of mountainous areas, such as the Pyrenees, the Atlas Mountains in northern Africa, the Alps through central Europe, and the Carpathians. The annual frequency decreases northward, from 25–35 days over southern Europe to fewer than 10 days over Scandinavia.
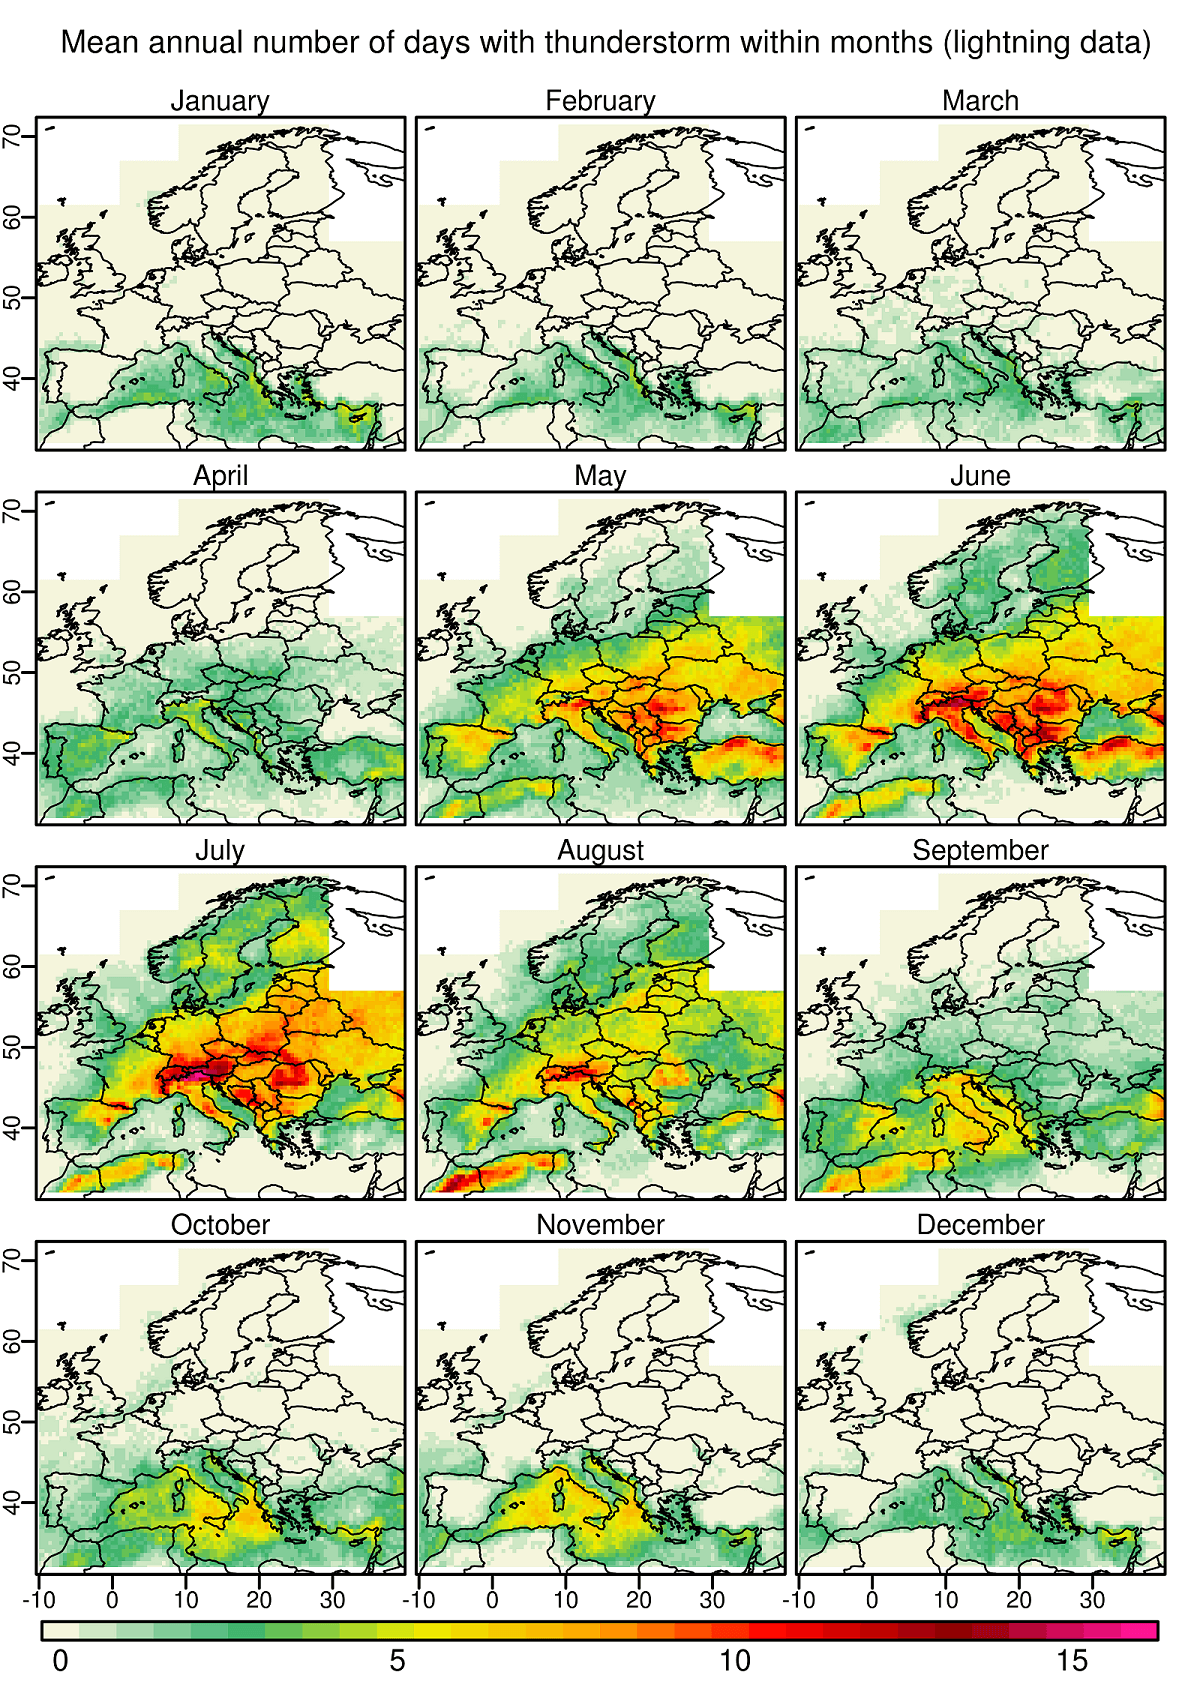
Figure 1. Based on EUCLID and ZEUS lightning data, the mean annual number of days with thunderstorms each month is a Figure from Taszarek et al. 2019. A Climatology of Thunderstorms across Europe from a Synthesis of Multiple Data Sources. J. Climate, 32, 1813–1837, https://doi.org/10.1175/JCLI-D-18-0372.1
Peak thunderstorm activity occurs over northern, eastern, and central Europe in July and August. In western and southeastern Europe, the highest chances for thunderstorms are in May and June.
Although the western Iberian Peninsula and eastern Turkey feature peak thunderstorm activity in April and May over coastal regions of Spain and Portugal, this threat shifts to October (some of these locations have bimodal distributions, which is shown later).
The highest probabilities for thunderstorms over the western and the central Mediterranean also occur during October and November and shift toward December and January over the eastern Mediterranean.
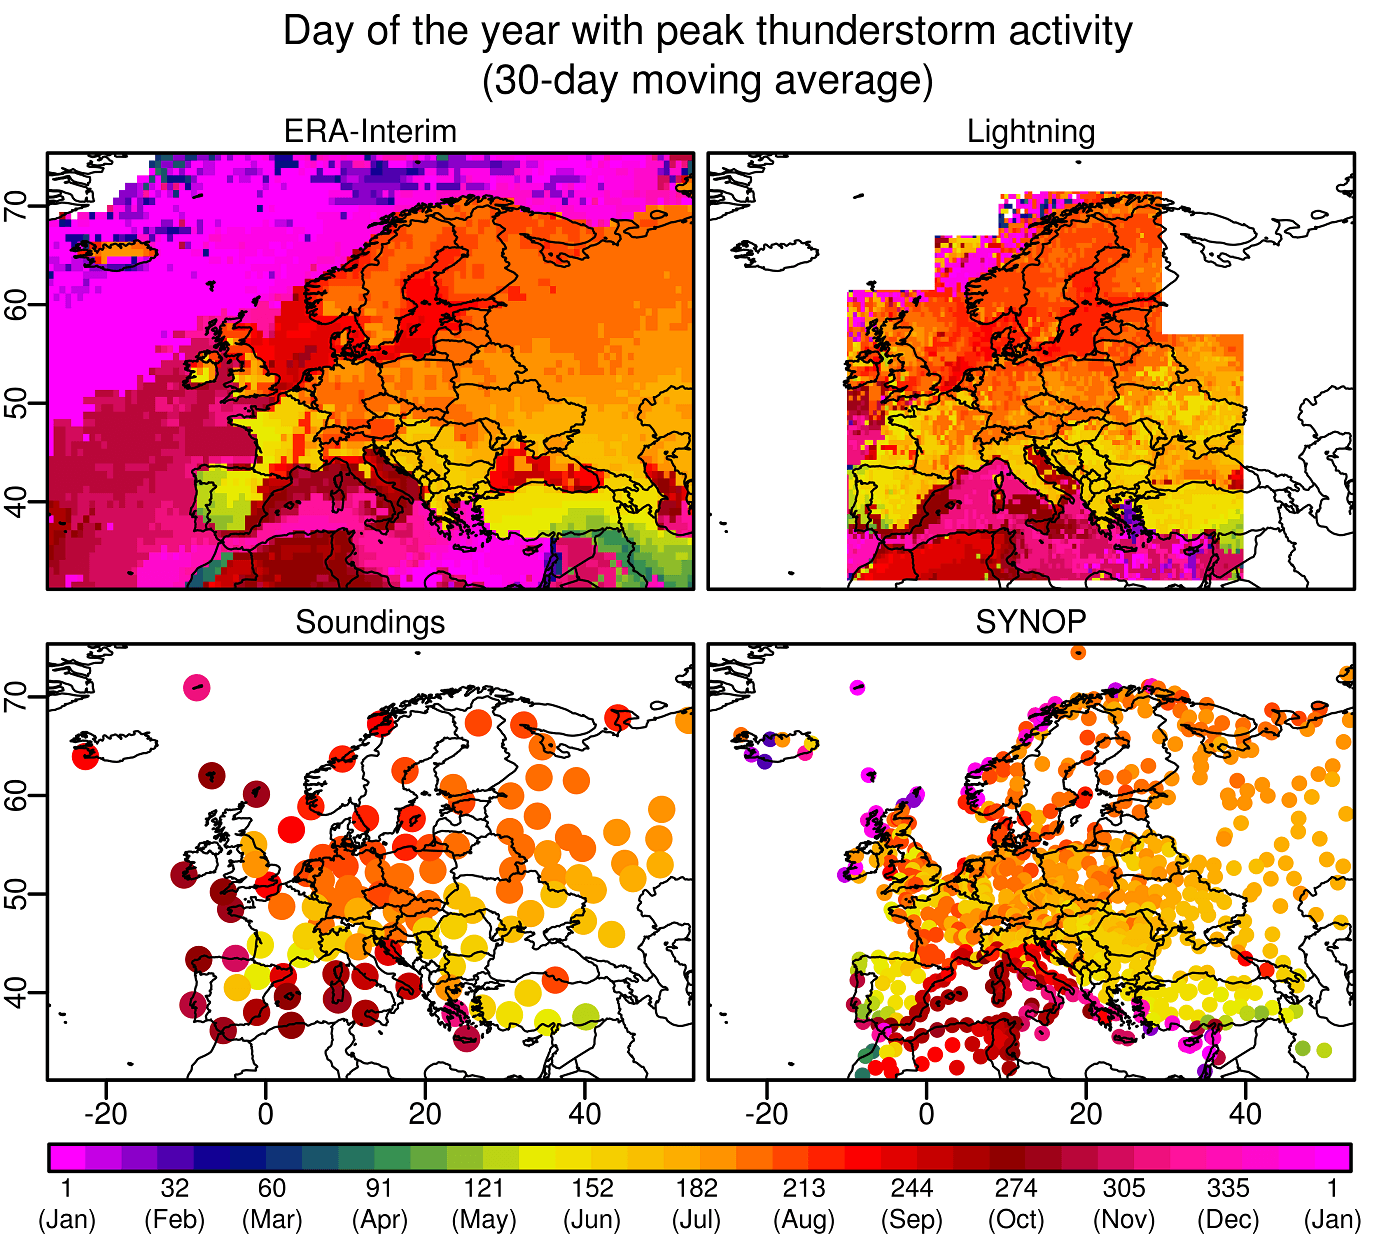
Figure 2. Day of the year with peak thunderstorm activity computed by 30-day moving average for (top left) ERA-Interim, (top right) lightning, (bottom left) sounding measurements, and (bottom right) human observations of thunderstorms (SYNOP reports). Figure from Taszarek et al. 2019. A Climatology of Thunderstorms across Europe from a Synthesis of Multiple Data Sources. J. Climate, 32, 1813–1837, https://doi.org/10.1175/JCLI-D-18-0372.1
Stations in northern Europe (Sundsvall, Goteborg, Helsinki) are characterized by the weakest (severe) thunderstorm activity beginning in May and ending in October. The warm waters of the Gulf Stream favor thunderstorms in Stavanger in autumn and winter.
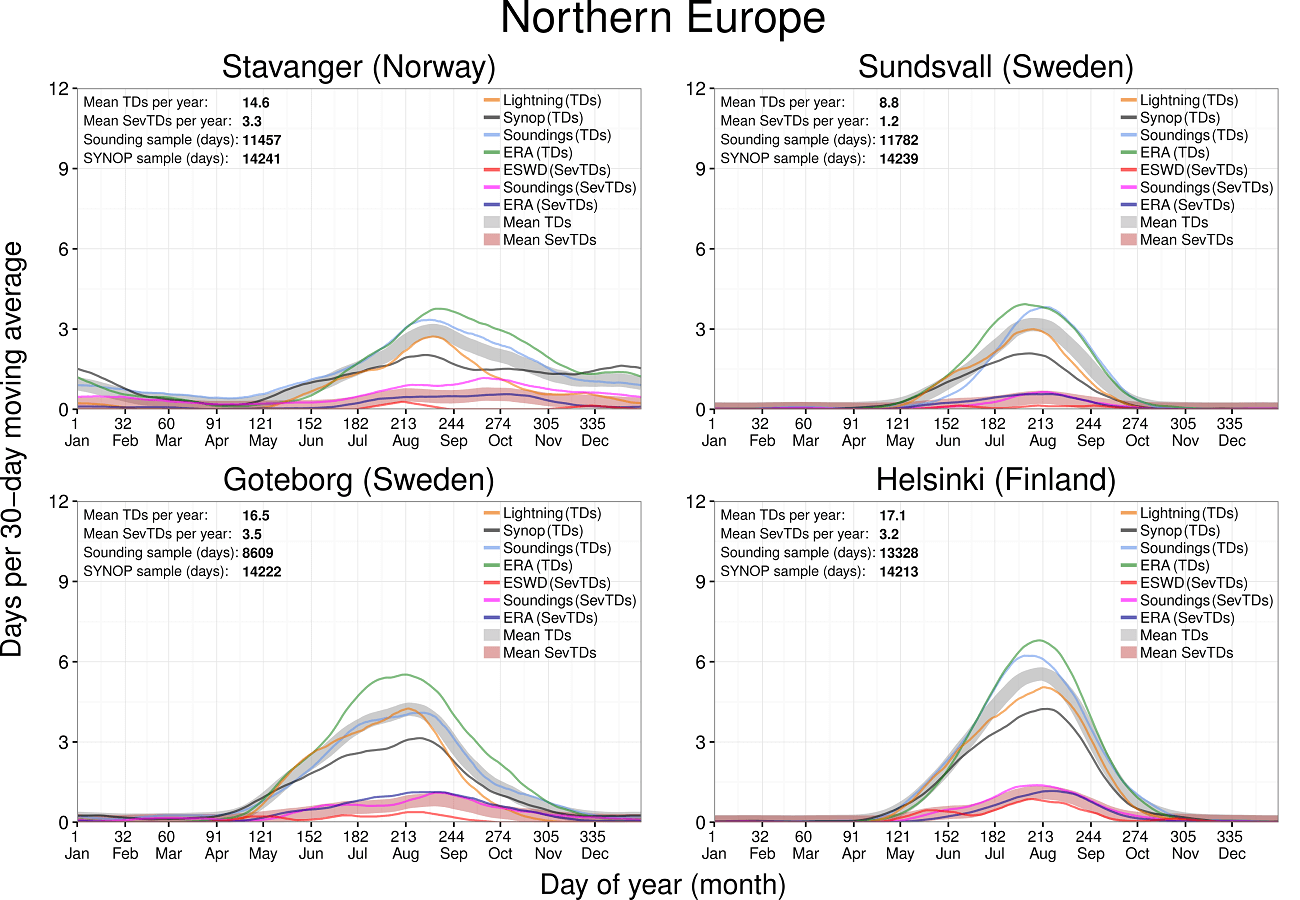
Figure 3. Annual cycle of (severe) thunderstorm days over chosen northern European stations. For each site, nearby stations and grid points were selected. Solid lines denote the 30-day moving average of thunderstorm days for lightning (orange), human observations (black), atmospheric soundings (blue), ERA-Interim reanalysis (green), and severe thunderstorm days for European Severe Weather Database (red), atmospheric soundings (pink), and ERA-Interim reanalysis (purple). Transparent thick lines denote mean values for thunderstorm days (gray) and severe thunderstorm days. (dark red). Figure from Taszarek et al. 2019. A Climatology of Thunderstorms across Europe from a Synthesis of Multiple Data Sources. J. Climate, 32, 1813–1837, https://doi.org/10.1175/JCLI-D-18-0372.1
In northwestern Europe (London, Schleswig, Paris, De Bilt), the thunderstorm season begins in March or April and ends in November or as late as December. London features less variability in thunderstorm activity during the year compared to more continental stations of Schleswig, Paris, and De Bilt.
The mean annual number of thunderstorm days for analyzed stations ranges from 15 to 22 (4 to 8 for severe thunderstorms).
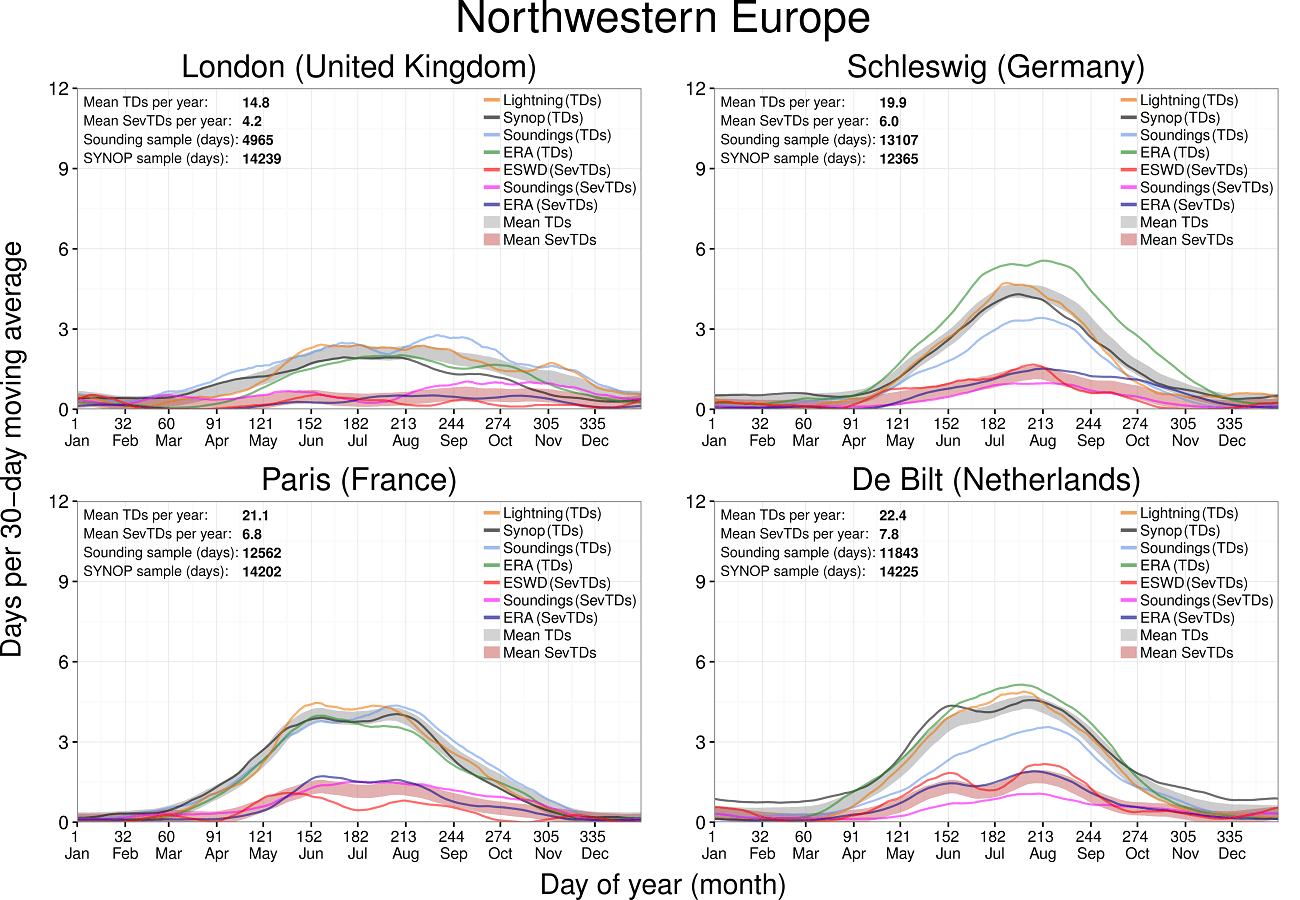
Figure 4. As in Figure 3 but for Northwestern Europe. Figure from Taszarek et al. 2019. A Climatology of Thunderstorms across Europe from a Synthesis of Multiple Data Sources. J. Climate, 32, 1813–1837, https://doi.org/10.1175/JCLI-D-18-0372.1
In central Europe, thunderstorm activity peaks during summertime, rapidly increasing in April and decreasing in October. The mean annual number of thunderstorm days for these stations ranges from 27 to 31 (8 to 13 for severe thunderstorm days).
In Udine, the thunderstorm season lasts until December, with a mean of 51 (20 for severe) thunderstorm days per year — the highest in Europe.
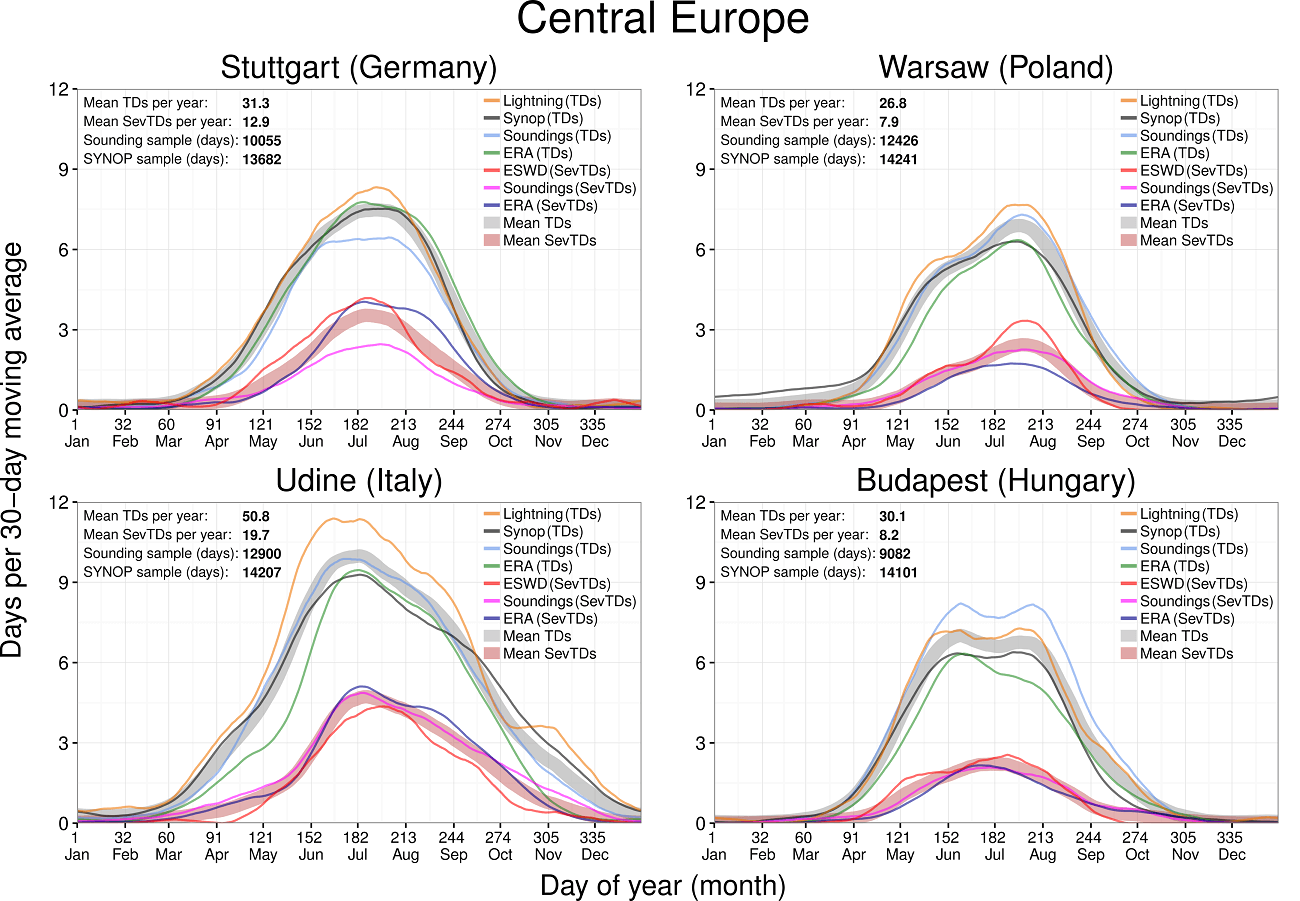
Figure 5. As in Figure 3, but for Central Europe. Figure from Taszarek et al. 2019. A Climatology of Thunderstorms across Europe from a Synthesis of Multiple Data Sources. J. Climate, 32, 1813–1837, https://doi.org/10.1175/JCLI-D-18-0372.1
Over eastern Europe, a well-defined peak in thunderstorm activity can be found in the summertime, with a rapid increase in May and a decrease in September/October, typical for a continental climate (Kazan, Kharkiv, Moscow). This area’s mean annual number of thunderstorm days ranges from 17 to 29 (4 to 8 for severe thunderstorms).
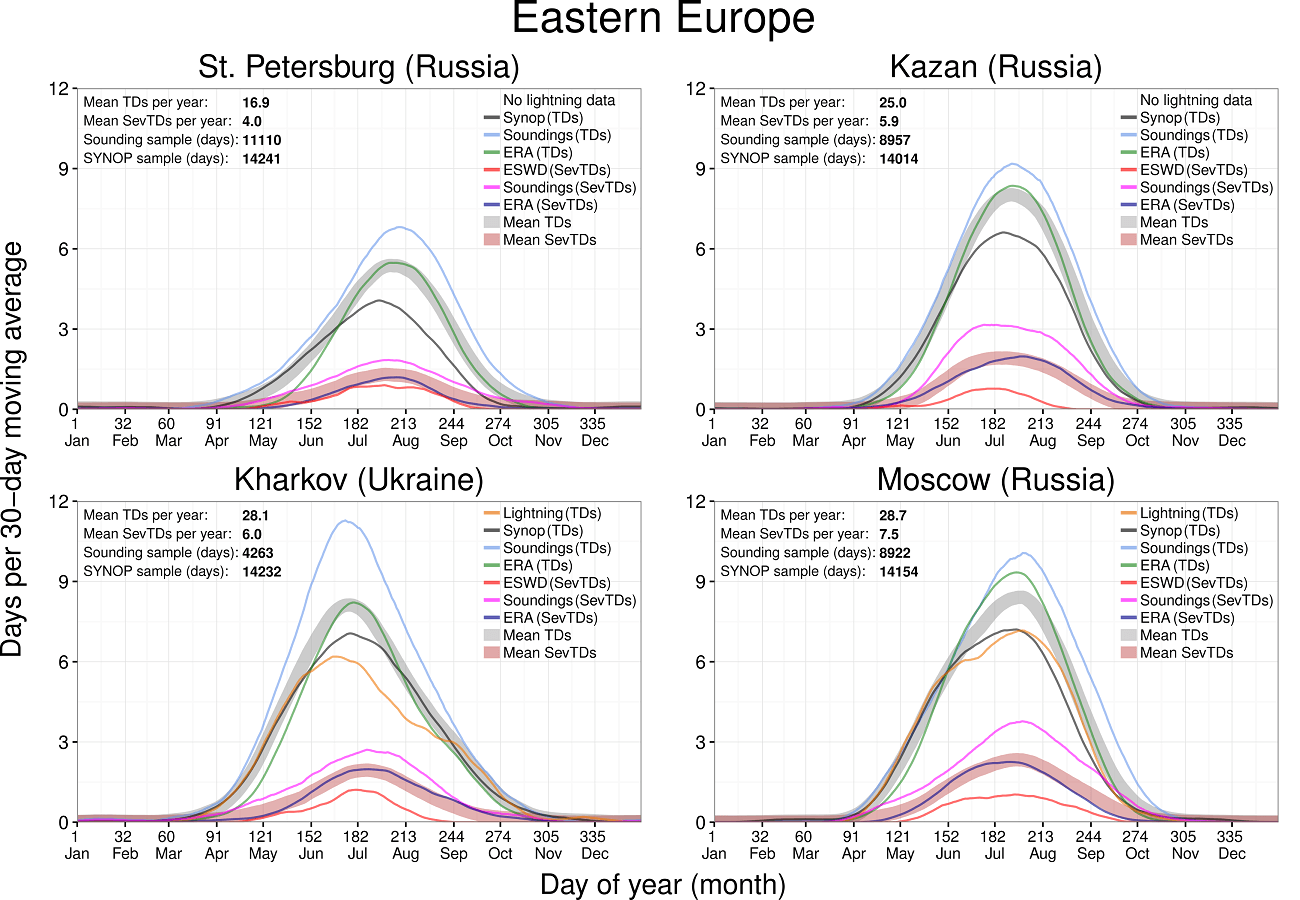
Figure 6. As in Figure 3, but for Eastern Europe. Figure from Taszarek et al. 2019. A Climatology of Thunderstorms across Europe from a Synthesis of Multiple Data Sources. J. Climate, 32, 1813–1837, https://doi.org/10.1175/JCLI-D-18-0372.1
Stations in southeastern Europe share similar features to those in central and eastern Europe. Belgrade, Bucharest, and Sofia have a well-defined peak in thunderstorm activity in summertime, with a rapid increase in April/May and a decrease in October.
The mean annual number of thunderstorm days for these stations ranges from 32 to 44 (8 to 13 for severe thunderstorms), suggesting that this area has the highest thunderstorm activity in Europe.
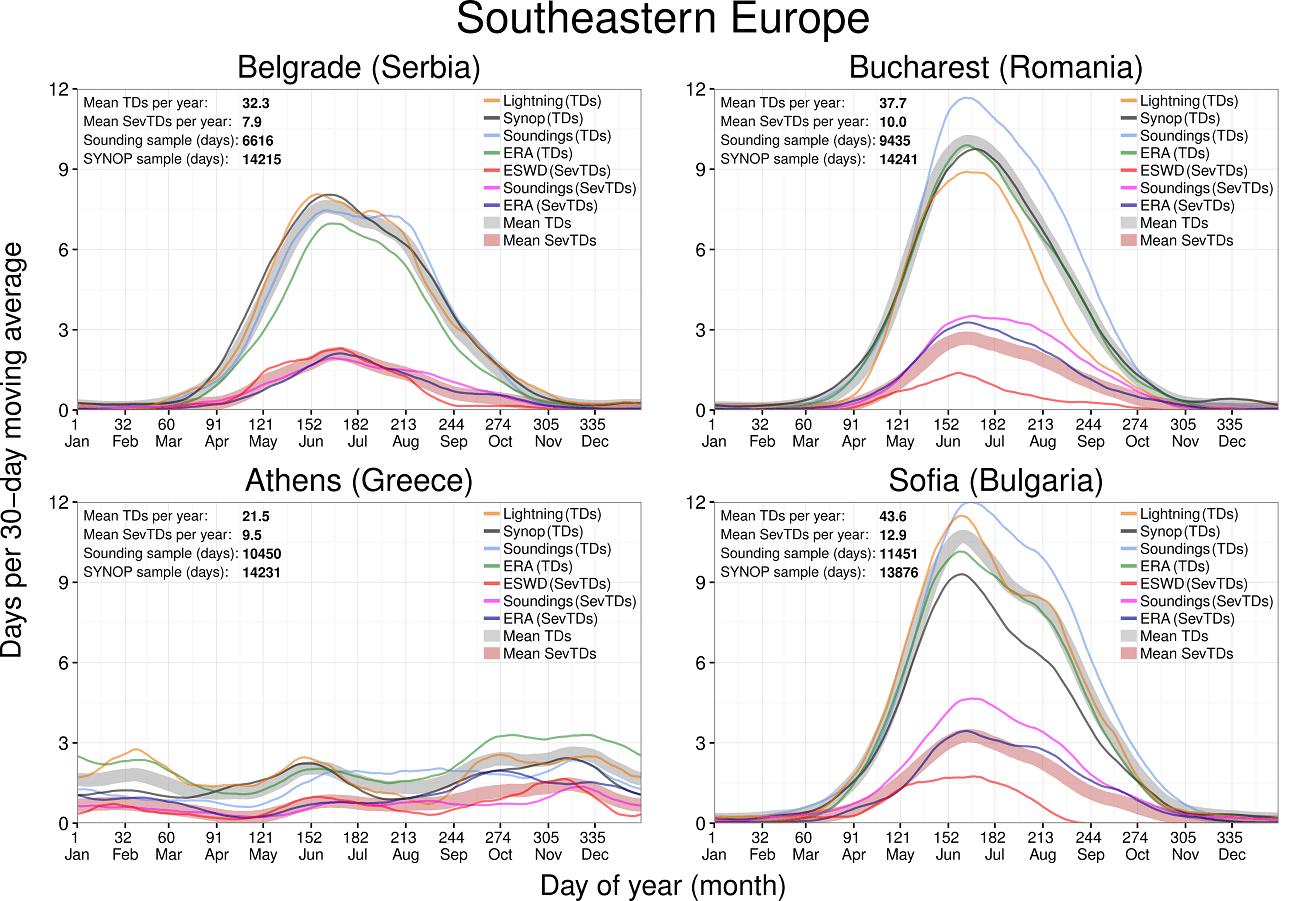
Figure 7. As in Figure 3 but for Southeastern Europe. Figure from Taszarek et al. 2019. A Climatology of Thunderstorms across Europe from a Synthesis of Multiple Data Sources. J. Climate, 32, 1813–1837, https://doi.org/10.1175/JCLI-D-18-0372.1
Stations in south-central Europe feature thunderstorms that occur all year round, driven by the warm waters of the Mediterranean Sea and more frequent convective initiation. The mean annual number of thunderstorm days for these stations ranges from 34 to 37 (10 to 14 for severe thunderstorms), and the yearly cycle is generally consistent between the datasets.
The peak in thunderstorm activity is observed in the late spring.
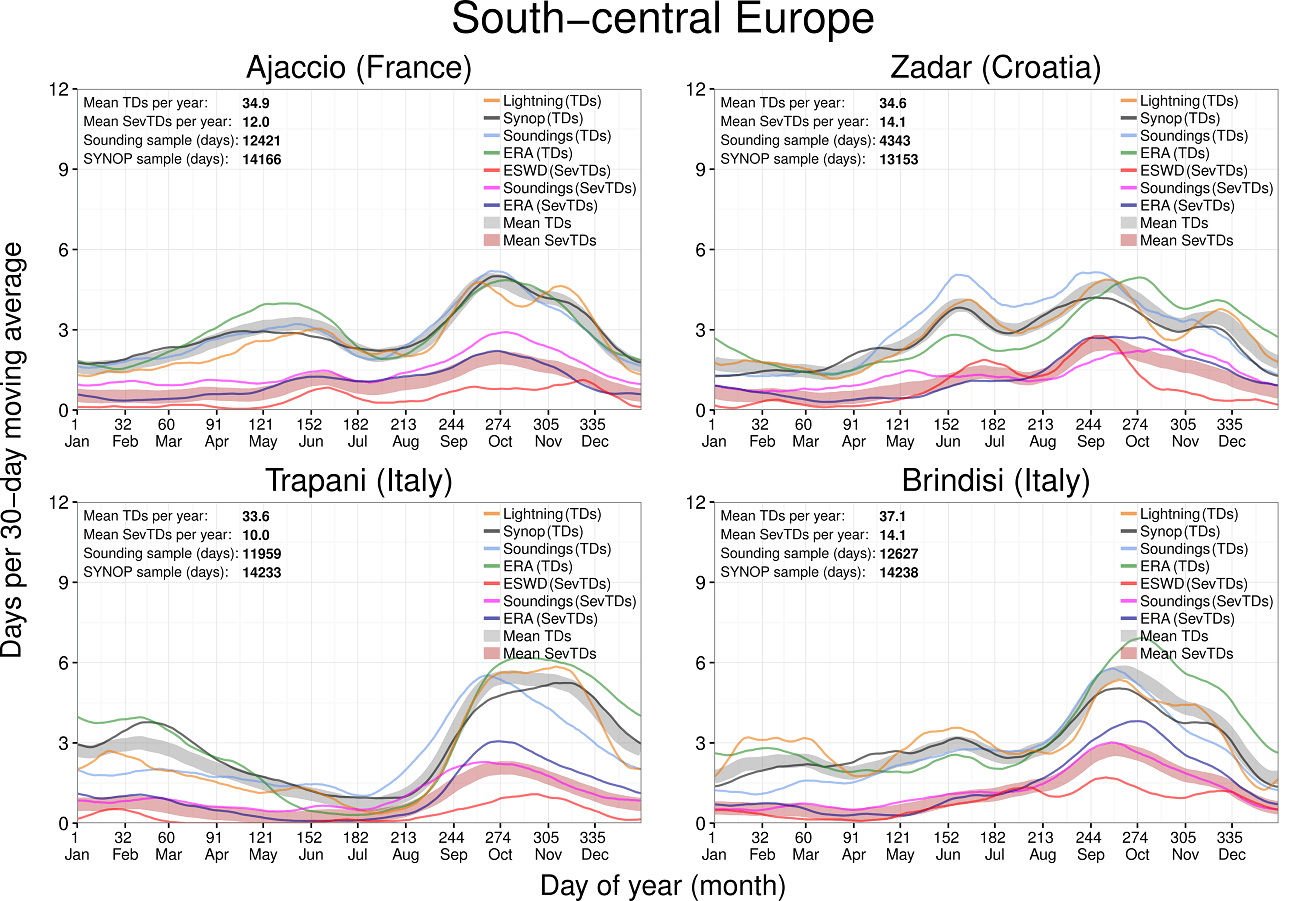
Figure 8. As in Figure 3 but for South-central Europe. Figure from Taszarek et al. 2019. A Climatology of Thunderstorms across Europe from a Synthesis of Multiple Data Sources. J. Climate, 32, 1813–1837, https://doi.org/10.1175/JCLI-D-18-0372.1
A much more significant influence of the Azore’s high, inhibiting summertime thunderstorm activity is evident in Lisbon, Gibraltar, and, to a lesser extent, Madrid. This leads to two peaks in the annual cycle in both spring and autumn. The mean annual number of thunderstorm days for stations in this area ranges from 18 to 24 (5 to 9 for severe thunderstorms).
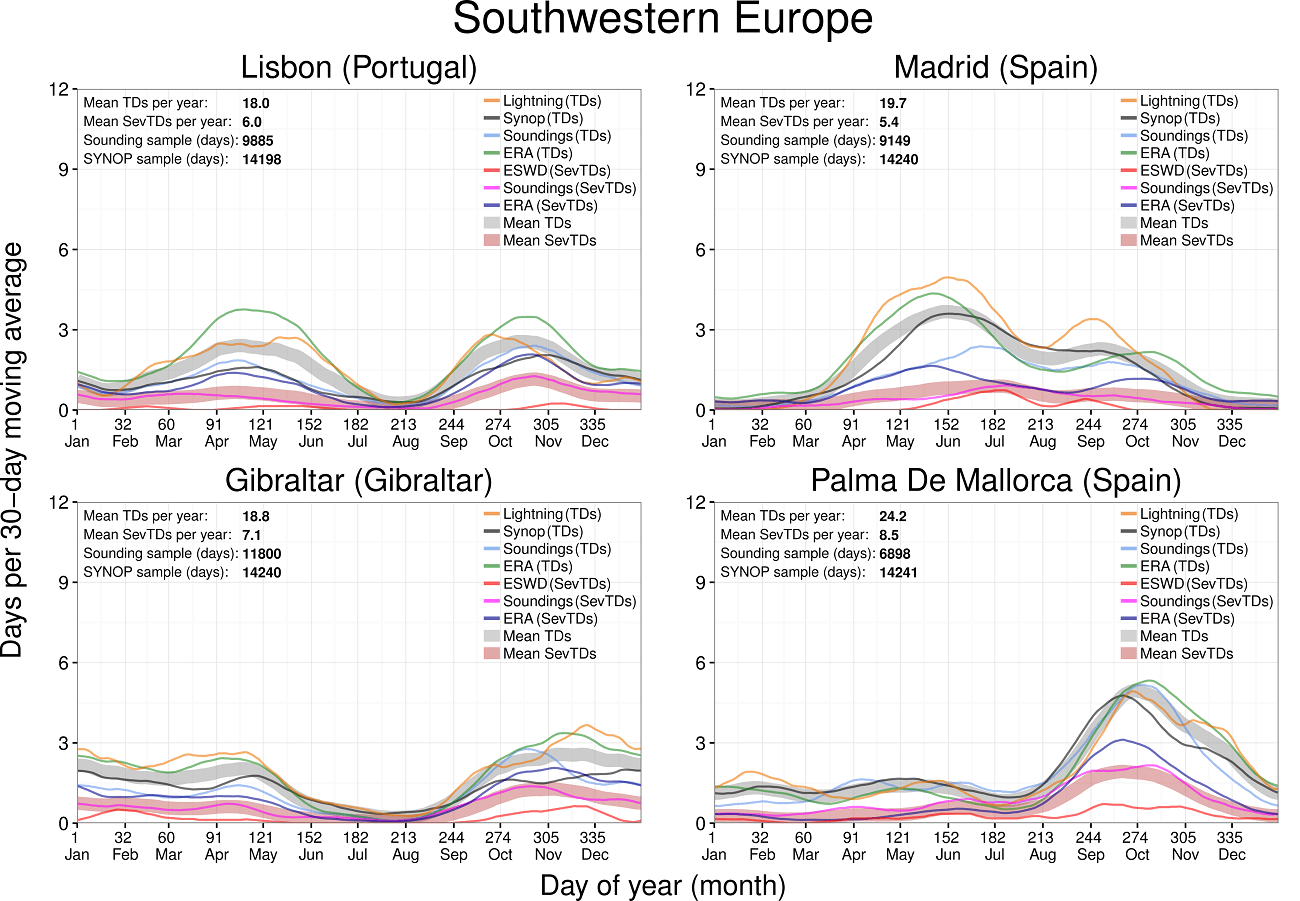
Figure 9. As in Figure 3 but for Southwestern Europe. Figure from Taszarek et al. 2019. A Climatology of Thunderstorms across Europe from a Synthesis of Multiple Data Sources. J. Climate, 32, 1813–1837, https://doi.org/10.1175/JCLI-D-18-0372.1
Considering a long-term change in the thunderstorm frequency over the continent, an increase occurs over the Alps and central, southeastern, and eastern Europe. Conversely, a slight decrease in lightning activity is observed over southwestern, south-central, and far southeastern Europe.
Similar spatial patterns are observed for severe thunderstorms, although the highest increase is observed over northern Italy and the Balkan Peninsula.
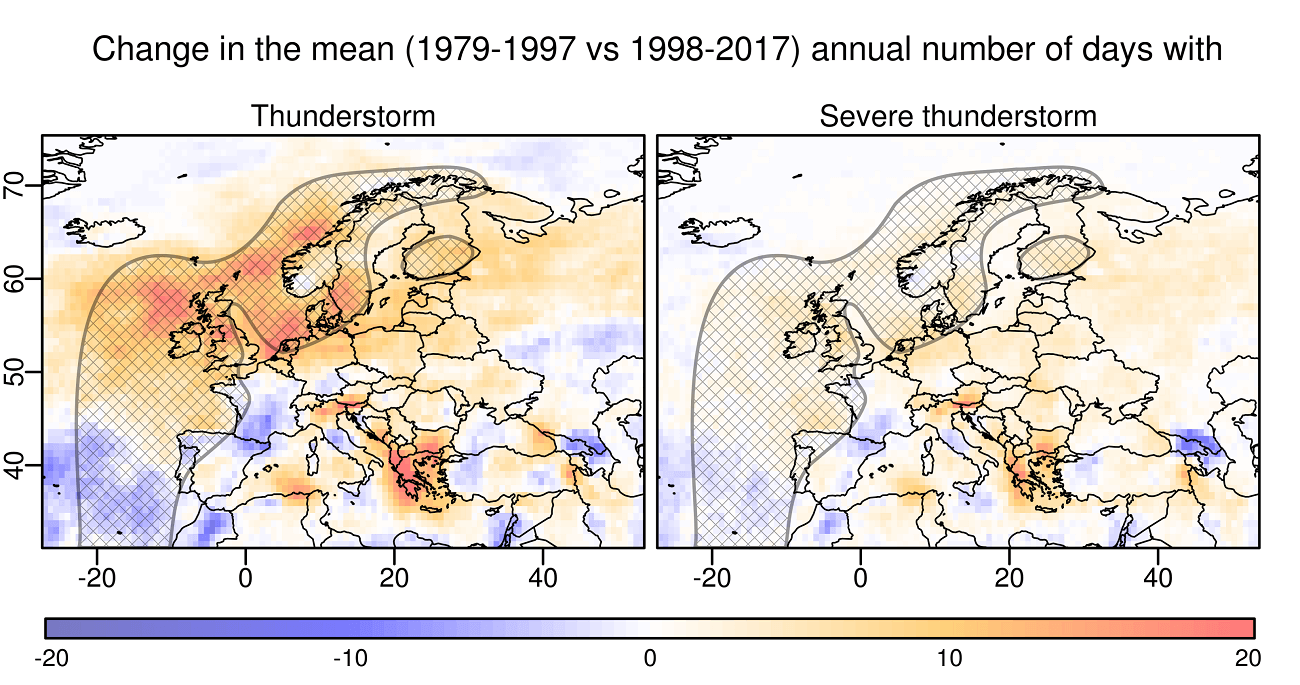
Figure 10. Multiannual changes in the mean annual number of days with (left) thunderstorms and (right) severe thunderstorms, computed as a difference between mean yearly values in 1979–97 and 1998–2017, based on ERA-Interim reanalysis. Hatched gray polygons denote areas where ERA-Interim (and/or the metrics used to derive thunderstorm days) has been shown to provide unreliable data, so results obtained within these areas should be interpreted cautiously. Figure from Taszarek et al. 2019. A Climatology of Thunderstorms across Europe from a Synthesis of Multiple Data Sources. J. Climate, 32, 1813–1837, https://doi.org/10.1175/JCLI-D-18-0372.1
For further information on thunderstorm climatology in Europe, check the full paper: Taszarek, M., J. Allen, T. Púčik, P. Groenemeijer, B. Czarnecki, L. Kolendowicz, K. Lagouvardos, V. Kotroni, and W. Schulz, 2019: A Climatology of Thunderstorms across Europe from a Synthesis of Multiple Data Sources. J. Climate, 32, 1813–1837, https://doi.org/10.1175/JCLI-D-18-0372.1
The Severe Weather Europe (SWE) team greatly appreciates Dr. Mateusz Taszarek’s valuable article with a detailed SWE study overview!
Related topics: