A rare Atlantic Niña event has developed in the tropics and is expected to impact hurricane activity in the coming weeks. But long-range predictions show that this anomaly will rapidly reverse into a warm Atlantic Niño event, which increases Hurricane activity and landfall potential for the United States and can indicate certain Winter patterns ahead.
We are also monitoring ocean anomalies in the tropical Pacific regions, which are currently at neutral levels but may surprise later in the year.
We will first look at the main areas of interest and what the latest analysis shows. Then we will look at the atmospheric impacts of the Atlantic Niña, and what the long-range predictions show for its hurricane influence and even some hints for Winter 2025/2026 over the United States and Canada.
OCEAN AND ATMOSPHERE
Ocean anomalies play an important role in the global weather system. The Atlantic temperature anomalies are known to have direct impacts on the hurricane season, while the influence of large Pacific anomalies like the La Niña and El Niño reaches far into the Winter and Spring seasons.
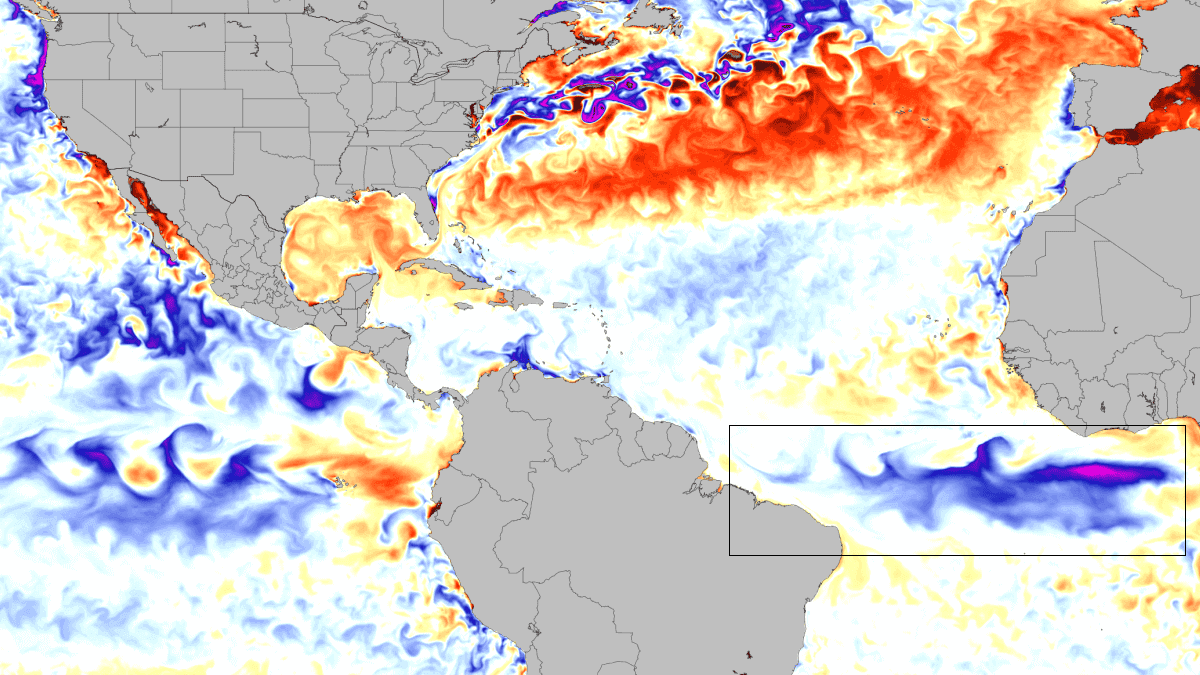
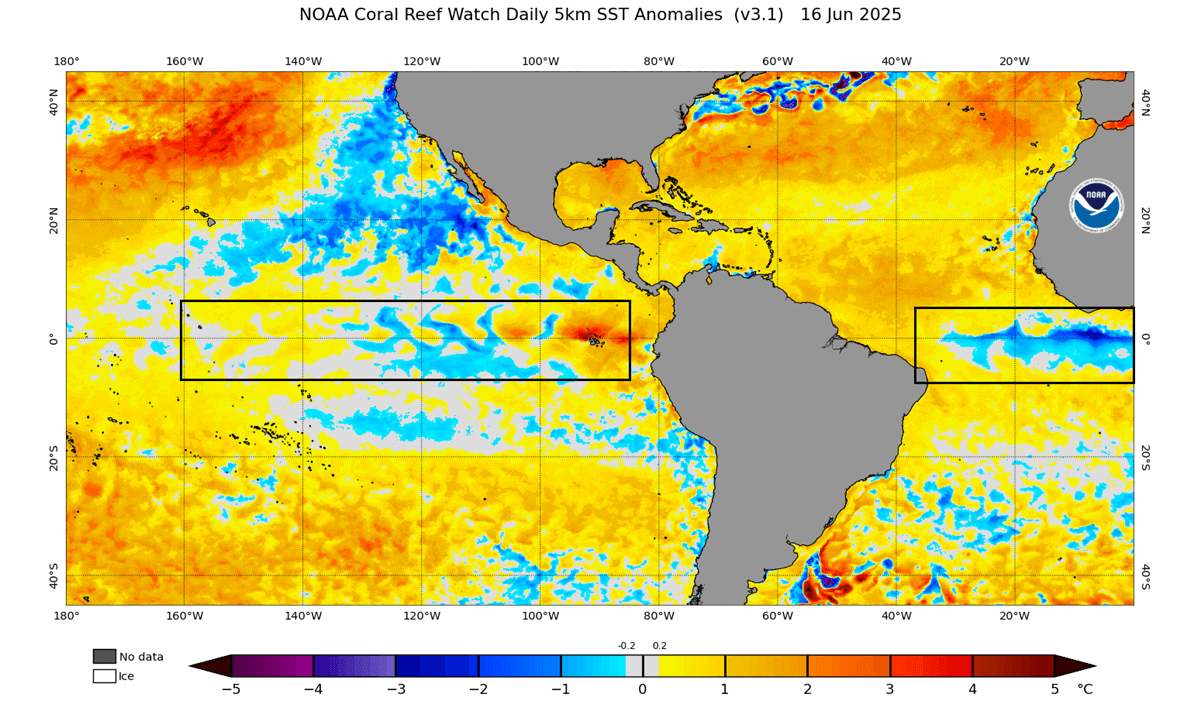
Below is the global ocean temperature map, where you can see some of the more important regions marked. In the Pacific, you can see the ENSO regions, where the well-known La Niña and El Niño events unfold. In the central Atlantic, you can see the area where their smaller and less common Atlantic Niño/Niña events can develop.
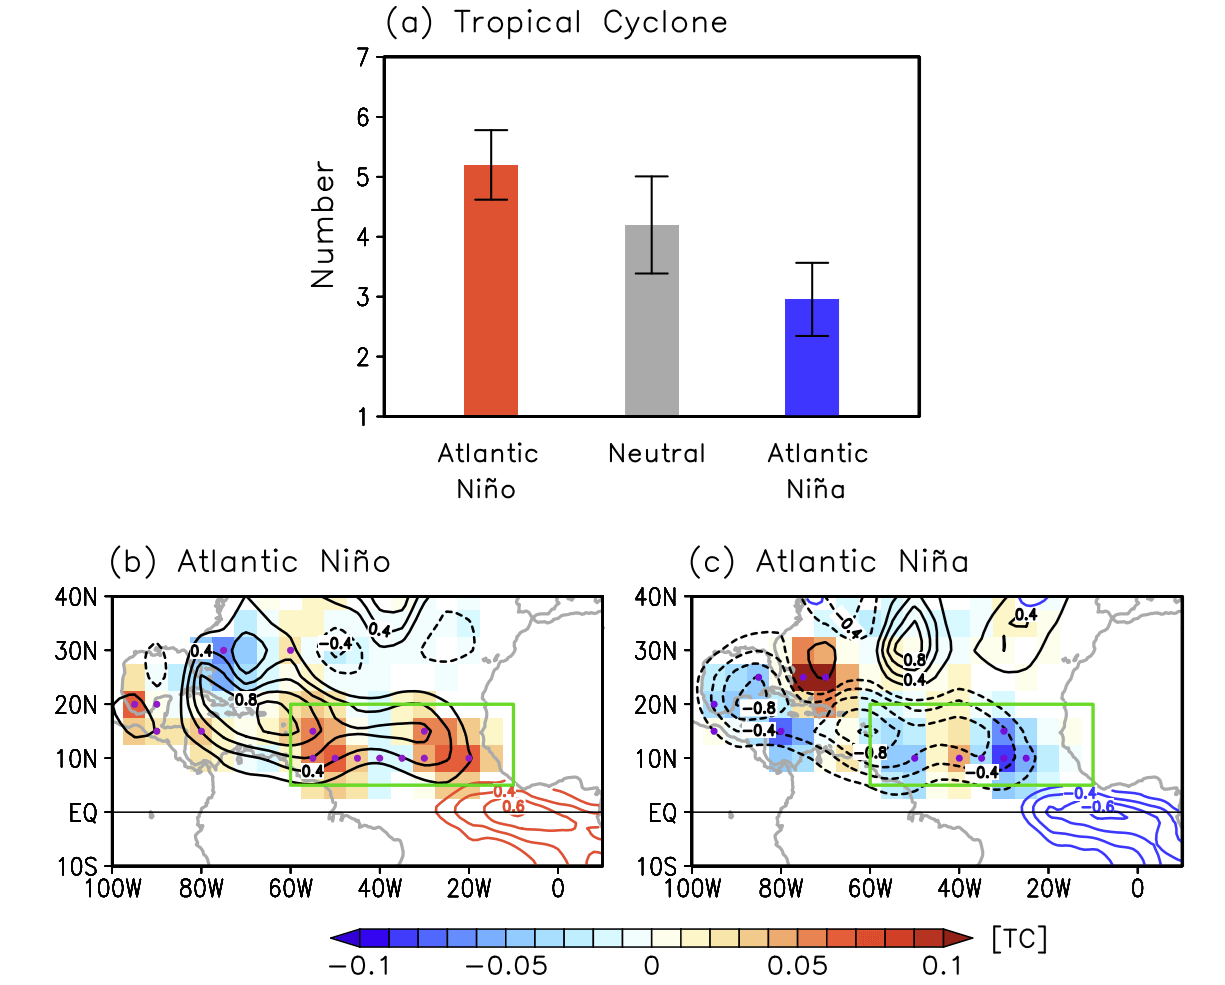
Looking first at the Atlantic area, you can see the main atmospheric influence it can have on the hurricane season and potential United States landfalls. In a warm Atlantic Niño, the number of tropical cyclones is almost two time higher as during a cold phase, and that includes landfalls in the United States.
But from the Pacific, the reach of the ENSO anomaly is much greater. It also impacts the hurricane season, but its effects are strongest during the cold weather season. The image below shows jet stream redirection from La Niña, which is the cold ENSO phase, and the resulting winter weather patterns developing over the United States and Canada.
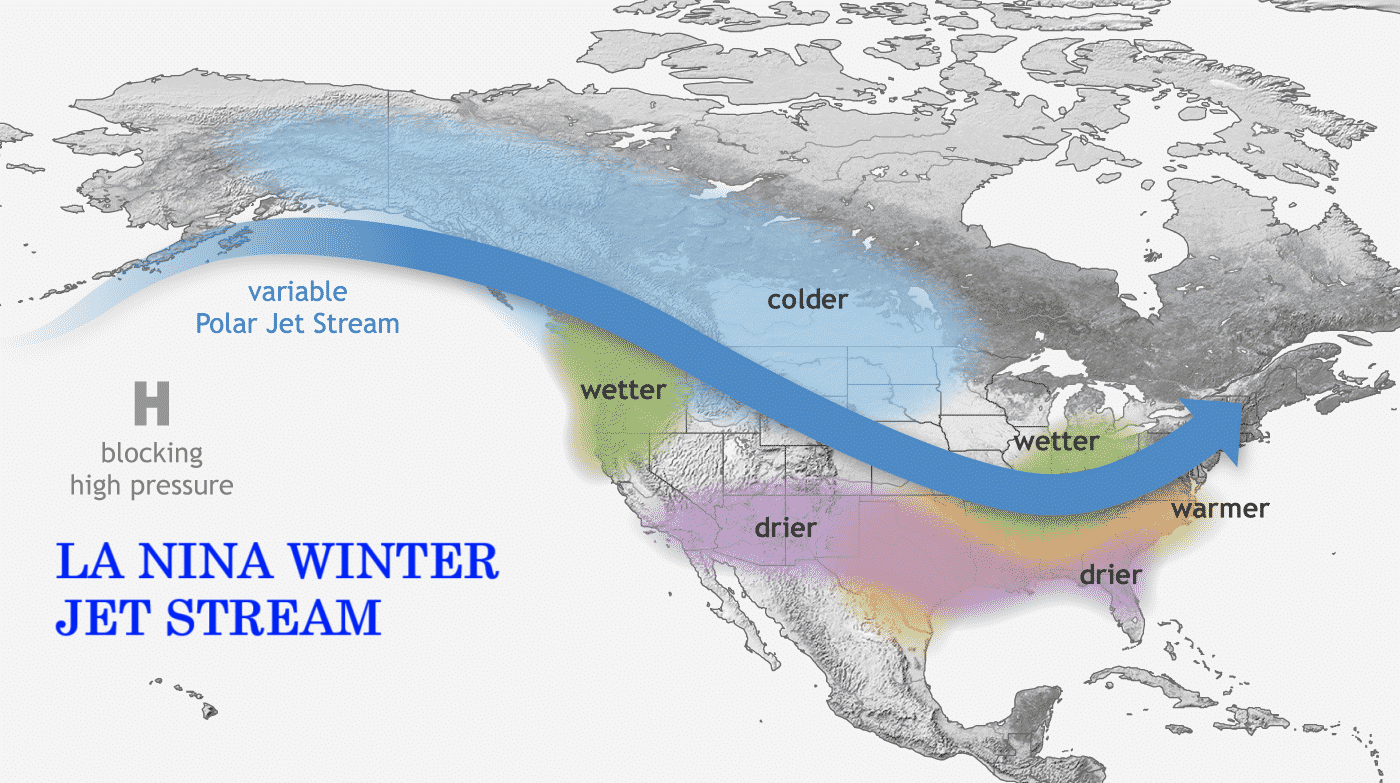
We showed you the La Niña impact on North America because a La Niña phase was active this past winter. It was a rather weak event, so that plays a big role in the type and strength of the weather outcomes that the La Niña can produce.
All these anomalies are driven by the trade winds. Trade winds are the prevailing easterly winds that circle the Earth near the equator. As they blow across the ocean, they typically cool the ocean’s surface by bringing the deeper, colder water to upwell to the ocean’s surface.
But weaker trade winds (or westerly winds) can mean the opposite, leaving calmer waters with less mixing, allowing the ocean temperatures to warm up. This means that the resulting ocean anomalies can be used as an “indicator”, of the state of the atmosphere, and what to expect from the global weather system.
A RARE EVENT UNFOLDS
Before going into the latest ocean development, we must know what an anomaly really is in weather. In simple terms, it means a deviation from the long-term average.
When it comes to oceans or weather, a temperature anomaly means that the temperature is either higher or lower than it should be for that time of year. That can have significance as it shows some large-scale changes in the global weather system.
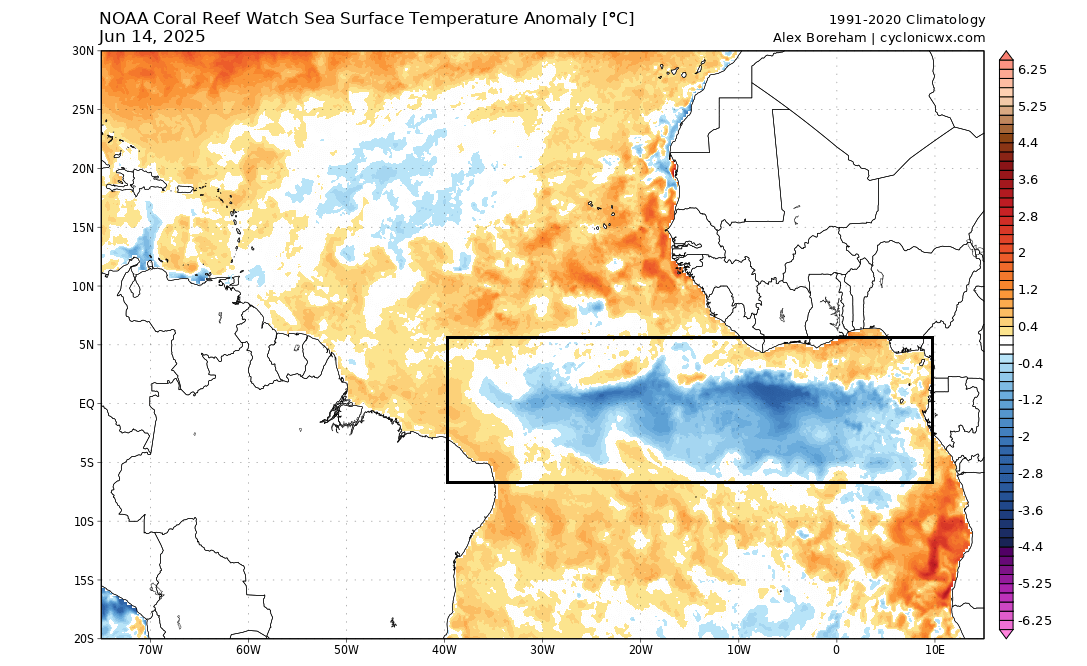
The image below is the latest ocean temperature anomaly analysis. It really nicely shows the cold Atlantic Niña event. Over the Pacific, we have the ENSO regions, which are currently in a neutral phase, after a La Niña has dissipated, at least for now.
This indicates unusually strong trade winds in the tropical Atlantic, which have implications for the hurricane season and atmospheric conditions. The ENSO regions in the Pacific currently have less of an impact, but a new phase is hinted at in the long-range predictions.
Below is a close-up analysis from the same NOAA CRW dataset, which is among the highest quality ocean analyses. It shows a broad area of cold anomalies, consistent with an Atlantic Niña event. The temperatures in that region are 2-3 degrees C lower than normal, due to pressure changes creating strong trade winds.
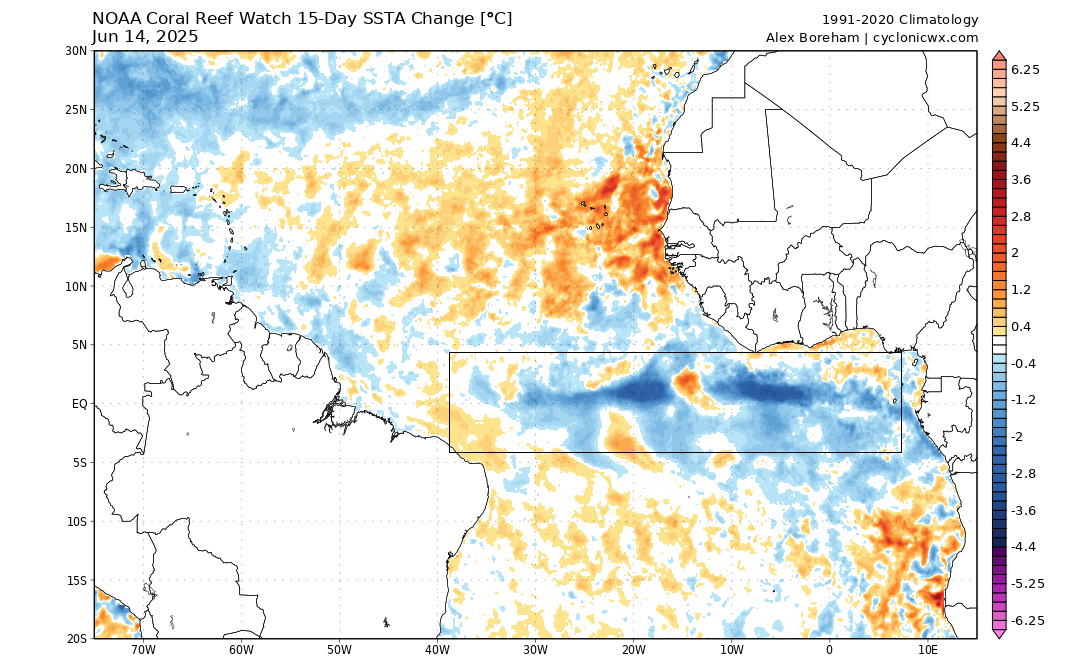
This can be better seen in the 15-day anomaly change map below. It shows the changes in ocean surface anomalies compared to two weeks ago. You can see that a broad and rapid cooling was underway as the easterly winds strengthened.
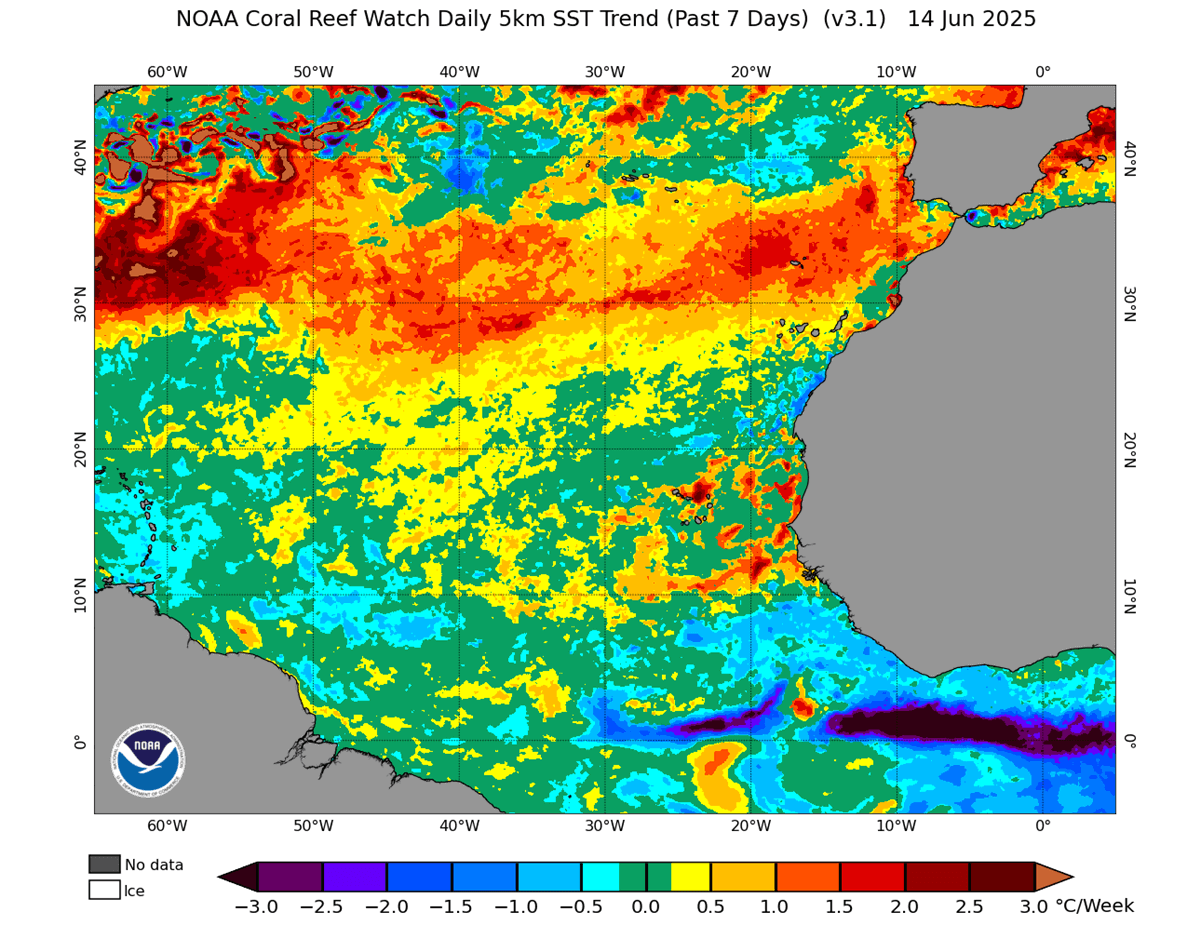
Below is another ocean analysis image, which shows the 7-day temperature trends. It reveals ocean surface temperature changes. You can see a broad area of cooling in the tropical Atlantic, with a strong cooling rate over a broader area.
You can best see this rapid process in the video below, made from NOAA CRW analysis. It shows the rapid cooling in the tropics and the emergence of the Atlantic Niña event in the past 30 days.
Such an event has an impact on the weather in the area, but it mainly indicates broader changes in the atmosphere. So for that reason, we can use the long-term data and produce some maps that show the typical atmospheric changes during these events.
THE ATMOSPHERIC AND WEATHER IMPACTS
When observing atmospheric changes, there is usually one indicator that tells us right away how the atmospheric circulation is behaving. It’s the so-called “Velocity Potential”. It basically tells us on a large scale, where the air is sinking and where it is rising in the atmosphere.
You can see a typical such circulation in the image below: Increased storms and rainfall on one side and reduced storms and drier weather on the other side. You can see on the top, the air is diverging (moving away) over the wet phase and converging (moving together) over the dry phase. This horizontal movement of air is referred to as the Velocity Potential in the tropics.
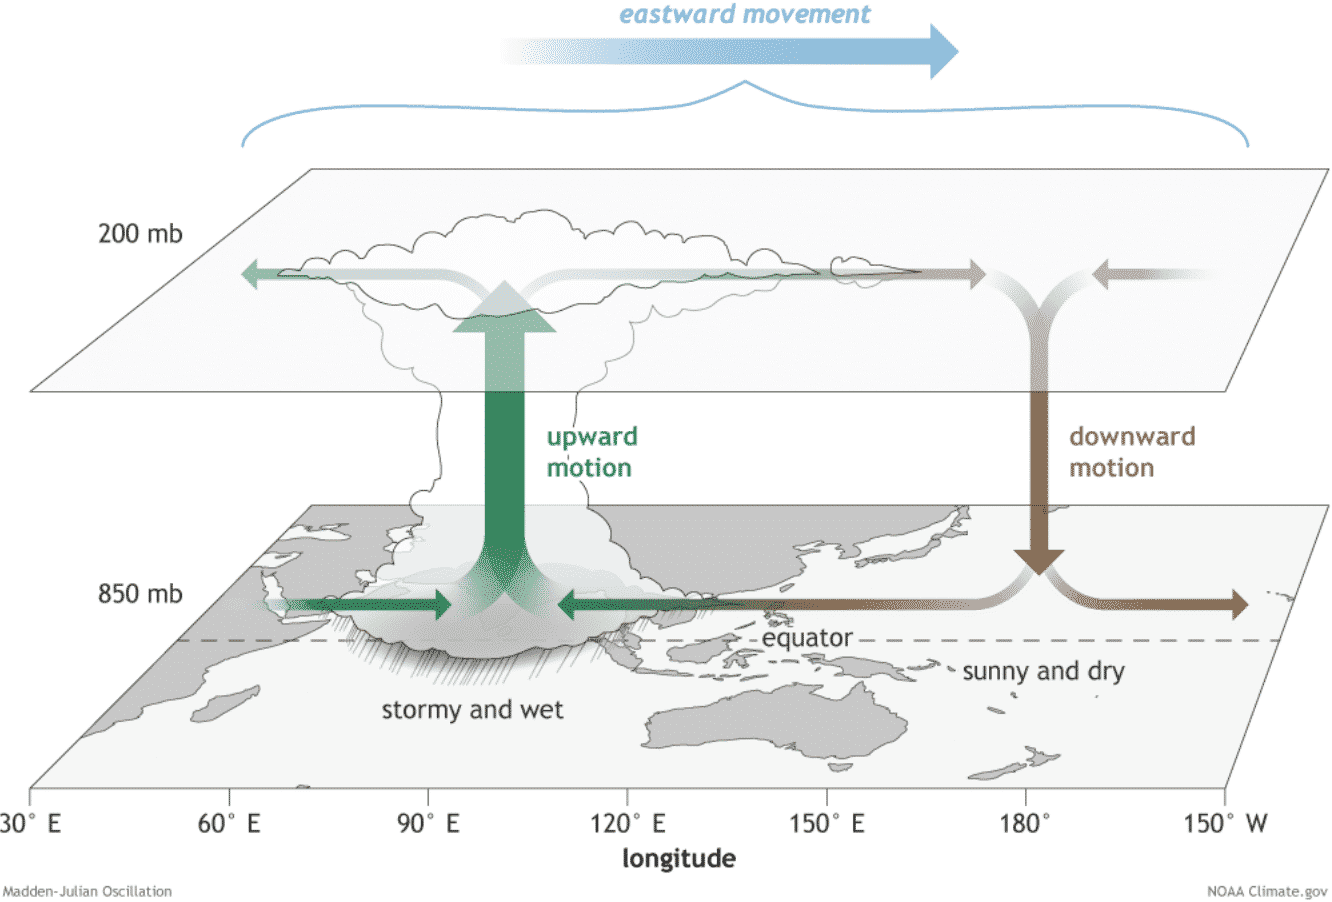
Sinking air means that the atmosphere is stable, so there are fewer clouds and tropical activity. This is usually found above large cold ocean anomalies. Rising motion means more clouds and rainfall, and increased tropical storm activity, and is typically associated with warmer ocean waters.
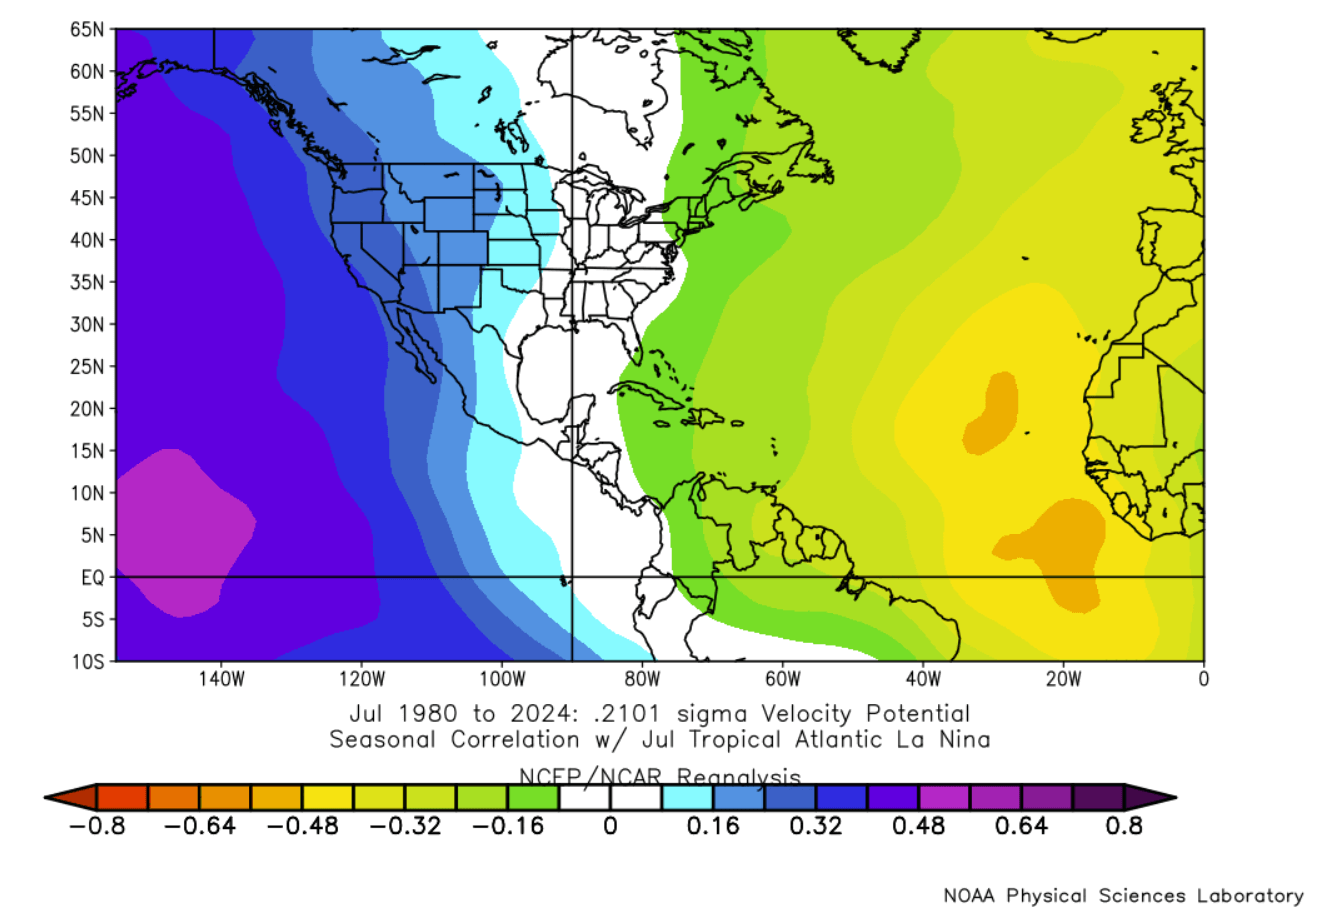
Below is the average upper-level velocity potential during a cold Atlantic Niña even in July. You can see a significant sinking of the air over the Atlantic, aided by the cold Niña event. In the Pacific, you can see plenty of rising motion, usually associated with the onset of a warm ENSO phase and more convection.
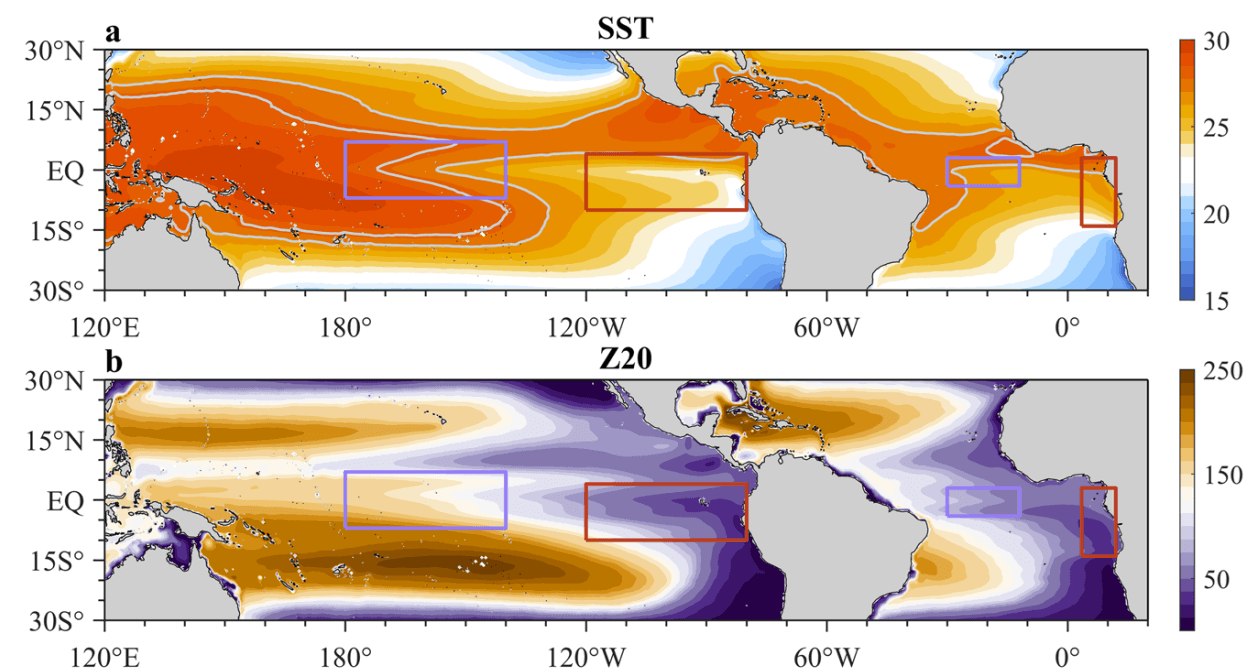
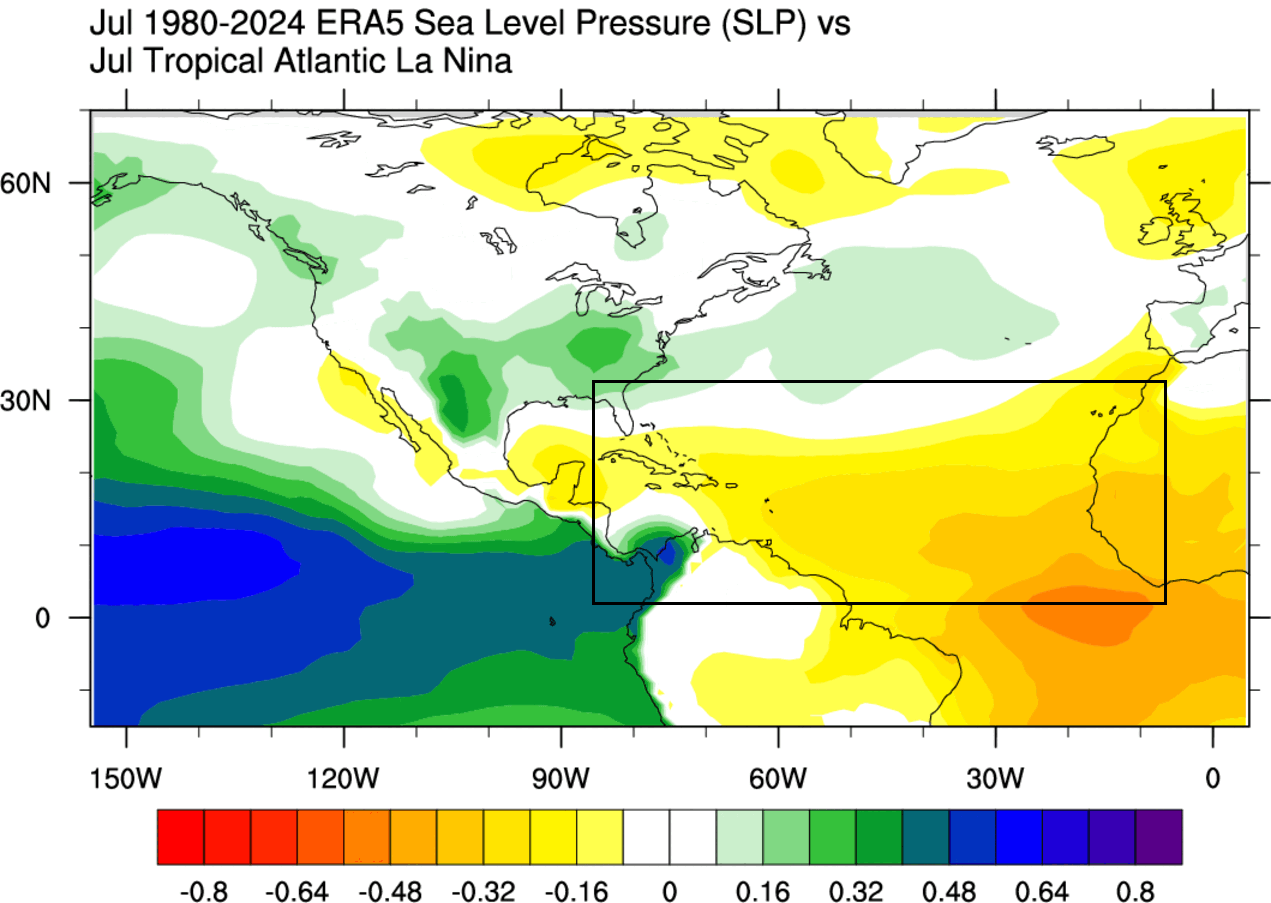
The main focus in these maps is usually on the so-called Main Development Region (MDR). It got its name from the Hurricane season, as seen marked in the next image below. It is where tropical systems form and strengthen during the Hurricane Season.
You can see the pressure trends during an active Atlantic Niña in July, based on over 4 decades of data. The higher pressure in the MDR indicates less tropical storm activity and a lower number of potential landfalling hurricanes in the United States.
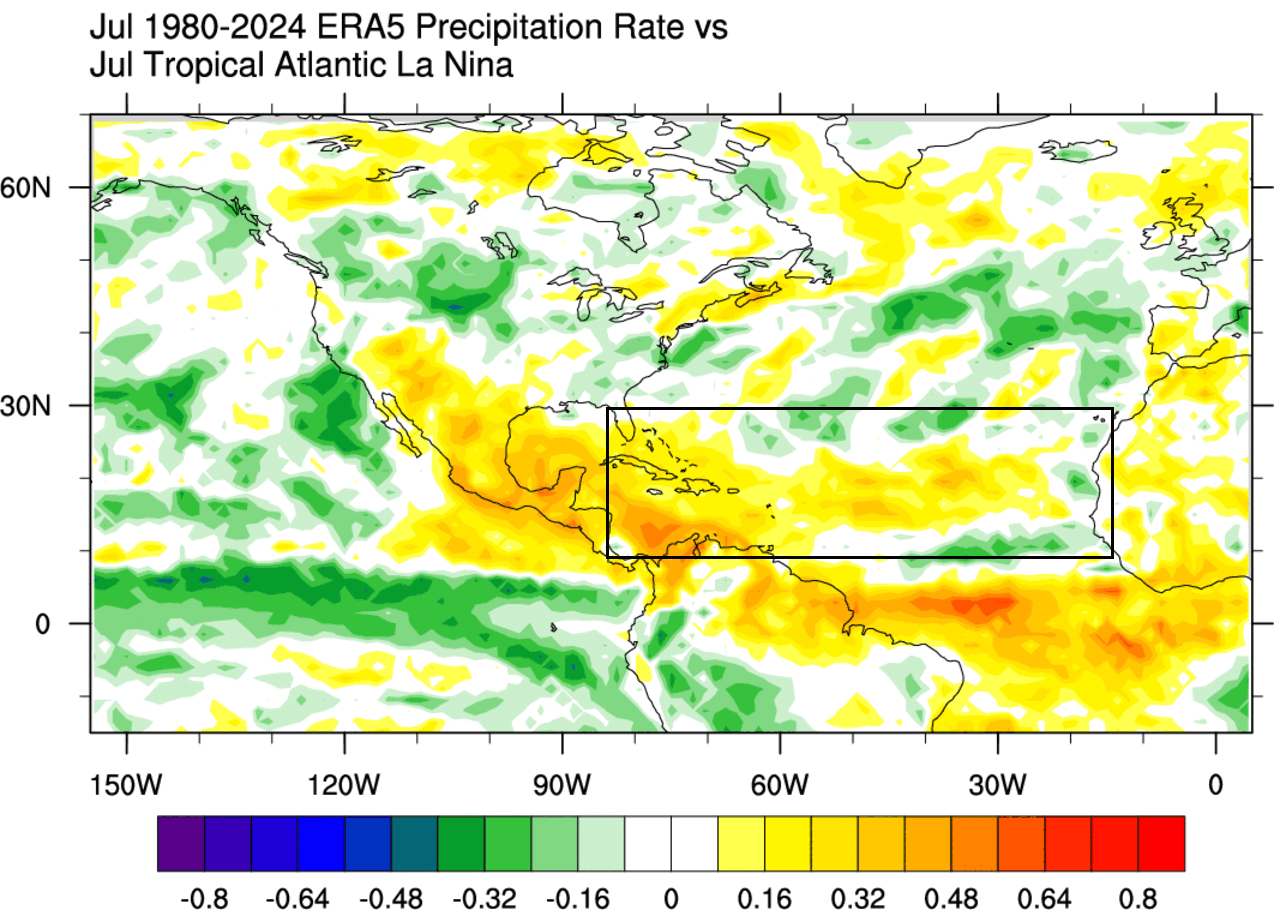
Looking at the precipitation trends, you can see a very similar scenario. There is overall less rainfall in the main development region, which also indicates a reduced number of tropical systems and the reduced number of landfalling systems in the United States.
This is just a general analysis based on the available data. We can also look at the latest forecasts and see what they show for July in terms of tropical activity and atmospheric patterns.
JULY ATLANTIC ACTIVITY FORECAST
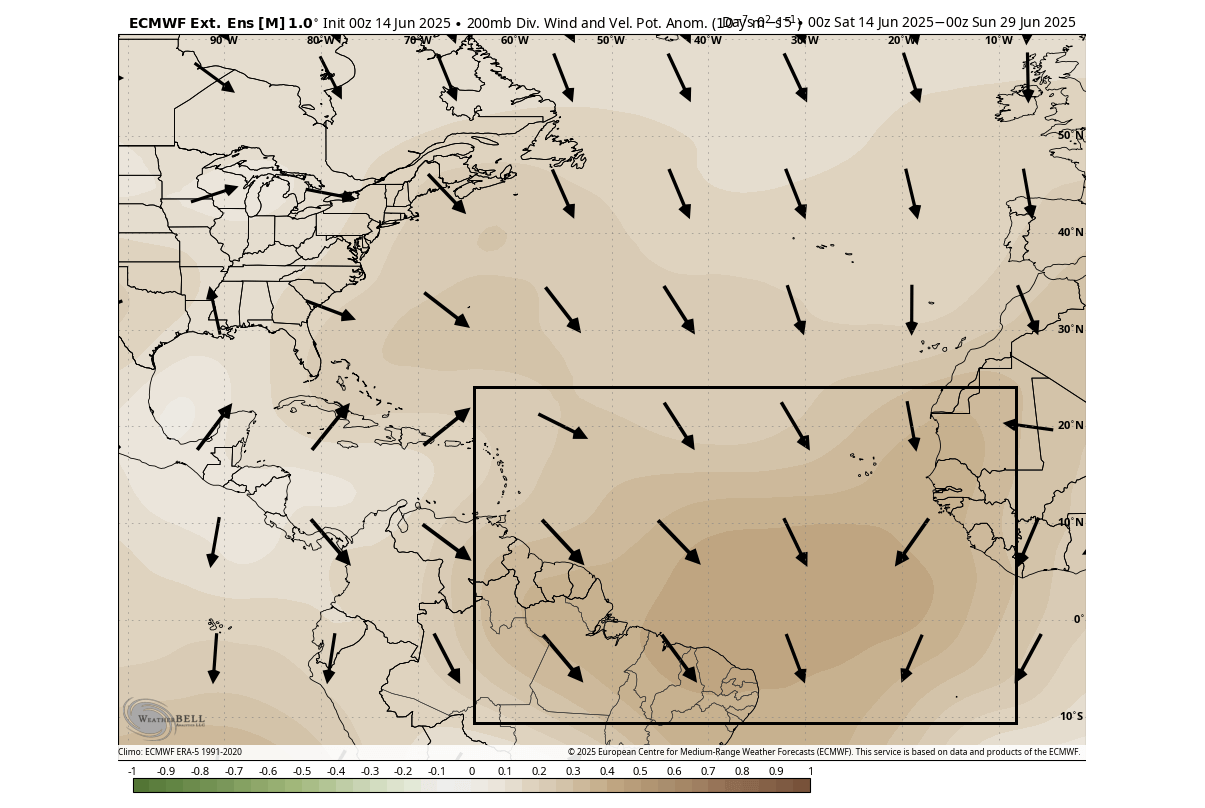
Below is a 30-day forecast for July 2025, from the weekly ECMWF model. It shows the velocity potential, and if you recall from the previous section, brown colors indicate sinking air in the atmosphere. This means that the atmosphere is suppressing convection and tropical systems in the MDR. It is exactly the same as you would expect during an Atlantic Niña.
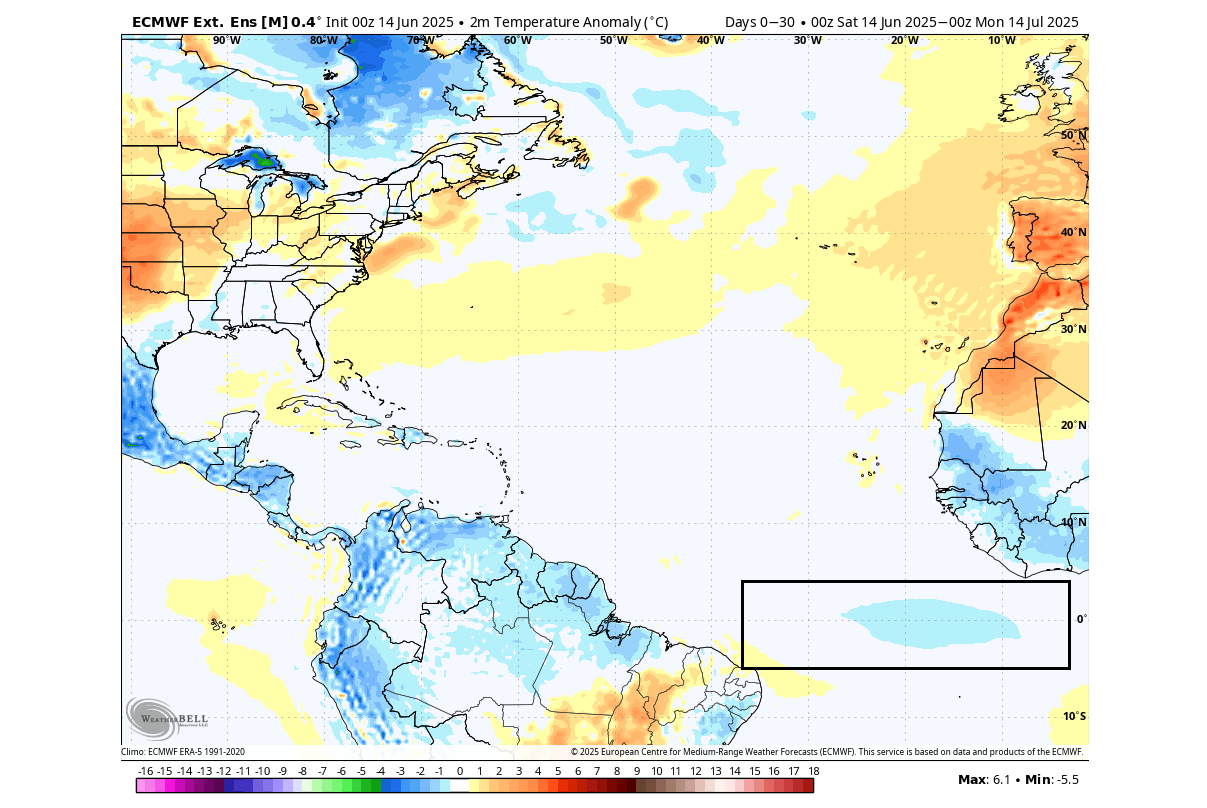
Looking at the temperature forecast for July 2025, you can see the cold anomaly in the tropical Atlantic. But as this is the surface air temperature, it does not properly reflect the ocean anomalies. But it does show that the Niña will be active at least in July. You can also see a heat dome forecast over the central United States.
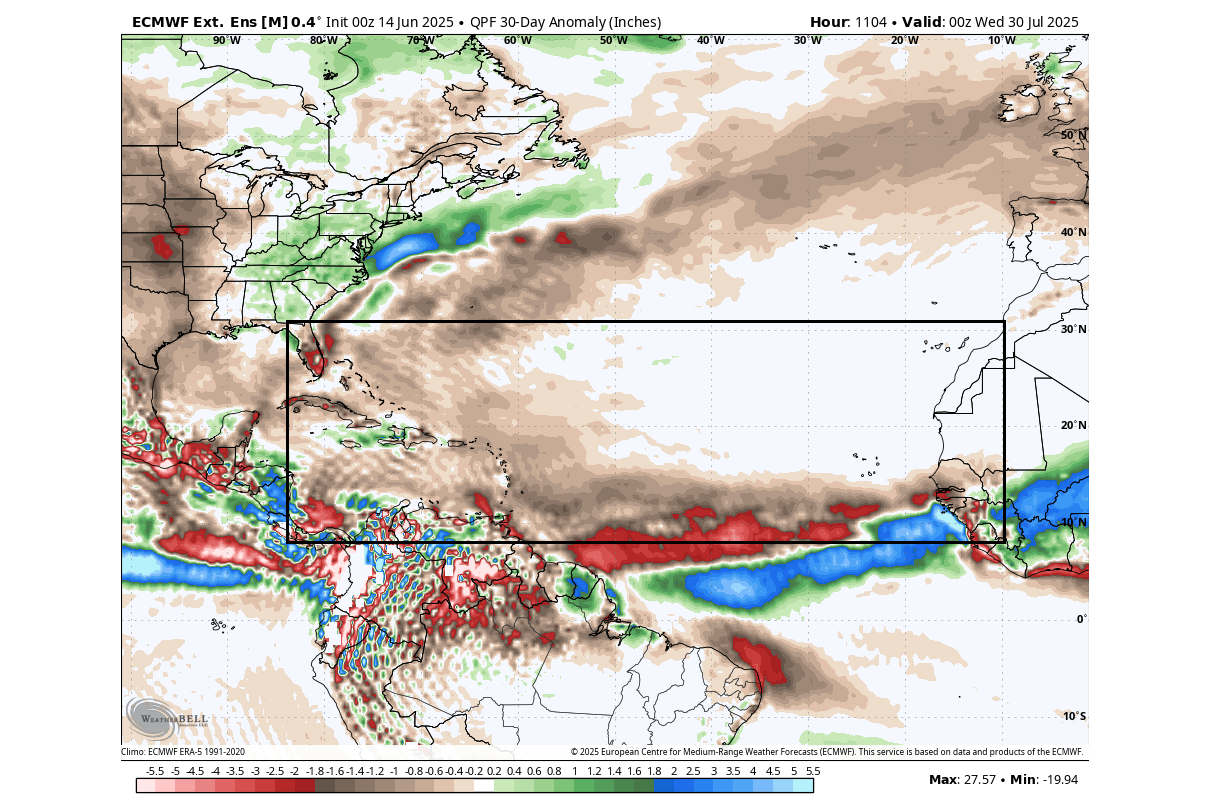
The next image shows the rainfall forecast for July, and is perhaps the most telling indicator of all. You can see a broad area of less rainfall than normal over the whole main development region. This indicates suppressed convection and tropical activity, which greatly reduces hurricane potential, as expected during Atlantic Niña events.
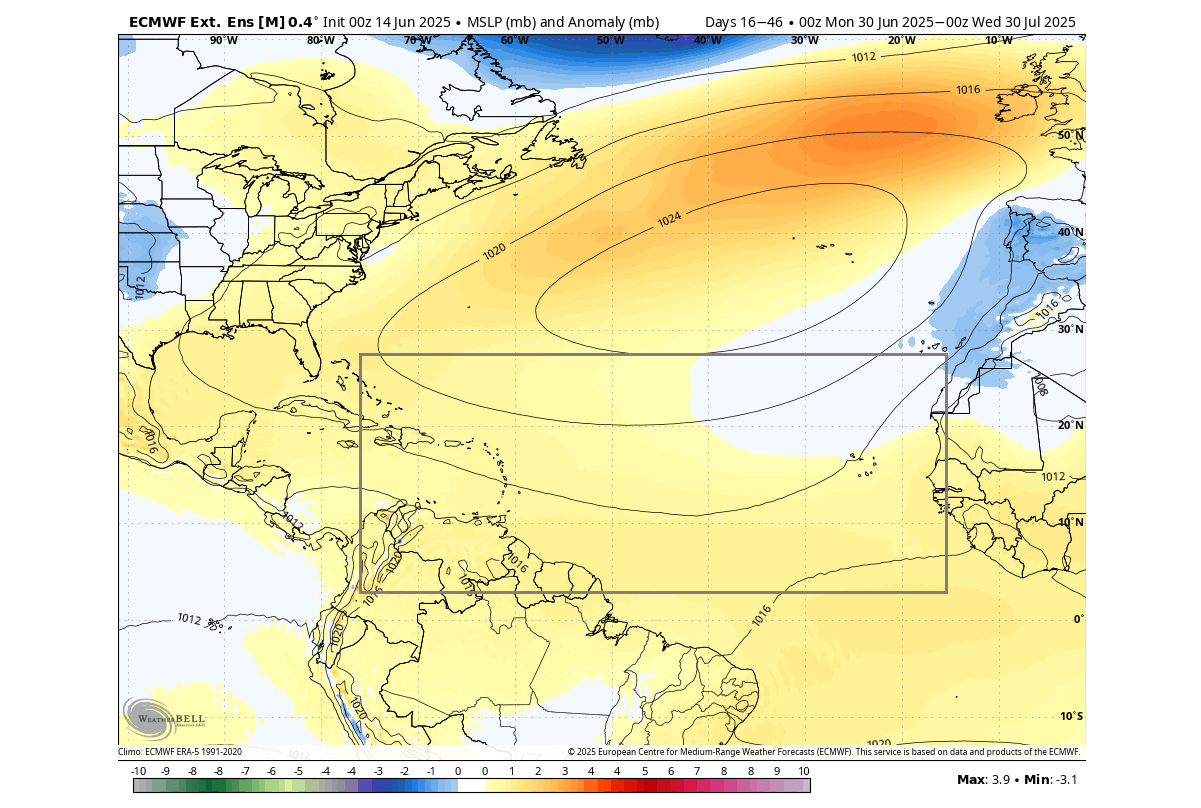
Below, we also have the surface pressure anomaly forecast for July, and you can see mostly above-normal pressure over the tropics and the MDR area. This area usually shows lower pressure in an active season, but this July looks to remain quiet in terms of potential hurricanes close to the United States.
We know that these ocean anomalies and pressure changes are all connected with the global trade winds. But what does the trade wind forecast tell us for the main part of the hurricane season?
A LARGE-SCALE SHIFT IN THE FORECAST
Below is the trade wind forecast for the next two weeks. Blue colors indicate stronger easterly trade winds that promote ocean cooling. Red colors indicate weak winds and potential ocean warming. The image is from weathermodels.com, using a commercial license.
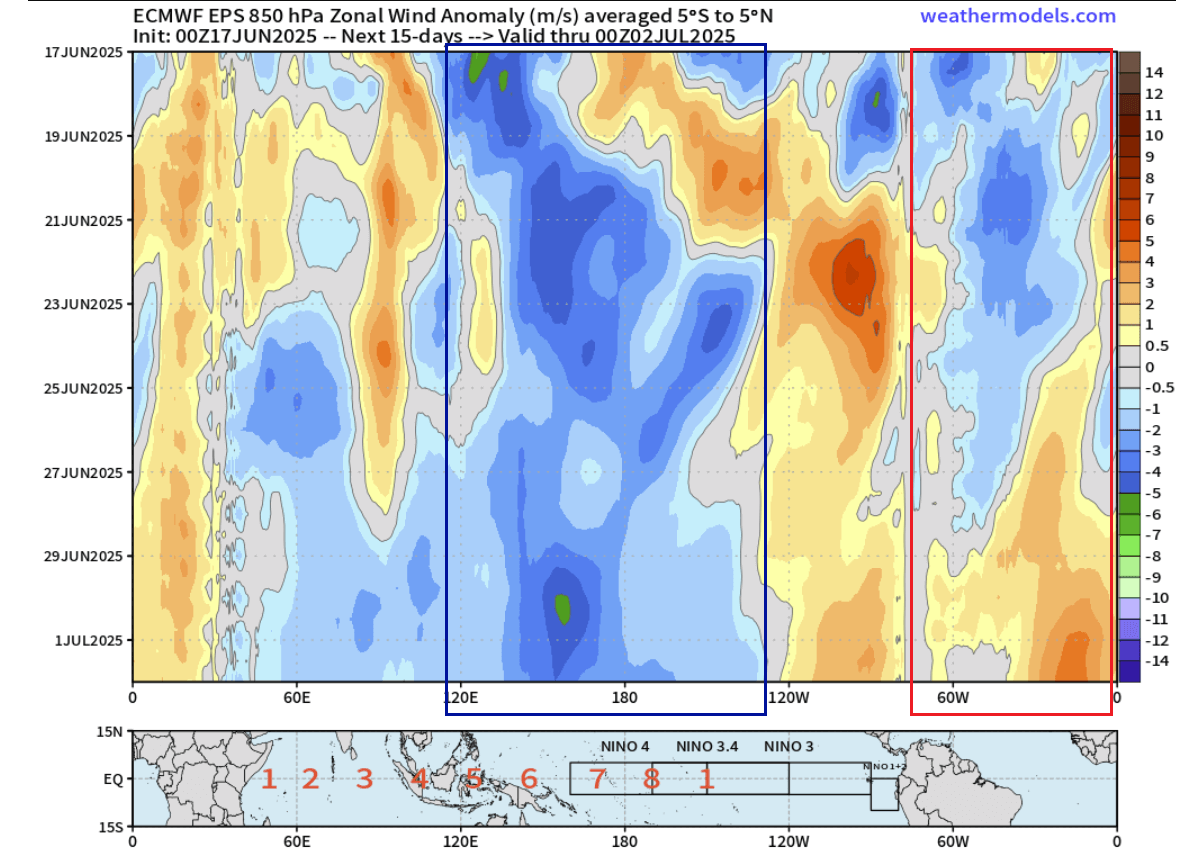
You can see that in the Atlantic, the cooling will continue till the end of June. But a rapid shift in trade winds is forecast for July, which can create a flip in ocean anomalies and bring an Atlantic Niño event just in time for the peak of the hurricane season.
In the Pacific, you can see increased cooling potential over the western ENSO regions, which can help to bring a weak La Niña back for the 2025/2026 season.
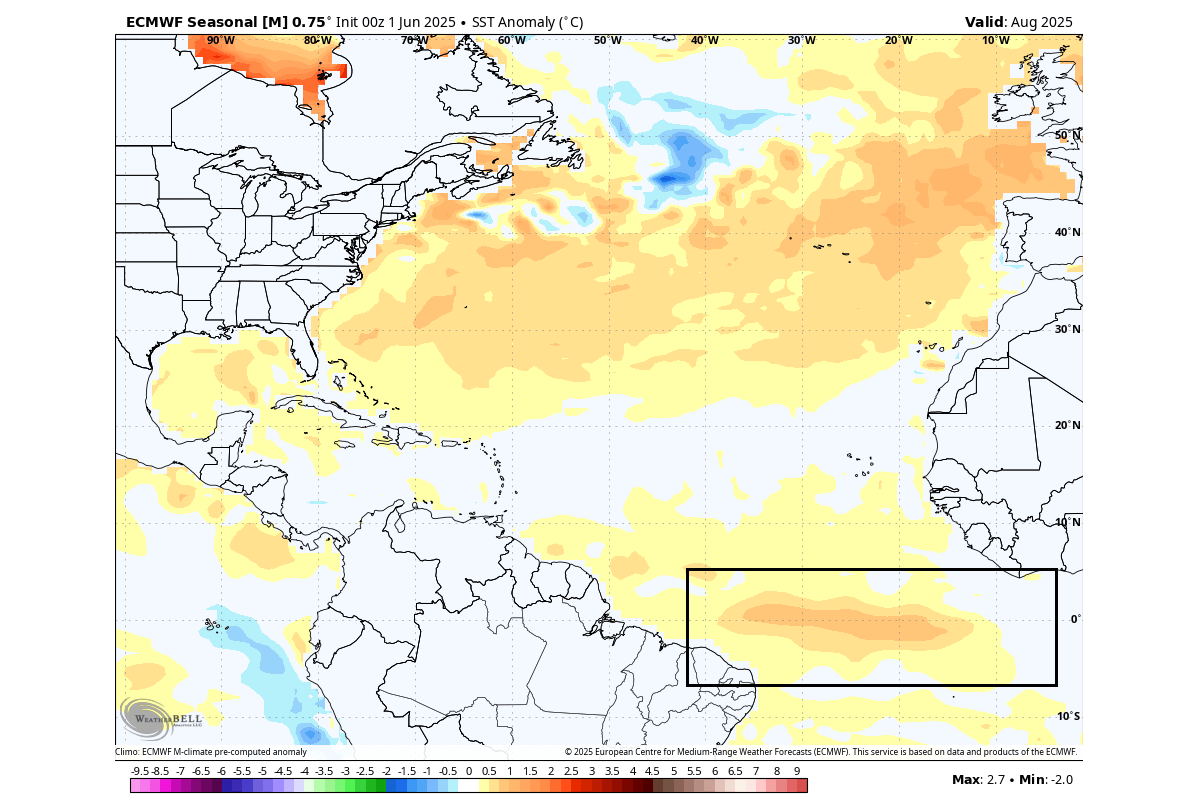
You can see the ocean temperature anomaly forecast for August below, which is usually a more active month of the hurricane season. The long-range forecast indicates a significant reversal from current anomalies, with a full-scale Atlantic Niño in the forecast.
Based on the available data, it is well known that an Atlantic Niño event brings increased convection in the main development region and lower pressure. This also increases the number of tropical systems and the potential for landfall in the United States. Image is from a study by Kim, D., Lee, SK., Lopez, H. et al.
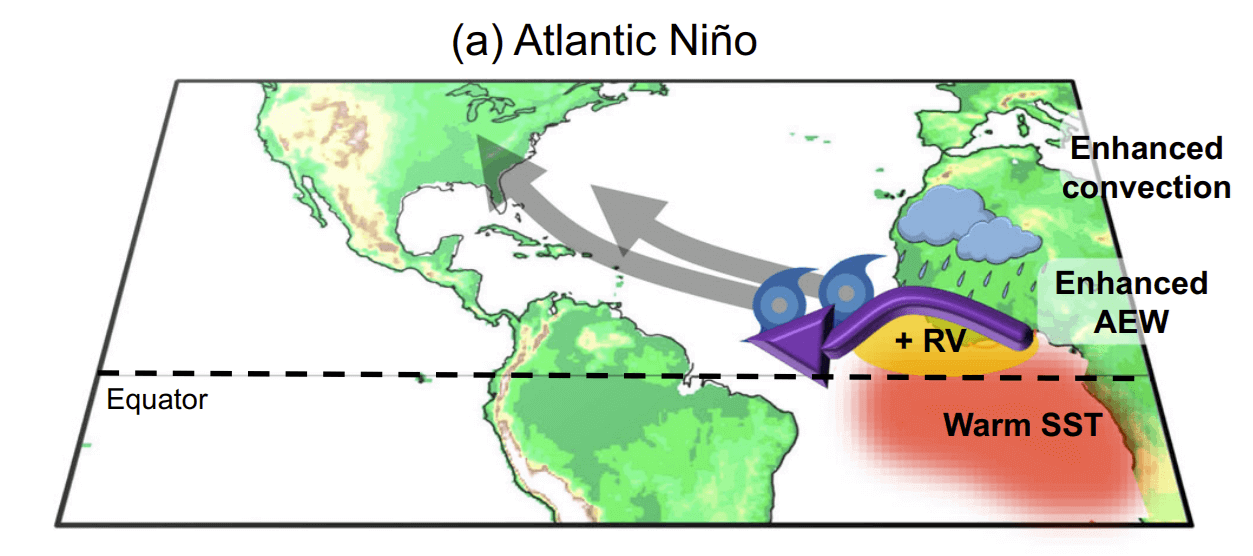
The same study also talks about the increased activity during an Atlantic Niño: “…Atlantic Niño enhances African easterly wave activity and low-level cyclonic vorticity… such conditions increase the likelihood of powerful hurricanes developing in the deep tropics near the Cape Verde islands, elevating the risk of major hurricanes impacting the Caribbean islands and the U.S.”
Looking at the actual precipitation forecast for the peak of the Hurricane season, we can see a rather dry area forecast. This would indicate a lower number of total tropical systems. But there is one important thing to consider here, and that is the fact that only one system is enough to bring a serious landfall into the United States.
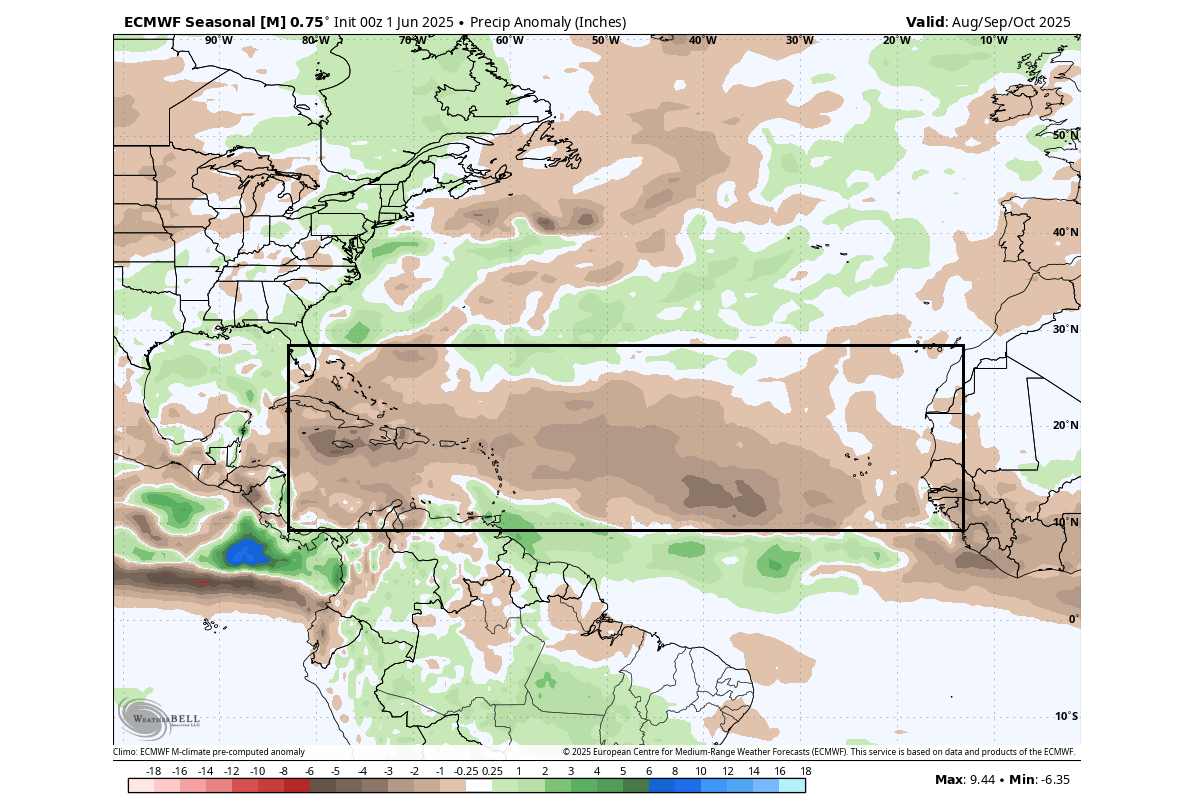
So even if there is a smaller number of total systems, the Atlantic Niño can create favorable conditions in the atmosphere for those fewer systems to become stronger and last longer. That in itself increases the likelihood of a major hurricane making landfall in the United States, and only one system is enough.
As all these anomalies have a significant impact on the global weather system, we must also consider the seasonal connections with the 2025/2026 winter season.
WINTER 2025/2026 IMPLICATIONS
We decided to look at the data over the last four decades to find any connection between a summer Atlantic Niño and the following winter weather. We can see that a summer Atlantic Niño usually indicates a low-pressure system over Canada and the northern United States the following winter. This brings an amplified jet stream across the United States.
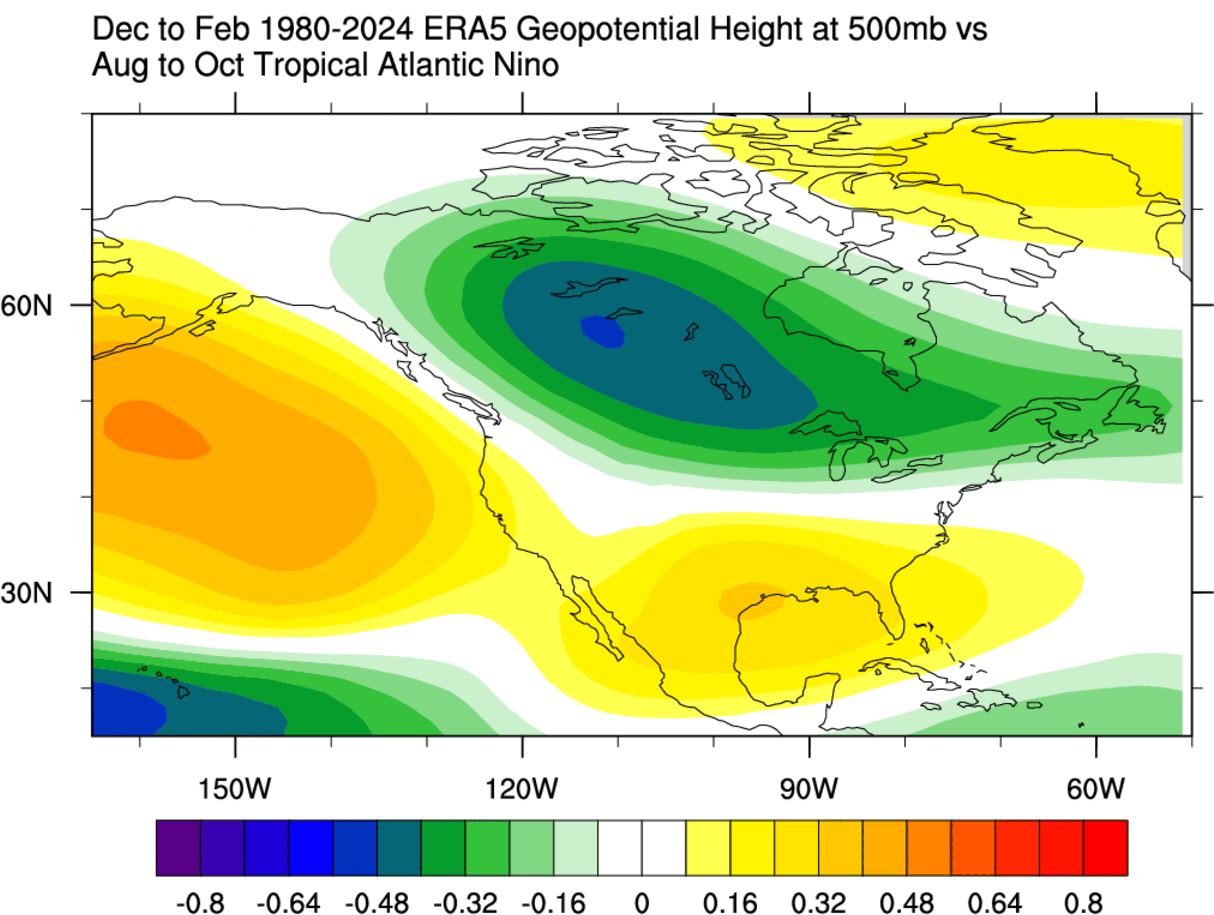
But of course, this does not mean that it’s directly a result of the Atlantic Niño, but it is actually more as an “indicator” of the atmospheric conditions. So the same global conditions that create an Atlantic Niño can also correspond to a specific winter pattern.
Below is the temperature pattern for the winters following an Atlantic Niño condition. You can see a colder-than-normal air mass pooling over western Canada, reaching into the northern half of the United States. This has a very similar look to a La Niña pattern we showed at the start of the Article.
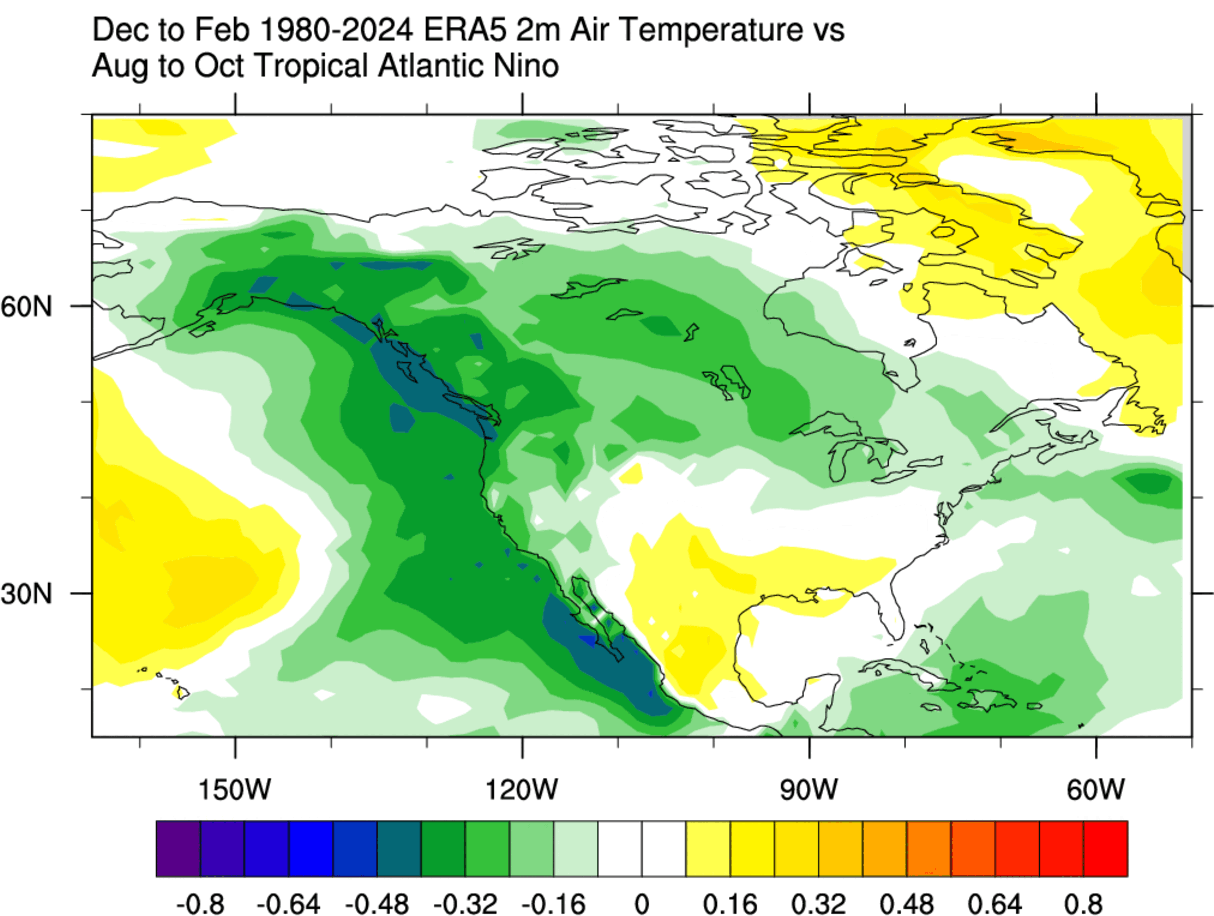
This suggests that an Atlantic Niño is also associated with similar atmospheric conditions that can start the development of a La Niña event in the Pacific Ocean. If a weak La Niña is to develop, it can also impact the snowfall patterns in a specific way.
Peak snowfall is usually across the higher elevations of the Pacific Northwest. You can see that western Canada, as well as the north-central United States, including the Dakotas, Nebraska, and Minnesota, experienced a snowier winter during weak La Niña years. There is more snowfall across the northeastern United States, but less over the southeastern states.
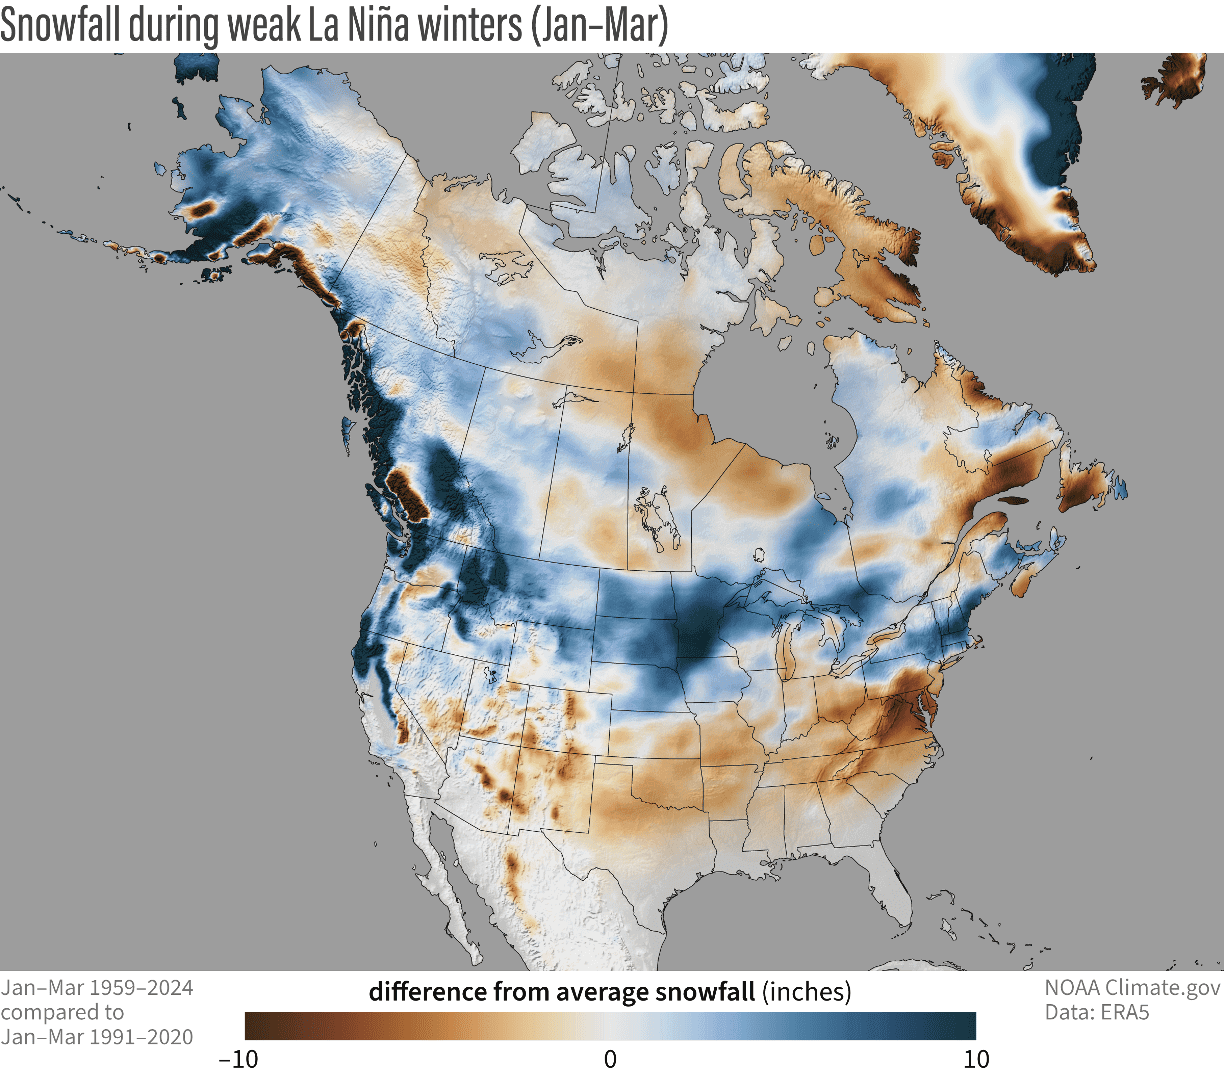
The southern United States usually experiences less snowfall in such winters because the jet stream is more confined to the northern United States and southern Canada.
We will be monitoring this development closely over the coming weeks and months, as it plays a crucial role in shaping the Winter 2025/2026 weather patterns across the United States, Canada, and the rest of the Northern Hemisphere.
We will keep you updated on global weather development and long-range outlooks, so bookmark our page. Also, if you have seen this article in the Google App (Discover) feed, click the like (♥) button to see more of our forecasts and our latest articles on weather and nature in general.
Don’t miss:
Latest Summer 2025 long-range predictions for the United States and Canada