The Polar Vortex was on a wild weather ride since last Autumn. Having a powerful impact on winter and spring weather, it now finally starts to breaks down. It will affect the weather patterns for the last time, before going to sleep until September.
Before explaining what is coming for the Polar Vortex and our weather, we will quickly learn what exactly is the Polar Vortex. We tried to explain this in most of our winter articles, as knowledge is essential and powerful, so why not learn something new very quickly along the way.
OVER THE NORTH POLE
All of the clouds (and the weather that we feel) are found in the lowest layer of the atmosphere called the troposphere. It reaches up to around 8 km (5 miles) altitude over the polar regions and up to around 14-16 km (9-10 miles) over the tropics.
Above it, there is a much deeper layer called the stratosphere. It is a very dry layer, around 30km thick. This is where we can find the famous ozone layer. You can see the layers of the atmosphere on the image below, with the troposphere on the bottom and the Stratosphere with the ozone layer above it.
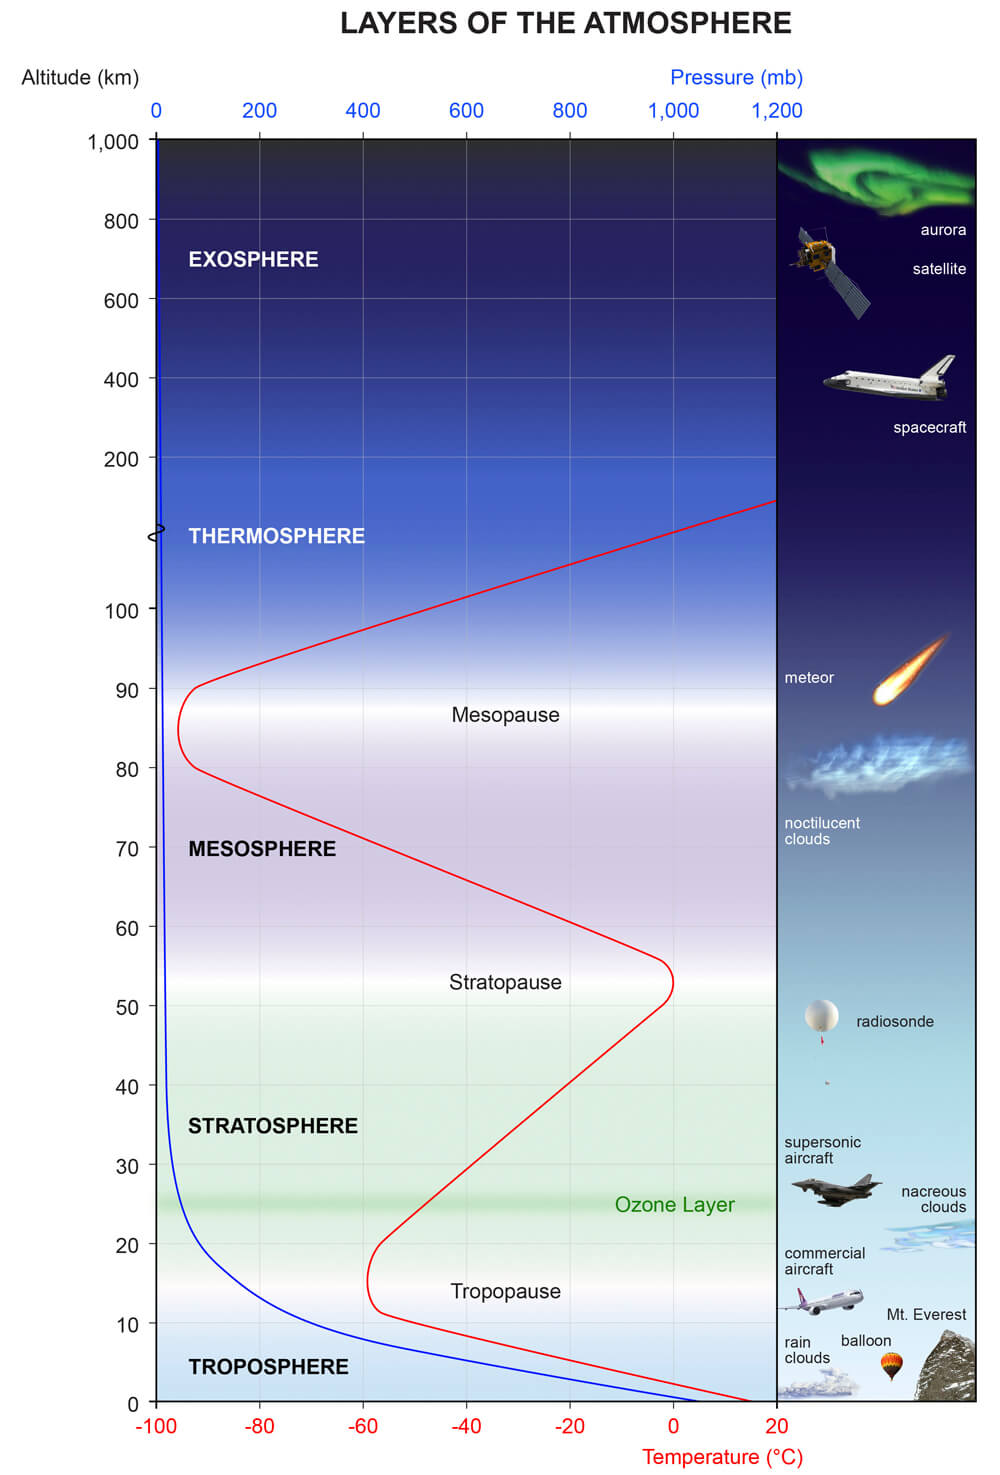
When you hear people talk about the polar vortex and its influence, 90% of the time they mean the higher altitude stratospheric part. While the stratospheric polar vortex is spinning high above our weather (but strongly connected), it plays a major role in the developing winter weather patterns across the entire Northern Hemisphere.
Every year as we head into autumn, the north pole starts to cool down. But the atmosphere further south is still relatively warm as it continues to receive energy from the Sun. This temperature difference causes the pressure to start dropping over the North Pole.
As the temperature and pressure drop over the pole and the temperature difference towards the south increases, a large low-pressure (cyclonic) area will start to intensify across the Northern Hemisphere. The same process happens in the stratosphere, creating a large anti-clockwise spinning area.
The image below shows a typical example of the Polar Vortex at around 46km altitude (1mb level) near the top of the stratosphere.
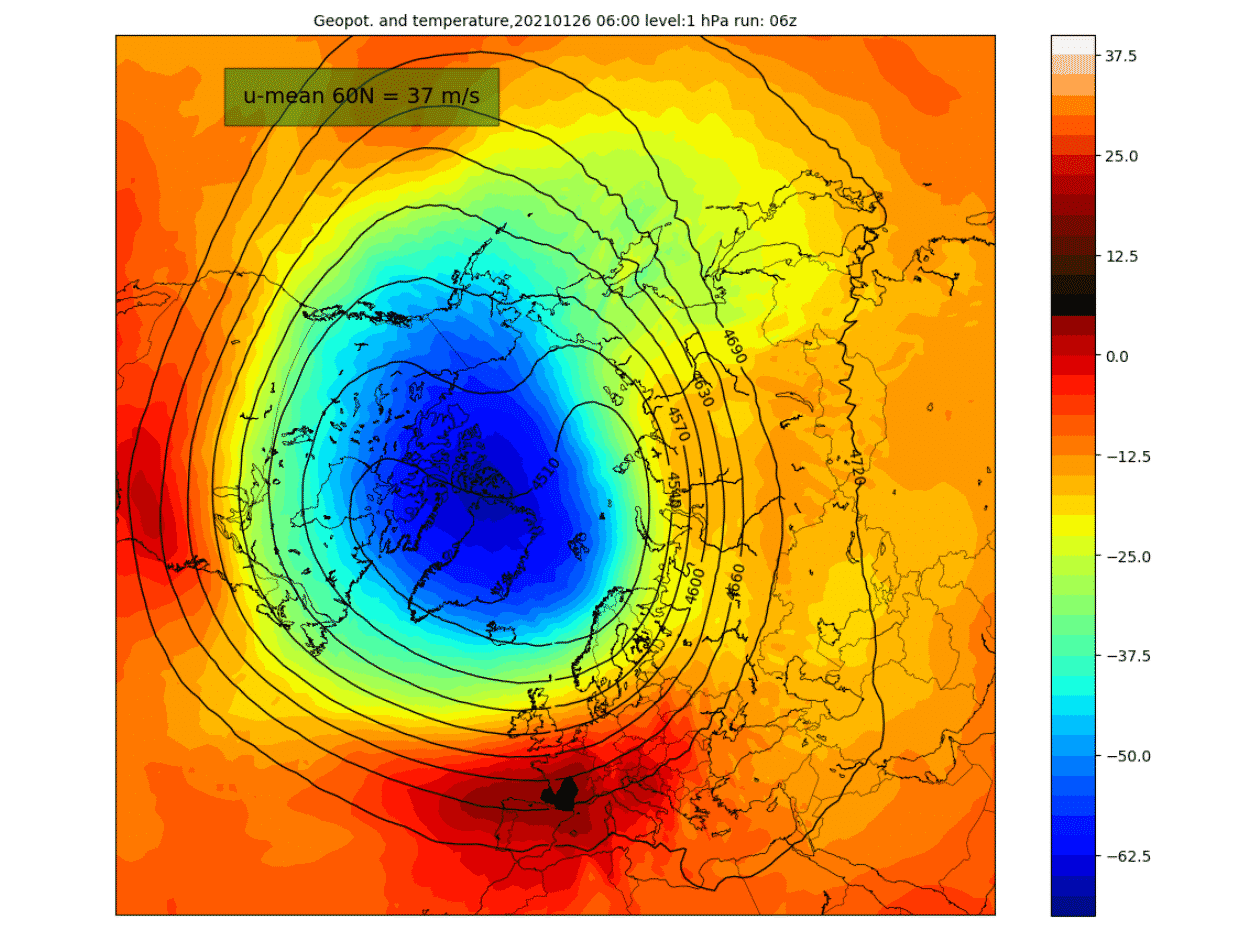
You can see that in essence, it’s like a very large cyclone, covering the whole north pole down to the mid-latitudes. It is strongly present at all levels, from the ground up, but in different shapes.
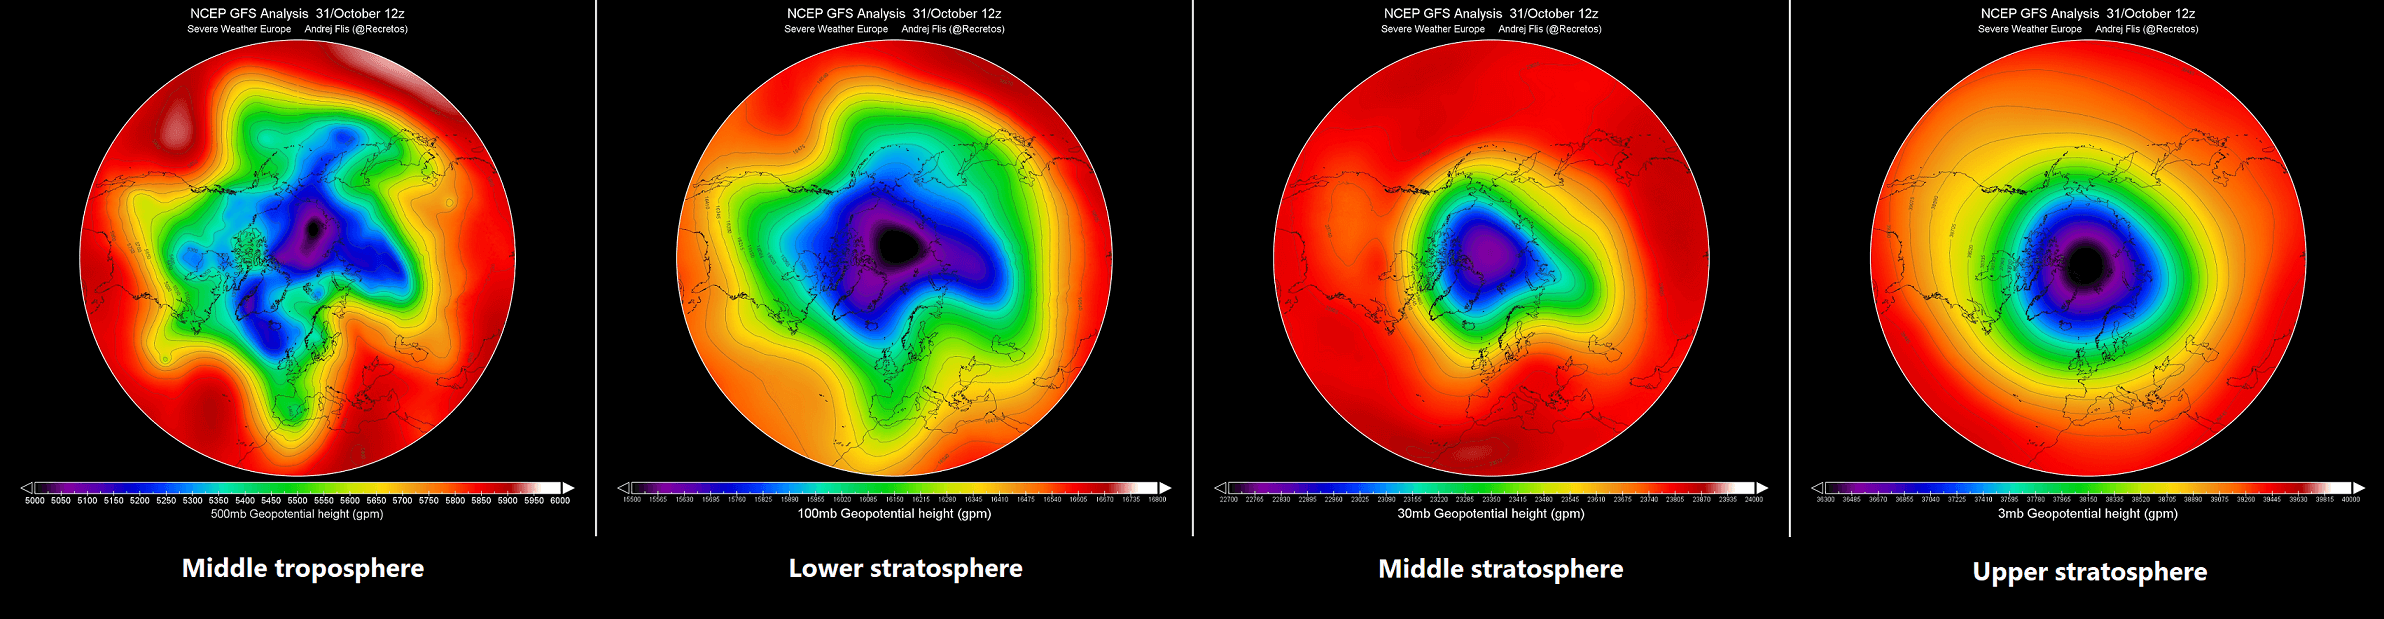
Below we have an image that shows the polar vortex at different altitudes. The closer to the ground we get (left side), the more deformed it gets, due to the complex terrain and the many weather fronts and systems deforming it.
For an even better idea, we produced a high-resolution video for you below, which very nicely shows the Polar Vortex spinning over the Northern Hemisphere at around 30km altitude. This is in the stratospheric layer.
Video shows December 2020 to January 2021 period, made from NASA GEOS-5 data. We used the 10mb level (30km altitude) potential vorticity parameter, which (simplified) means that it shows the energy of the polar vortex. Notice how the Polar Vortex covers a large part of the Northern Hemisphere, and you can also see the stratospheric warming event, as it deformed and attacked the Polar Vortex.
POLAR VORTEX COLLAPSE
Usually, we look at the polar vortex in the stratosphere at the 10mb level. That is around 28-32km (17-20 miles) altitude. This altitude is considered to be in the middle stratosphere and serves as a good representation of the general dynamics of the polar vortex.
The strength of the polar vortex is usually measured by the power of the winds inside it. This is done is by measuring the zonal (west to east moving) wind speeds around the polar circle (60°N latitude).
Below we have an analysis from the NASA monitoring system, where you can see a very interesting progression in the 2020/2021 weather seasons.
In early December, the polar vortex was at a strong level, reaching over 40m/s (90mph) zonal wind speeds. Towards mid-month, and especially towards late December, the polar vortex began to weaken. We can see the zonal wind became negative in early January, due to the breakdown of the polar vortex.

The next images below show the temperature at the 10mb level, which is in the middle stratosphere at around 30km altitude. Here, the polar vortex is much more uniform in shape as there is less influence from the terrain and the weather fronts at this high altitude.
In late December, a warming sequence began in the stratosphere, expanding from Europe over into central Asia. It was starting to engulf the outside layers of the polar vortex. The cold core of the polar vortex was still rather intact at this point, holding temperatures colder than -80°C in the center over Greenland.

Just two days later, the warming wave reached a local peak over Siberia, with maximum temperatures in the wave reaching up to +5°C or higher. In normal conditions, the temperatures here are over 30-40°C lower, so this was a significant warming wave.

On January 5th, the preliminary date of the Sudden Stratospheric Warming event was marked, as the winds around the polar circle have reversed.
The stratospheric warming wave has crawled over the entire North Pole in the stratosphere, effectively splitting the cold-core of the polar vortex into two parts.
One part of the broken polar vortex has moved over North America and one over the European sector. At this point, this does not have much to do directly with the winter weather on the surface, as this is at a 30km altitude. But as you will see, our weather got its fair share from this weather disruption.

Taking a look at the NASA temperature analysis for the polar stratosphere, we can see the large temperature spike at the 10mb (30km) level. This shows a strong warming event, with temperatures then staying above normal, before rapidly cooling in early February, as the polar vortex recovered some of its strength. Remember, the colder the polar vortex, the stronger.

When trying to find a connection between the stratosphere and our winter weather, it helps to have more specialized images at hand. Especially one that shows altitude and time.
The image below shows an atmospheric pressure index. Negative values indicate lower pressure (blue colors) and positive values indicate higher pressure (red colors). We have altitude from the ground up to the top of the stratosphere (~46km) and over the past 4 months.
You can see strong positive values in the stratosphere in early January, associated with the higher pressure buildup during the stratospheric warming event. The event and/or its influence was slowly descending over time, reaching the lower levels by mid and late January. This persisted well into February, influencing the weather circulation even when the stratospheric warming was already over.

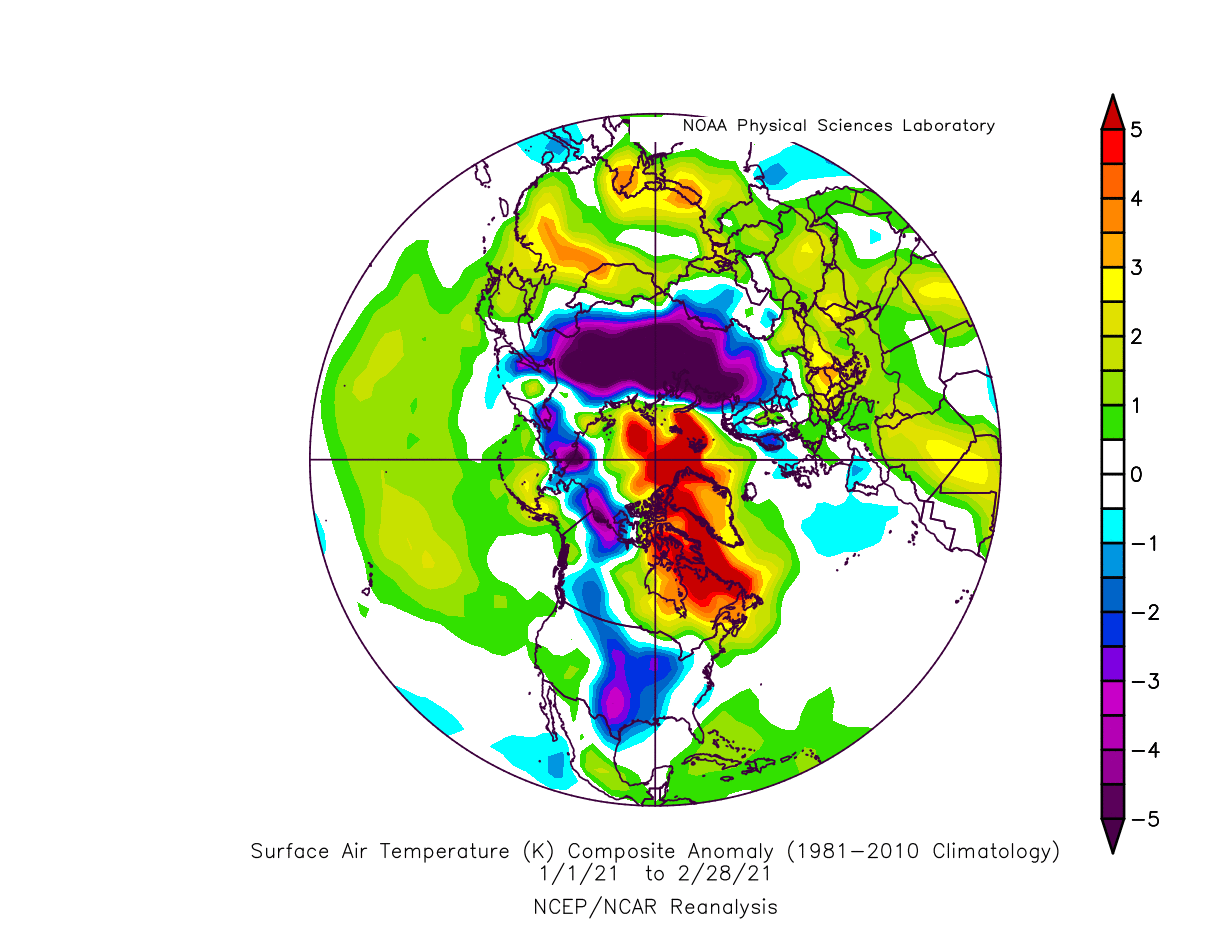
We produced a re-analysis of the January-February 2021 winter period, showing pressure and temperature anomalies. The first image below shows the pressure anomalies. You can see a strong high-pressure system dominating the North Pole. This dominant high-pressure system originated from the stratospheric warming event and the polar vortex collapse, as we showed in the image above.4

A strong high-pressure system over the Arctic can heavily disrupt the weather circulation and can unleash the cold air from the Arctic regions towards the south. The image below shows the temperature anomalies in January-February 2021 period. Warmer than normal temperatures were present under the high-pressure system over the polar regions. Cold Arctic air was pushed out heavily into Siberia, and also into western Canada and the south-central United States.
FINAL WARMING OF THE SEASON
By now, you know what the polar vortex is and how its collapse has greatly influenced our weather so far this year. But there is now a new event starting, which will break down the polar vortex for good. A large anticyclone will take over the stratosphere until a new polar vortex will re-emerge around late September.
As we head deeper into spring, the polar regions eventually start to warm up, which effectively ends the reign of the polar vortex. It can happen gradually, or it can happen as a sudden stratospheric warming event. It is called Final Warming (FW).
The image below shows the typical large Anticyclone dominant over the Northern hemisphere in the stratosphere at around 30km altitude. This high-pressure system is produced as the Sun warms the stratosphere over the North Pole, raising the temperature and lowering the pressure difference towards the equator.

When we have sudden stratospheric warming events during winter, the polar vortex usually enters spring in a rather weak state. That means the final warming is more gradual and it also does not have any major impact on our weather. But sometimes, the final warming can be quite a fast event.
A fast event means that it has more energy, thus having a higher chance for the dynamics to reach down into the troposphere, infiltrating the weather circulation, and affecting our weather.
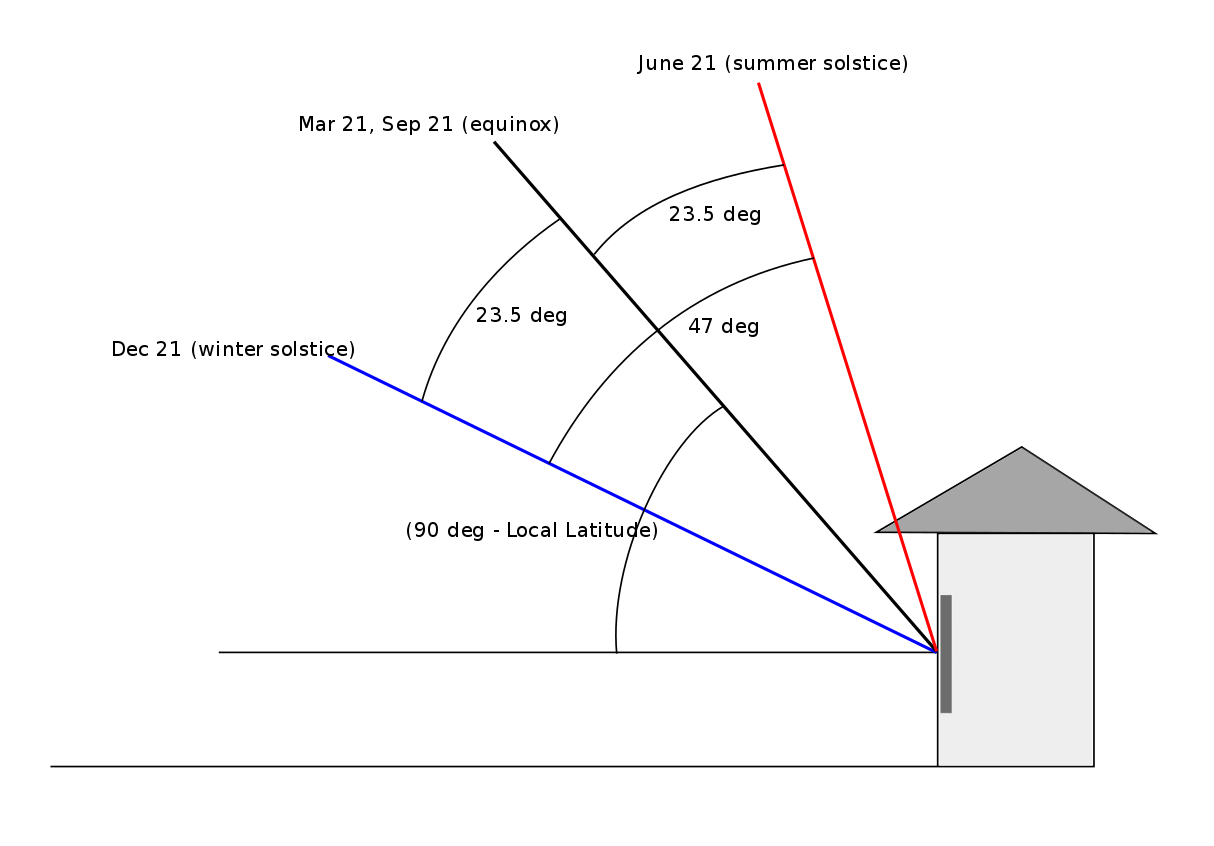
As we head deeper into April, and the Sun angle over the pole increases. This means more of the sun’s energy enters the polar atmosphere, warming it in the process. It will be harder for the Polar Vortex to defend against these warming waves, as the entire atmosphere is also warming up. Below is an image that shows the incoming sunlight angle in the mid-latitudes during different seasons.
Time is basically running out for the polar vortex, as it will eventually collapse or break apart, one way or the other. The question is just in what way, and with how strong dynamics. We are now starting to finally see signs of final warming waves entering the upper stratosphere.
Below is a forecast of a warming wave, starting later this week, initiating over the Siberian sector. Overall the temperatures at this altitude are already warmer than during winter. We can see the coldest temperatures will be around -50 degrees celsius, while in mid-winter, they can be below -80 degrees celsius over a large area.

We will now look over the final warming sequence and how exactly will the Polar Vortex retire this season, and how will it connect to our weather.
FINAL WARMING SEQUENCE
We can see the full sequence on the graphic below. It might look confusing, but it is actually really simple to read. On the bottom axis we have time, showing month-day. On the vertical axis, we have altitude. On the left side is atmospheric pressure, and on the right side is an approximate altitude in meters. You can see that the map shows the lower 80km of the atmosphere, from the ground up into the very mesosphere.

The colors basically show the prevailing winds around the polar circle. Cold colors indicate easterly winds, and warm colors indicate westerly winds. You can see that the negative values are descending down from the high levels of the mesosphere, all the way into the stratosphere (below 1 millibar).
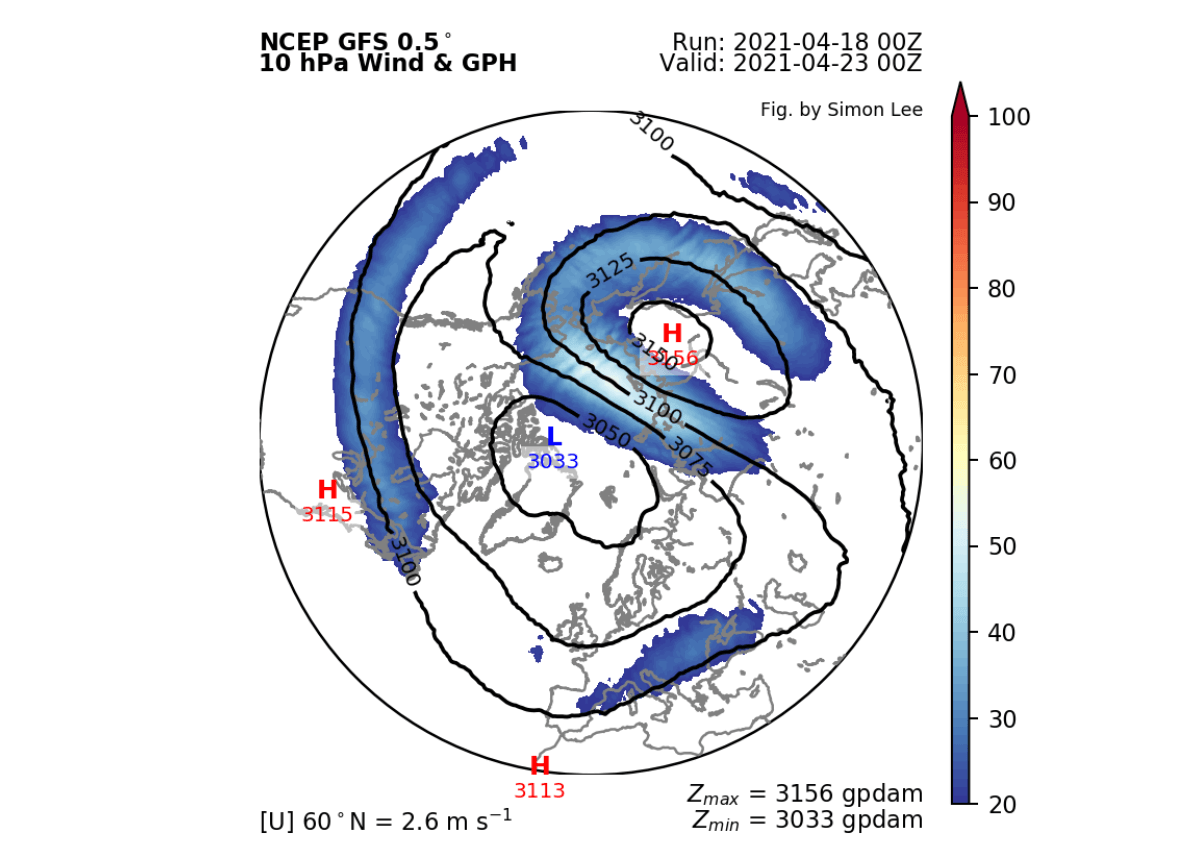
Easterly winds are associated with anticyclones and higher pressure. So this map basically shows that around the 23rd to 25th of April, the higher pressure will disrupt the polar vortex all the way down to the 10 millibar level, which is around 30-32km altitude at this time.
The next image below is an ensemble forecast and predicts the westerly winds around the polar circle in the mid-stratosphere. In essence, it shows multiple forecasts, with different starting conditions, to show more possible scenarios. All scenarios agree on the weakening of the polar vortex and reaching near-zero westerly winds.
Once the values reach zero or negative, the prevailing circulation is reversed, flowing from east to west. This indicates the dominance of an anticyclone and the end of the polar vortex.

You can see that the most important period is around the 24th to 26th of April. A lot of scenarios go into negative values, while some remain in positive values. This shows that models have a hard time grasping the exact timing of the polar vortex breakdown. We will look below at a few key days and how the weather will look in the stratosphere and down here at the surface.
POLAR VORTEX ABOVE AND BELOW
Currently, the polar vortex in the stratosphere is fairly large. It is centered over Siberia, extending into the polar regions and slightly into North America. You can already see the high pressure emerging in the stratosphere over east Asia.

Going lower down into our weather patterns, we can see the lower pressure systems over Siberia and over Greenland and Canada. These are the bottom extensions or “legs” of the Polar vortex. Note the strong high-pressure systems over Alaska, East Asia, and Scandinavia.

The image below is a bit special. It shows the 100mb pressure level (~16km altitude), which is in the lower stratosphere. To keep it simple, it shows the temperature transport. We can see heat transport over East Asia and east of Scandinavia. This generally helps to weaken the polar circulation. You can also see the main core of the polar vortex at this altitude over Siberia as well, and the extension over Greenland and North America.

Later this week, the high-pressure system in the stratosphere will intensify, pulling the polar vortex back over the North Pole. This high-pressure area connects all the way up into the mesosphere, as we have seen in one of the earlier images.
The great image below is produced by Simon Lee and shows pressure (height) anomalies for the northern hemisphere across the world on April 23rd. You can see lower pressure connecting the stratosphere down to the lower levels around -60 to -100 degree longitude, which is in Canada and the United States region.
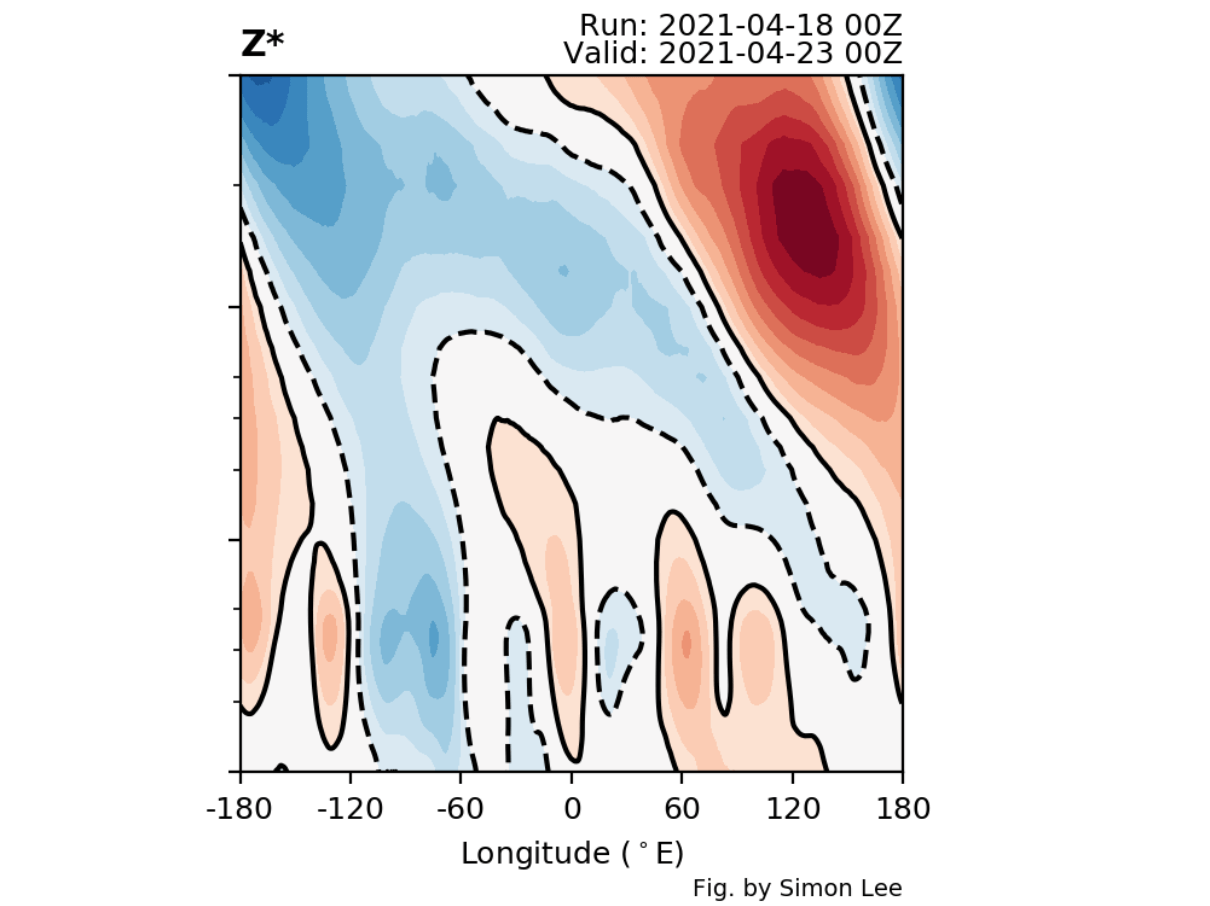
The pressure pattern map shows this exact area under low-pressure systems. One main low-pressure system is over Canada and the connected low-pressure area over the northeastern United States and an extension into the western United States.

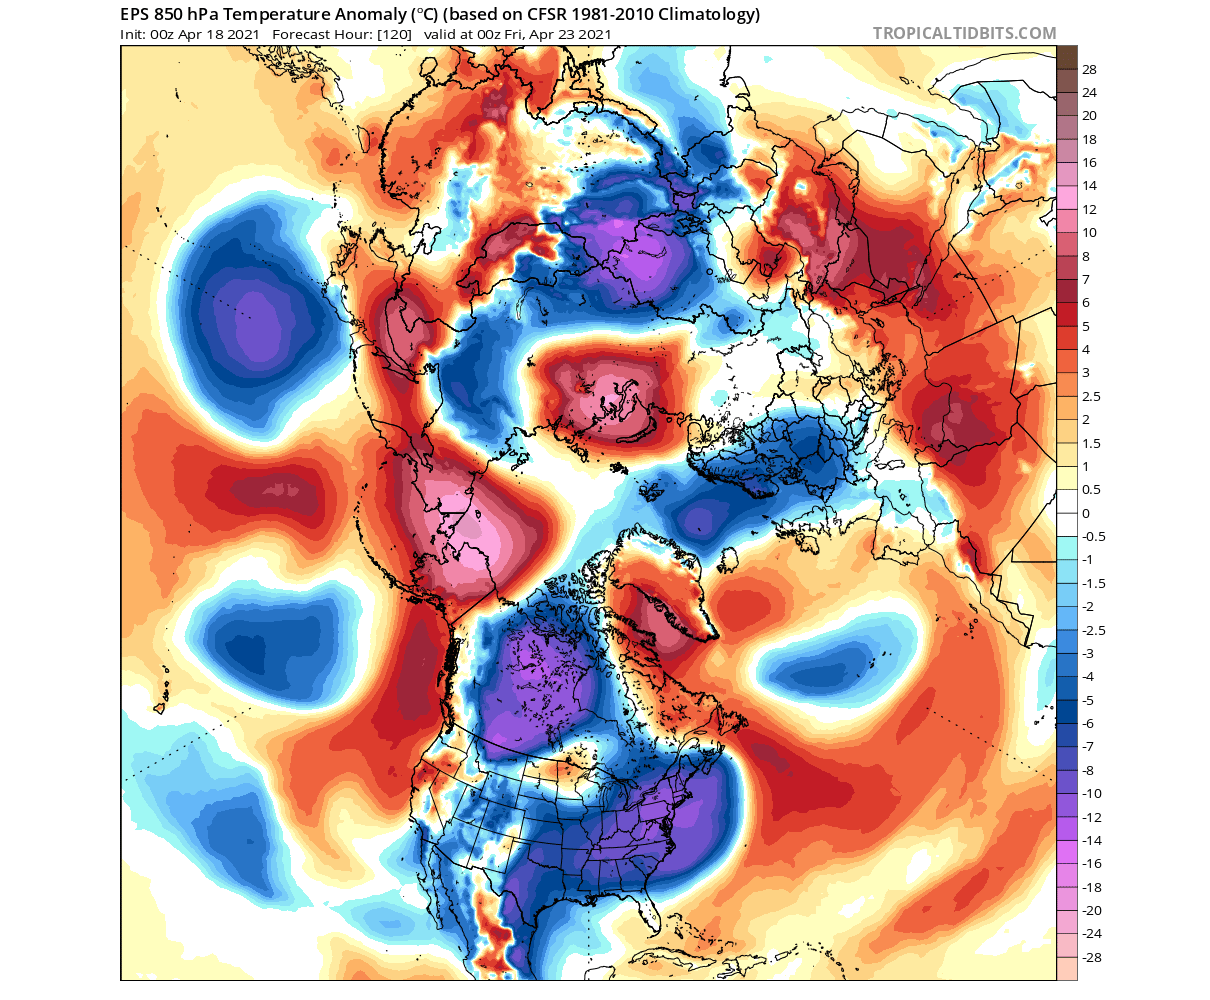
The temperature forecast shows these low-pressure systems transporting colder than normal weather across much of the southern and eastern United States.
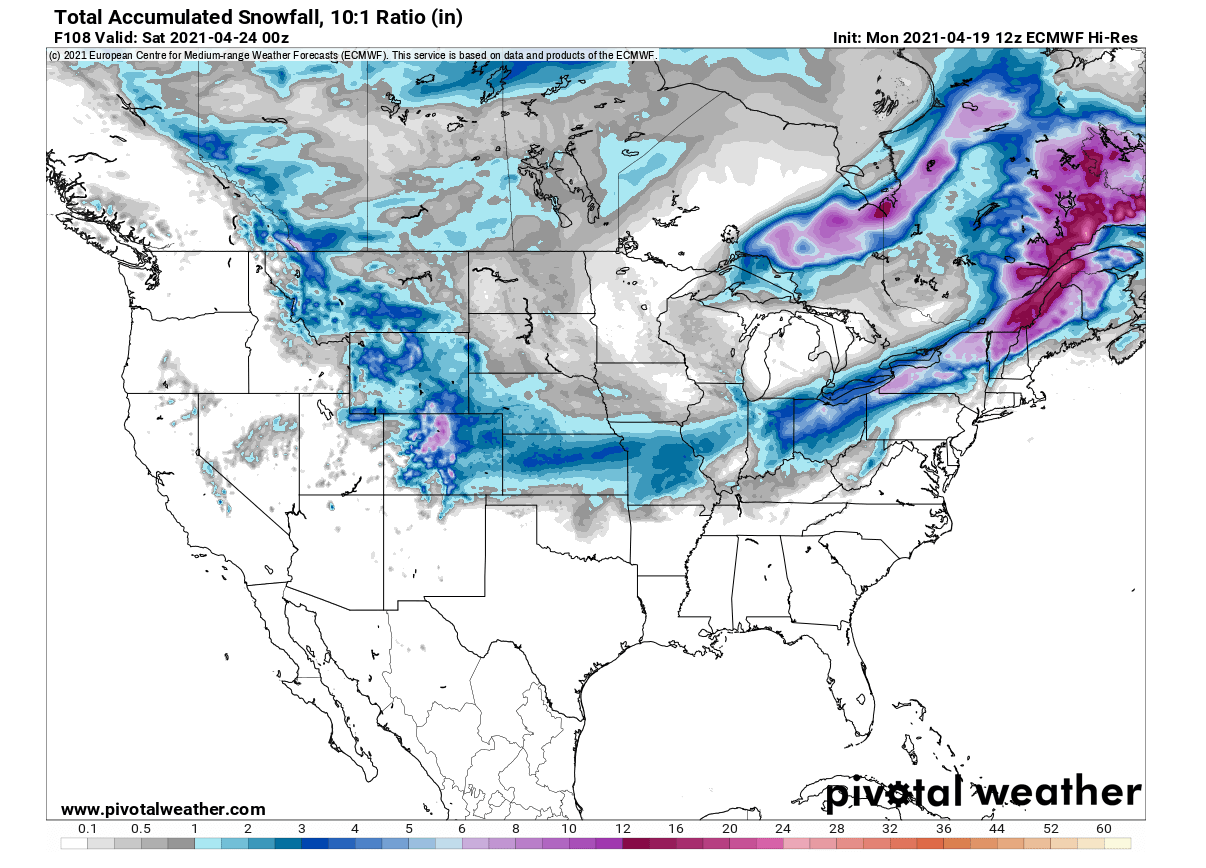
The snow forecast from ECMWF shows that the air will be cold enough to support snowfall. Snowfall area will extend across a large area from the northwestern United States, across the central regions over to Midwest, ending with maximum snowfall in the northeastern United States and southeastern Canada.
Early next week, the main polar vortex will be finally pushed out of the pole in the stratosphere. It will move over North America, affecting the weather in the region.

The vertical pressure map below shows the low pressure in the stratosphere connecting down around the -60 to -120 degree longitude. This gives a nice estimate of where the stratospheric polar vortex might connect down.

-60 to -120 degree longitude is of course in the United States and Canada region. The pressure anomaly map below shows low-pressure areas over Canada and the northeastern United States. This corresponds to the location of where the stratospheric polar vortex is connected down to the surface weather.

These low-pressure areas will of course also mean some colder air transport. The forecast below shows colder weather regions in central Canada and also over the eastern United States, under the low-pressure systems. Greenland is warmer than normal, under a blocking ridge, which will also send some colder air into northern Europe.

But weather is not so simple, and there are more factors and dynamics at play than just the stratosphere and the polar vortex. One strong dynamics that will influence the weather in April and May is the Madden-Julian Oscillation or MJO short.
This is a wave in the tropical regions, alternating between wet and dry episodes as it circles the globe around the Equator. On the image below, we can see a wet episode (green hues) emerging in the western Pacific Ocean. This wave will then travel across the Pacific, arriving in the Atlantic ocean by early May. These waves influence the tropical temperature and wind patterns, thus also impacting the global circulation and our weather.

This just goes to show, that there is never just one factor at play, as the global weather is a very complicated system, where everything can have an influence on the global picture.
We will keep you updated on the global weather activity, so make sure to bookmark our page. Also, click on the like (♥) button on this article if you are reading us from the Google App (discover) feed, to see more of our latest articles on weather and nature in general.
Don’t miss: