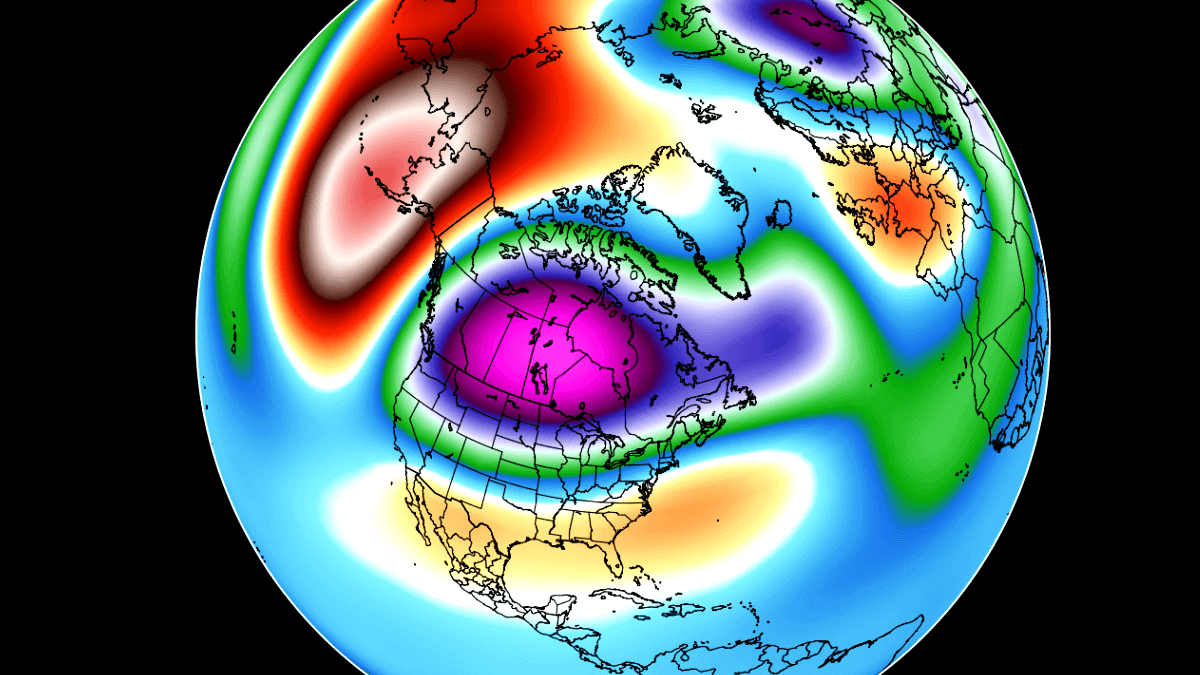
The strong High-Pressure blocking system in the North Pacific is evolving. Its next push will extend it into the Arctic Circle, allowing the polar jet stream to extend further south and east over the United States in January 2022. In this transitional period, colder weather will have an easier path from Canada down into the central and eastern United States.
We were talking about these pressure changes in our previous articles. There are some very strong weather drivers behind these pattern “evolutions”, that command the weather patterns each winter season. But why is that strong North Pacific blocking pattern there in the first place? And why is it so persistent this winter season?
As you will soon find out, the weather is much more global than one might imagine. So you will quickly learn, which are currently the two global weather drivers, that play a major role in the weather pattern development as we enter the 2022 weather season.
DIFFERENT SCALES OF WINTER WEATHER
Whether we look at the seasonal forecasts for winter or the already evolving weather patterns, we tend to look at the large-scale background state of the weather. That means finding a strong global weather driver and its signature if there is one. This year, the main large-scale weather driver has obviously been the La Nina in the tropical Pacific Ocean.
But for normal day-to-day forecasts, we have to look at the short-term variability. Besides the La Nina which we will also cover briefly below, we have other drivers that help shape the global weather on different sizes and time scales.
Below is an image from a climate study, you can see different weather phenomena, and how they rank in size and time scales. Large-scale factors like the trade winds and ENSO are typically the main drivers on longer time scales over entire weather seasons. But as we go to smaller sizes and shorter time scales, there is influence from frontal systems hurricanes, thunderstorms, etc,…

These smaller scales are harder to compensate for in the weather models, so they are typically the main source (if strong enough) for the weather variability in the forecast and also in the actual weather that we feel. But we can still see the overall motion of weather systems being influenced by the large-scale background global anomalies.
We will show you two large-scale drivers and how they are currently influencing our weather, and helping it to evolve over time. As their influence ranges from weekly to seasonal, we will continue to feel their weather presence in January 2022 and beyond.
ENSO IN THE PACIFIC
Going to the seasonal influence first, we have ENSO. That is short for “El Niño Southern Oscillation”. This is a large region of the tropical Pacific ocean, changing between a warm and cold phase, called El Nino and La Nina, respectfully.
ENSO has a major impact on the tropical convection patterns (storms) and the complex interaction between the ocean and the atmosphere. We can observe long-term pressure changes in the tropics as ENSO starts to shift into a warm or a cold phase. With some delay, these changes directly affect the circulation over the rest of the world.
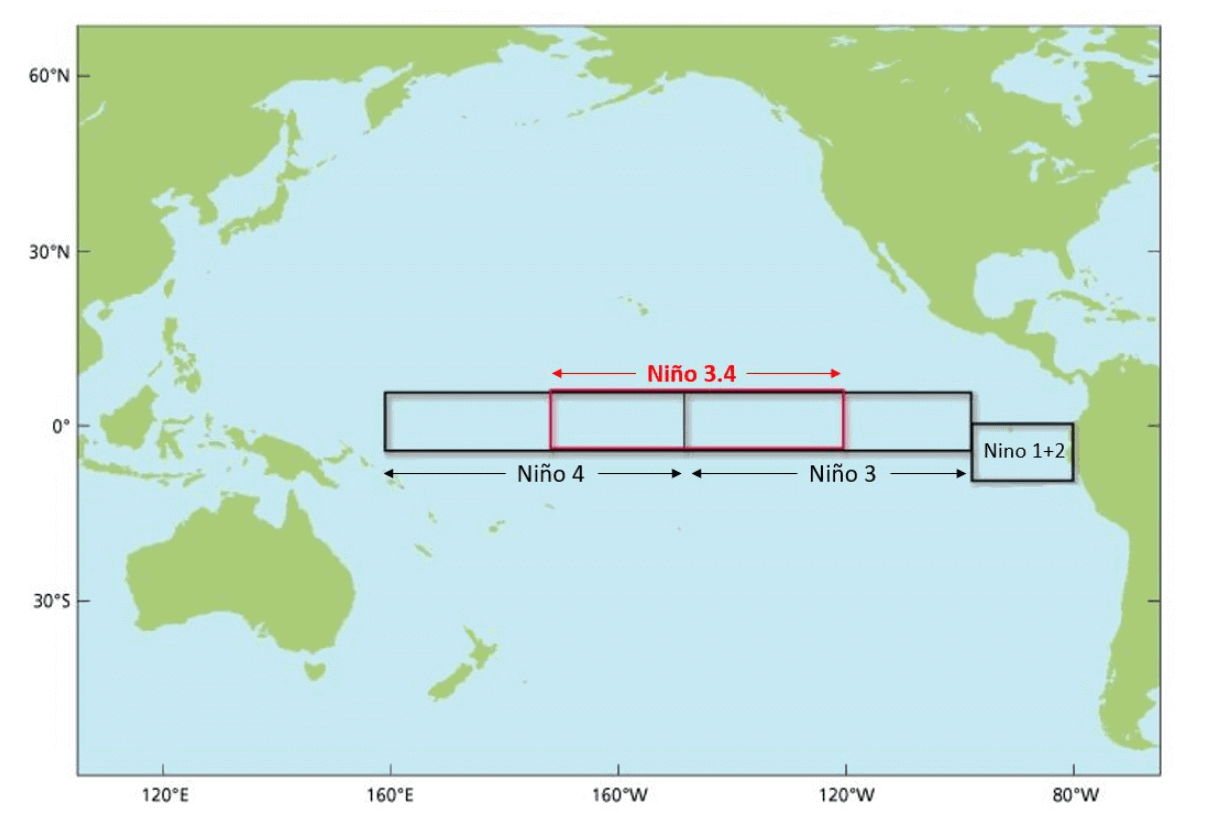
The image below shows the ENSO regions in the tropical Pacific. We mostly focus on the combination of regions 3 and 4, seen on the image as the Nino 3.4 region. Region 3 covers the eastern tropical Pacific, while region 4 covers the central and western parts.
Each ENSO phase has a different effect on the pressure and weather in the tropics. This translates to the overall global circulation, creating a different weather response worldwide. A specific phase (cold/warm) usually develops between late summer and fall and typically lasts into next spring. Some stronger events can last even up to two years.
The cold ENSO phase is called La Nina and the warm phase is called El Nino. Their names literally translate to “the girl” from the La Nina, while El Nino translates to “the boy”, indicating an opposite dynamic between the two phases.
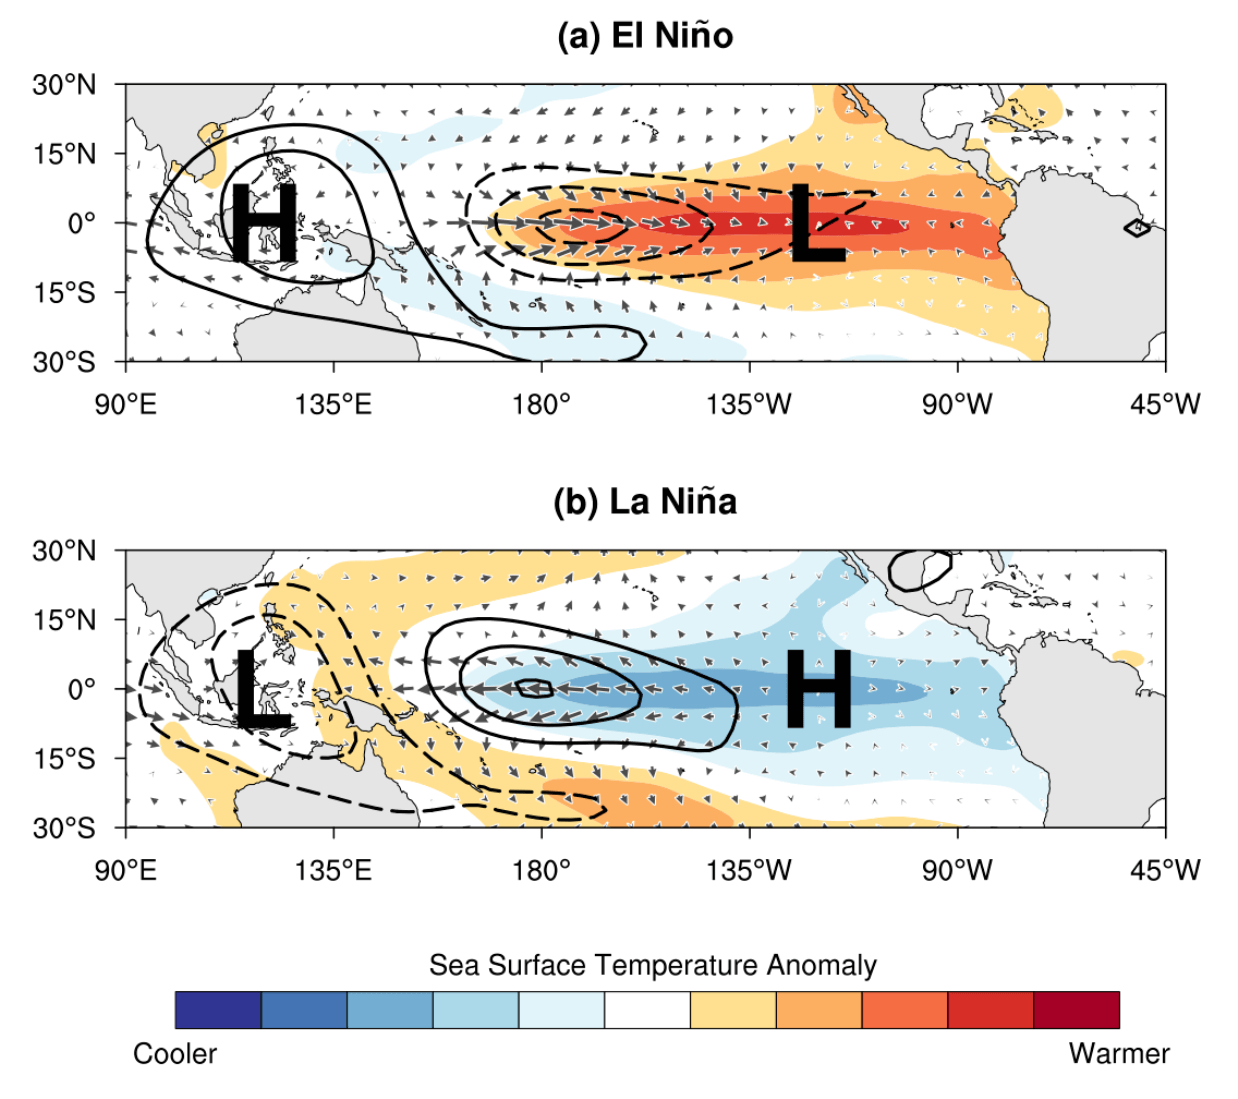
But besides the temperatures, one of the main differences is also in the pressure state. During an El Nino, the pressure over the tropical Pacific is lower, with more rainfall and storms.
But during a La Nina, the pressure over the equatorial Pacific is high, creating stable conditions and less precipitation. This obviously translates into the global circulation, affecting the jet stream on both Hemispheres over time.
You can see the difference in the pressure patterns on the image below and of course the difference in the ocean surface temperatures in each phase.
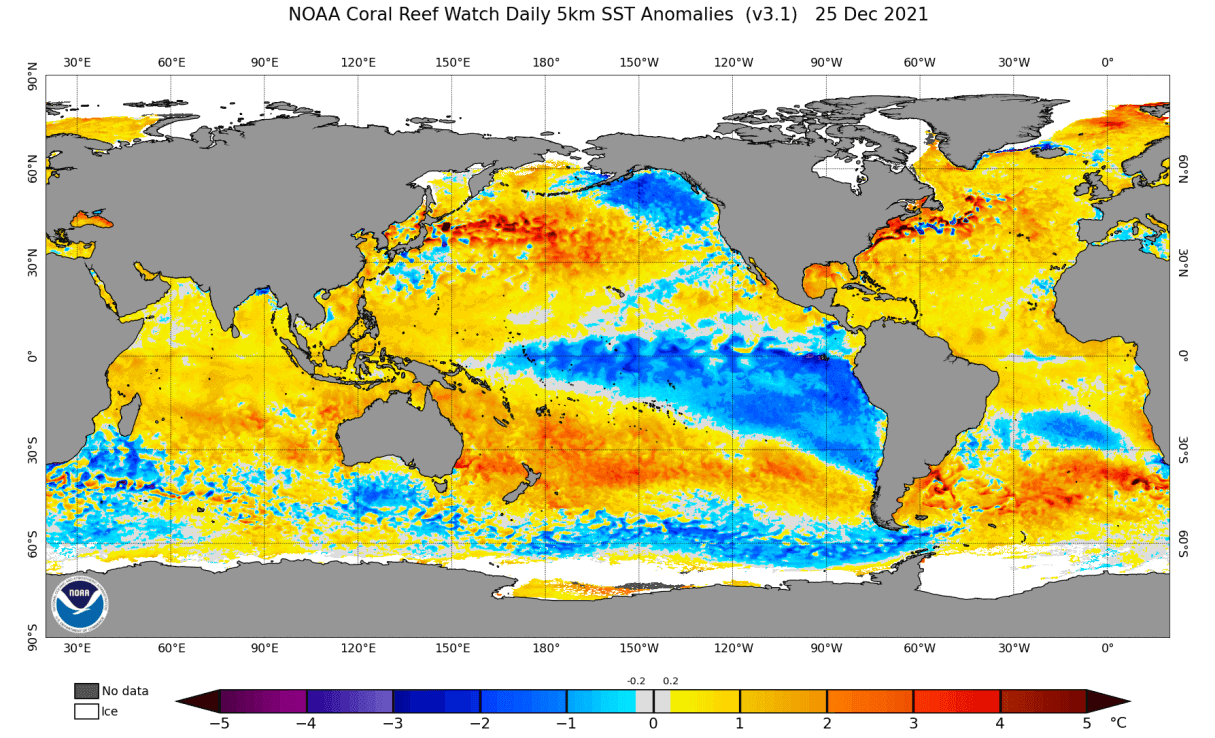
Below we have the recent global ocean temperature analysis from NOAA. We can nicely see the strong cold anomalies in the tropical Pacific Ocean, the currently active La Nina phase. The strongest cold anomalies can be found in the eastern region, going down to 3°C below the long-term average. Overall, the current event is marked as a moderately-strong cold phase.
The development of this cold phase began from Summer to Fall and can be nicely seen in the video animation below. It shows the equatorial ocean cooling starting in July, as the cold “waveforms” develop across the equatorial Pacific. They form as the surface water is being pushed west by the winds, bringing colder deeper waters to the surface. These winds also mark the change in the tropical pressure patterns.
The combined/consolidated forecast from NOAA/CPC calls for the La Nina to last over the winter and into early Spring 2022. This is a pretty typical scenario, to shift into a neutral state during the warmer part of the year. A new phase usually tends to develop in late summer or early fall. We can see an increased probability for a warm phase developing into late 2022.
Below we have an image that shows the average winter pressure pattern from multiple La Nina winters. The main feature is of course a strong high-pressure blocking system in the North Pacific and low pressure over western Canada. That is the typical signature of the cold ENSO phase, which pushes the jet stream down into the northwestern and northern parts of the United States.

Thanks to the changing pressure patterns in the tropics and of course over the west Pacific and Asia, that support a long-lasting high-pressure system in the North Pacific. In the case of a warm ENSO phase, the North Pacific would be dominated by a persistent low-pressure system.
Looking closer at the La Nina weather signature below, we can see its strong and persistent high-pressure system in the North Pacific. That usually shifts the jet stream from western Canada down into the northern United States, creating a colder north/warmer south weather pattern over the United States.
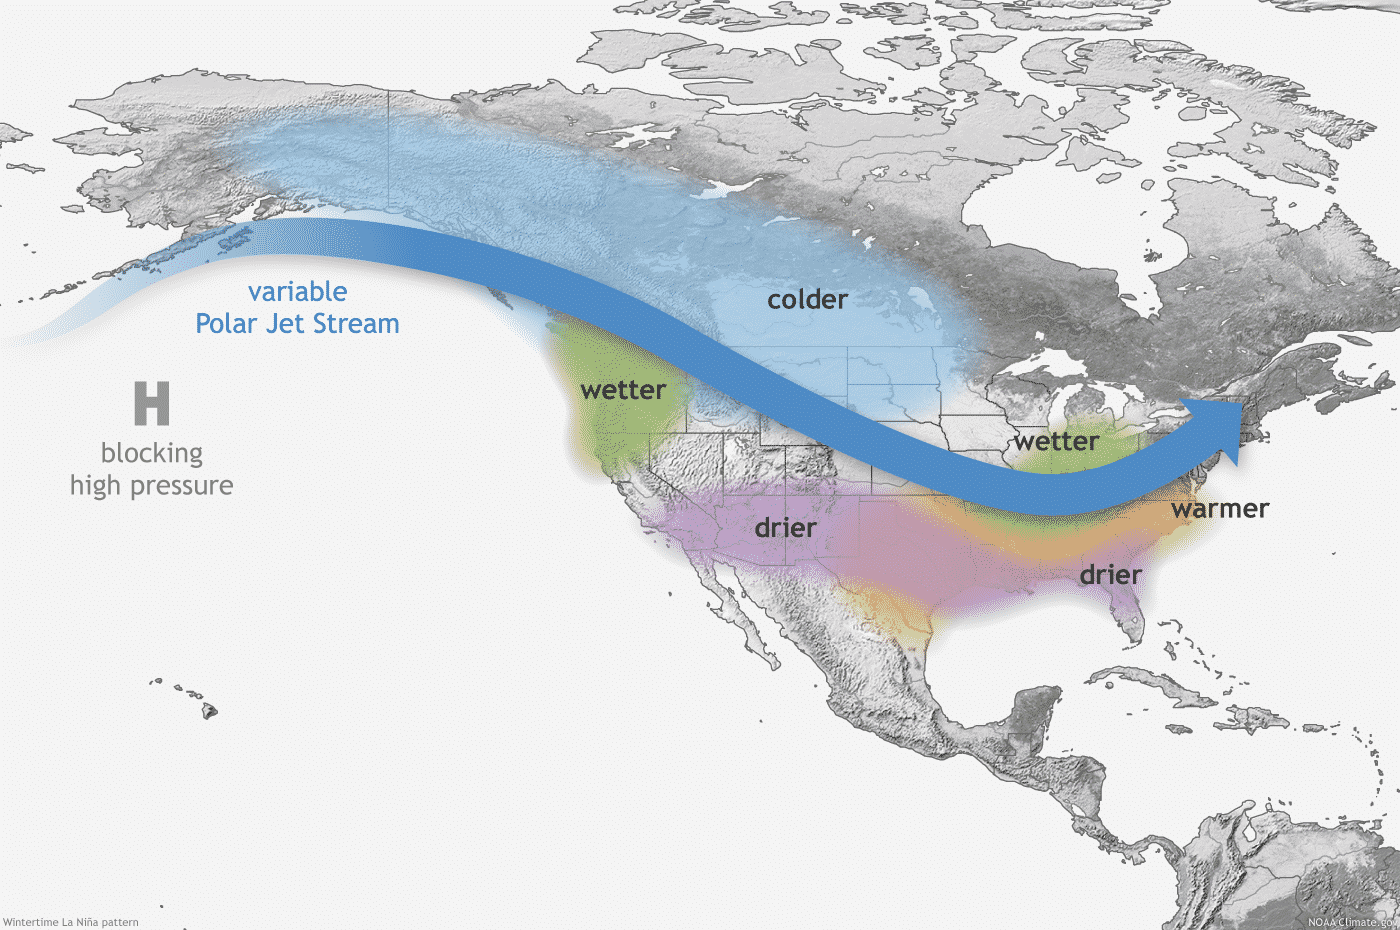
Alaska, western Canada, and the northern United States typically get colder than normal winter, with more precipitation (and snowfall). Southern and southeastern United States usually experience warmer and a bit drier conditions in the winter season.
We will now move on from the seasonal scale to a shorter time scale. But we are still staying global, just going from the ocean up into the atmosphere.
MJO ATMOSPHERIC WAVE
Staying in the tropics, we have quite different dynamics in the atmosphere, of course working in tandem with the Ocean. A lot of the tropical variability is driven by invisible wave-like features in the atmosphere. The largest and most dominant source of short/medium-term variability is the Madden-Julian Oscillation wave, known as MJO.
But what is this MJO wave? This is basically an eastward-moving disturbance (wave) of thunderstorms, clouds, rain, winds, and pressure changes. It moves around the entire planet across the equator in about 30 to 60 days.
It has the power to influence the weather patterns further north over the North Hemisphere, as there is a strong connection between the tropical pressure changes and the global weather.
The MJO consists of two parts: one is the enhanced rainfall (wet) phase and the other is the suppressed rainfall (dry) phase. The graphic below from NOAA Climate shows the basic components of this wave. We have increased storms and rainfall (lower pressure) on one side and fewer storms and drier weather (higher pressure) on the other side. Image by NOAA Climate.

The image below shows exactly how this wave travels across the equator. Notice the dry/wet anomalies in the tropics. Green colors indicate lower pressure and more precipitation and storms, and warmer colors show less precipitation and higher pressure. This way, we can observe how the MJO wave moves across the tropics.
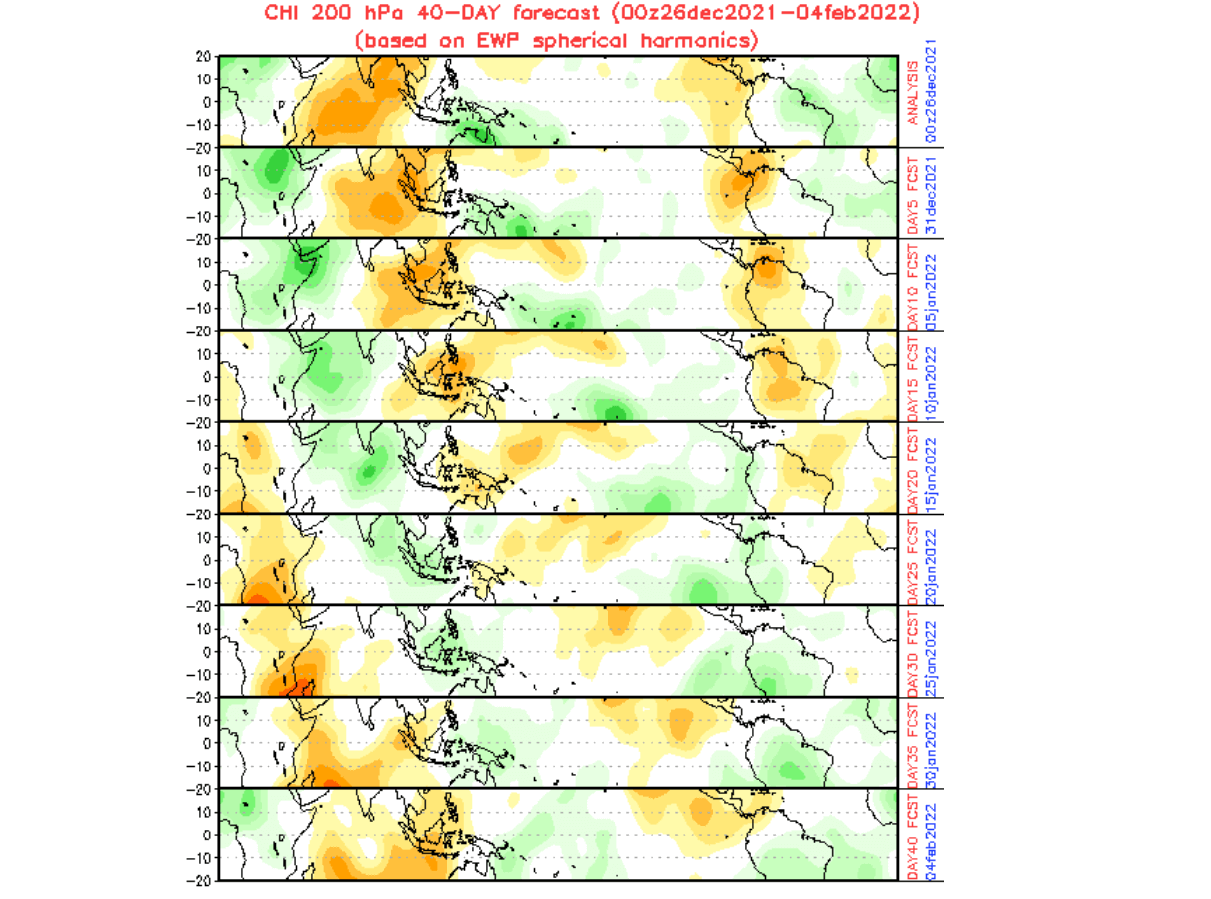
It is important to note how this wave is consistent enough to be arranged into phases. Each has a slightly different influence on the global weather. That is why we need to keep track of how it is moving around the globe.
The pressure changes it brings along can affect one region of the world more directly, thus also hawing down/upstream effects on the rest of the global weather. This is how the influence from these anomalies translates into global weather patterns.
The current forecast below from ECMWF shows that MJO will be in phase 7 will for the remainder of the month and into early January 2022. We will look below how a typical winter phase 7 influence looks like on the temperature and pressure across the world.

Below we have a composite image of phase 7 in December, showing the average pressure pattern for this phase. We can see right away, that there are two main high-pressure systems. One is in the North Pacific and the Aleutians and one over Scandinavia and northwestern Europe.

This means lowered pressure over Canada and the northern United States, bringing the jet stream and colder temperatures also down to the northern United States. This is also what the cold ENSO phase does, as we have seen before. So this phase 7 is actually working in tandem with ocean anomalies, which is why the high pressure in the North Pacific is so robust lately.
Speaking of temperatures, below we have the same composite image, but for temperatures. Perhaps it is a bit harder to interpret due to the contour lines. But we have colder temperatures over Canada and the northern parts of the United States. This is of course not a direct forecast, but a general influence. Other factors can amplify/weaken this signal.

This is the weather pattern that we will be looking for in the main part of the article below, which contains the weather forecast for the rest of December and for January 2022. The forecast above for the MJO shows a strong signal for phase 7, so we should be seeing some of this reflected in the weather patterns.
This means that the MJO and the La Nina in this case can “boost” each other, as they both force towards the same pattern. They are at the end of the day both emerging in the tropics, but working at different time scales.
We will be looking for this pattern in the forecast, to see how the combined influence of these winter weather drivers will really translate into our every day in the coming weeks. But first, let’s quickly recap the first winter month so far, and take a quick look at the 2021 overall.
DECEMBER AND 2021 GLOBAL WEATHER
The first month of the 2021/2022 winter season had the La Nina written all over it. A low-pressure system was present over Canada, with higher pressure seen building in the North Pacific. That drops the jet stream over the northern United States, separating the cold and warm air.
Looking at the global temperatures in December to date, we can actually see a lot of colder than normal temperatures in the Polar and sub-polar region, north of the 60N latitude. The exception is of course Greenland area, with strong high-pressure systems. A warm anomaly is also across the United States, contrasting the much colder temperatures up in Canada.
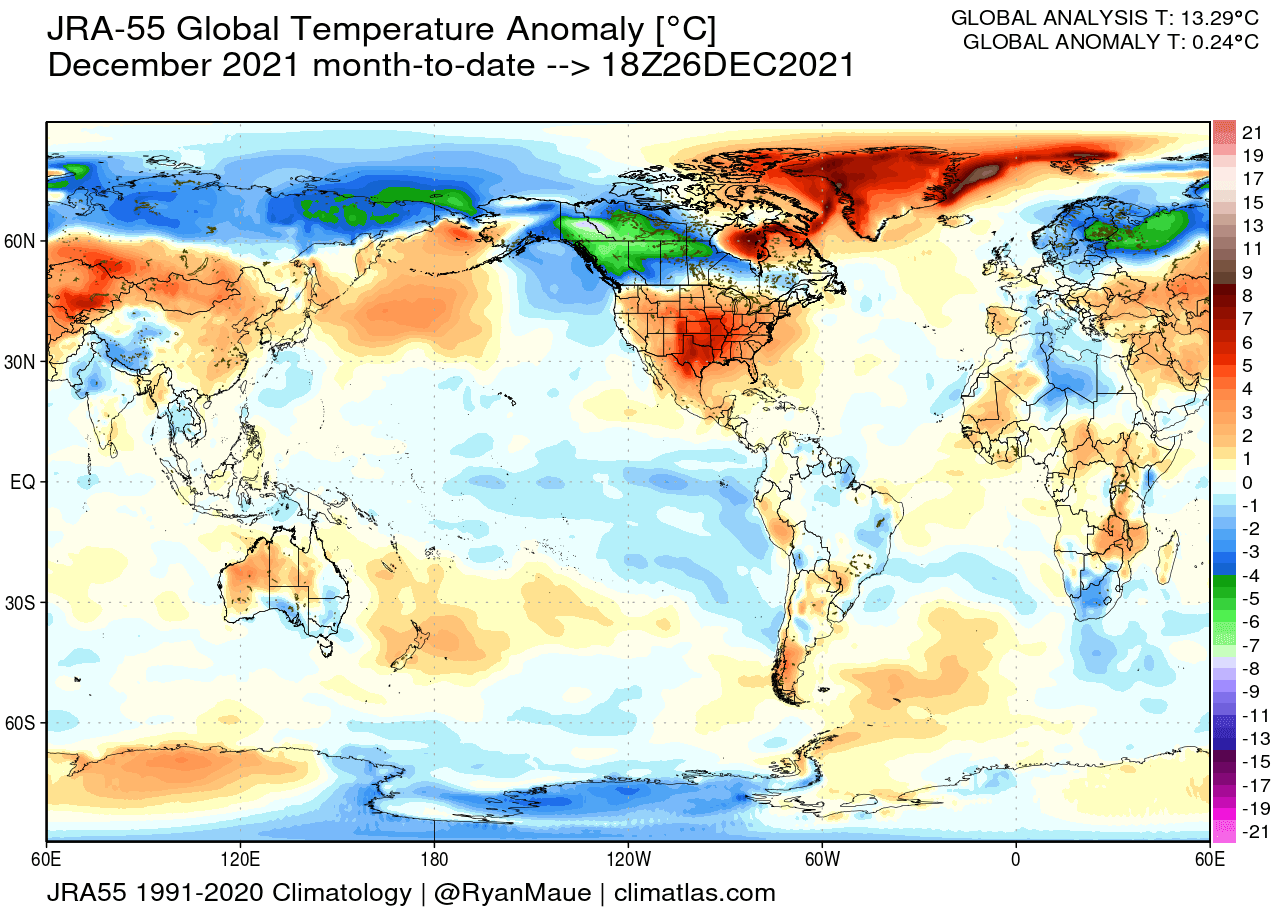
Looking closer at December to date over North America, we can see the strong warm anomalies across much of the United States. The strongest anomalies are found in the south-central states, reducing greatly towards the northern border. Cold air in western Canada was a regular source of cold fronts for the northwestern United States.
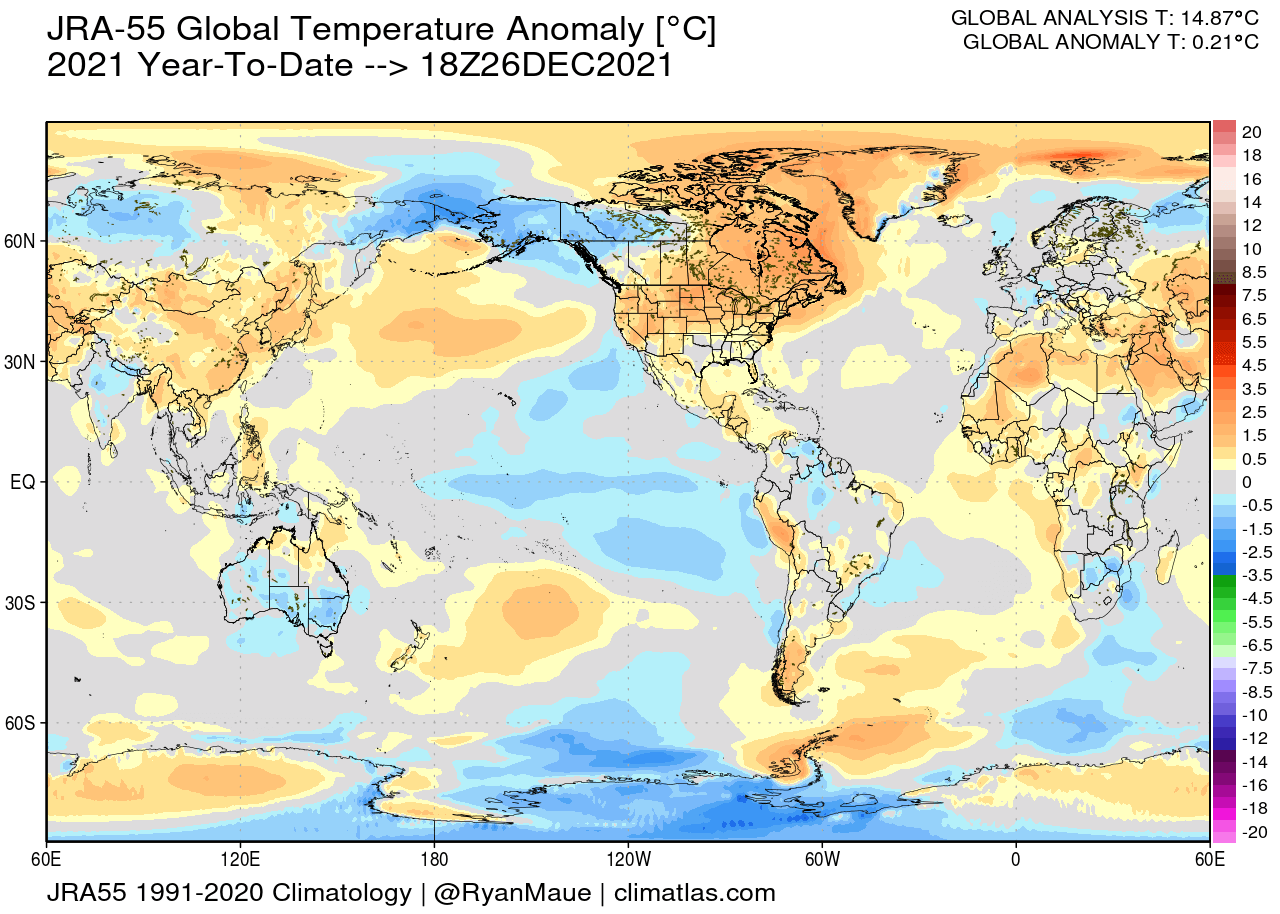
Taking a look at the entire 2021, we see an interesting picture. Most of the United States and Canada were warmer than normal. The strongest cold anomalies were found over northeastern Asia and Alaska. Australia was mostly colder than normal and of course the equatorial Pacific Ocean, both due to the La Nina. Europe was mainly neutral overall.
Globally, 2021 was not competing for the warmest year on record. The graph below shows the temperature anomaly progression for the entire world. At the beginning of the year, we were actually observing near-normal temperatures in the global average. Into the second half, the temperature anomalies began rising, but on the yearly scale remained below 2020.
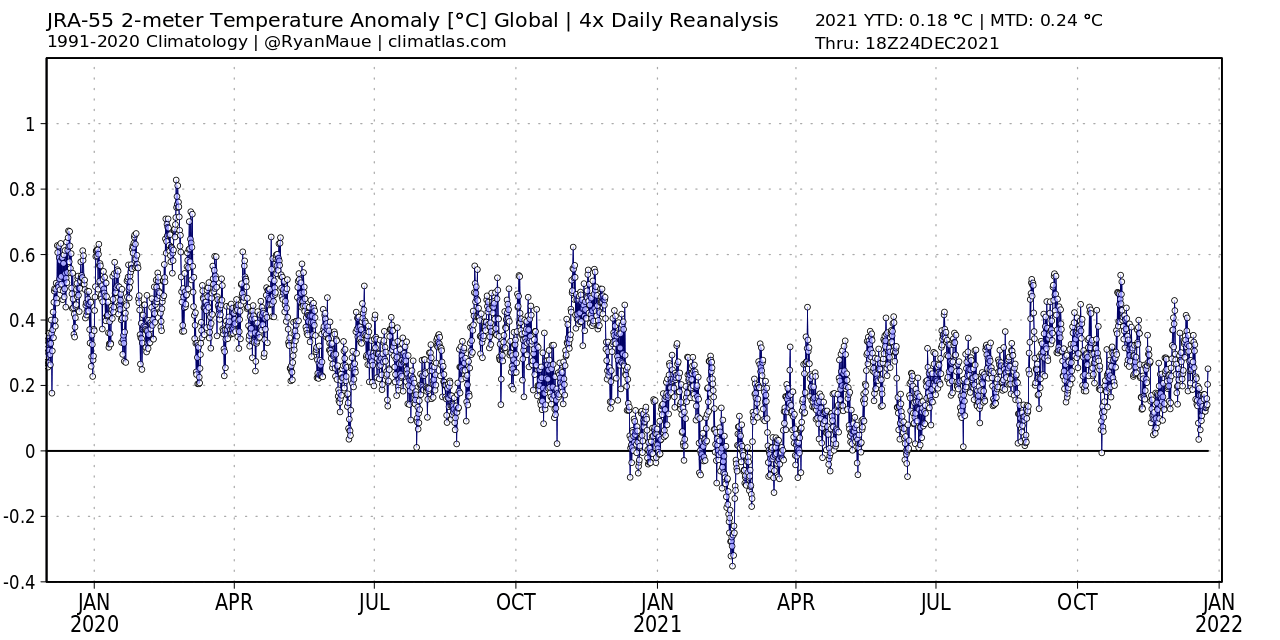
The temperature drop-off from 2020 into 2021 can also be contributed to the La Nina event, which we now know well, has an impact on global weather patterns.
WINTER WEATHER PATTERN FORECAST – FROM 2021 TO 2022
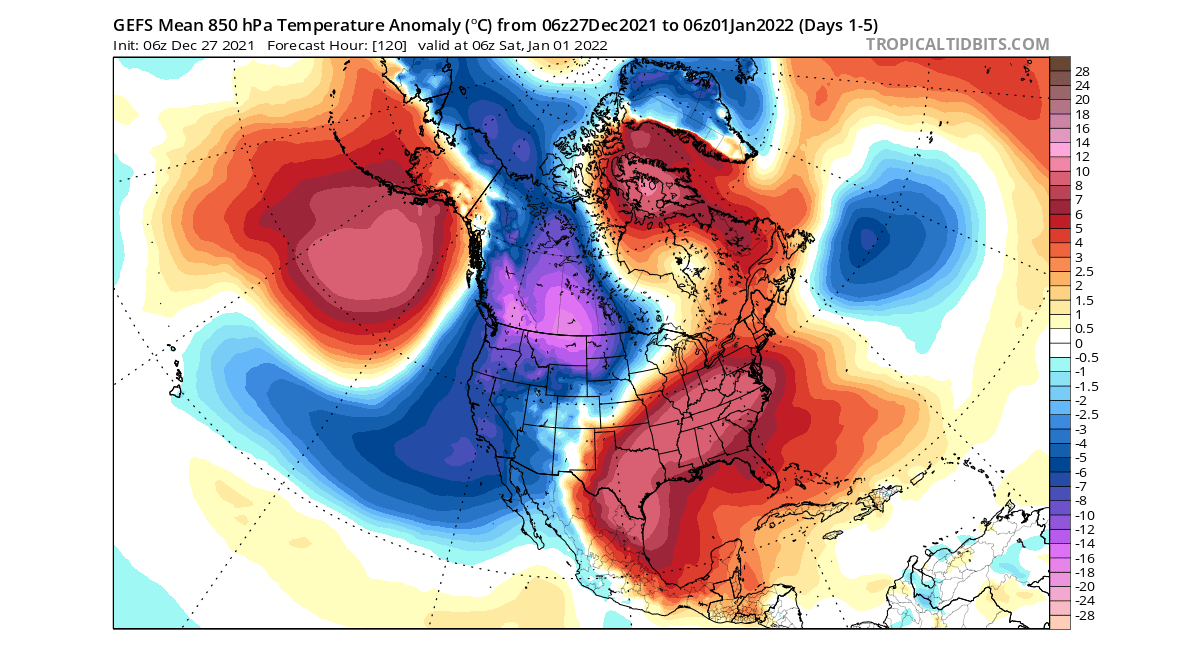
Looking at the latest forecast for the end of the month, we can notice a very chaotic pressure pattern. A powerful high-pressure system is in the North Pacific, as we discussed earlier above. We also have higher pressure over Greenland and western Europe. A special pattern is over the United States, with a low-pressure system over the western half, bringing colder air into the western United States.
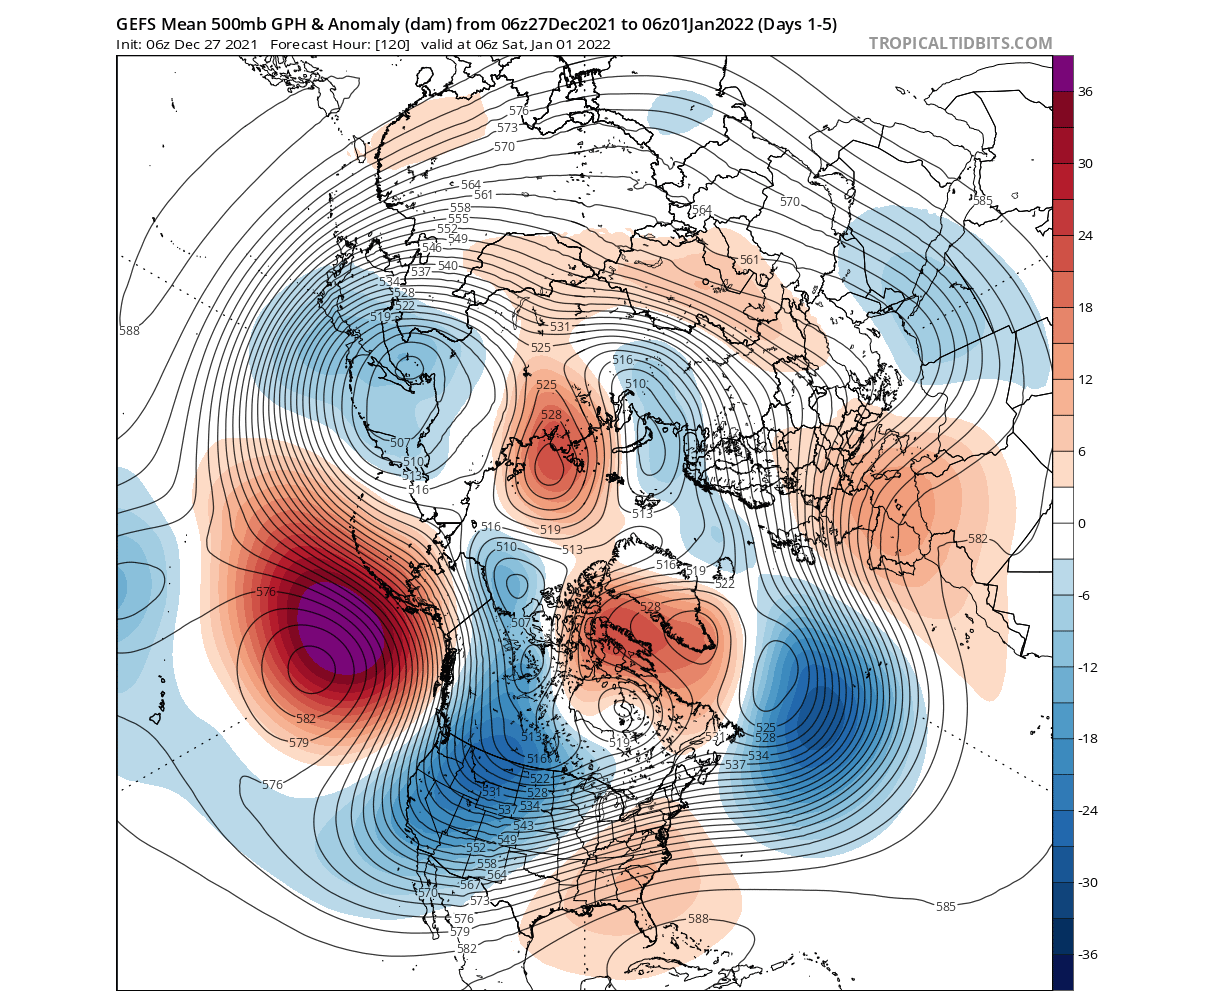
Over North America, we can see a strong weather contrast. Much colder than normal temperatures will be present over southwestern Canada, also cover over most of the western United States. At the same time, unseasonably warm weather is expanding over the southern and eastern United States.
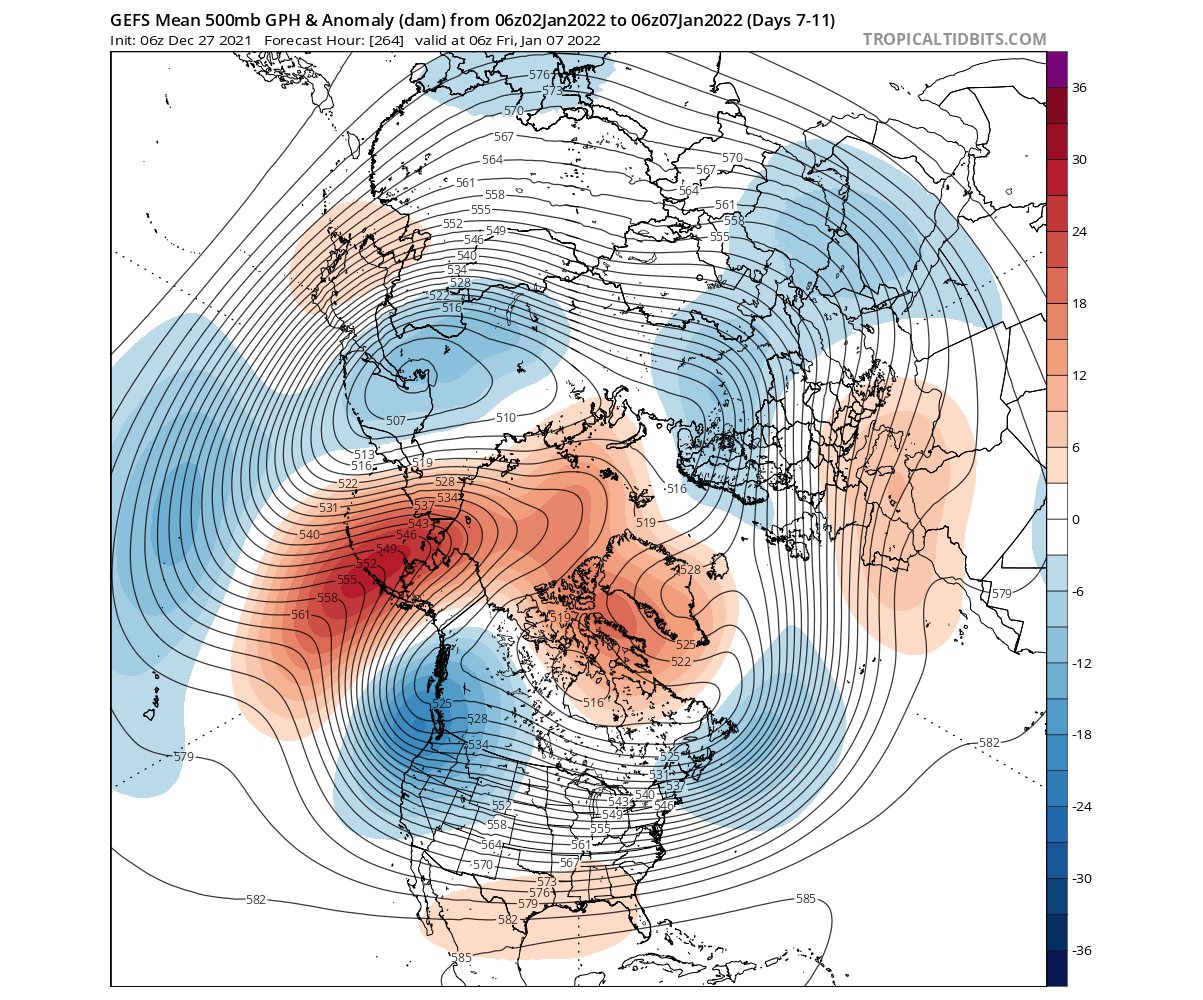
Going into early January, we are going to see an evolution of the North Pacific pattern. The strong high-pressure area will expand from the North Pacific into the Arctic Circle. Connecting with the high-pressure over the Greenland area, It will further strengthen the low-pressure area over western Canada and the western United States, sending it across the country, with the colder air.
The temperature forecast below shows the colder air anomalies confined to western Canada, as was the case for the past days/weeks. The low-pressure area over the western United States will bring down colder than normal air into most of the western and southwestern parts of the country. Thanks to the transition of the lower pressure system, the colder anomalies will extend over the midwest into the northeast.

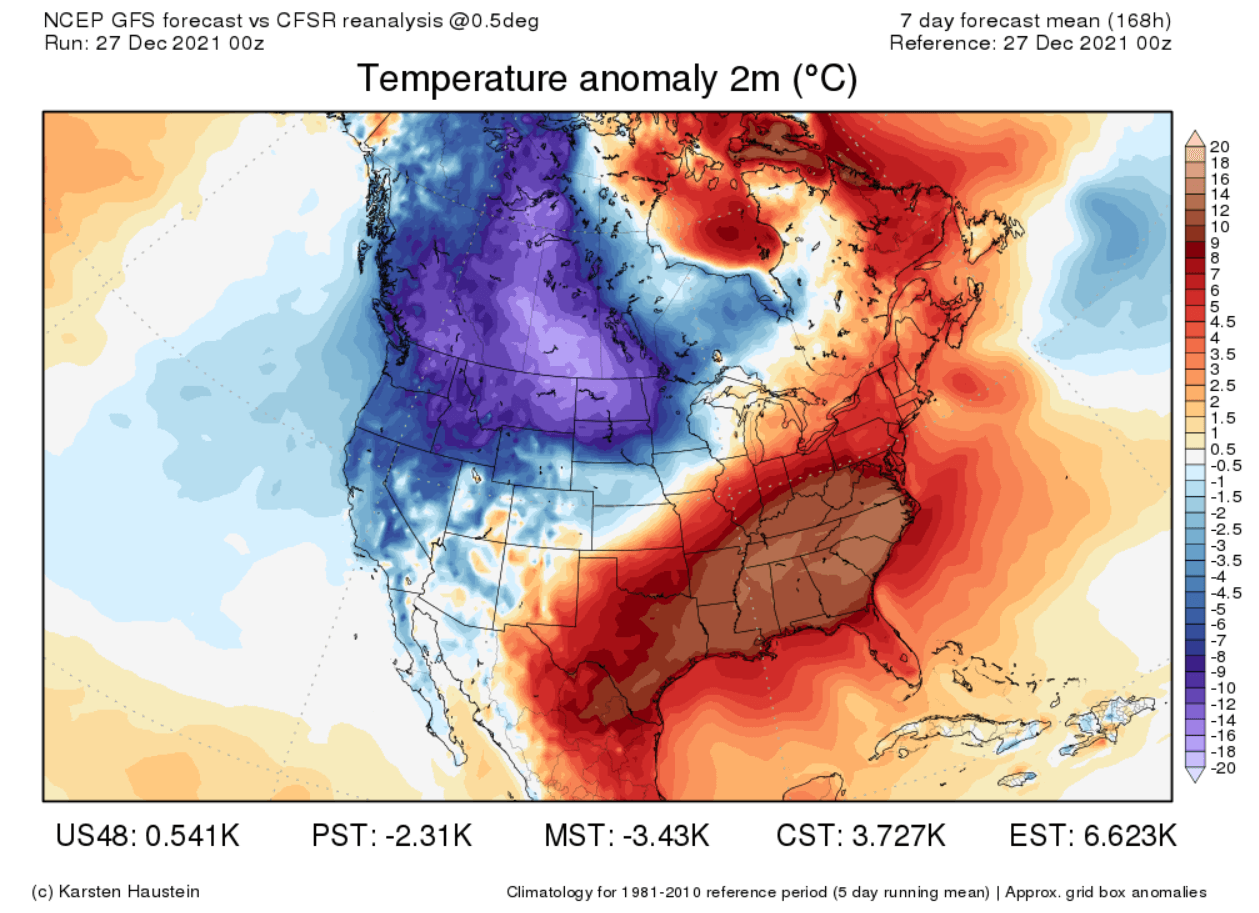
Looking at the 7-day forecast mean, we can see the strong cold air anomalies over the northwestern United States. Also note the much warmer than normal temperatures over the southeast, creating the perfect weather opposition.
Taking a more detailed look, we do however see the colder than normal conditions transitioning over much of the United States behind a strong cold front. It will enter from the northwest, going across the entire country and then moving out into the Atlantic.
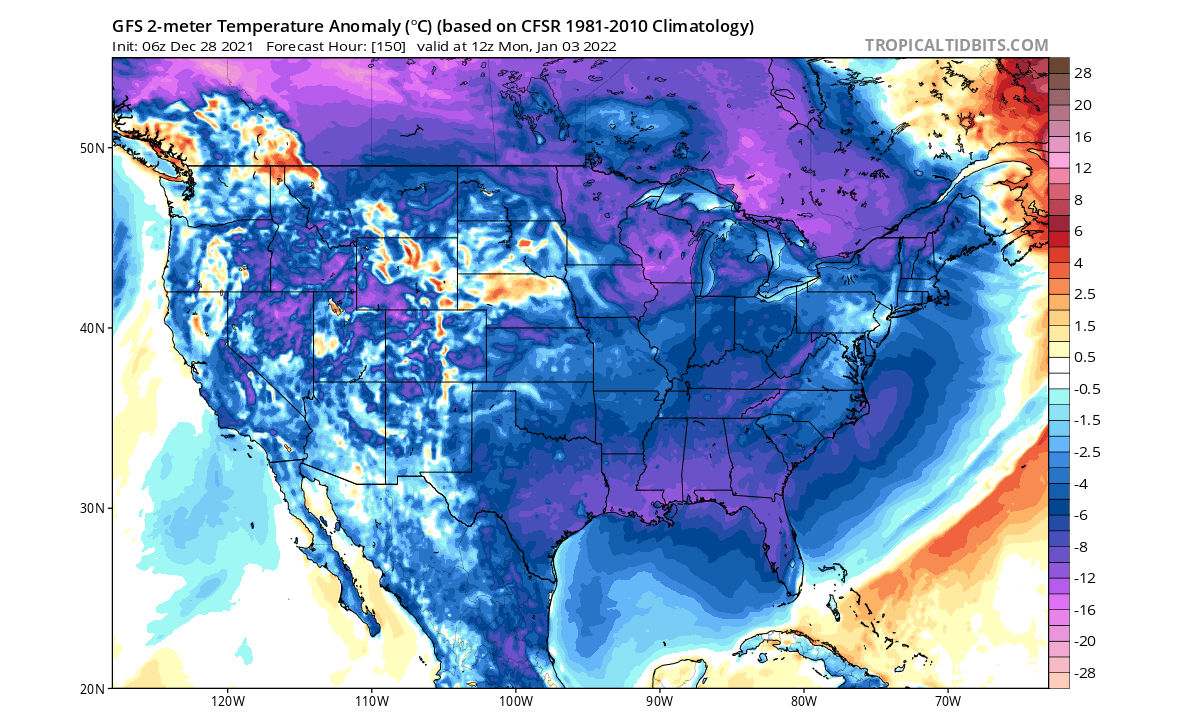
We are already preparing a more detailed article about this strong cold air outbreak event, so stay tuned.
MID OF THE MONTH WEATHER FORECAST
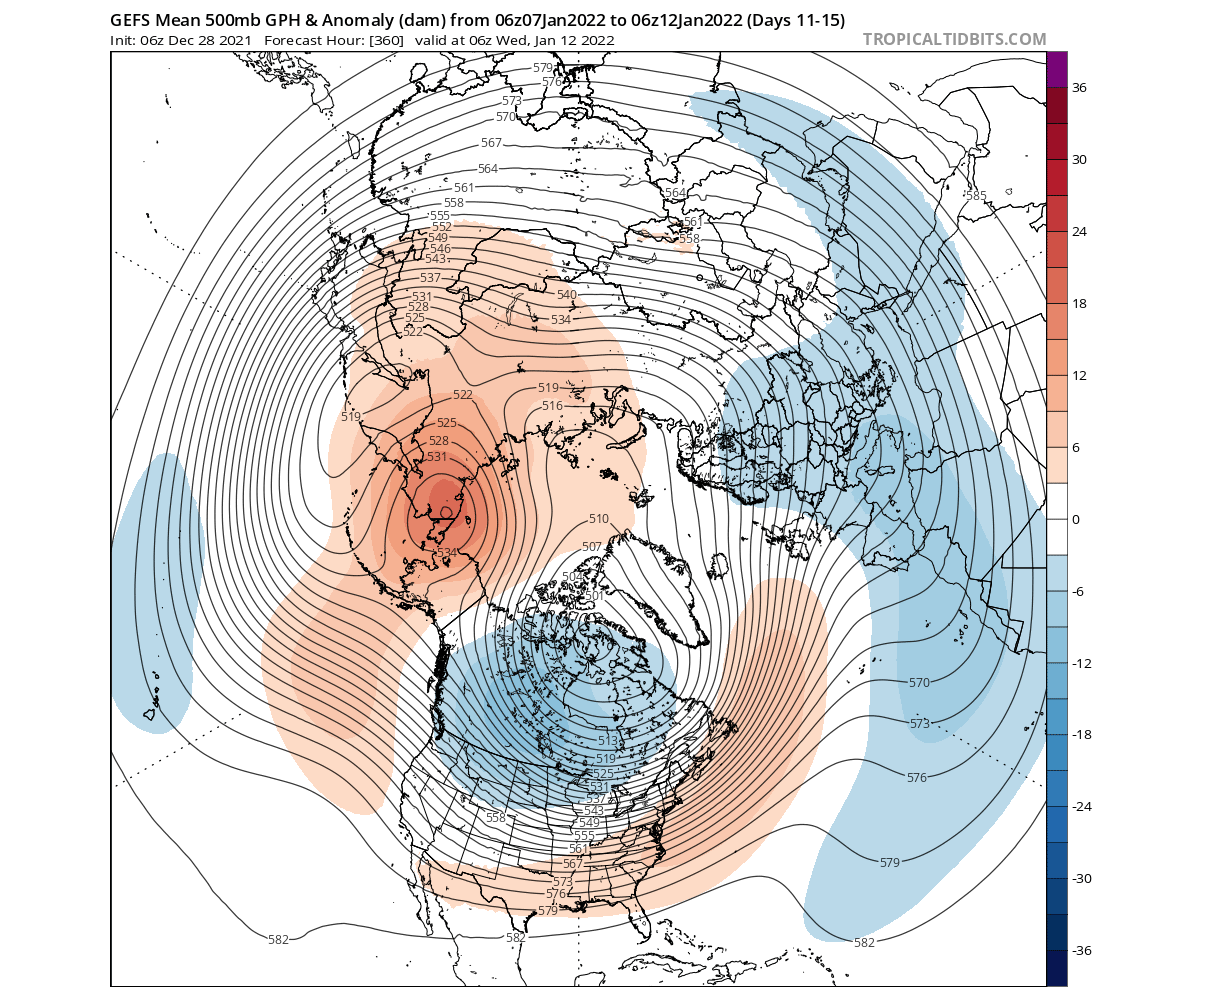
Going into the mid-January period, the pattern persists. Strong blocking high pressure remains over the Aleutians, a classical La Nina, and the MJO phase 7 response. But it is also expanding into the Arctic Circle, keeping the main low-pressure core over Canada and the Northern United States. Ridging remains over the southeastern United States.
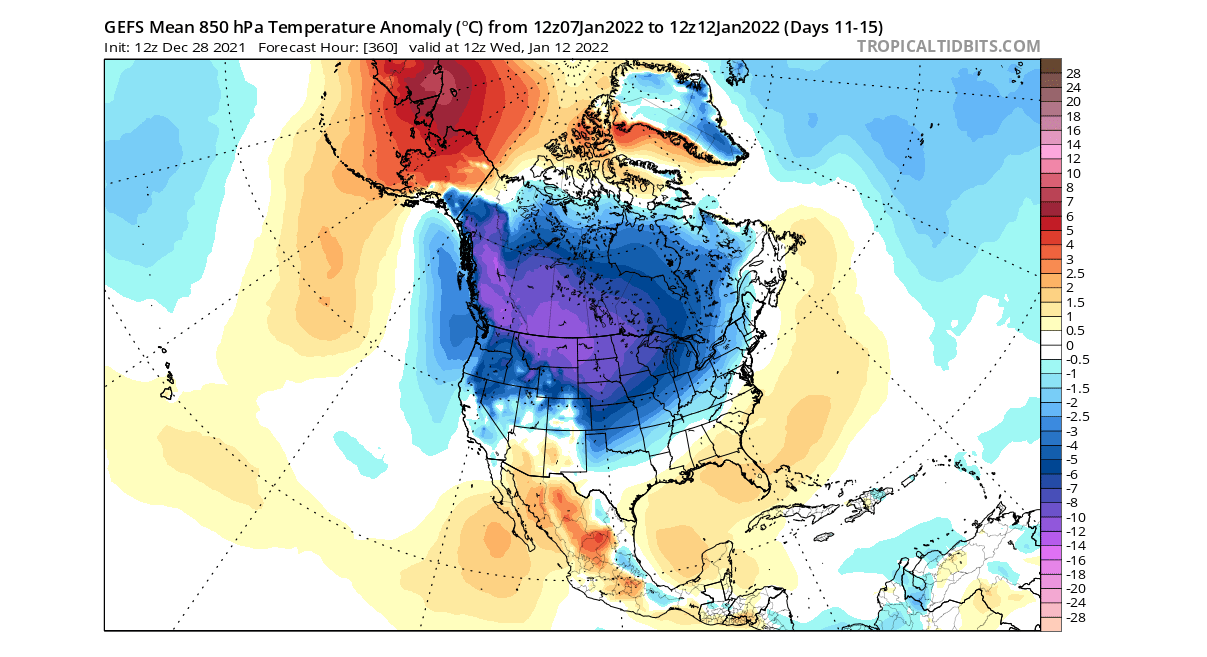
Looking at the temperature forecast in this period, we have a very large area of colder than normal temperatures. Expanding from the northwestern United States, the pressure pattern will be very favorable to release this cold air into the central and eastern parts of the country. For this lead time, these are quite substantial anomalies.
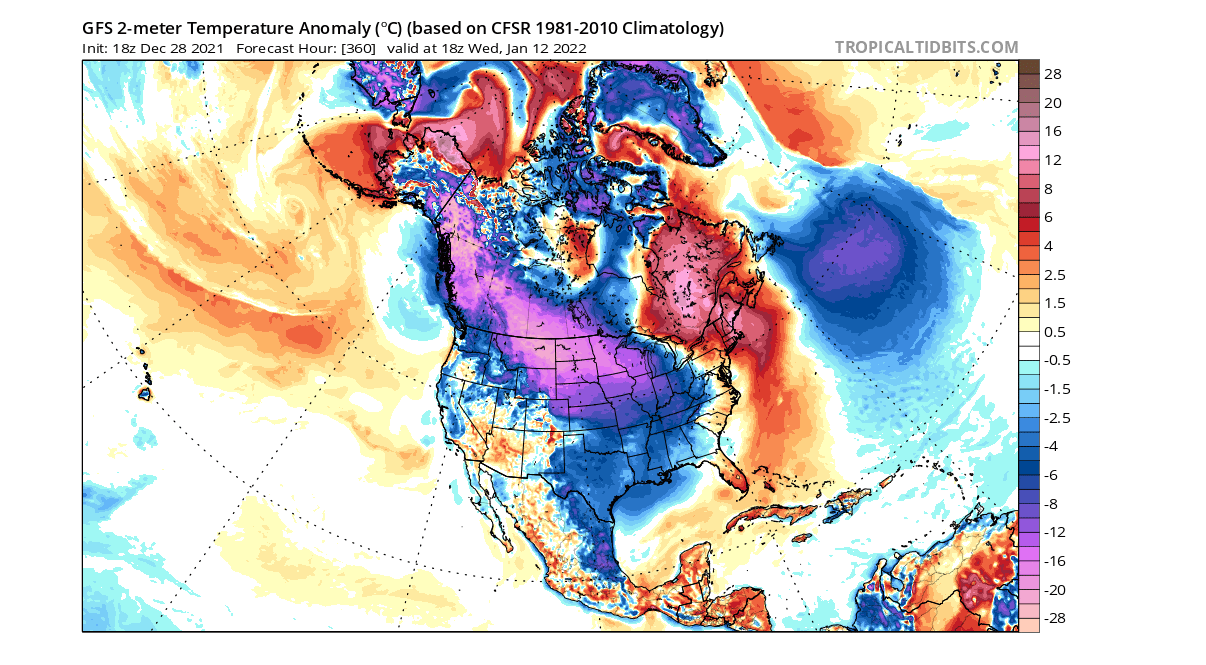
Thanks to that high-pressure system in the Arctic Circle, the jet stream is pushed a bit further south and east. That means easier cold air outbreaks into the central and eastern parts of the United States. Below is an example forecast from the GFS model, showing a potential scenario from this setup.
As you can see, we have a strong cold anomaly expanding from western Canada, over the Midwest into the eastern United States. This is not meant as a definite forecast, but just as a good example of a potential weather scenario from the expected weather pattern adjustments.
WEEKLY WEATHER OUTLOOK
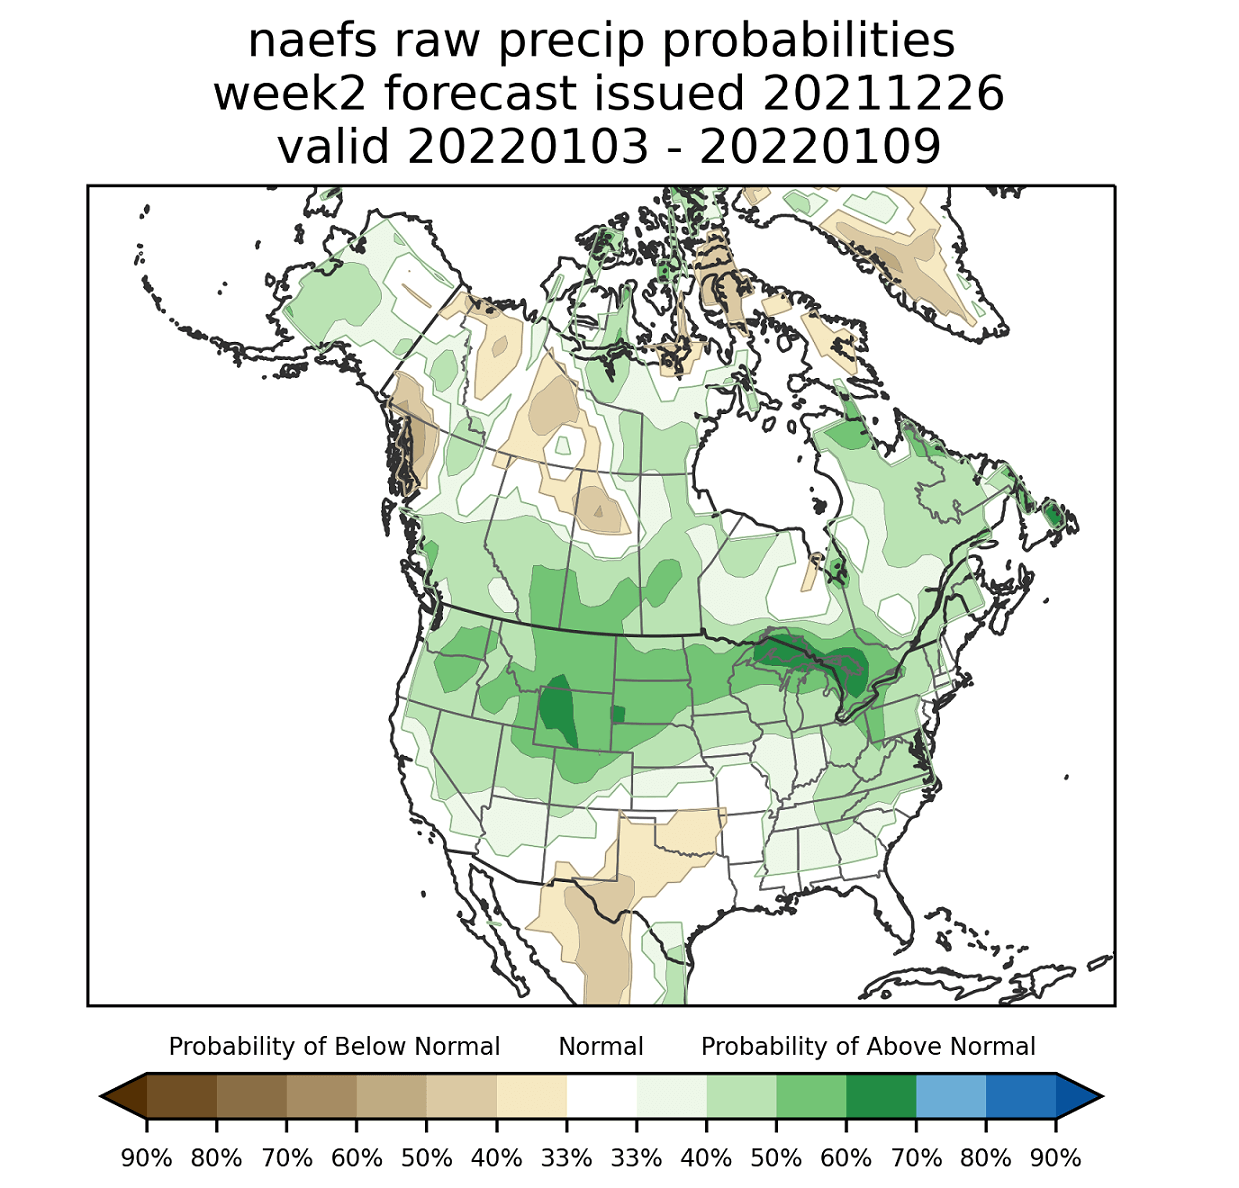
We will add the weekly mean probability forecast, which is based on the NAEFS model. That is a combination of the weather models from both the United States and Canada. It if course shows a very similar solution, with colder air extending out from the northwest into the eastern United States, as the jet stream drops south.

Precipitation-wise, there is a high probability of more precipitation than normal across the northern half of the United States. Coupled with the colder than normal air, this can be an indicator of more snowfall.
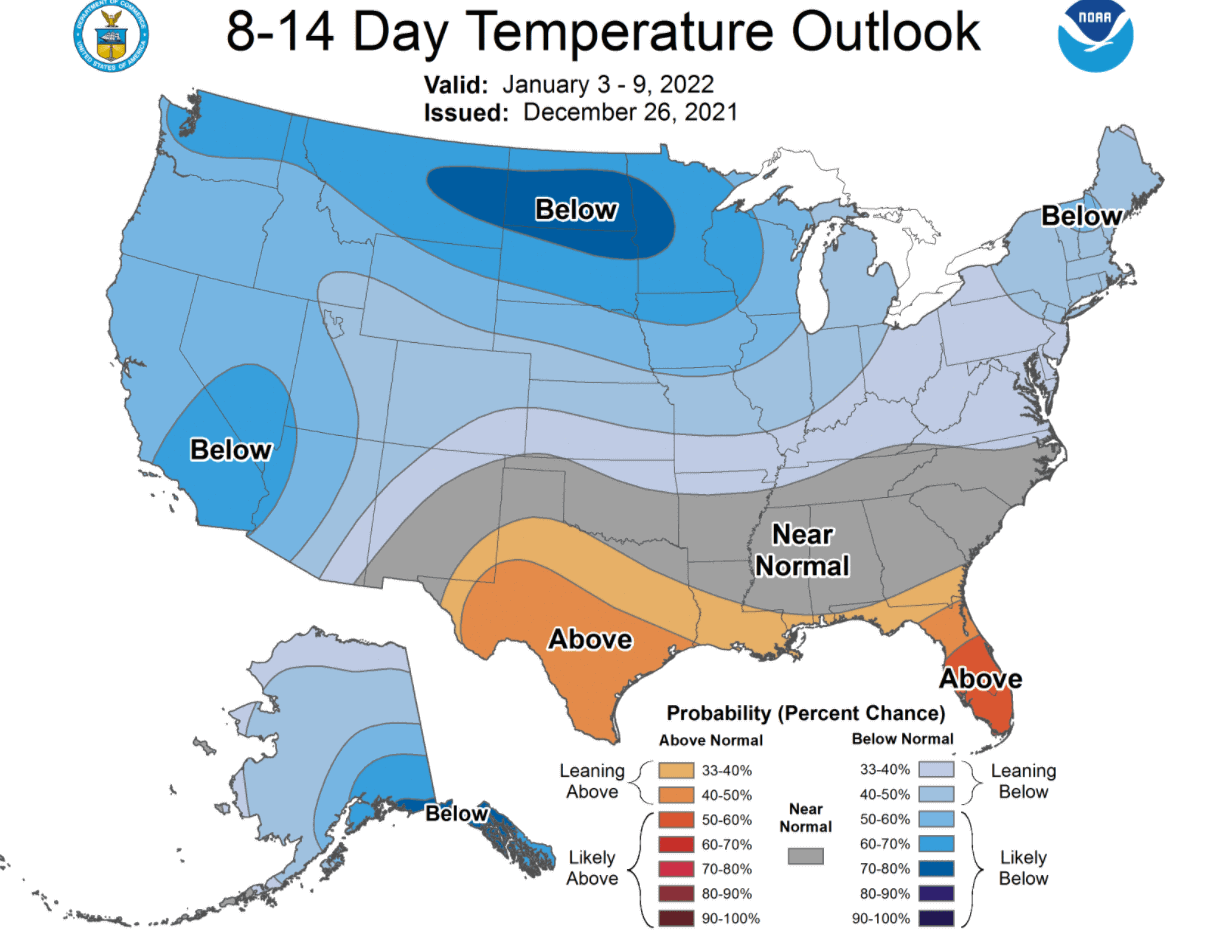
NOAA also regularly releases their 8-14 day forecast for the United States, based on different models and solutions. Below we have the temperature forecast for the early January 2022 period. NOAA calls for colder weather in most of the western and northern United States. The south and southeastern states are expected to remain warmer than normal, but to a lesser degree than in December.
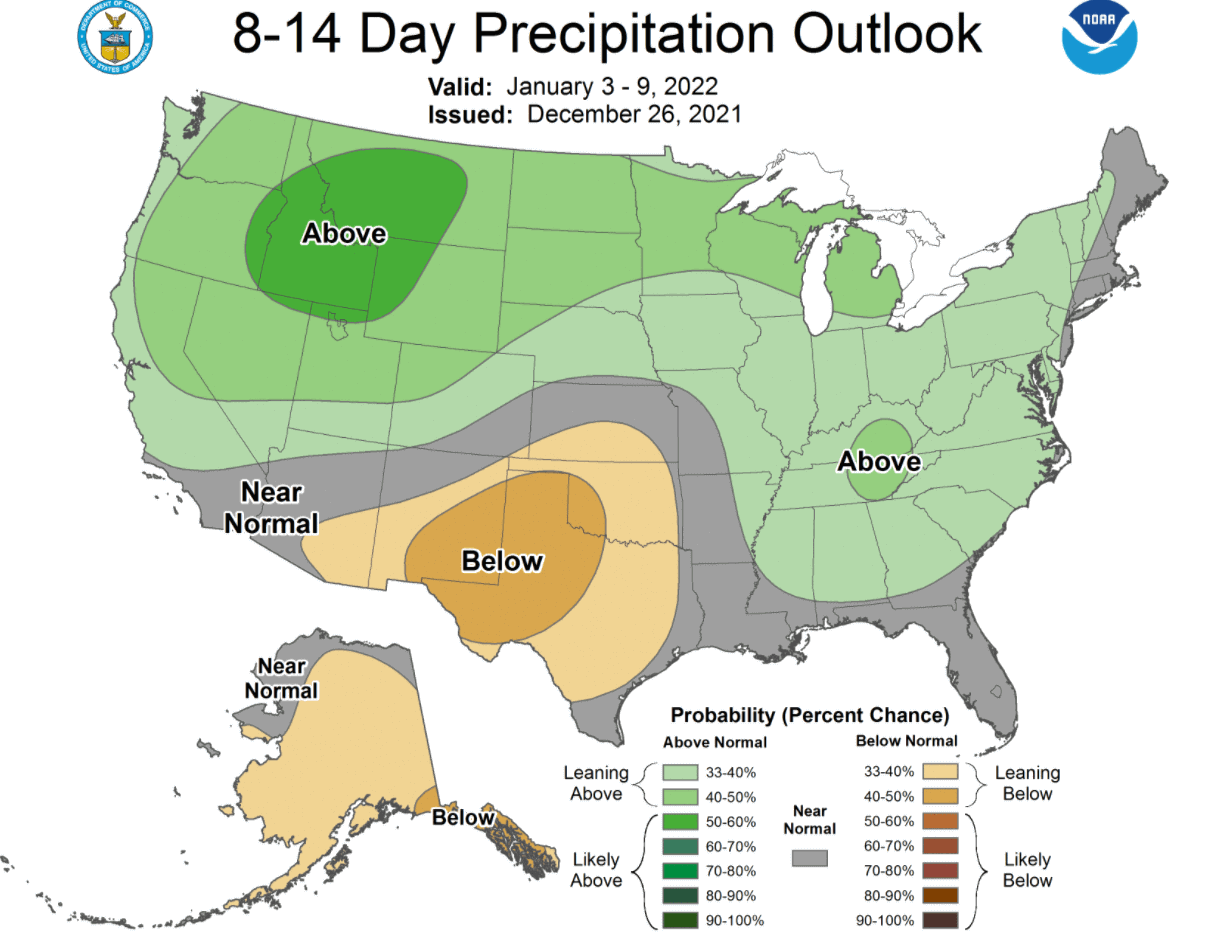
We have the NOAA precipitation outlook below, which calls for normal to above-normal precipitation over most of the United States. One exception is the southern states which are expected to have below-normal precipitation, thanks to the presence of the high-pressure system.
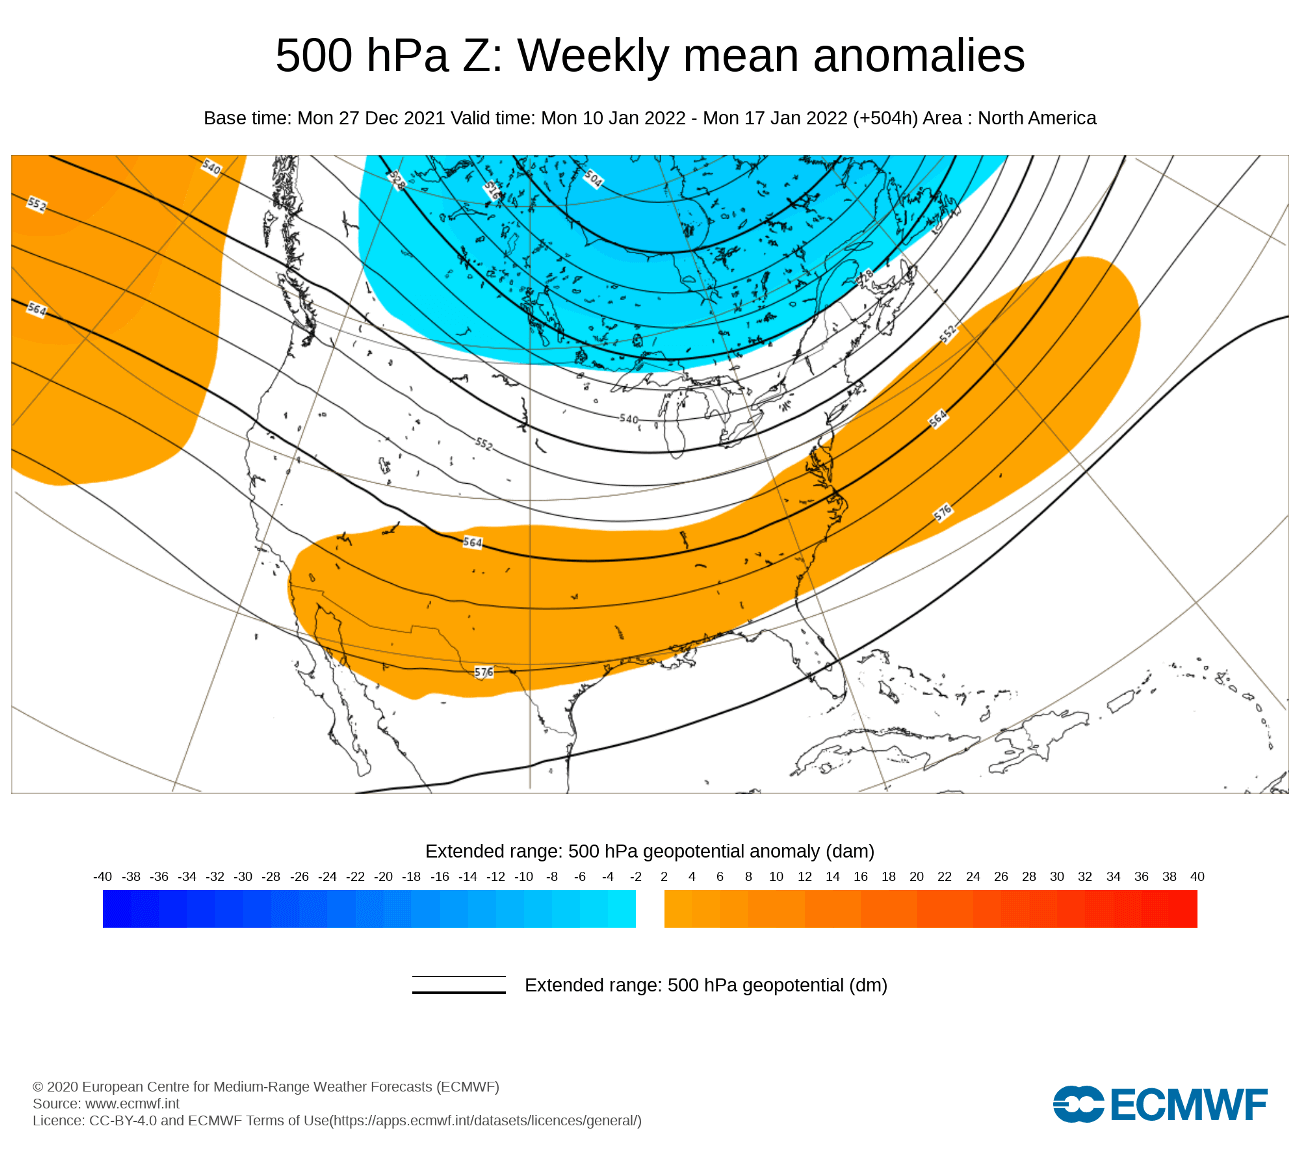
To extend the January 2022 weather outlook deeper into the month, we will look at the weekly forecast from the ECMWF. We will look at the pressure and temperature anomalies over North America going into mid to late January 2022.
JANUARY 2022 ECMWF WEATHER TRENDS
Using the ECMWF ensemble forecast, we can take a look deeper into January. This is the ECMWF extended ensemble prediction system, which is run twice per week.
Looking at the pressure pattern into the mid-month, we see the continuation of the dominant high-pressure system in the North Pacific and low pressure over Canada. This “lockdown” pattern keeps the warm/cold temperature extremes divided into southern/northern United States.
We can see that in the temperature forecast below. Colder than normal air remains over Canada and the northern United States, while southern states are warmer than normal. The exception is the central, eastern, and northeastern states. We see a neutral zone there, indicating a likely transition of cold fronts from the north from the northwest, over the midwest into the eastern United States.
Towards the late month, the pressure pattern is not expected to change much, as the global weather drivers are also likely to remain in a similar state. What we do see is a low-pressure extension further down into the northwestern United States.

Temperature-wise, we see a similar pattern continuing. Colder than normal in Canada and the northern United States and warmer in the south. We do still see a neutral one over the central and eastern parts of the United States, indicating the likely path for colder air outbreaks from the North. The western United States is also expected to be normal to colder than normal.

EARLY 2022 WINTER WEATHER PATTERN
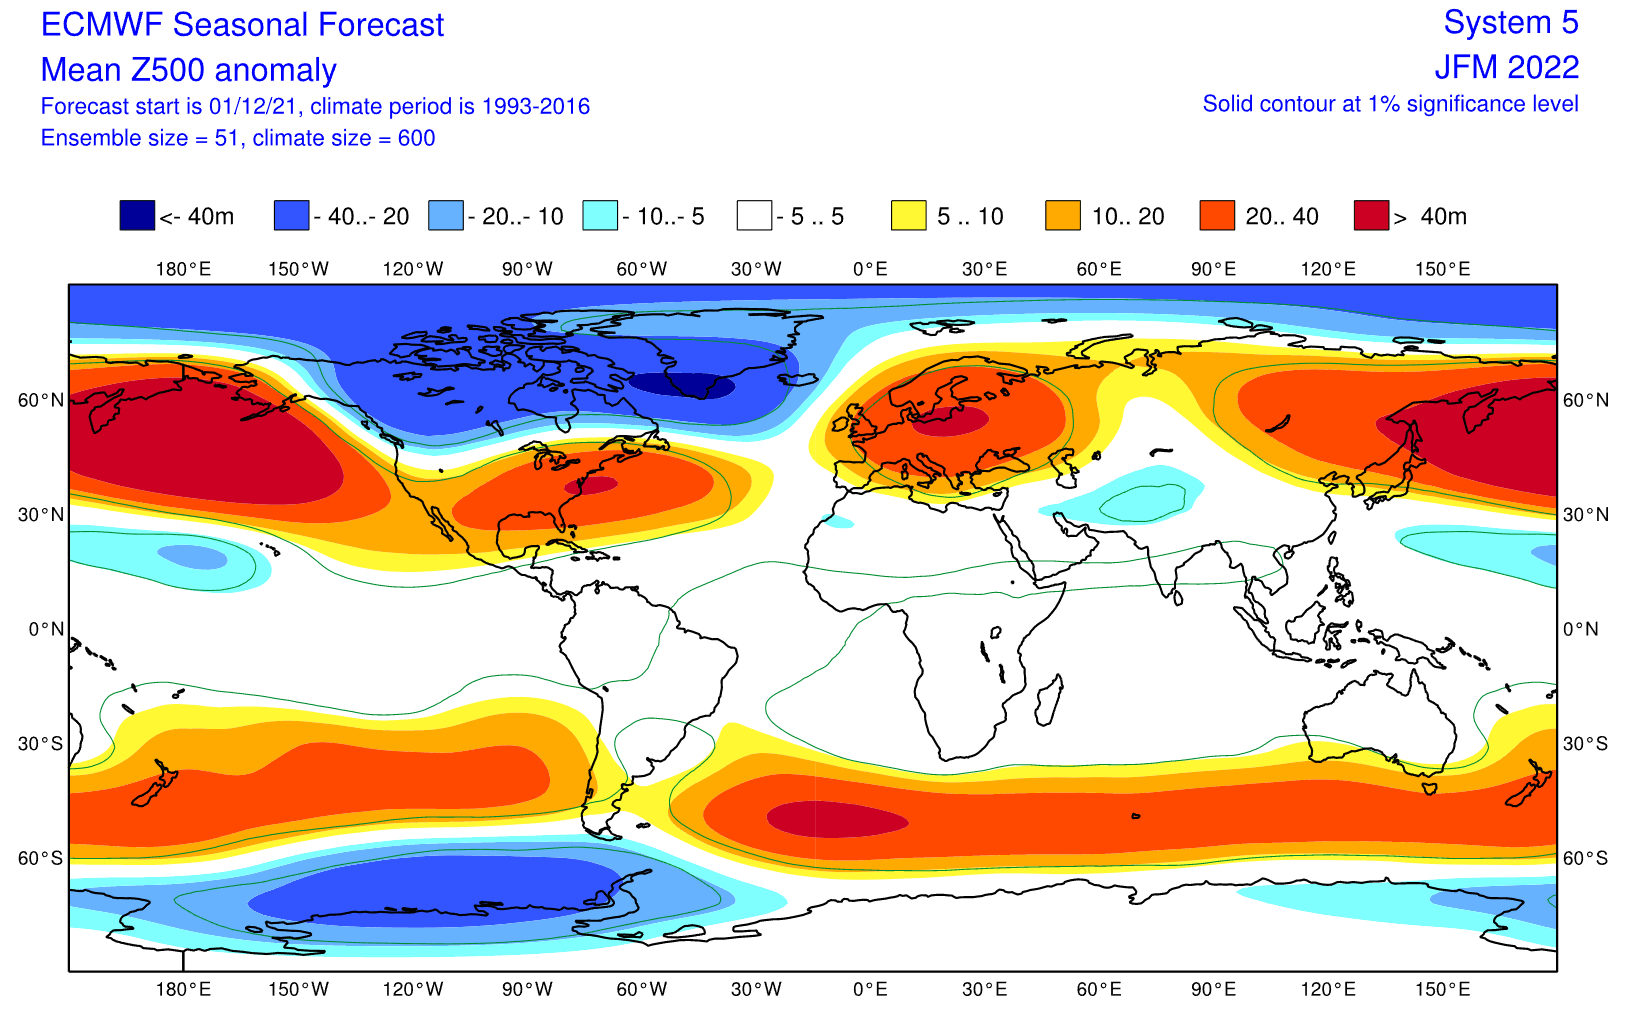
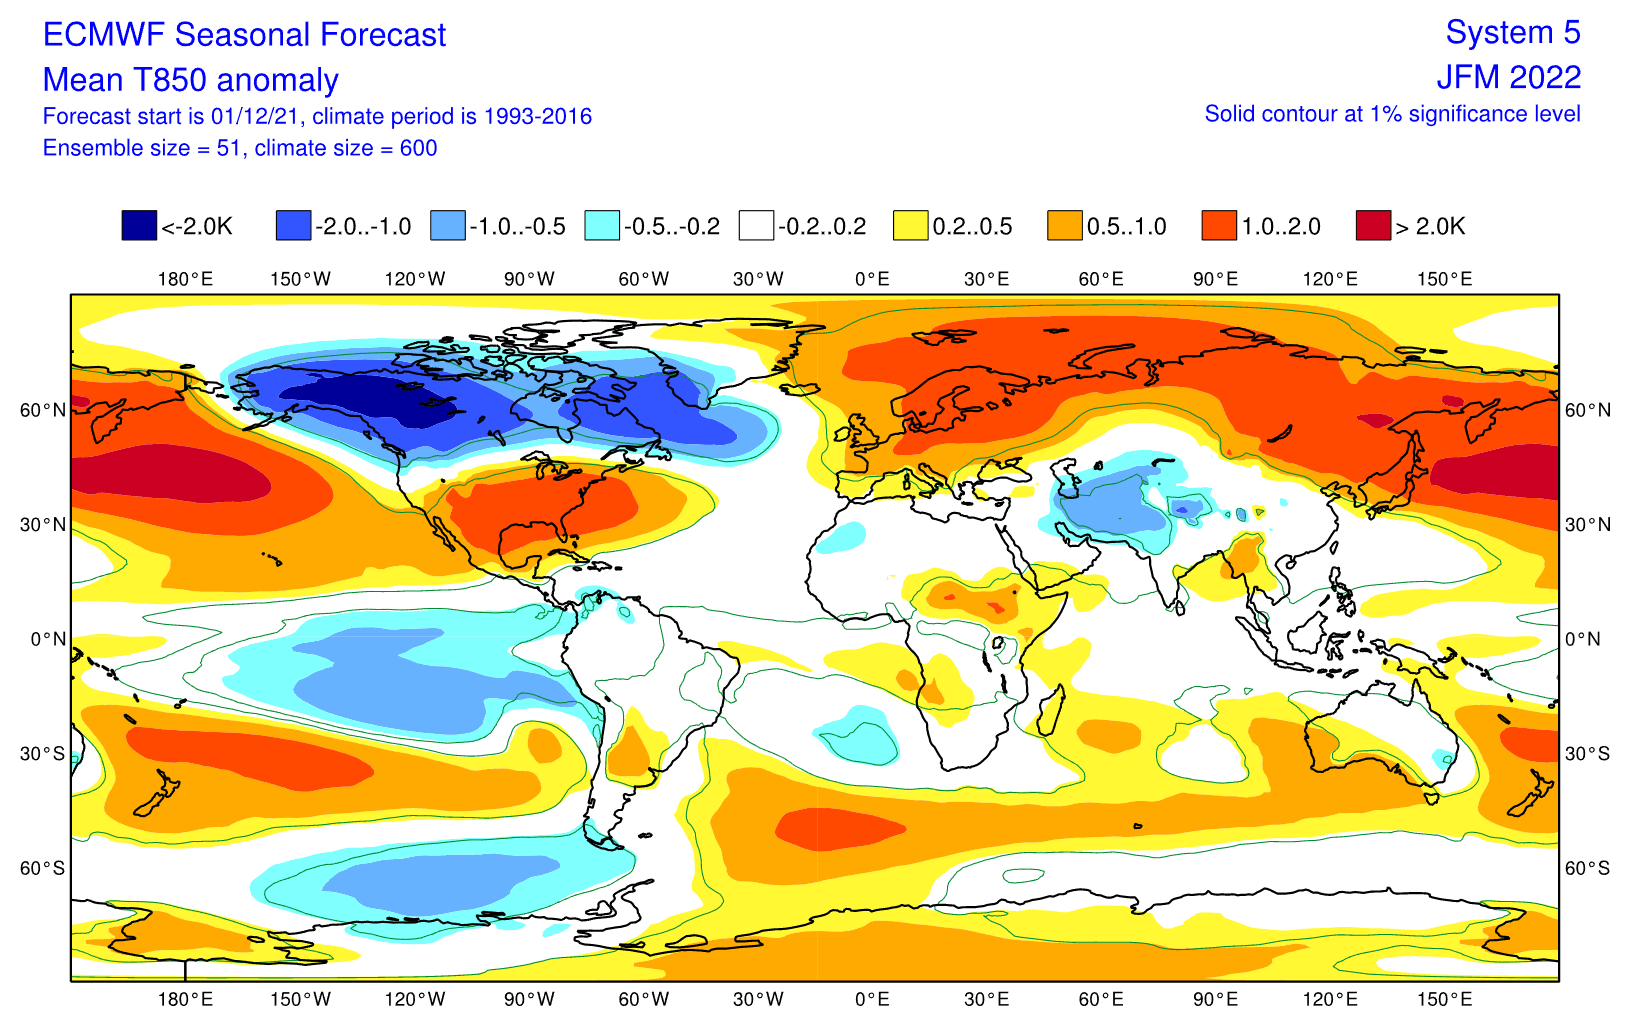
We will quickly look into the seasonal trends for early 2022, using the ECMWF long-range forecast. The period in question is the January-February-March season, so the first meteorological Spring month is included in the forecast. But since the winter months have typically more powerful patterns, the signal from March typically has a weaker contribution to the average.
The forecast contains the latest data and was issued earlier this month. As we can see below on the pressure pattern forecast, the strong high-pressure system in the North Pacific is still present. That is the signature of the La Nina and is likely to stay present well into the early Spring season. Notice the much lower pressure over most of Canada, bending the jet stream into the northwestern United States.
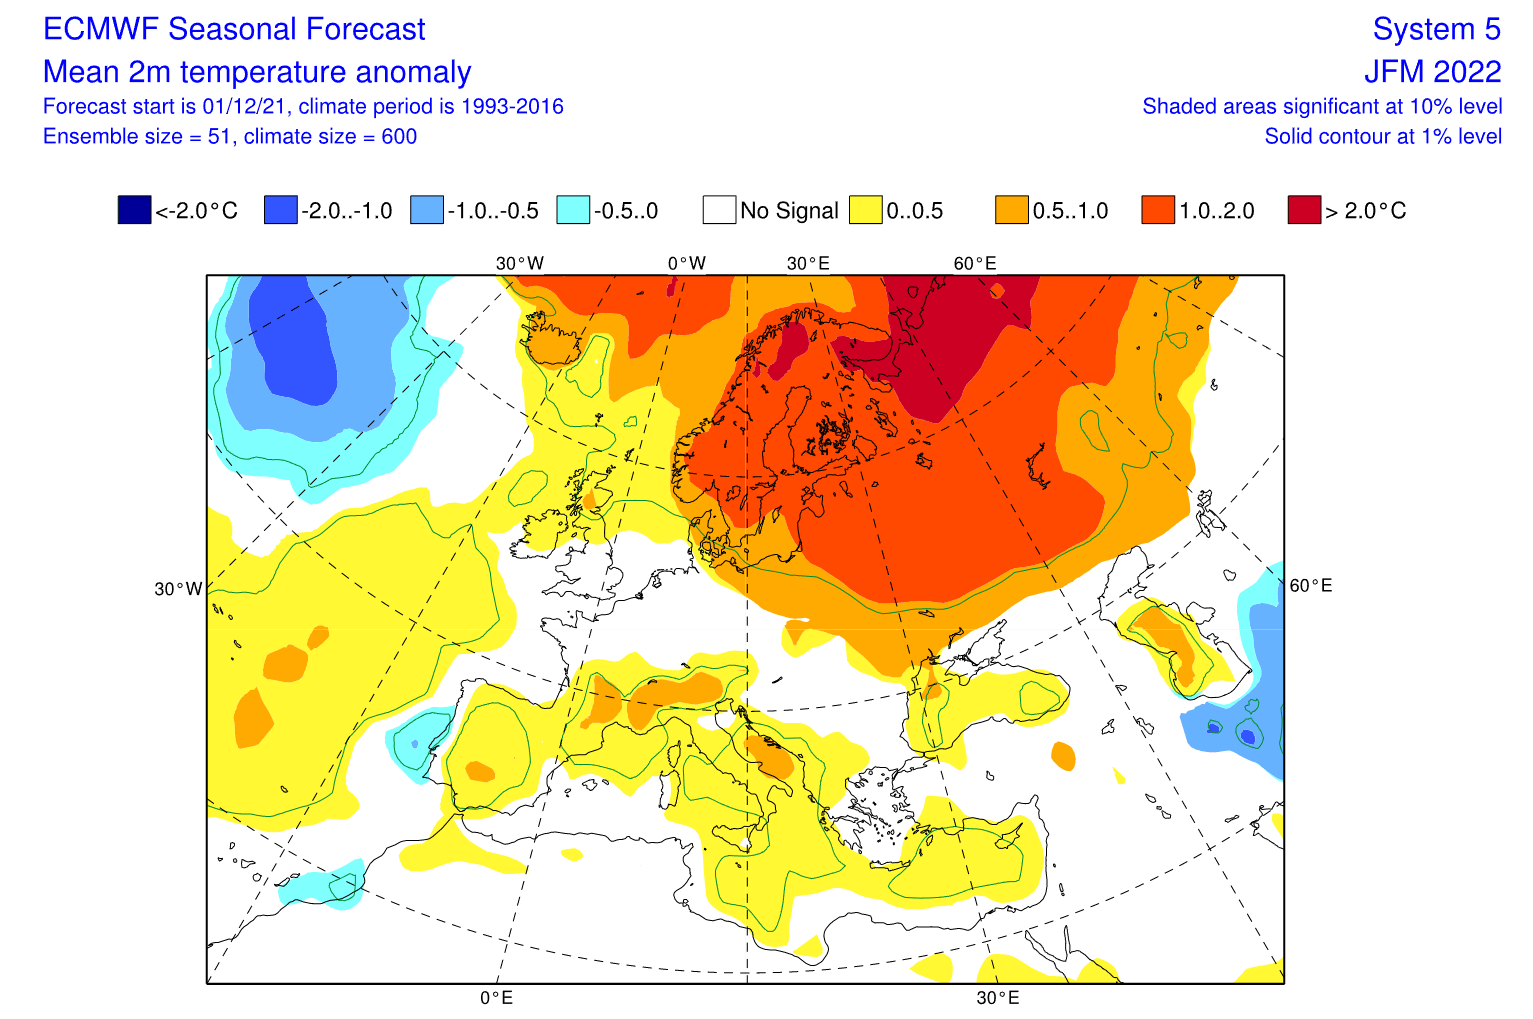
Looking at the global airmass temperatures, we see the strong cold pool in western Canada. That has formed this month and is set to stay till the end of the winter season. Notice the warmer temperatures over much of Europe, which would suggest a pattern change to a more westerly flow, following the colder than normal December.
Looking closer at Europe we see the surface temperatures to be mostly above normal in northern Europe. There is however a neutral zone in parts of central Europe, suggesting that colder air intrusions can continue in January and February. But long-range forecasts only show the prevailing or average picture over the course of 3 months, which can contain a lot of variances.
Over North America, we see the large cold pool over western Canada and Alaska. That comes from the north flow due to the strong high-pressure over the North Pacific. In this pattern, cold air can quickly spread into the midwest and the central United States, as we have seen this month already and in the January 2022 forecast above. It is likely just not frequent enough to skew the seasonal average.

Looking quickly at the global precipitation forecast, we see mostly drier than normal conditions over Europe, under higher pressure. Over North America, more precipitation is forecast over Canada. More precipitation is also forecast over northwestern and northeastern parts of the United States, as is typical in such a pattern. The southern United States is forecast to be normal to drier than normal, expected for a La Nina weather season.

Below we have the official temperature forecast for the United States by NOAA, for the Jan-Feb-Mar 2022 season. It shows the temperature probability, with colder to equal chances in the northern United States. The southern half of the country and the northeast have a higher probability of warmer than normal weather, which we saw in the long-range forecast above.
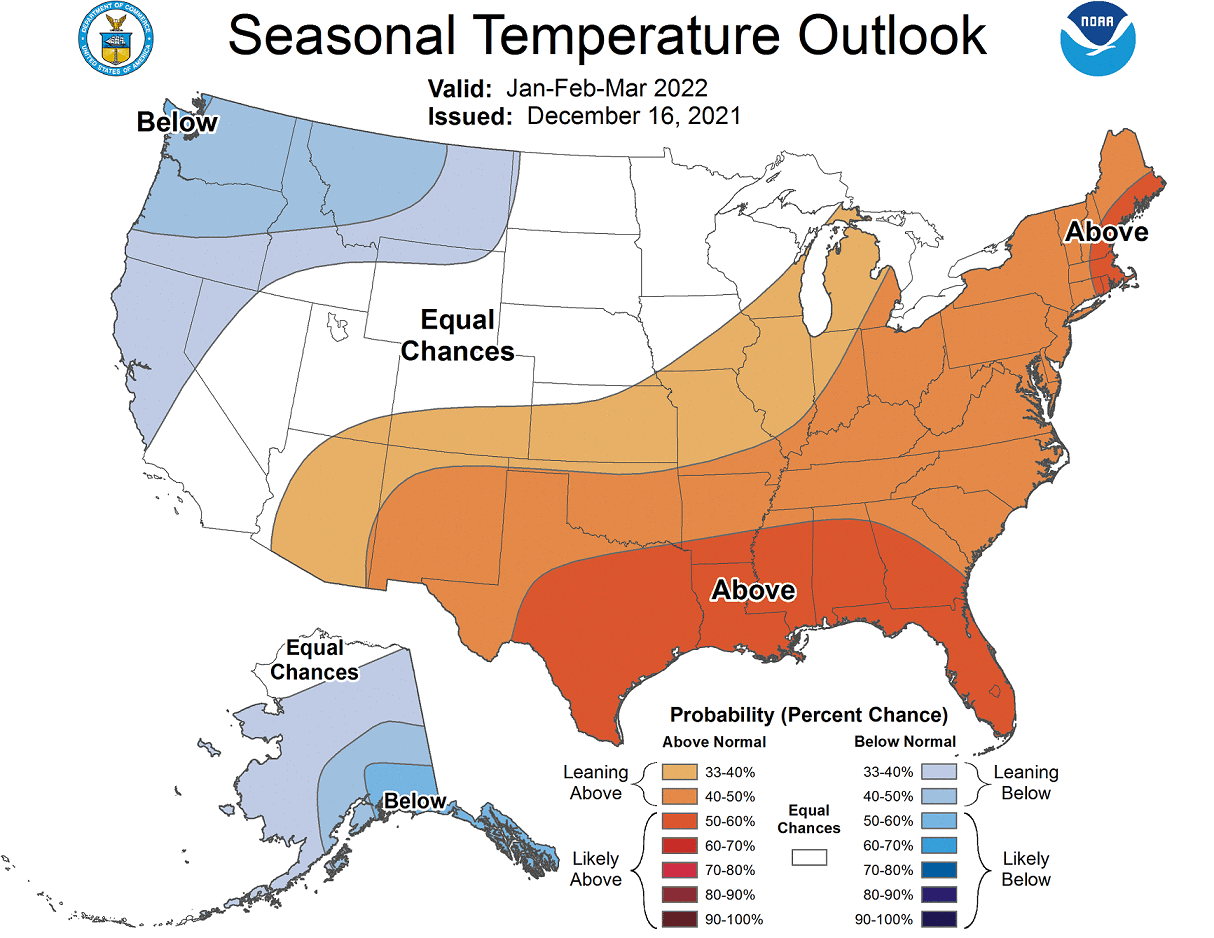
Such a pattern however still allows for strong cold air outbreaks into the Midwest, central states, and the northeast. A strong cold pool will be present in western Canada, which is a strong source of cold air to be sent into the United States as soon as the pressure pattern swing occurs.
The official precipitation forecast also supports the models above. We see an equal-to-higher probability for more precipitation (and snowfall) in the northwestern and the northeastern United States. The Southern United States is forecast to have a drier remainder of the winter season in 2022, thanks to the active cold ENSO phase.

We will release regular weekly and monthly updates as fresh forecasts and data are available. So make sure to bookmark our page. Also, if you have seen this article in the Google App (Discover) feed, click the like button (♥) there to see more of our forecasts and our latest articles on weather and nature in general.
SEE ALSO: