The Gulf Stream has weakened substantially in the past decades, as new data and studies show. Weather in the United States and Europe depends strongly on this ocean current, so it’s important we understand the ongoing changes and what they will mean for our weather in the future.
We will look at the latest 2021 data on the Gulf Stream, where and how it flows, how it changes our weather, and why is it really collapsing so strongly in the last decades. You will also learn what the movie “The Day After Tomorrow” actually got right when collapsing the Gulf Stream.
WHAT IS THE GULF STREAM
But first, what is the Gulf Stream, where can we find it, and what is all the big deal about it?
The Gulf Stream is a powerful ocean current that brings warmer waters up from the Gulf of Mexico into the North Atlantic Ocean. It extends all the way up along the eastern coast of the United States, where it starts to turn towards northwest Europe.
The image below shows a rough outline of the Gulf stream and where it flows across the North Atlantic. It does not actually flow in such a nice straight line, but as you will see, it is very complex and full of swirls.
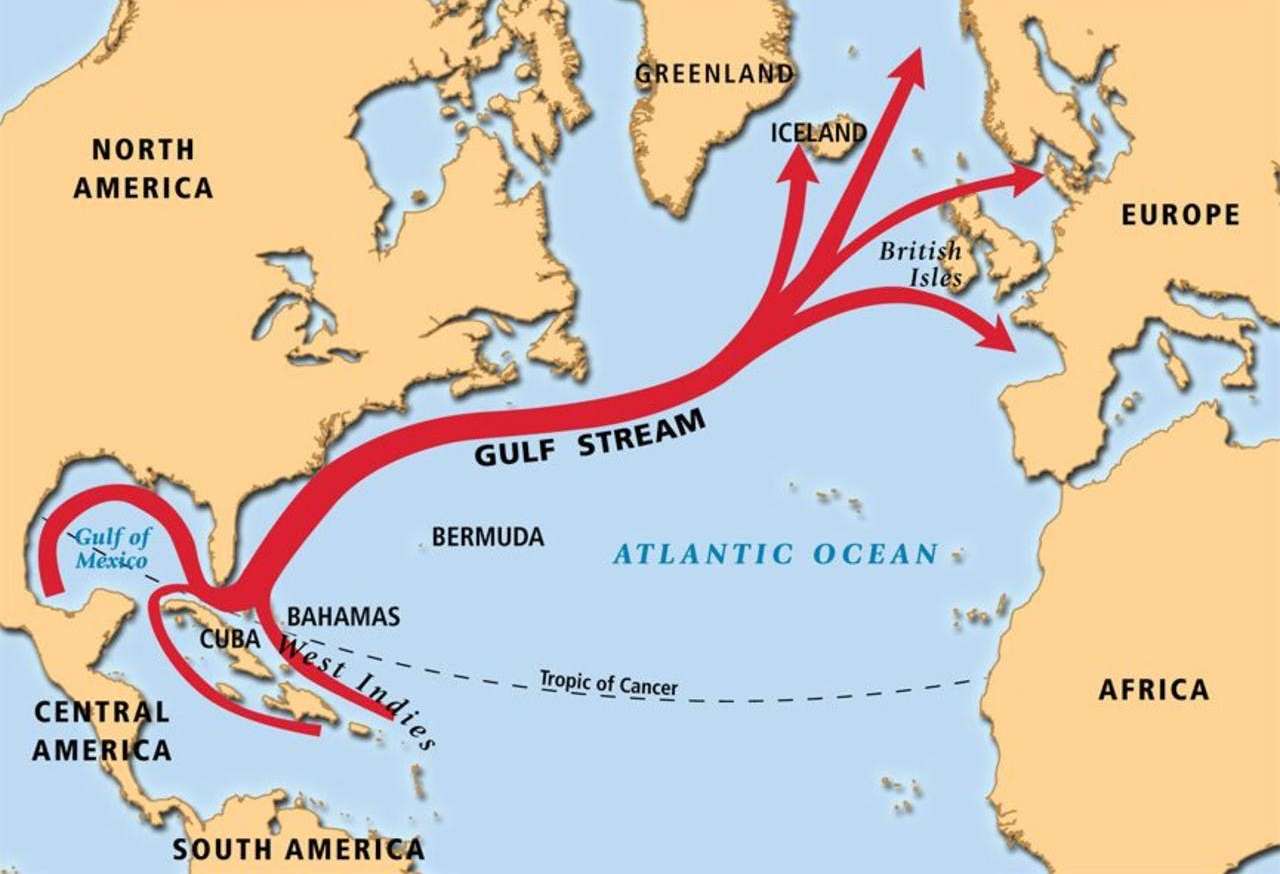
This strong current of warm water directly influences the climate of Florida. Compared to other southeastern states, it keeps temperatures in Florida warmer in the winter and cooler in the summer. Since the Gulf Stream also extends towards Europe, it helps to warm the western European countries, having a major impact on the regional climate.
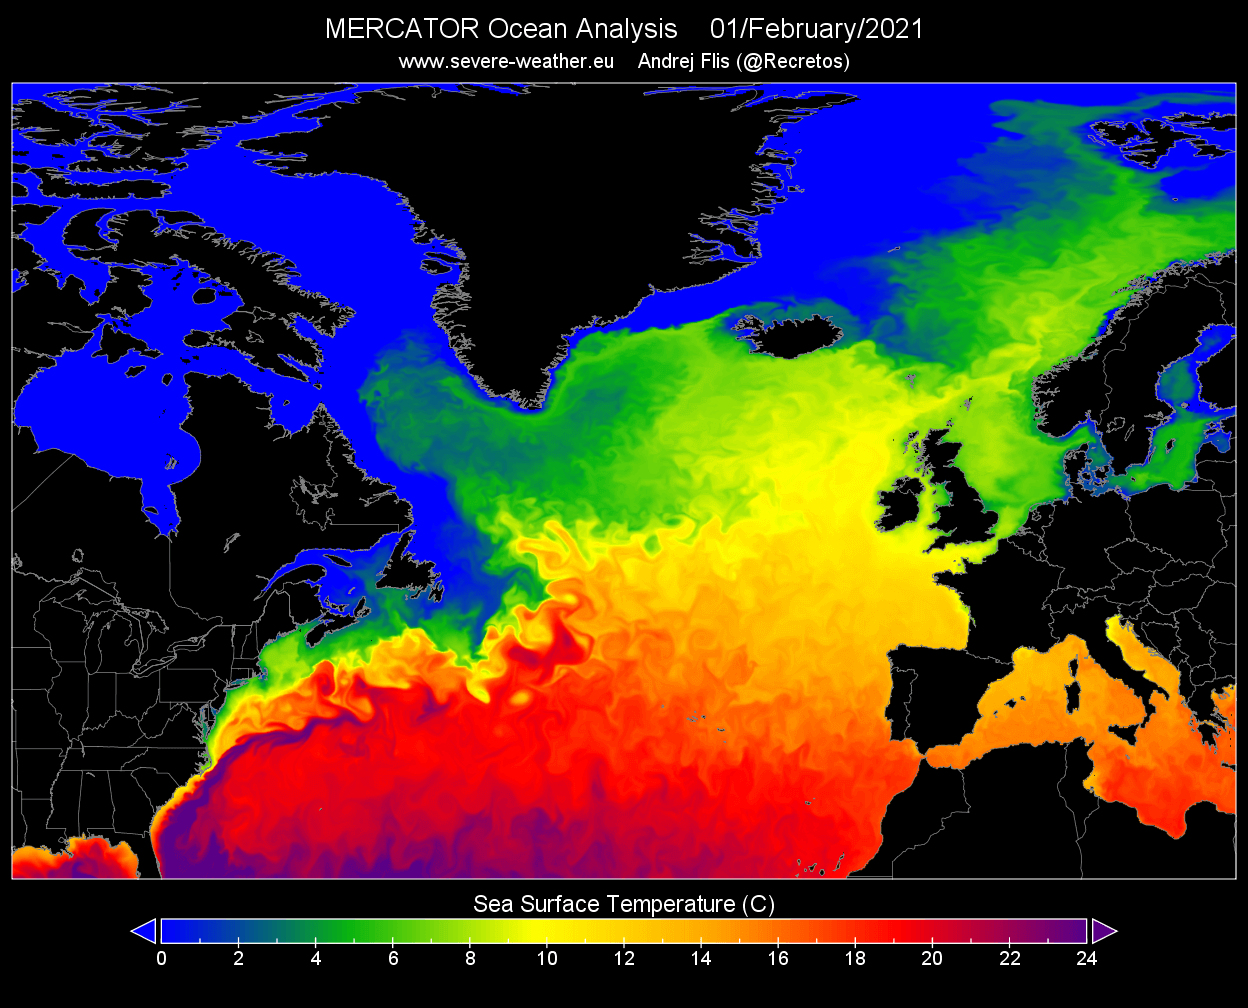
The stream itself can be best seen if we look at the temperature analysis and the ocean surface current speed. The image below shows the latest ocean surface temperature. You can see the warm stream of water moving up along the eastern coast of the United States, extending far into the North Atlantic.

This is the Gulf Stream in all its glory, transporting essential warm waters further up towards the North. As a contrast, you can see the cold Labrador Current flowing down along the east Canadian coast.
We produced a high-resolution video animation, which shows the Gulf Stream in motion. This will nicely show how it flows towards the North Atlantic. The video shows the Winer 2020/2021 period, as the Gulf Stream is best seen in the Winter time when it has the highest temperature contrast.
The Gulf Stream is perhaps seen even better if we look at the movement and speed of the ocean surface currents. On the image below you can see the ocean surface current speed, where the Gulf Stream really stands out and can be seen in its most raw shape and form.
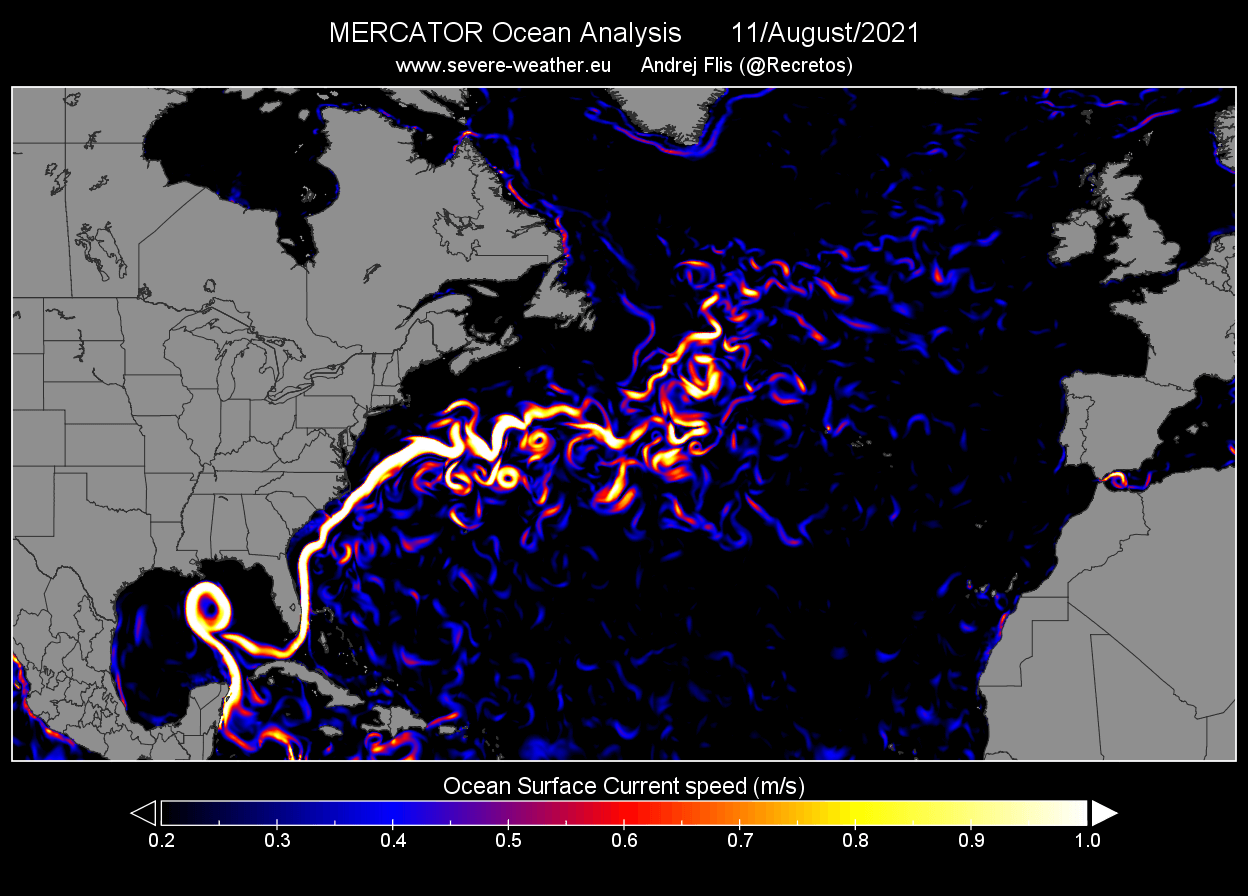
This ocean current does not flow in a straight line, as seen on many graphics. It is actually very complex, with a lot of dynamics and swirling across the North Atlantic. It has a lot of smaller swirls of water, both warm and cold. This is very similar to the way the atmospheric jet stream works.
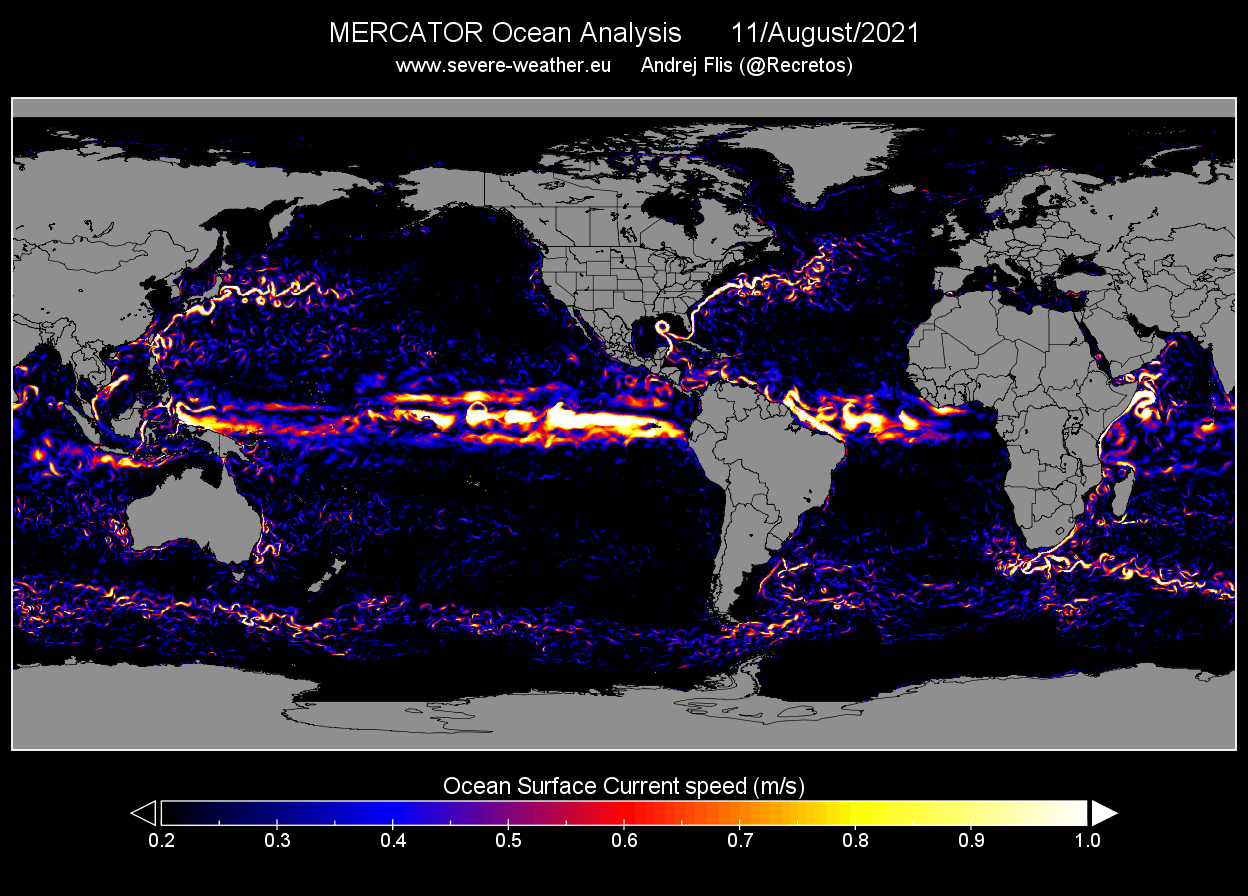
Zooming out to the entire world, we can see that the Gulf Stream is not the only one of its kind. There are many areas with persistent ocean circulation. Most notable is perhaps the Japan Current (Kuroshio), which is very similar to the Gulf Stream in its purpose.
NORTH ATLANTIC OCEAN CURRENTS
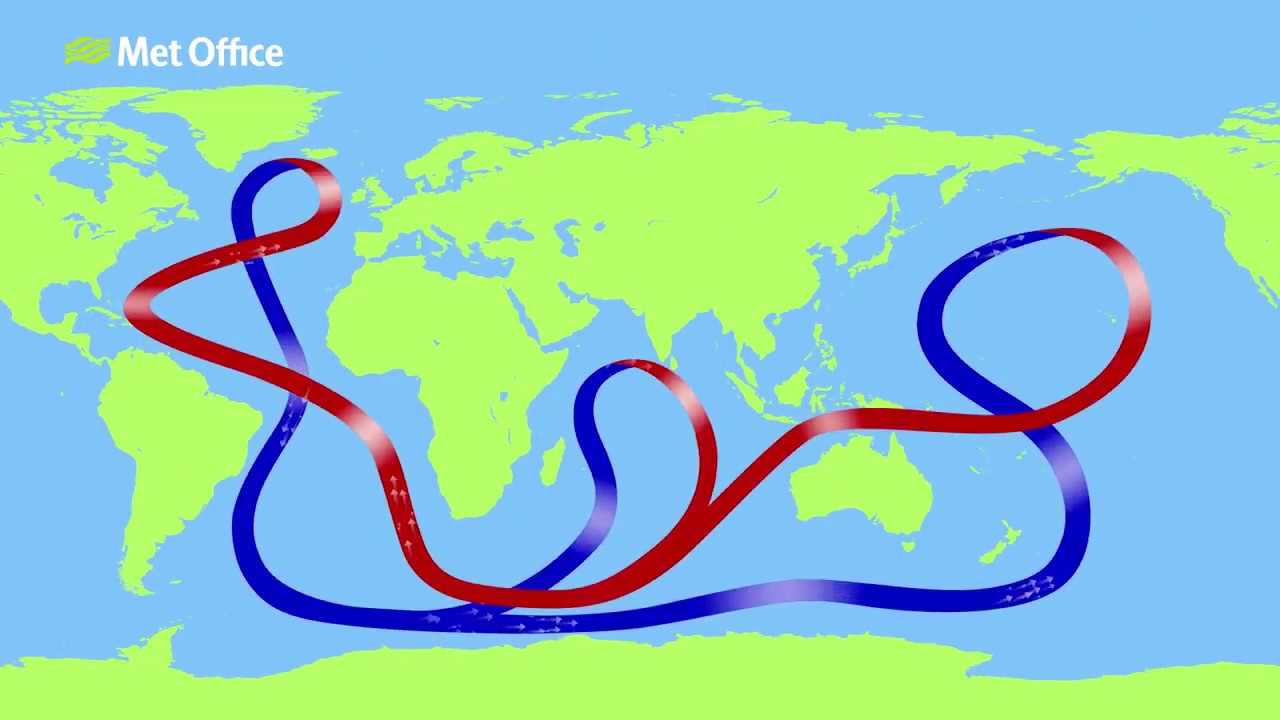
The larger system in which the Gulf Stream flows is called the Atlantic Meridional Overturning Circulation, or AMOC short. The AMOC is a large system of ocean currents in the Atlantic Ocean, driven by differences in temperature and salt content, which affects its density. The Gulf stream is just is the surface part of the AMOC in the North Atlantic.
The image below from the UK Met Office roughly shows the entire global ocean circulation. It has many different names, most notable are the Global Conveyor Belt or the Thermohaline circulation. AMOC is the ocean current system that covers the North and South Atlantic.
But what is actually driving the ocean currents in the North Atlantic?
As the Gulf Stream transports warm waters northwards, it gradually cools, releasing a large part of the heat. Evaporation also occurs along the way, increasing the salt concentration in the ocean.
Lower temperature and a high salt content make the water denser and heavier, so this dense water will sink down into the ocean. Sinking water causes movement and momentum, pulling down more water from the surface, creating a stable flow.
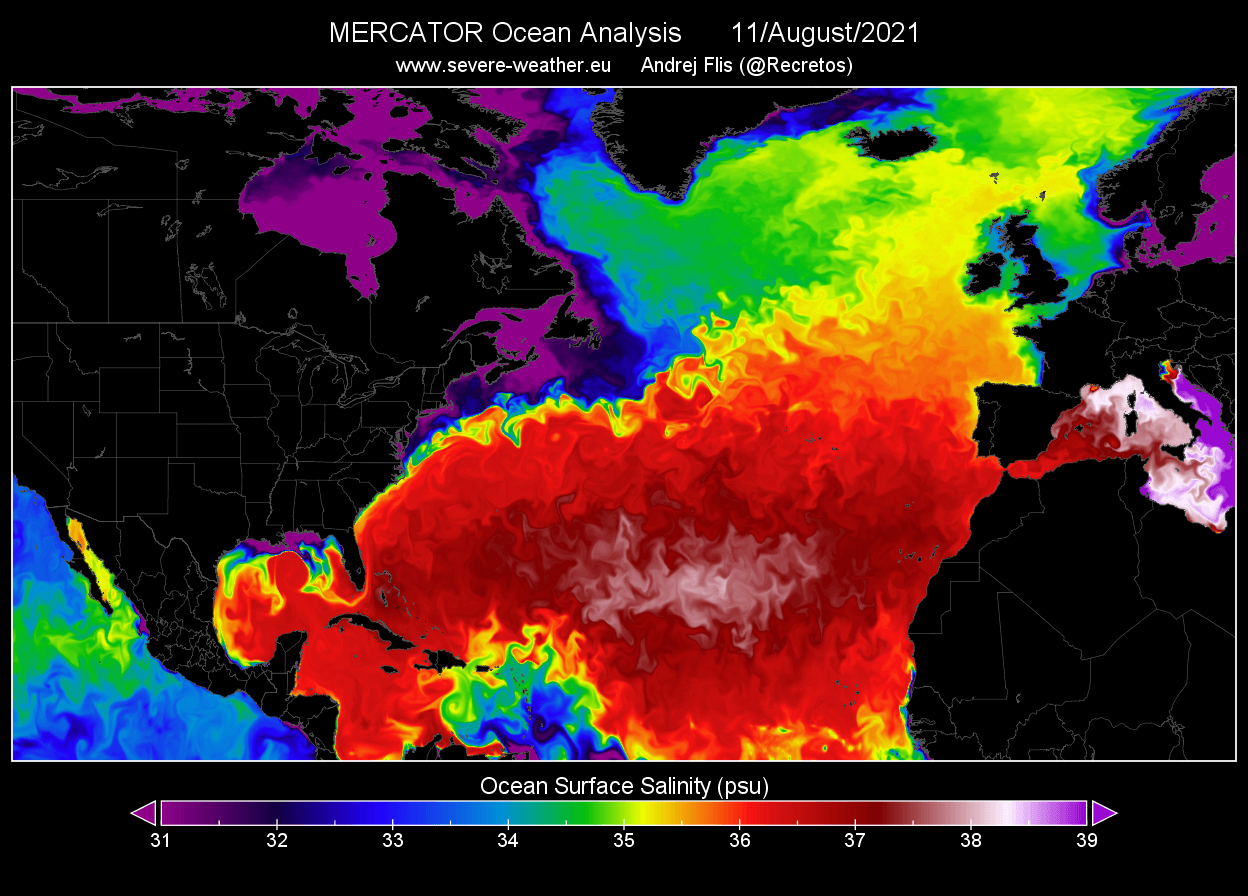
The image below shows ocean surface salinity or the amount of salt in the water. Higher the number, the saltier the water. Above 35, we still have salty waters, so as the water cools, it gets denser (heavier), and sinks down in the far North Atlantic.
The cold, dense water slowly flows southwards, several kilometers below the ocean surface. Eventually, it gets pulled back to the surface and warms in a process called “upwelling” and the circulation is complete.
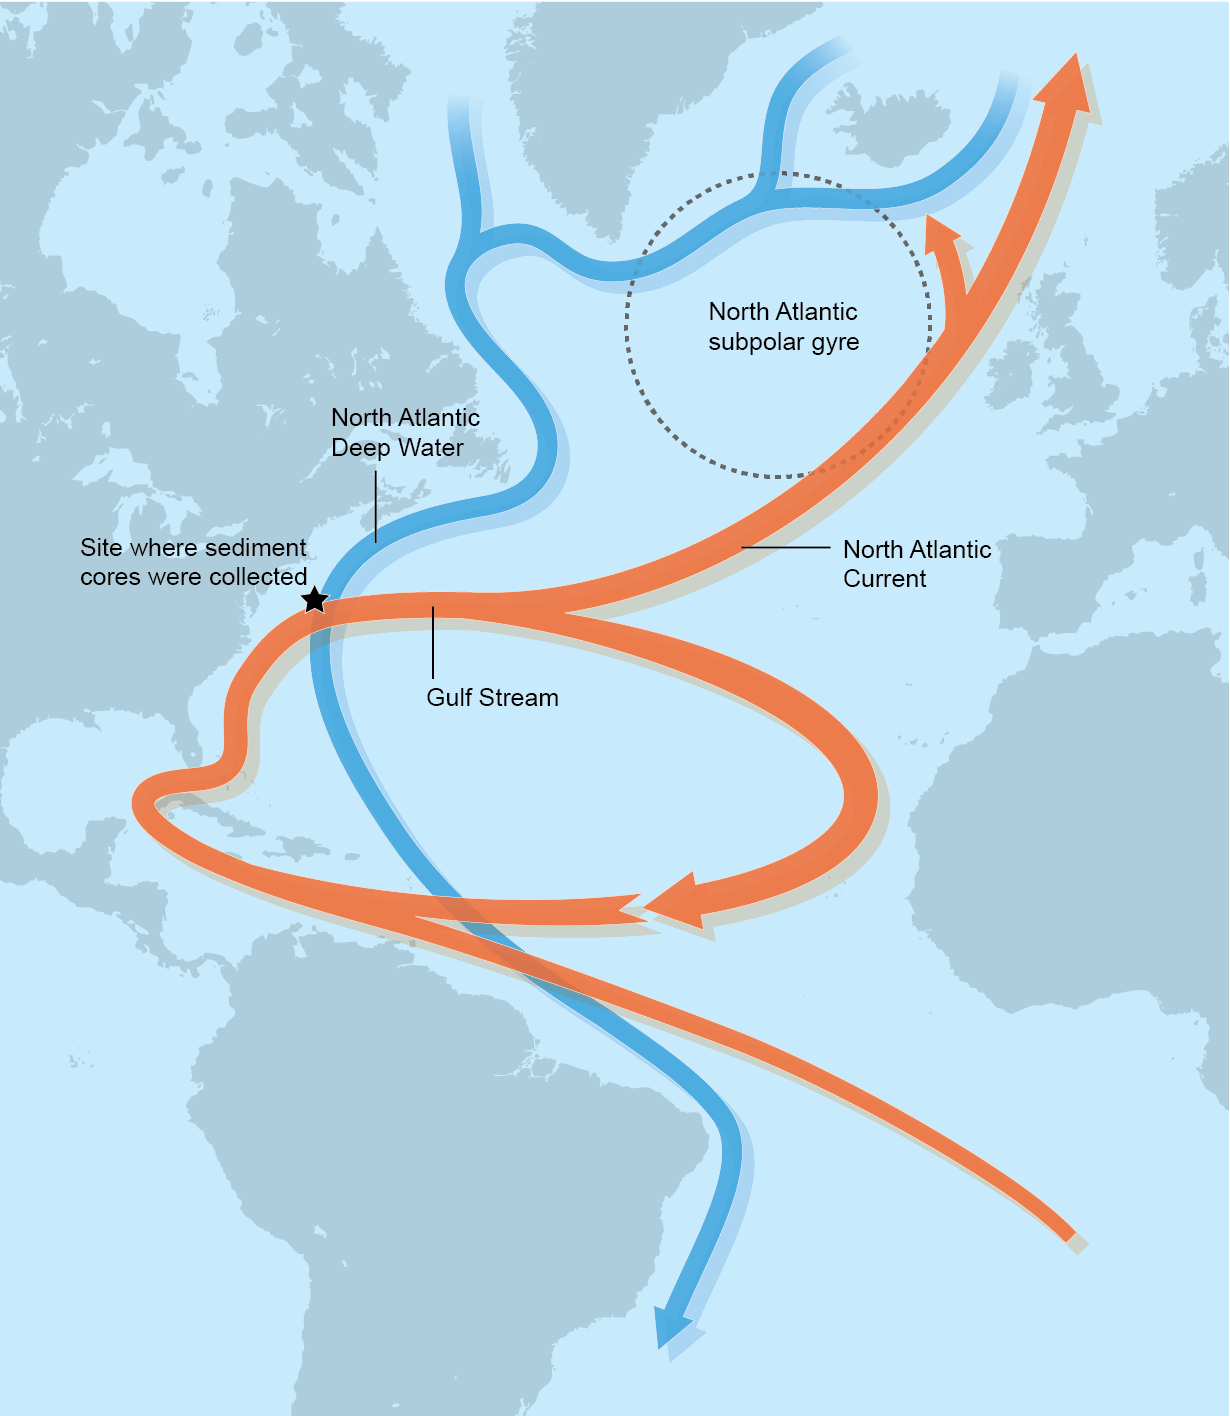
The reason why this is important is that the AMOC is an integral part of the weather and climate in the Northern Hemisphere. It transports a lot of warmer waters and energy towards the northern regions. The image below shows the outline of the North Atlantic part of the AMOC.
We produced a special graphic below, which shows why the Gulf Stream and the Ocean currents, in general, are so important. The image shows the average January surface temperature, in the past 42 years. What you can see is the large temperature difference between the far North Atlantic and Canada for example.
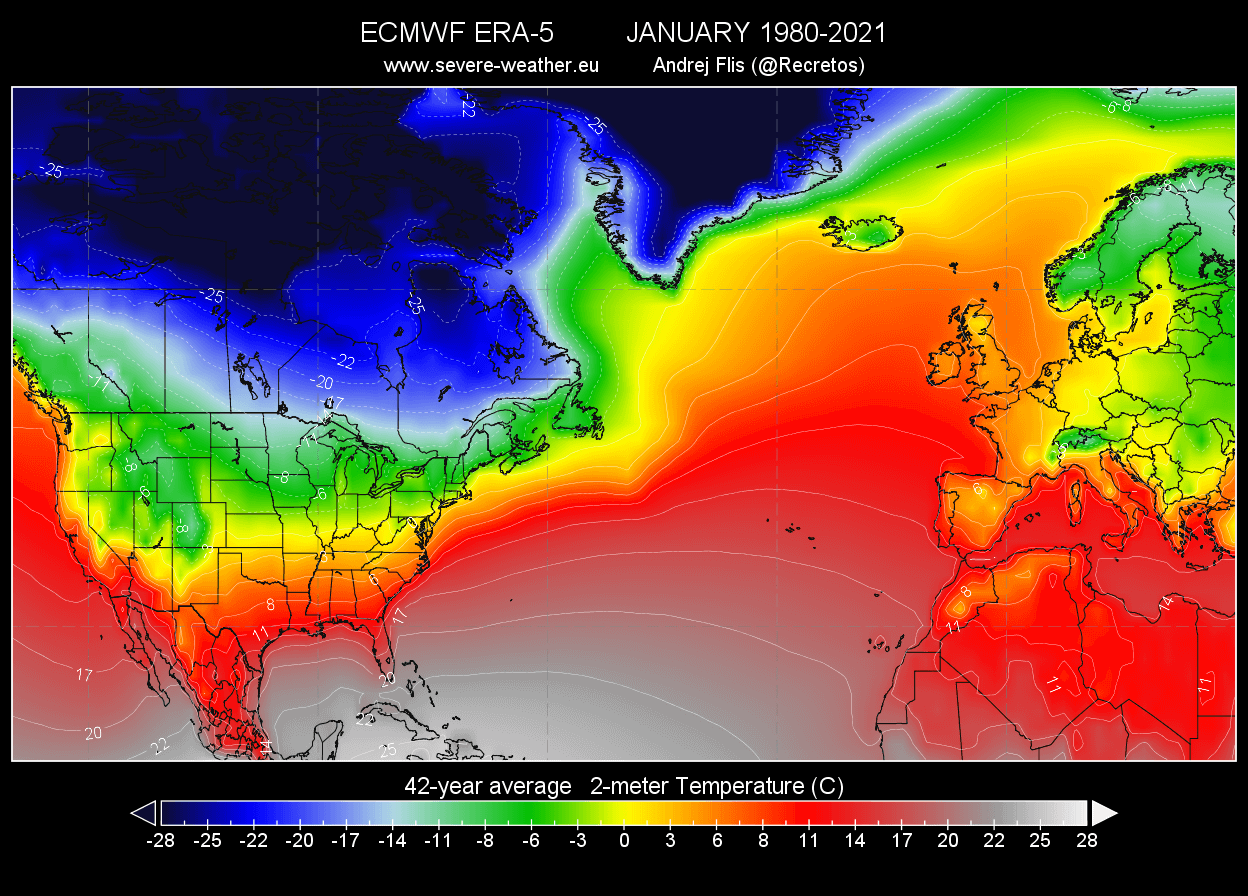
Looking at the same latitude line, for example, 60 degrees North, along the tip of Greenland. You can see that there is almost a 30°C difference between the North Atlantic and southern Canada. Going further North the temperature difference is just as large.
The difference in winter climate between the United Kingdom and southern Canada for example is really big. This is in large part because of the warm Gulf Stream. It brings warmer waters towards the North, keeping the climate milder in Europe.
Since a lot of our readers are more familiar with the Fahrenheit temperature scale, we produced the same graphic, but in Fahrenheit degrees. You can see that the large difference of 50-60 degrees F, between the far North Atlantic and southern Canada for example.

You can also see the warmer climate along the east coast of the United States. This is also partially affected by the warm ocean current. But as you will see further down in the article, the Gulf Stream can also have a negative impact on weather in the United States.
But first, focusing on the far North Atlantic part of the AMOC, we can see that it is quite complex. Warmer waters are being transported far beyond the British Isles and Iceland, reaching deep into the Arctic Ocean.
If you look at the actual ocean temperatures from this February, you can see positive temperatures 6-10 degrees C (43-50 degrees F) reaching into the Polar Circle. dark blue temperatures are indicating sea ice. We used the Winter (February) data when the temperature contrast is greatest, and the warm ocean currents are most nicely seen.
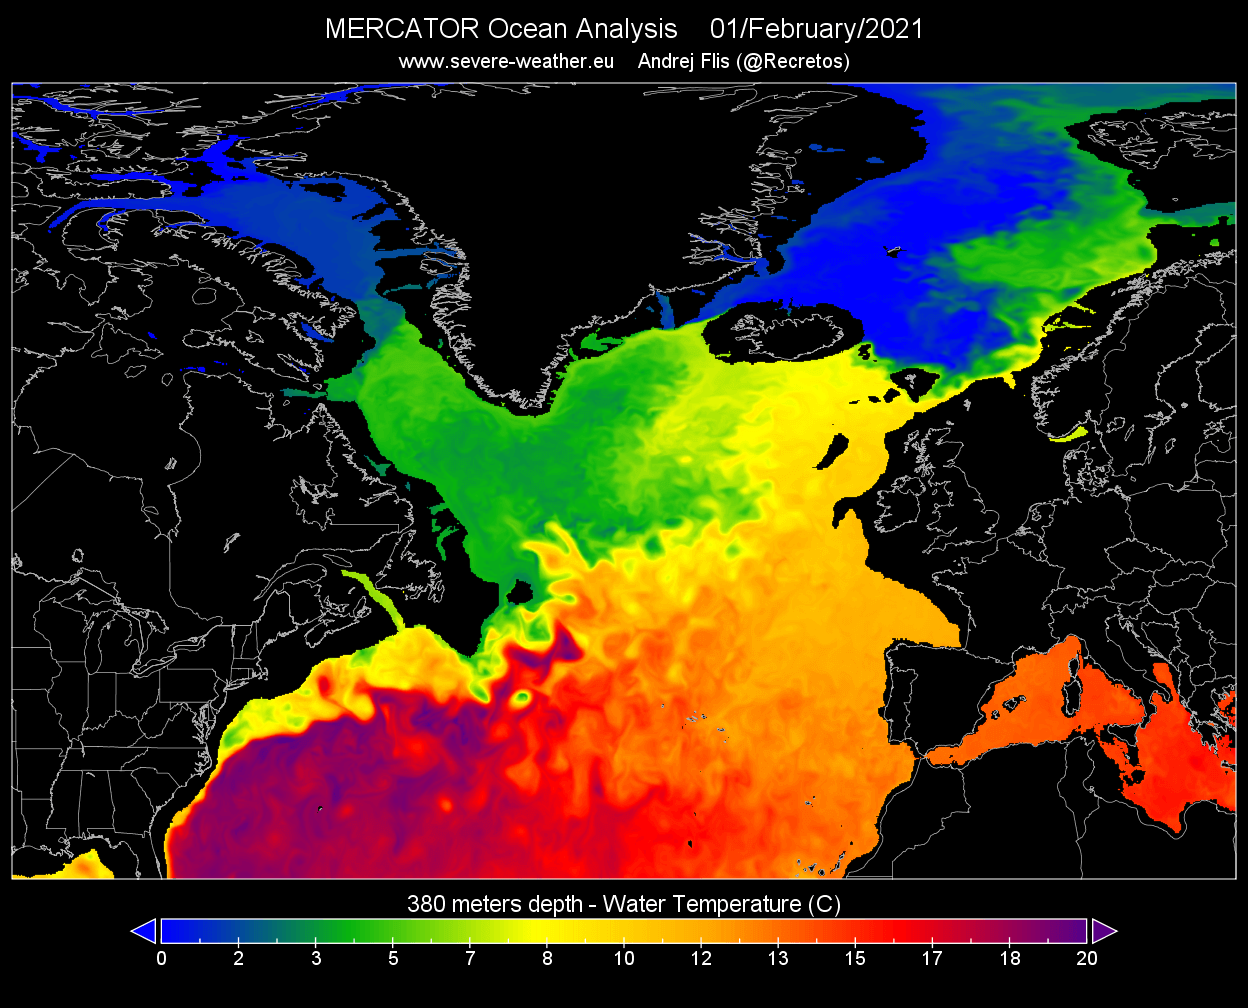
If we look deeper down below the surface, at around 380 meters (1240ft), the Gulf Stream is still nicely seen. But you can also better see the colder waters south of Greenland, where the ocean current sinks down as it is denser.
Still going further down, to around 1200 meters (4000ft), we reach the very bottom of the Gulf Stream. We can hardly see the warm stream standing out, as we have warmer ocean temperatures further towards the east, around the European continental shelf.

GULF STREAM WEAKENING AND COLLAPSE
There is growing awareness that AMOC might shut down at some point, making the movie “The day after tomorrow” a reality. In that famous movie, the AMOC has completely shut down, pushing the world into a new ice age.
The movie is not really accurate science-wise, as these global changes do not happen in just three days. Even tho the reality is somewhat different than the movie, we will look at the state of the Gulf Stream, which shows that this ocean current is indeed weakening.
Going directly at the main point, we have a graphic below, which shows the strength of the AMOC over the past centuries. Of course, these are reconstructions, based on “proxy data”, like coral data, ocean sediments, and land-based data.
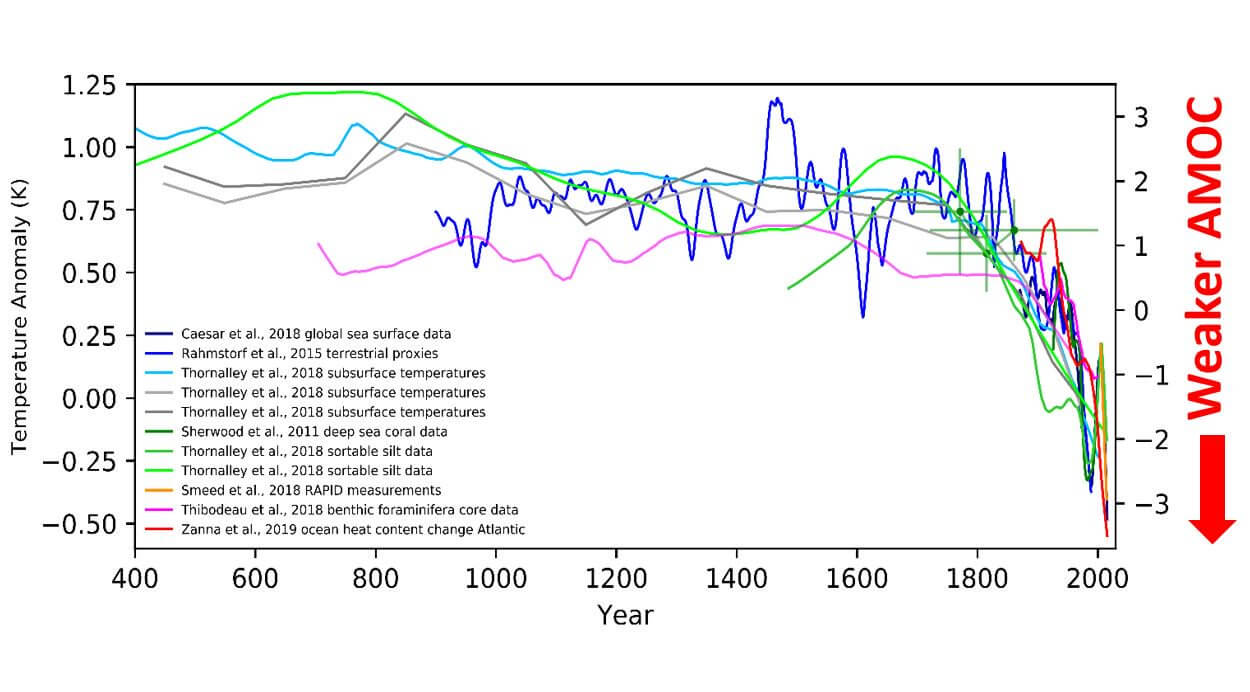
The important takeaway is that we can see an intense weakening of the AMOC in the past 200 years. This proxy data agrees with the modern instrument observations. That gives it great confidence for the historical reconstruction part.
Most often, the ocean temperatures are being used to determine the state/strength of the Gulf Stream and the entire North Atlantic current circulation.
The image below shows the North Atlantic ocean divided into two areas. At the eastern coast of the United States, we have the warm Gulf Stream area. Towards the north, we have the blue area, where the Gulf Stream releases its heat and sinks down into the depths.
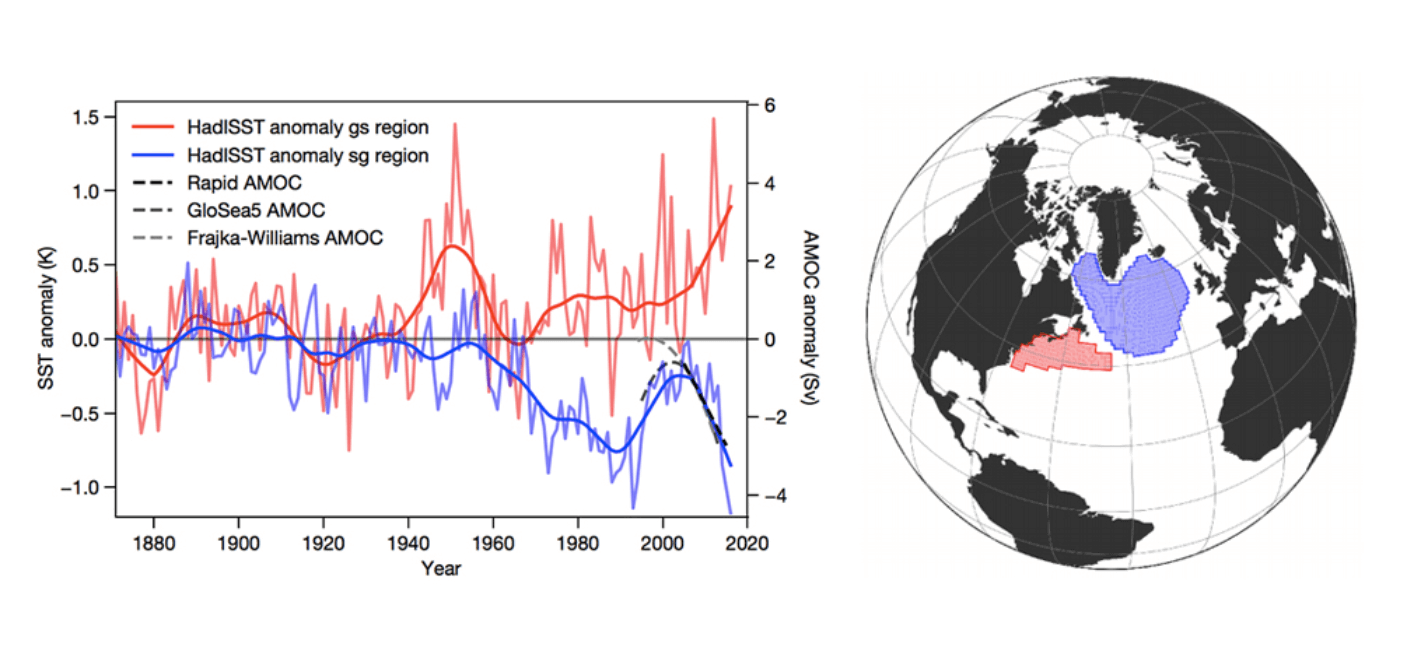
The graphs on the left show temperature progression over time. You can see that the Gulf Stream area is warming, while the North Atlantic is actually cooling over time. The relative difference between these two areas is typically used as an estimate of the strength of the AMOC.
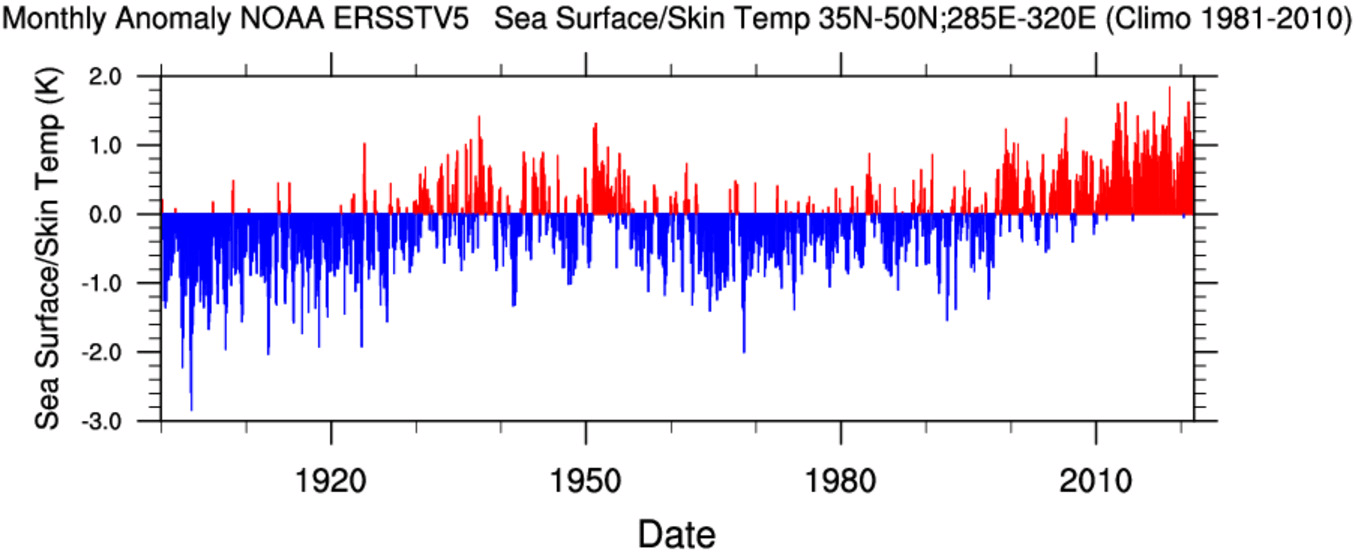
We produced a graph, which shows the relative difference between these two areas. It is nicely seen that since at least the 1900s, there was a slow but consistent downward trend. Especially in the past 40 years, we can see a stronger negative difference in these two areas, indicating a likely further weakening of the AMOC.
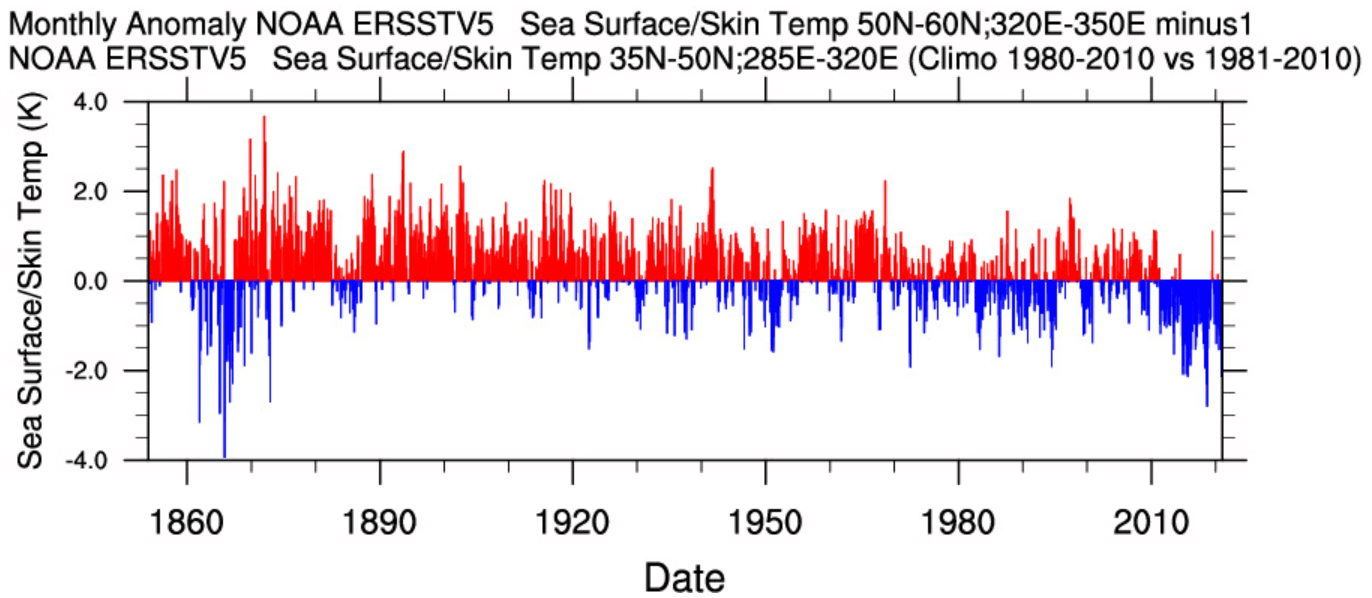
The data basis for this graph comes from the NOAA’s ERSSTv5 dataset. It is a combination of observations and reconstructions, taking all the available data and modern techniques, to reconstruct the sea surface temperatures back to 1854. The data is of course not 100% accurate that far back but is proven to work very well for modern periods, giving confidence also for the historical ages.
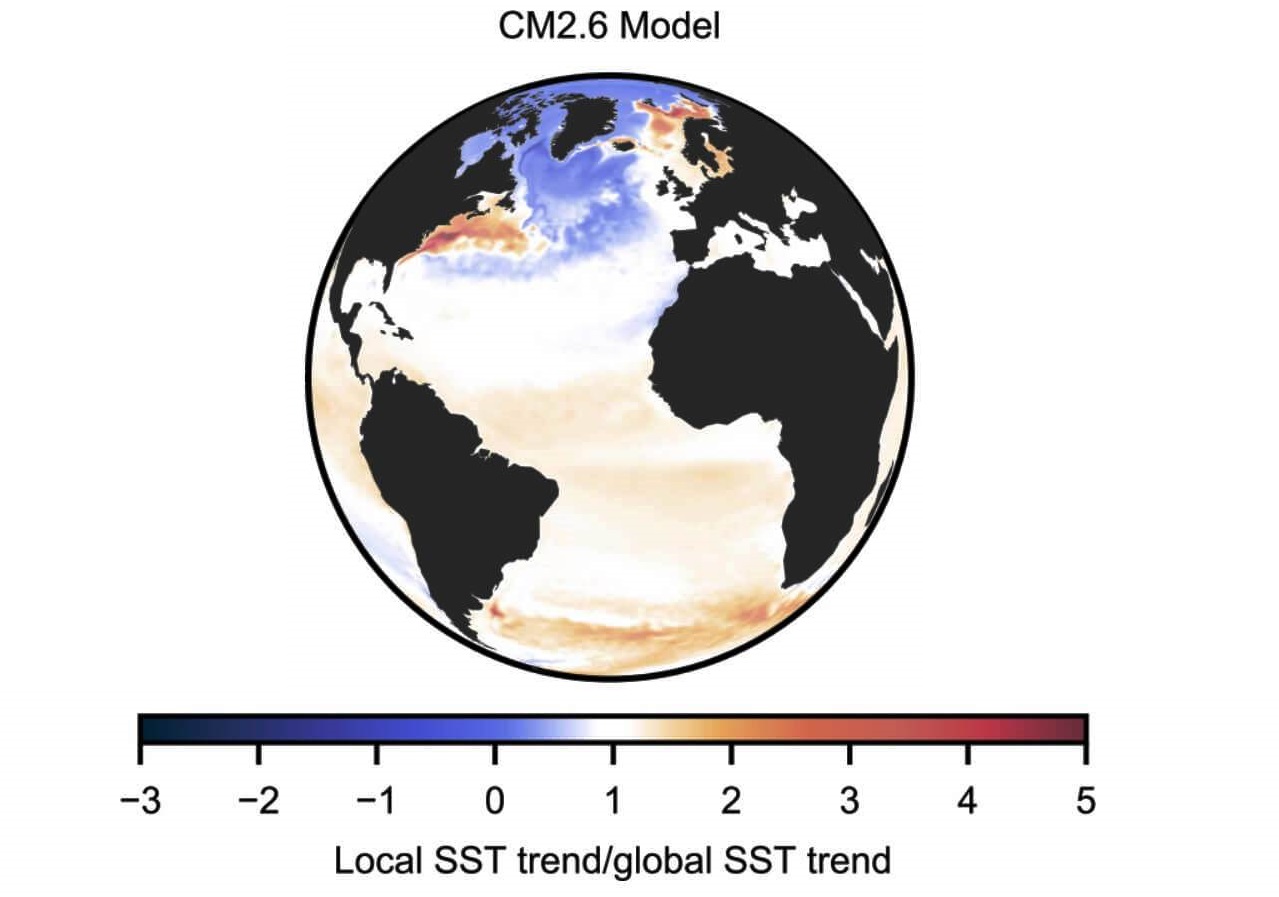
Now, the next graphics are even more interesting. First, we have a computer model simulation. It shows what would happen if the AMOC would weaken. We can see the warming of the Gulf Stream region along the east coast of the United States, and cooling in the North Atlantic
The second image below shows the actual ocean temperature trends over time. It looks practically the same as the model simulation of a weakening AMOC. This supports the fact that the AMOC is indeed losing strength, perhaps even more than first anticipated.
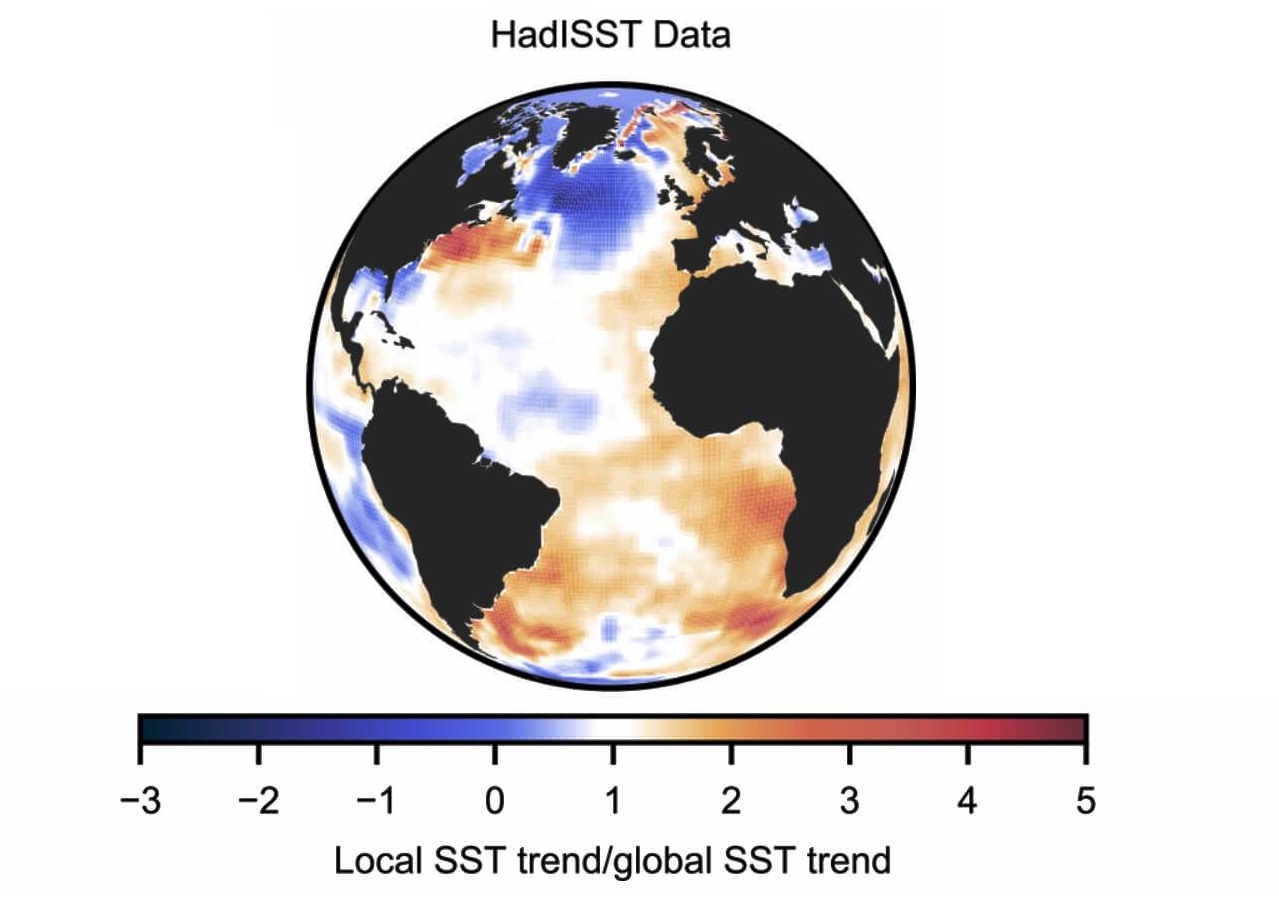
This temperature signature of the warm Gulf Stream area and cold North Atlantic is one of the strongest indicators that the AMOC is weakening. There are also direct observations being made with instruments, which objectively confirmed that the North Atlantic circulation is indeed on the decline.
The idea is that as the Gulf Stream weakens, it cannot transport the warmer waters towards the north as effectively. Warmer waters start to pile up along the east coast of the United States. As a result, the North Atlantic starts to cool down, because it is not receiving as many warm waters anymore.
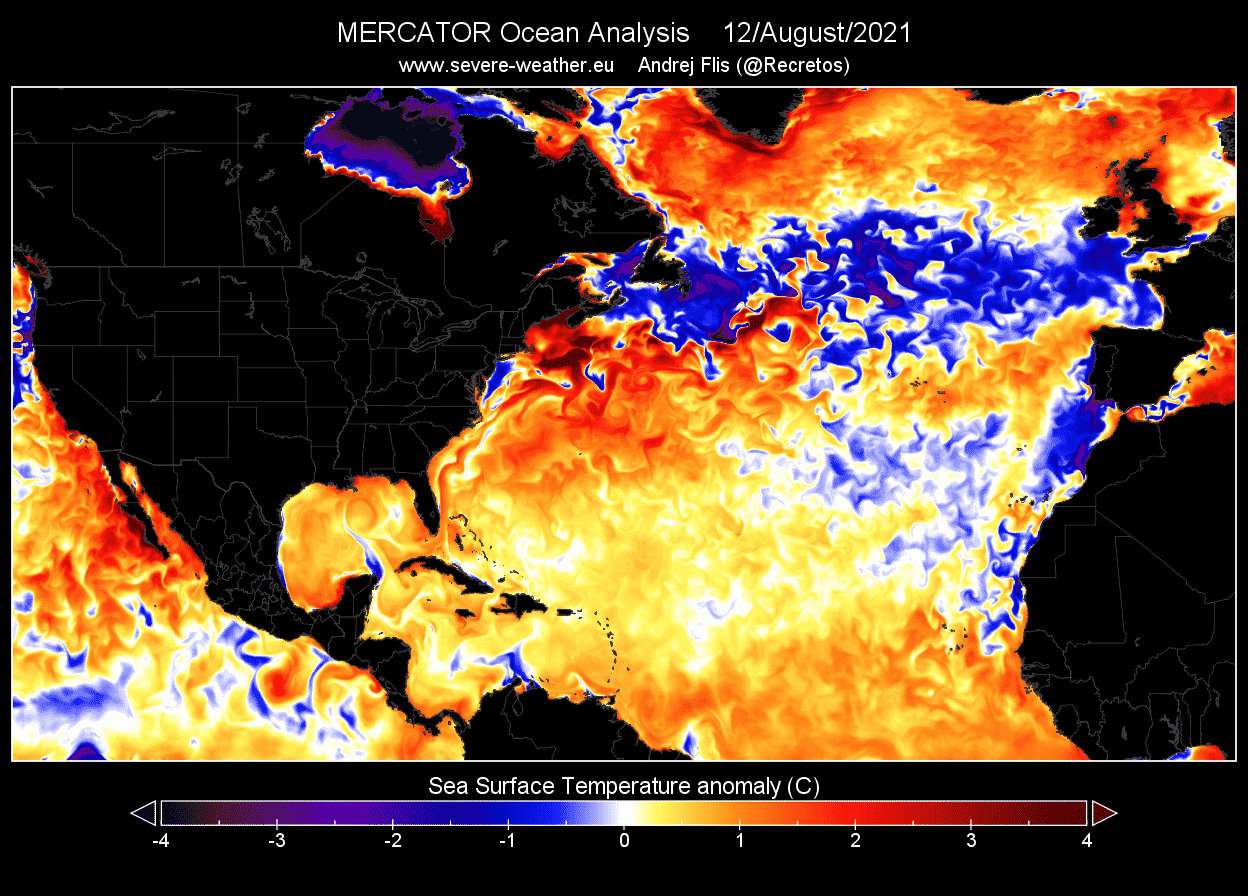
The latest ocean temperature anomalies show a similar signature. Above-normal temperatures in the Gulf Stream region, and cooler towards the North Atlantic. But these are surface temperatures and can be heavily influenced by the changing pressure and wind patterns.
If we look below the surface, we can better see the more typical signature. Warm Gulf Stream area, and cooler temperatures in the North Atlantic.

We can also see the signature on the long-term temperature trend of the world. Tho most ocean areas are slowly warming, the North Atlantic remains an area that defies all warming, and is actually slowly cooling. Compared to the Gulf Stream area which is warming, this is a direct indication of the weakening ocean circulation.

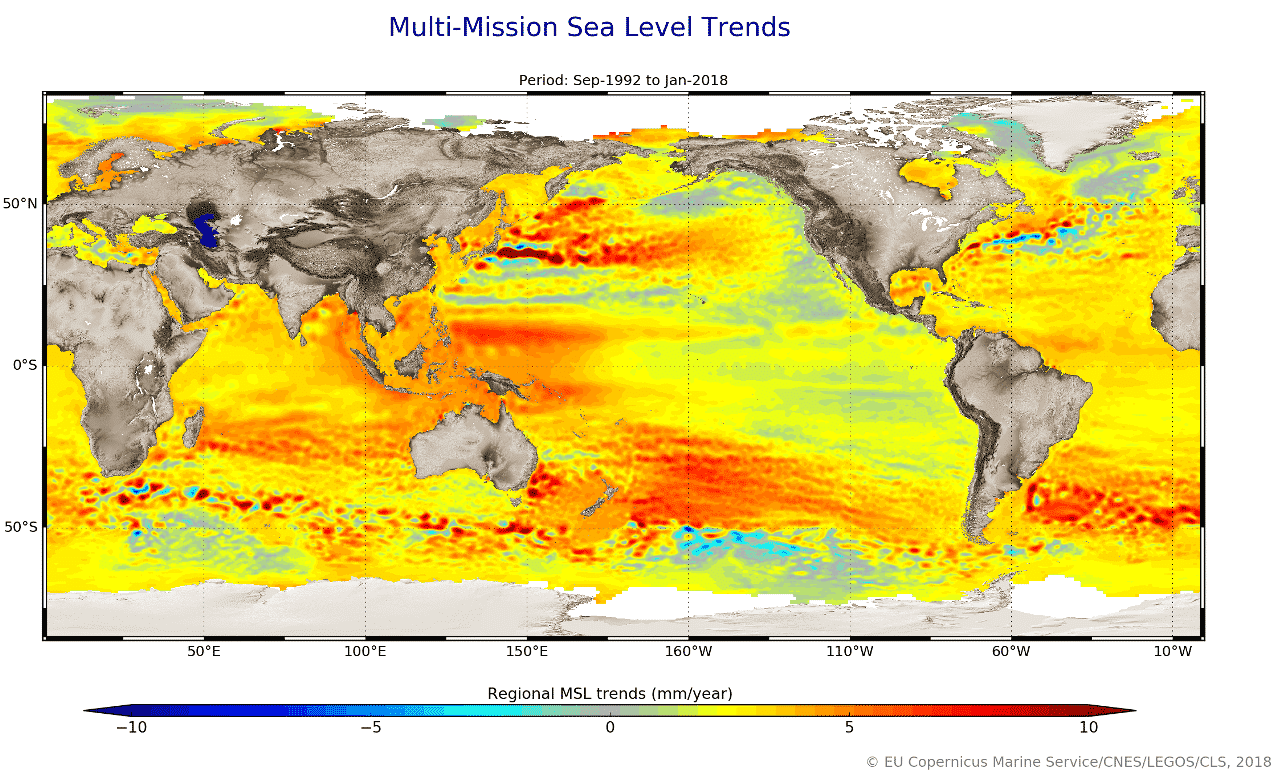
Changing ocean temperatures also affect the sea surface height. Below we have the sea-level trends from ESA, which show the rising/falling sea levels around the world. We can see that the Gulf Stream area is actually rising. That is also one indicator of a weakening circulation, as the waters are warming and slowing, effectively “piling up”.
We produced another graph, this time for the warm Gulf Stream part along the northeastern coast of the United States. It shows the strong temperature increase in this region, especially in the past 60 years.
There is more than one reason why the AMOC is weakening. In the movie The Day After Tomorrow, it was shown that melting the Arctic and Greenland ice introduced lots of fresh water into the North Atlantic, creating a strong imbalance in the ocean current.
As you will now see, that is actually one thing that the movie probably got right.
FRESH WATER IN THE NORTH ATLANTIC
Freshwater reduces the salinity of the North Atlantic. That makes the water less dense (and less heavy), so it can’t sink properly down to the depths. As the ocean current cant sink as fast, it’s causing a “traffic jam”, slowing down the entire current.
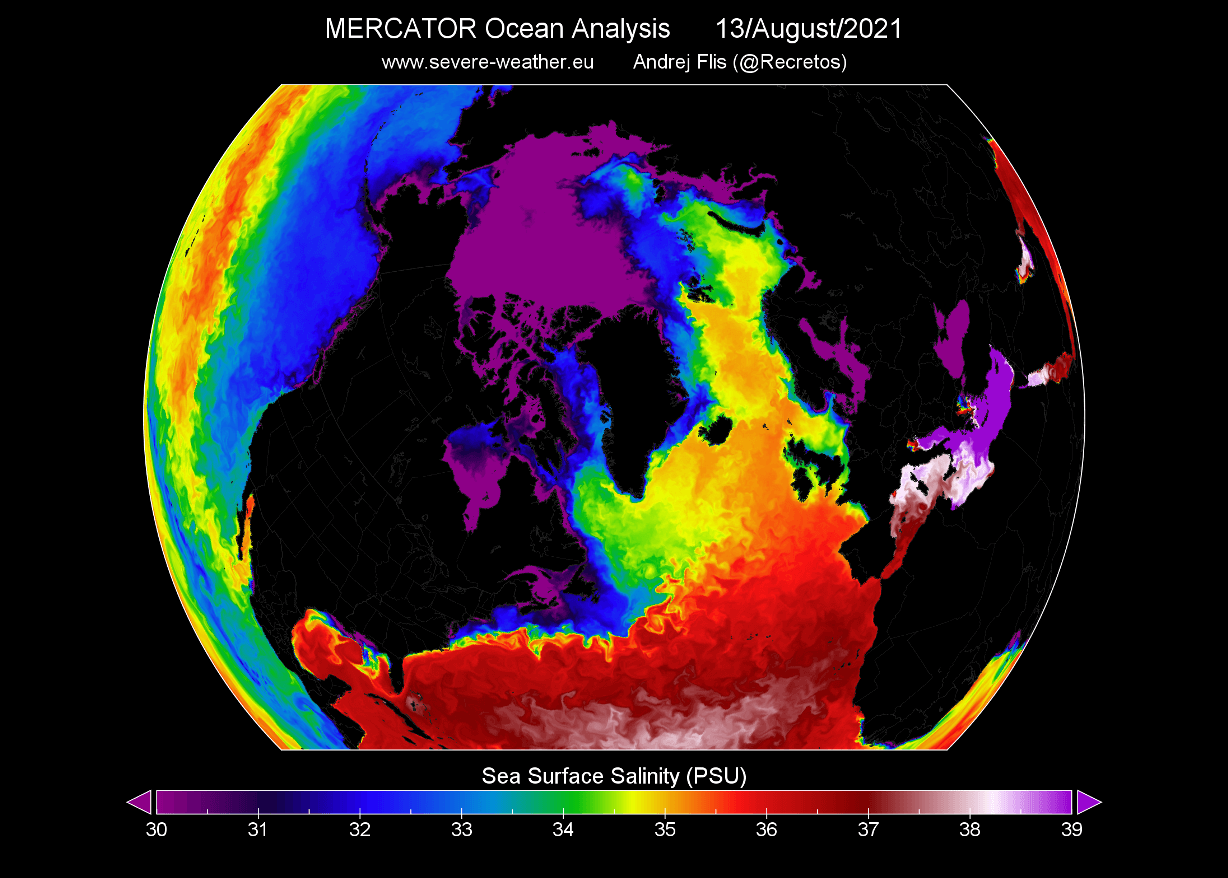
Below we have a graphic that shows the sea surface salinity but over a larger area. You can nicely see the salty waters coming towards the North Atlantic with the Gulf Stream. But we can also see a lot of fresher waters in the Arctic Ocean which flows down into the North Atlantic and the North Pacific.
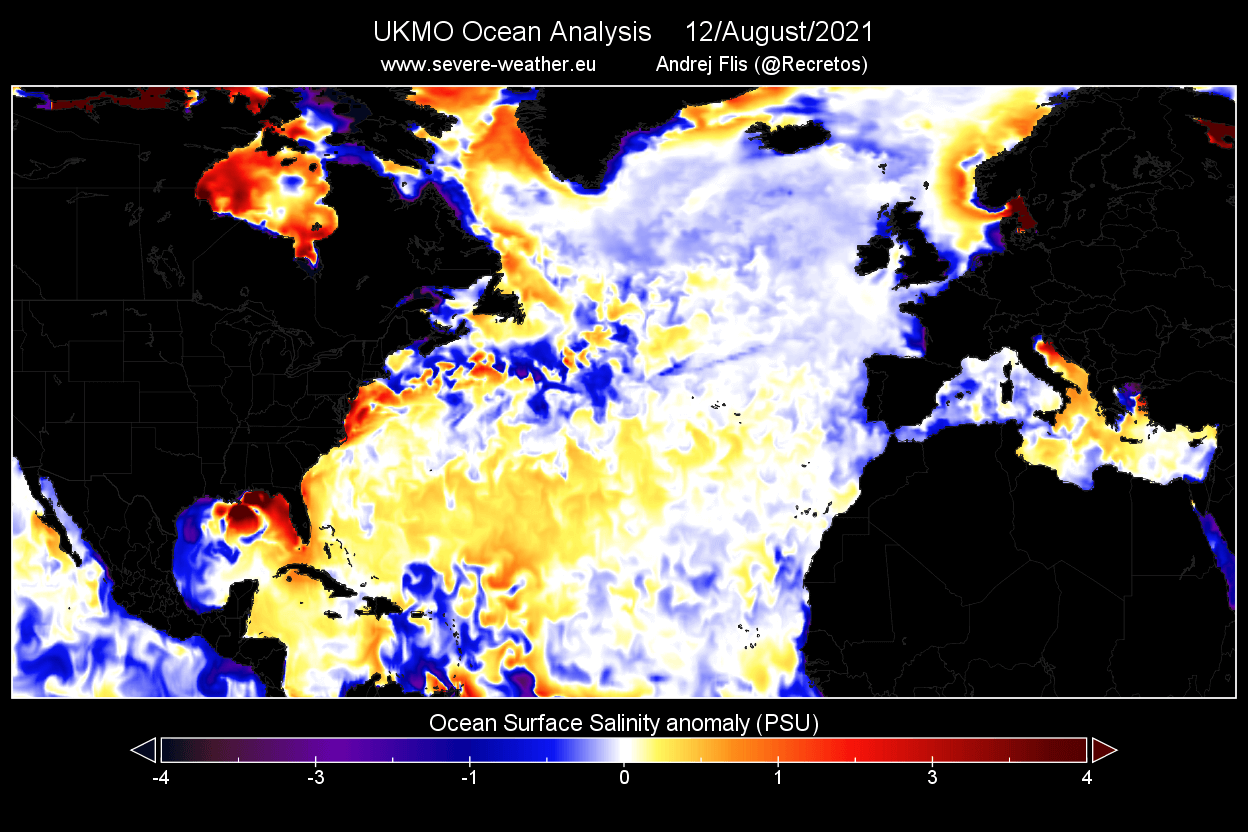
Looking at the ocean salinity anomaly, we can see that most of the North Atlantic is currently less salty than normal. It has a higher fresh water content than it should have. But this is just the surface layer.
Going a bit deeper, at around 60 meters (200ft), we can see that the North Atlantic is still fresher than normal. This strongly indicates that there is currently more fresh water in the North Atlantic than it should have been for this time of year.

We produced a special graphic, that shows a cross-section of the North Atlantic. It shows the salinity anomaly with depth. You can see that the fresher waters reach quite deep down, likely being transported by the ocean currents/circulation.

The long-term salinity trends below are very obvious. We can see a stable decrease of salinity in the North Atlantic, indicating the influx of freshwater over time.
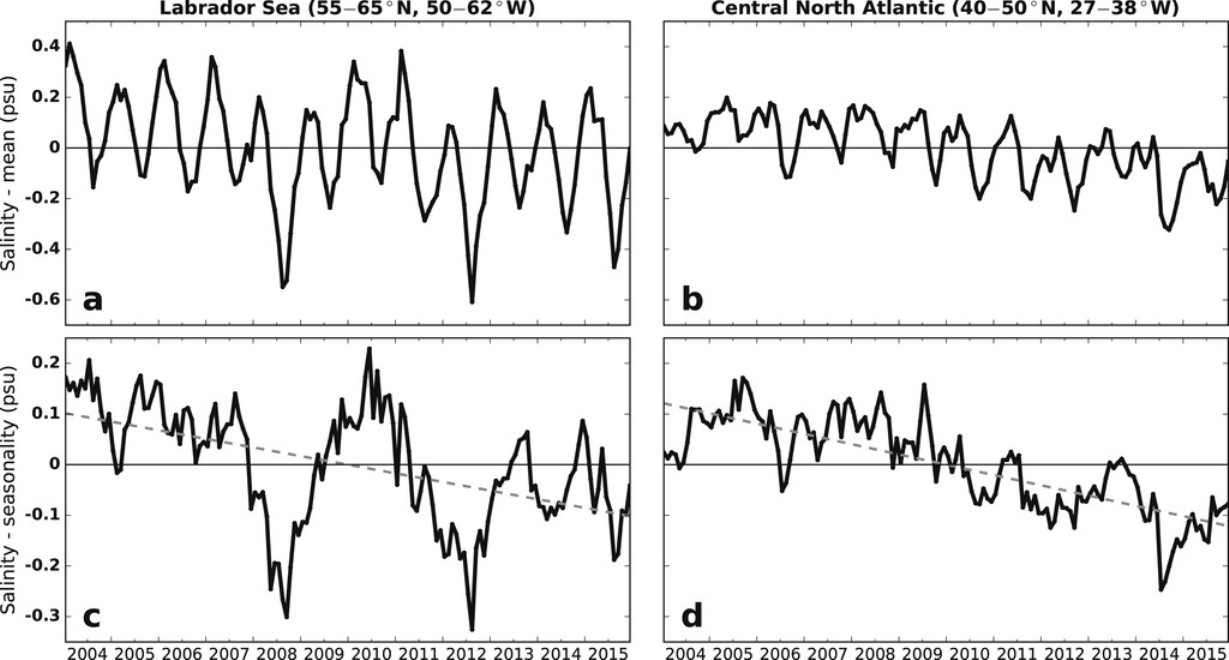
The surface salinity trends (by Niklas Boers), show the reduced salinity trend over the last decades in the North Atlantic. This can mostly be done by the introduction of fresher water. This graphic is from a new study, which shows the latest observation-based early-warning signs of a AMOC collapse. The link to the study can be find below in the Article.
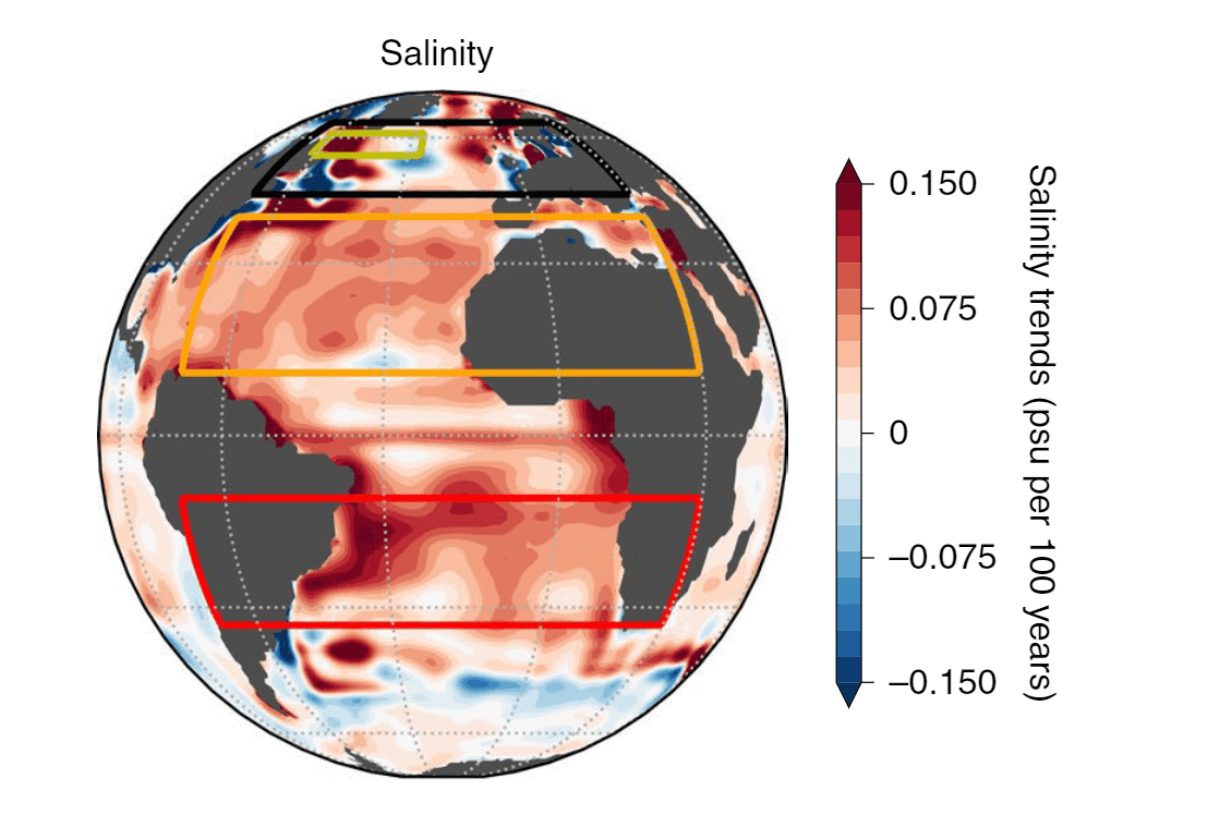
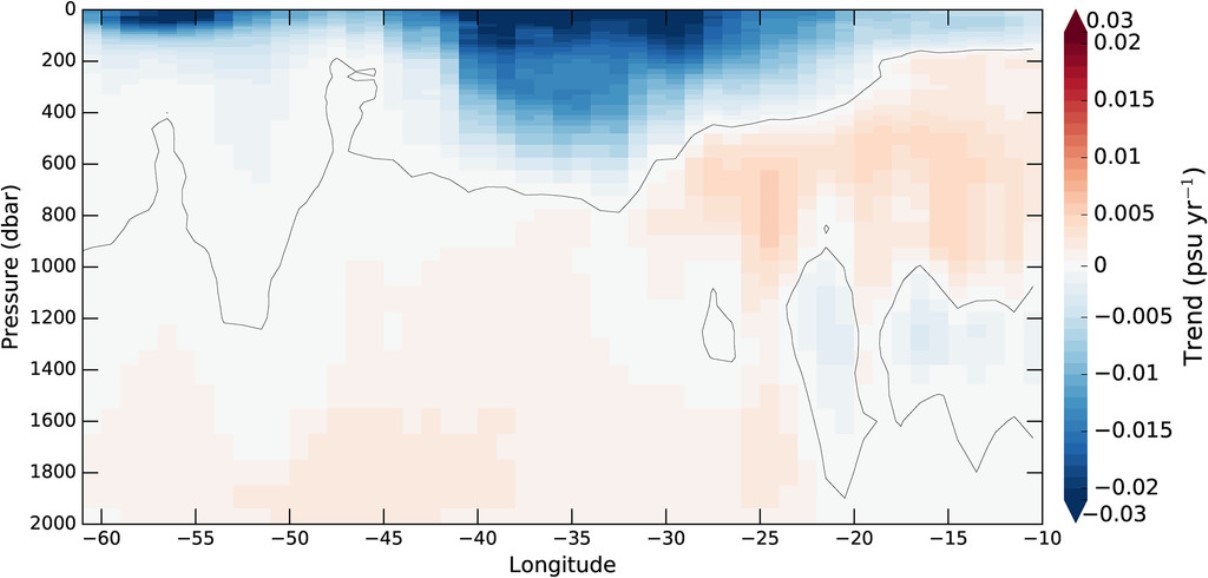
Looking at depths, we can see the strong reduced salinity trend reaching deeper down in the North Atlantic. Stronger freshening is seen in the surface layers, most affected by the fresher waters from the Arctic and Greenland.
This is one thing that the movie “The day after tomorrow” got somewhat right, if we ignore the too short time-scale. But what about that ice age?
Many model simulations were made, to try and calculate what would happen if the AMOC would completely shut down. Below is the end result, which shows the temperature difference to a world with an active AMOC.
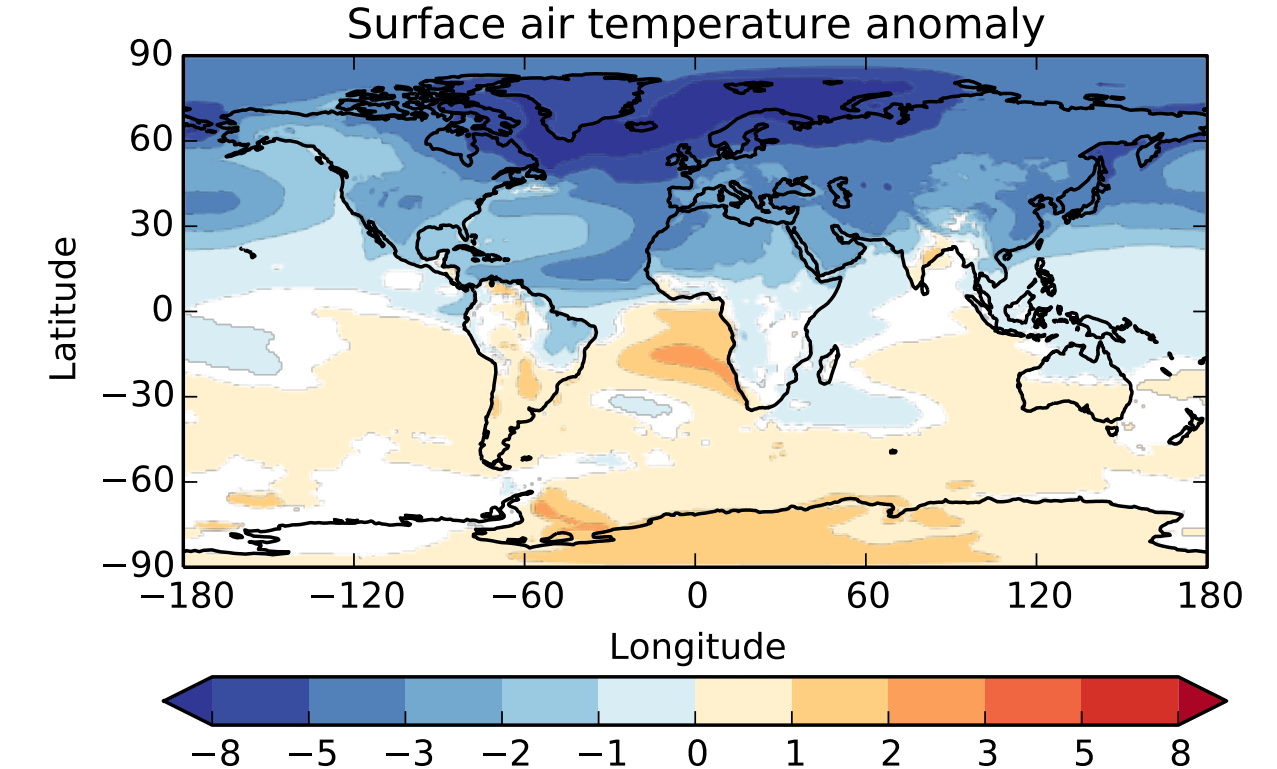
You can see the entire Northern Hemisphere is several degrees cooler. And that is just the beginning, as climatic changes were to occur, with very different pressure patterns and less precipitation over Europe. Winters would become more severe in Europe and the United States.
This would partially counter the continuing warming. But it would introduce further severe destabilization of the already changing climate system. It does not mean a new ice age just yet, but the global weather changes can be quite substantial.
But we do not need a full collapse of the AMOC to change the weather. Slowing Gulf Stream means more water piling up on the east coast of the United States, which is dangerous for storm surges. For Europe, it can mean a change in the track and strength of low-pressure systems coming in from the North Atlantic.
Of course, this is not something that would/will happen overnight, as these changes can take years, decades, or even centuries. But we do know for a fact that the AMOC is in a decline. And based on the amount of freshwater induced from the melting ice, we will likely be seeing climate effects still within our lifetime.
But what can happen almost overnight, are strong storms and hurricanes. And the Gulf Stream and the AMOC play an important role in these events, especially for the United States, as you will soon learn.
GULF STREAM AND THE UNITED STATES WEATHER
As the water in the far North Atlantic is not sinking as fast anymore, due to it being fresher, it slows down the ocean transport system. Because the ocean flow is slowing down, the warmer water from the Gulf Stream has nowhere to go, and stalls, like in a traffic jam.
This means that less of the warm water is being transported to the North Atlantic. Instead, it is now piling up off the east coast of the United States.
This can be dangerous, as it becomes a very potent energy source for powering up Nor’easter storms and tropical systems. As the warmer water piles up, sea surface height is also increased, which means more risk for severe storm surge.
Somewhat of an example of this process was the infamous Hurricane Sandy, back in 2012. Below is a satellite image of Hurricane Sandy as it was sitting over the warm Gulf Stream, using it to power up.

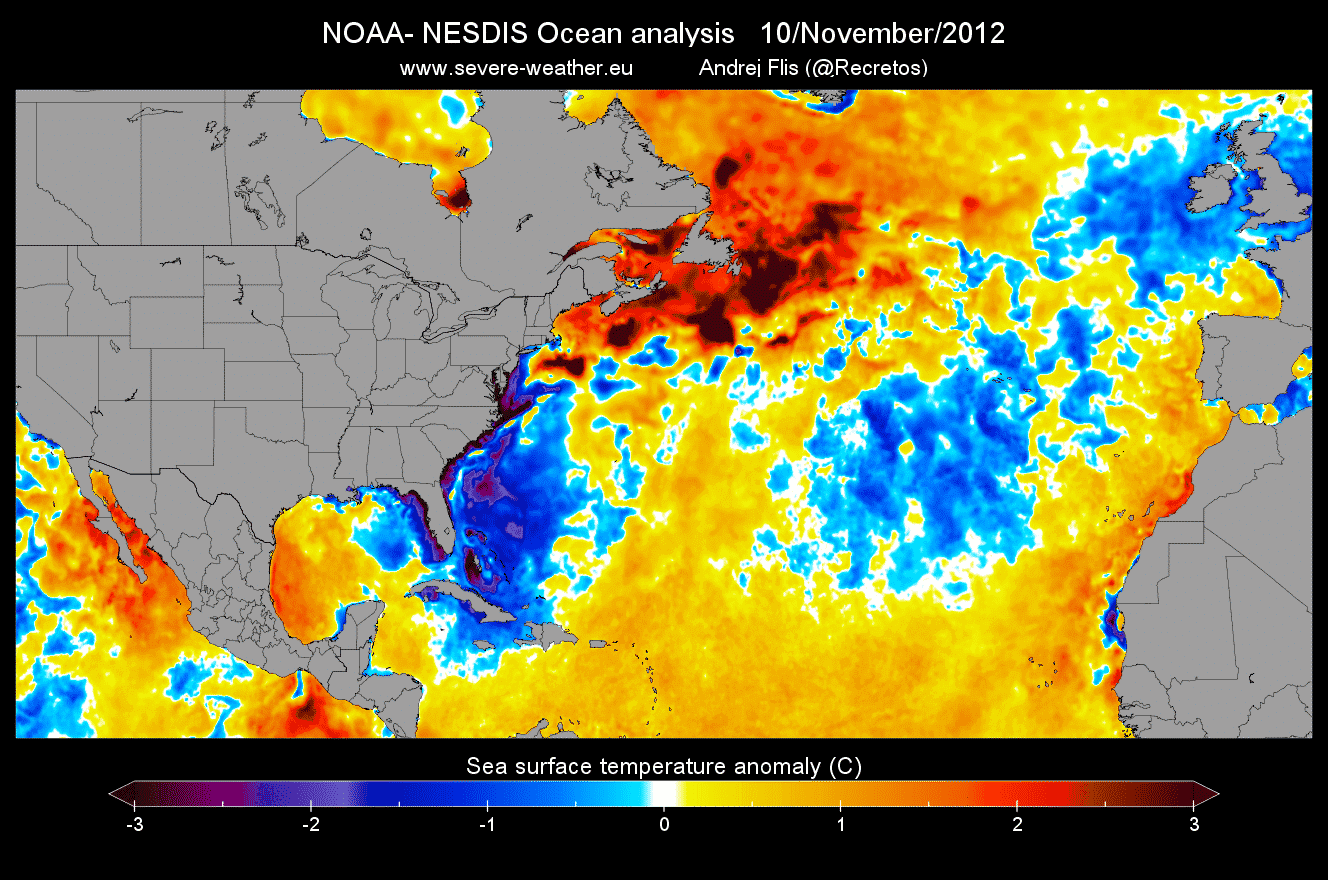
On the image below, you can see the sea surface temperature anomaly before the onset of Hurricane Sandy. Much of the tropical Atlantic was warmer than normal, along with the Gulf Stream area. The warmer the ocean, the more energy is available for a tropical system.

The sea surface temperature anomaly in the image below is after the passing of Hurricane Sandy. We can see a huge ocean temperature drop behind Sandy, from the western Caribbean all the way up the east coast of the United States.
Sandy has used the warmth of the ocean and the Gulf Stream, converting it into energy to power up. It left behind ocean temperatures 4 to 6 degrees cooler. Some of the cooling is also due to the mixing of the ocean layers as a storm is passing over.
Deeper cooler waters rise to the surface as the seas get very rough under a low-pressure system, overturning and mixing with the warmer surface waters.
The warmer than normal Gulf Stream area can amplify the storms that approach the southeastern United States or the east coast. Especially problematic is the increased sea surface height, which also enables higher tides and devastating storm surge.
Check out the new study on the Gulf Stream Collapse by Niklas Boers, from the Potsdam Institute for Climate Impact Research:
We will keep you updated on various global anomalies and weather pattern development, so make sure to bookmark our page. Also, if you have seen this article in the Google App (Discover) feed, click the like button (♥) there to see more of our forecasts and our latest articles on weather and nature in general.
SEE ALSO: