Areas of the global oceans warm and cool constantly. But recently, an unusually strong anomaly developed in the Gulf Stream. Weather in the United States and Europe depends a lot on this ocean current, so it’s important we understand the full story and meaning of this strong anomaly.
Oceans have a crucial role in the weather and climate of the world, so every unusual anomaly is taken seriously. As you will soon learn, the Gulf Stream is a part of something much bigger and more powerful, so an anomaly in the Gulf Stream can be (and likely is) a sign of something much larger in the works.
WHAT IS THE GULF STREAM?
But first, we of course need to quickly recap what exactly is the Gulf Stream and where can we find it?
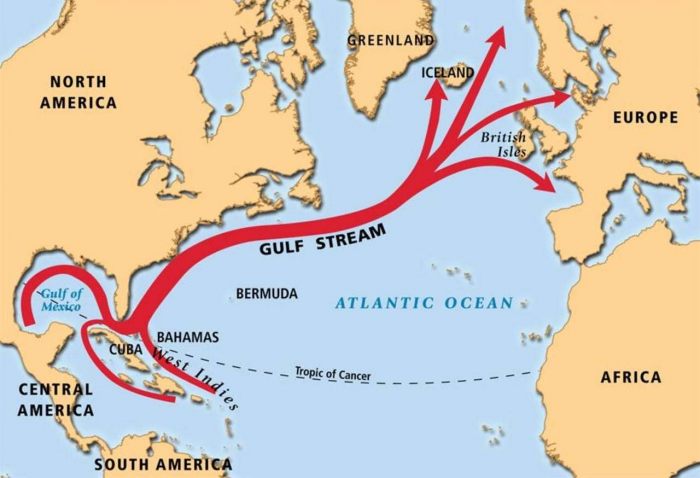
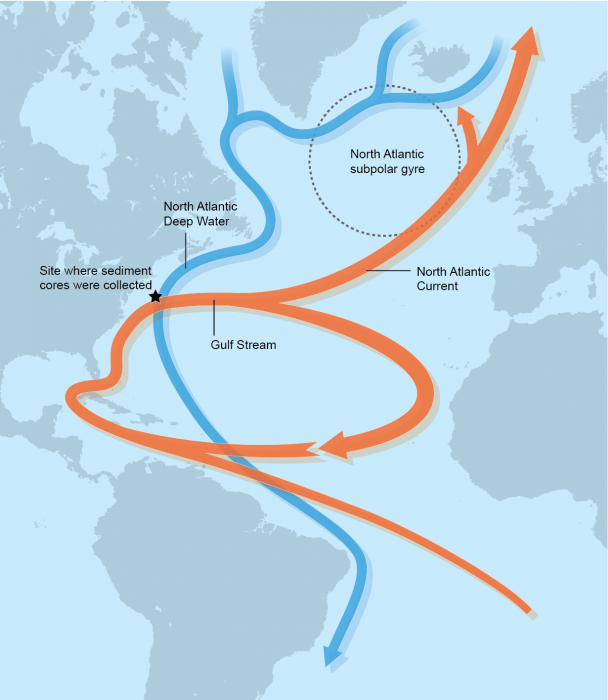
The Gulf Stream is a strong ocean current that brings warmer water up from the Gulf of Mexico into the Atlantic Ocean. It extends all the way up the eastern coast of the United States, where it starts to turn towards northwest Europe.
The image below shows a rough outline of the Gulf stream and where it flows across the North Atlantic. In reality, it does not flow in a straight line, but as you will see, it is very complex and full of swirls.
This strong current of warm water influences the climate of Florida, keeping temperatures there warmer in the winter and cooler in the summer, compared to the other southeastern states. Since the Gulf Stream also extends towards Europe, it helps to warm the western European countries, having a major impact on the regional climate.
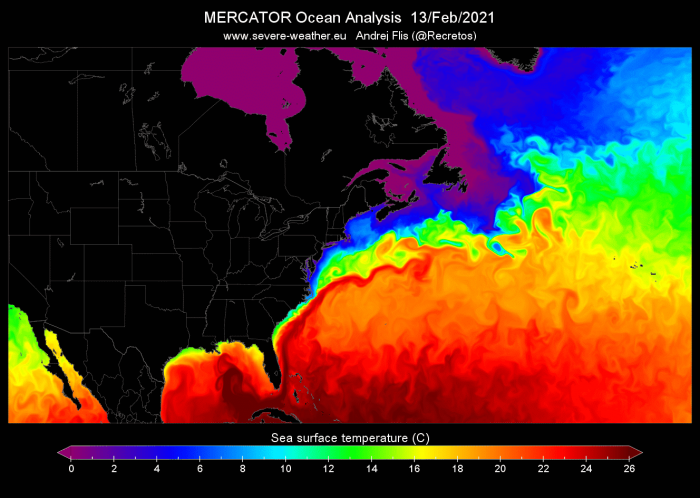
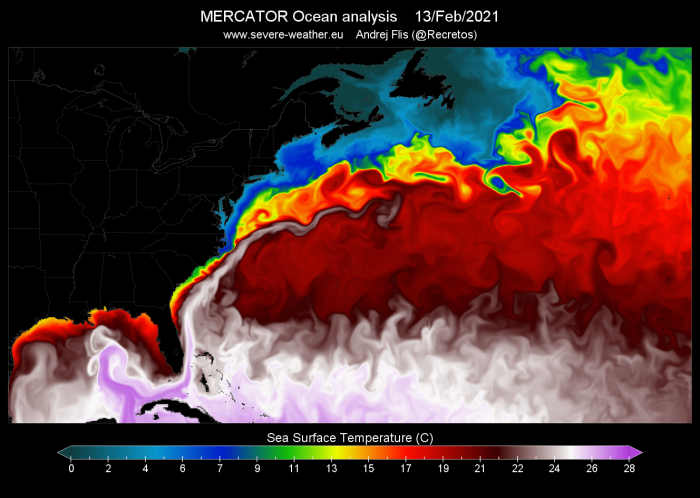
The stream itself can be best seen if we look at the temperature analysis and the ocean surface current speed. The image below shows the ocean surface temperature analysis, and we can see the warm stream of water moving up along the east coast of the United States, extending far into the North Atlantic.
We produced a high-resolution video animation, which shows the Gulf Stream in realtime. This way, you can see directly how it flows towards the North Atlantic, or rather how it was flowing this winter so far.
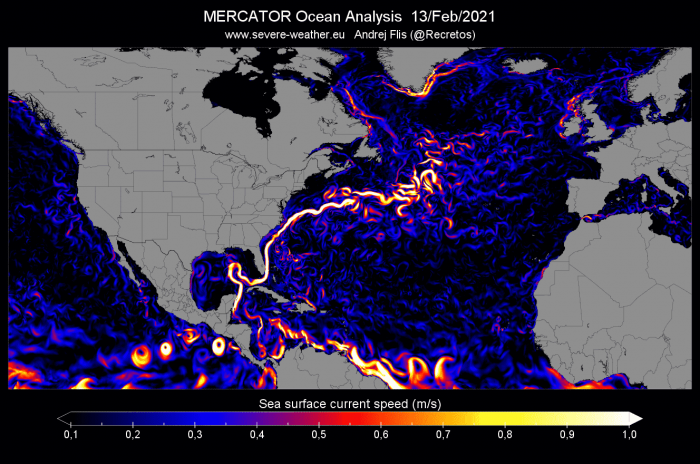
The Gulf Stream is perhaps seen even better when we look at the movement and speed of the ocean surface currents. The image below shows the ocean surface current speed, where the Gulf Stream really stands out and can be seen in its most raw shape and form.
This ocean current does not flow in a straight line, as seen on many graphics. It is very complex, with a lot of dynamics and swirling across the North Atlantic. We can see that it has a lot of smaller swirls of water, warm and cold, depending on the direction in which they spin. This is very similar to the way the atmospheric jet stream works.
Zooming out to the entire world, we can see that the Gulf Stream is not the only one of its kind. There are many areas with persistent ocean circulation, transporting large amounts of water and energy around all 5 continents of the world.
UNUSUAL ANOMALIES IN THE GULF STREAM
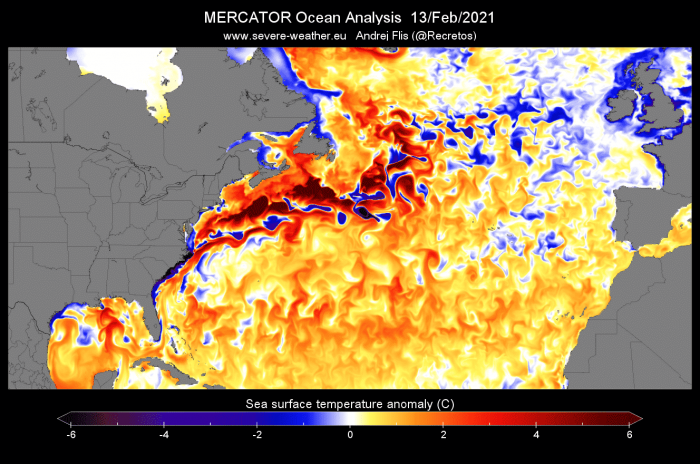
But sometimes, we need to take a different look to evaluate the state of the Gulf Stream. One such approach is by using anomalies. An anomaly is something that deviates from what is standard, normal or expected at a certain time or place.
In the oceans, the most commonly used is of course the temperature anomaly. The image below shows the anomaly analysis in the North Atlantic, where the Gulf Stream region really stands out. We can see the stream is warmer than normal, with some northern parts even 6°C to 8°C above normal.
That is a significant anomaly, and water temperatures 6 to 8 degrees above normal can provide much more available energy for weather systems in the region.
The actual temperatures are between 14 and 18 degrees celsius, closest to the northeast coast of the United States. That can become a significant source of warmer air mass to go up against a freezing Arctic air mass from the north or northwest. This is a common recipe for strong Nor’easter storms in the northeast United States, where the Gulf Stream provides a lot of energy for the storm.
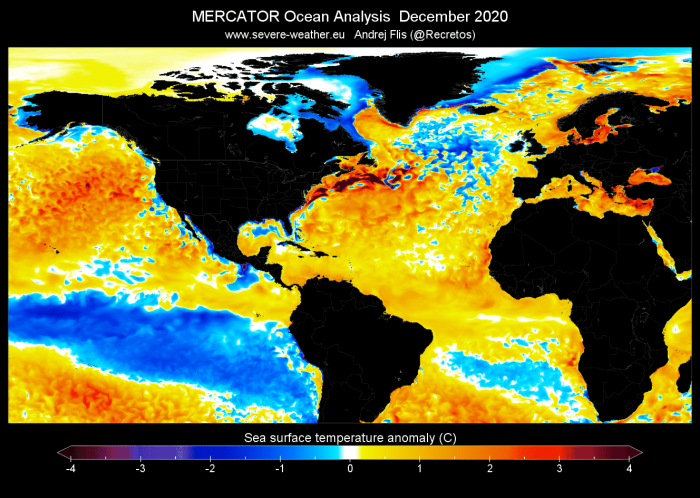
Strong anomalies in the Gulf Stream were already observed in the past two months. The image below shows the monthly sea surface temperature anomalies in December 2020. The Gulf Stream area really stands out, and you can also see the cold La Nina in the Pacific Ocean.
In January 2021, the anomaly got even stronger, spreading over a larger area and with an even stronger deviation from the long-term average.
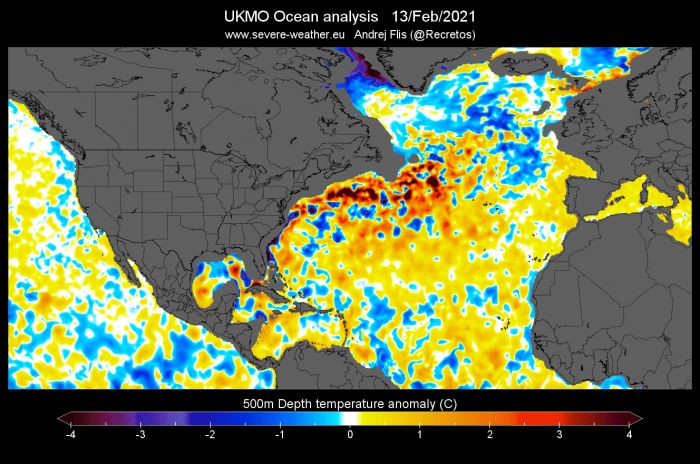
But the anomaly is also reaching down with depth. Below we have two images, which show the temperature anomaly at 100m and 500m depth. And we can see that the warmer Gulf Stream area is reaching down with depth.
But as you will now see, there is perhaps a higher purpose to this, as the Gulf Stream is actually a smaller part of something bigger.
NORTH ATLANTIC OCEAN CIRCULATION
The larger system in which the Gulf Stream flows is called the Atlantic Meridional Overturning Circulation, or AMOC short. The AMOC is a large system of ocean currents, like a conveyor belt, driven by differences in temperature and salt content, which affects its density. The Gulf stream is just is the surface part of the AMOC in the North Atlantic.
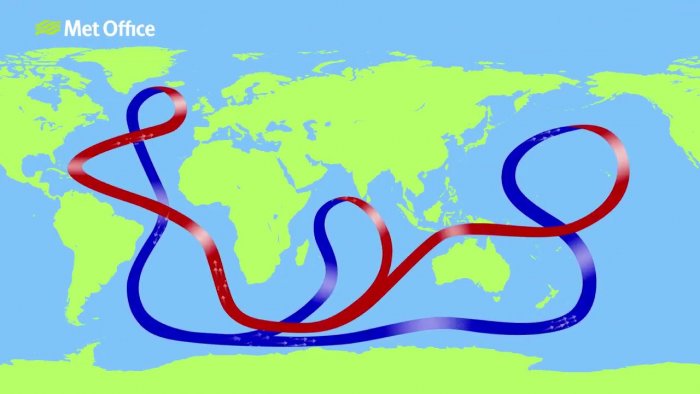
The image below from the UK Met Office shows the entire global ocean circulation. It is also known as the Global Conveyor belt or the Thermohaline circulation. AMOC is the ocean current system that covers the North and South Atlantic.
As warm water flows northwards it cools and some evaporation occurs, which increases the amount of salt in the water. Low temperature and a high salt content make the water denser and heavier, so this dense water will sink deep into the ocean.
The image below shows ocean surface salinity or the amount of salt in the water. Higher the number, the saltier the water. Above 35, we still have salty waters, so as the water cools, it sinks in the far North Atlantic.
The cold, dense water slowly flows southwards, several kilometers below the ocean surface. Eventually, it gets pulled back to the surface and warms in a process called “upwelling” and the circulation is complete.
The reason why this is important is that the AMOC is such an integral part of the weather and climate in the North Hemisphere. It transports a lot of warmer waters and energy towards the north. The image below focuses on the North Atlantic part of the AMOC.
There is always a fear that the AMOC might shut down at some point, making the movie “The day after tomorrow” a reality. In that famous movie, the AMOC has shut down, initiating a new ice age.
Tho the reality is somewhat different, we will look at the state of the AMOC, which shows that this circulation is indeed weakening.
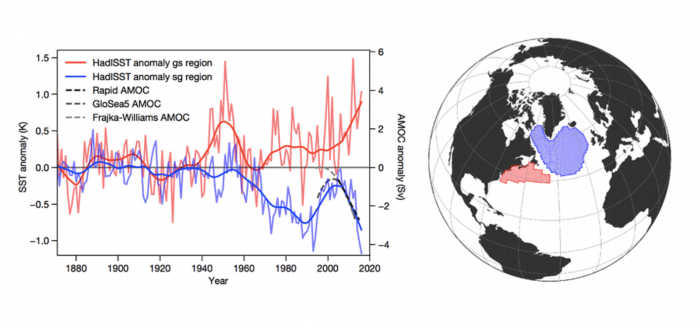
The image below shows the North Atlantic ocean divided into two main areas. At the coast of the United States is the warm Gulf Stream area, and the blue area is where the Gulf Stream releases its heat and sinks down into the depths.
The graphs on the left show temperature progression over time. The Gulf Stream area is warming, while the North Atlantic is actually cooling over time. The relative difference between these two areas is considered as an estimate of the strength of the AMOC.
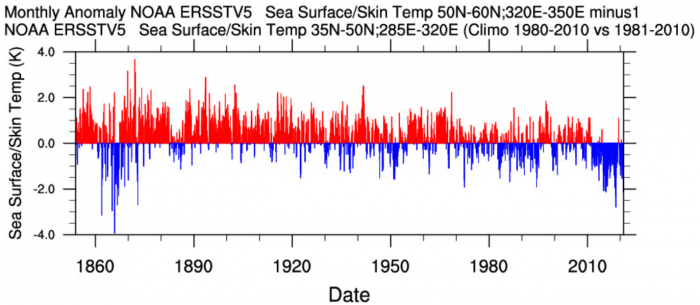
We produced a graph, which shows the relative difference between these two areas. We can see that since at least the 1900s, there was a slow but consistent downward trend. Especially in the past 40 years, we have seen a stronger negative difference in these two areas, indicating a likely further weakening of the AMOC.
Data basis for this graph comes from the NOAA’s ERSSTv5 dataset. It is a combination of observations and reconstructions, taking all the available data and modern techniques, to reconstruct the sea surface temperatures back to 1854. The data is not 100% accurate that far back, but is proven to work very well for modern periods, giving confidence also for the historical ages.
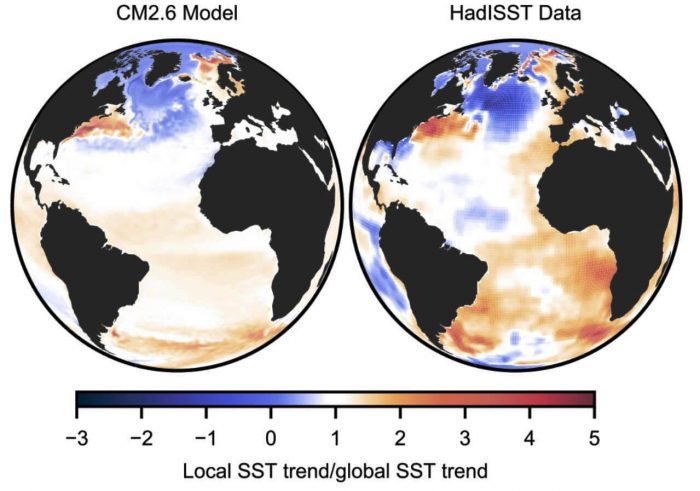
Now, the next graphic is even more interesting, as it shows two images. On the left, we have a computer model simulation, what would happen if the AMOC would weaken. And on the right, we have the actual analysis of the past century, which shows the exact same scenario. This strongly supports the idea that the AMOC is indeed loosing strength.
This temperature signature of the warm Gulf Stream area and cold North Atlantic is one of the strongest indicators that the AMOC is weakening. There are also direct observations being made with instruments, which objectively confirmed that the North Atlantic circulation is indeed on the decline.
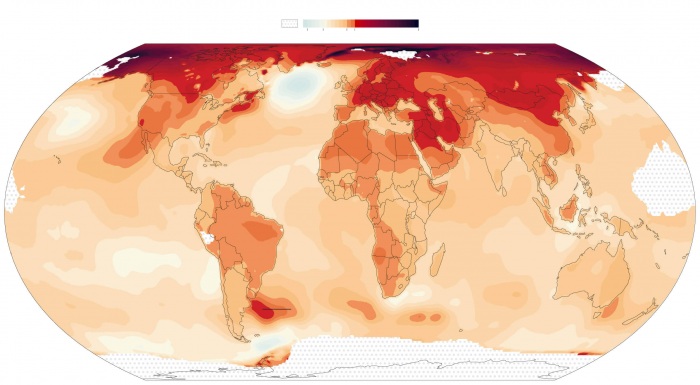
We can also see the signature on the long term temperature trend of the world. Tho most areas are slowly warming, the North Atlantic remains an area that defies all warming, and is actually slowly cooling. Compared to the Gulf Stream area which is warming, this is a direct indication of the weakening ocean circulation.
The reason why AMOC is weakening is more than one. The most often mentioned or most probable is the induction of the freshwater into the North Atlantic from sea ice melt in Greenland and the Arctic.
Freshwater reduces the salinity of the North Atlantic, which means that the water is not dense (heavy) enough to sink. That slows down the sinking of the surface waters, effectively slowing the ocean current, like a traffic jam.
This is one thing that the movie “The day after tomorrow” got somewhat right. But about that ice age…
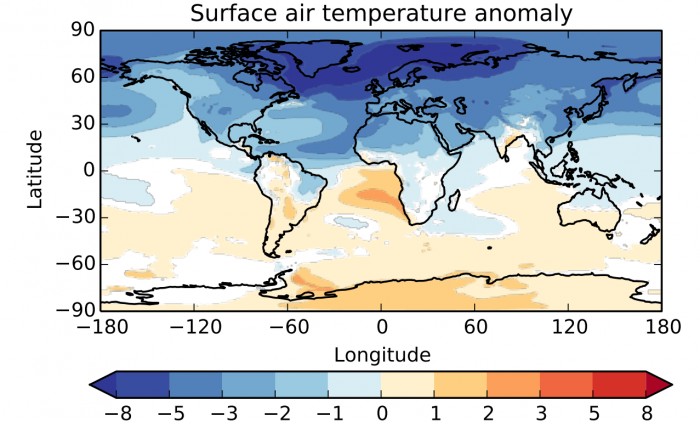
Many model simulations were made, to try and calculate what would happen if the AMOC would completely shut down. Below is the end result, which shows the temperature difference to a world with an active AMOC.
You can see the entire Northern Hemisphere is several degrees cooler. And not just that, climatic changes were to occur, with very different pressure patterns and less precipitation over Europe. Winters would become more severe in Europe and the United States.
Of course, this is not something that would/will happen overnight, as these changes can take decades or centuries. But we do know that the AMOC is in a decline, and based on the amount of freshwater induced from the melting ice, we could be seeing some climate effects still within our lifetime.
But what can happen almost overnight, are strong storms and hurricanes. And the Gulf Stream and the AMOC play an important role in these events, especially for the United States, as you will soon learn.
LEARNING FROM HISTORY
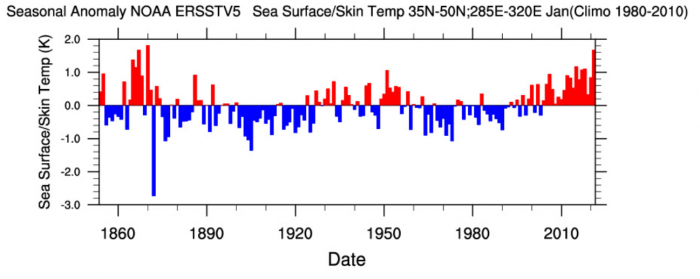
The current strong anomaly in the Gulf Stream is rather unusual. We produced another graph, which shows the January Gulf stream anomaly since 1854. You can see that the Gulf Stream in January 2021 was the warmest in at least 150 years.
We need to go back to 1870 and 1867 to find a January with similar anomalies in the Gulf Stream. The data is just a reconstruction from direct observations since no satellites were around back in the late 1800s. You can see on the two images below, the warm anomaly in the Gulf stream in January 1867 and 1870.
But if we look at the entire dataset, with all the months, not just January, we can see the Gulf Stream area really is warming up. This is something to be expected when the AMOC is weakening, as we have learned earlier in the article.
The reason why this occurs is best to explain with the traffic jam again. As the water in the far North Atlantic is not sinking as fast anymore, due to it being fresher, it slows down the ocean transport system. Because the flow is slowing down, the warmer water from the Gulf Stream has nowhere to go, and stalls, like in a traffic jam.
This means that less of the warm water is being transported to the North Atlantic, which is now piling up at the east coast of the United States. This can be dangerous, as it becomes a very strong energy source for powering up Nor’easter storms and tropical systems. As the warmer water piles up, sea surface height is also increased, which means more risk for severe storm surge.
Somewhat of an example of this process was the infamous Hurricane Sandy, back in 2012.
GULF STREAM AND UNITED STATES WEATHER
Hurricane Sandy was the deadliest and most destructive hurricane of the 2012 Atlantic hurricane season. The storm caused almost $70 billion in damage and killed over 230 people across eight countries from the Caribbean to Canada.
Below is a satellite image of Hurricane Sandy as it was sitting over the warm Gulf Stream, using it to power up.
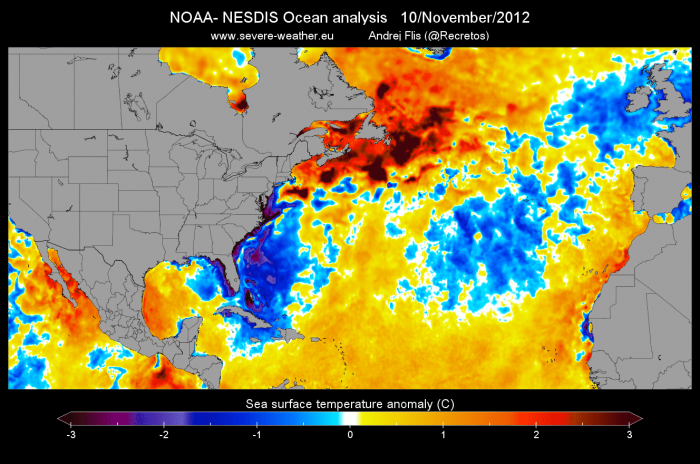
Below we have a sea surface temperature anomaly before the onset of Hurricane Sandy. We can see much of the tropical Atlantic was warmer than normal, along with the Gulf Stream area. The warmer the ocean, the more energy is available for a tropical system.
The sea surface temperature anomaly on the image below is after the passing of Hurricane Sandy. We can see a huge ocean temperature drop behind Sandy, from the western Caribbean all the way up the east coast of the United States.
Sandy has used the warmth of the ocean and the Gulf Stream, converting it into energy to power up. Left behind were ocean temperatures 4 to 6 degrees cooler. Some of the cooling is also due to the mixing of the ocean layers as a storm is passing over. Deeper cooler waters rise to the surface as the seas get very rough under a low-pressure system, overturning and mixing with the warmer surface waters.
OCEAN AND WEATHER FORECAST
What can we expect in the future? Current ocean forecasts show the continuation of the very warm Gulf Stream waters, while the North Atlantic remains neutral to colder than normal.
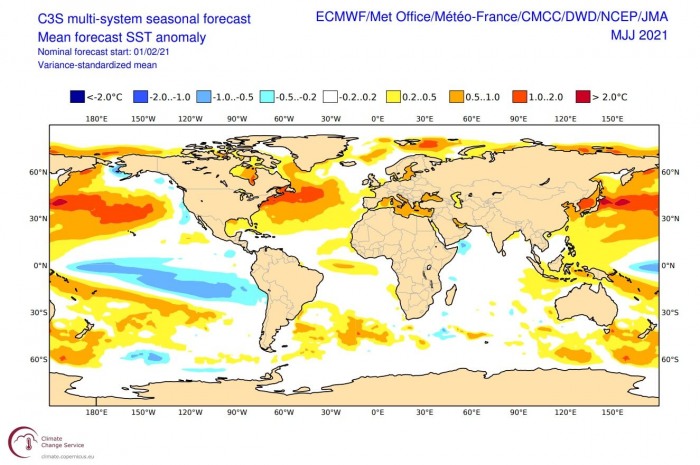
Below we have the early Summer sea surface temperature forecast, combined from different models, all showing the same thing. This is a significant anomaly, based on its time and location, and can be a cause for concern, especially for the eastern United States.
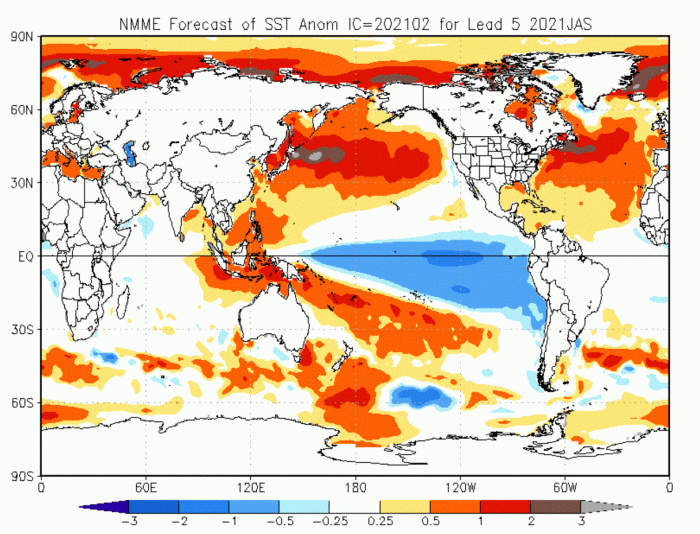
Looking at late summer and early Autumn, the ocean temperatures won’t be any different. The Gulf Stream is still warmer than normal, with the higher temperatures also expanded across the tropical Atlantic.
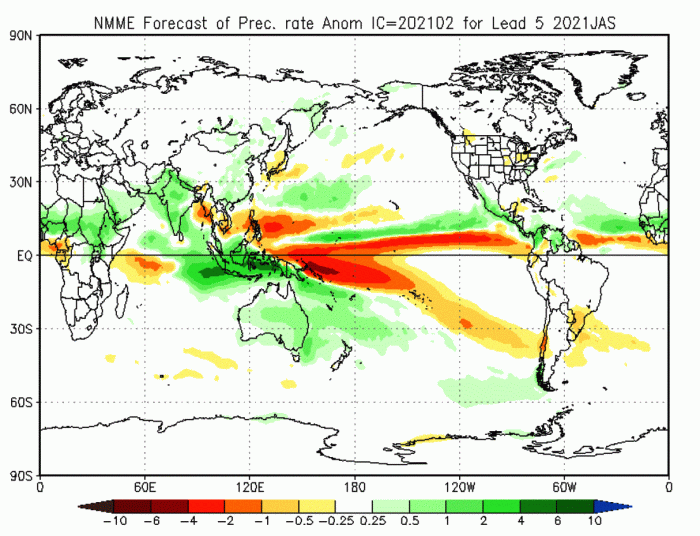
Looking at the precipitation anomaly forecast, we have an early indication of more precipitation than normal from west Africa. It expands across the Atlantic towards the Caribbean and also over the eastern United States and the Gulf Stream area.
This is a very ominous sign, which directly points towards a more active Hurricane Season. Warmer ocean waters, combined with more precipitation usually point towards more tropical storm activity.
This would be especially bad, considering the warmer than normal Gulf Stream area, which could amplify the storms that approach the southeastern United States or the east coast. If not amplify, it could at least prevent the tropical system from weakening a lot, enabling their landfall at higher power than they would normally produce.
We will keep you updated as fresh data is available, and more reliable forecasts are released for the Hurricane season. So make sure to bookmark our page, and activate the “show more” button on this article, if you are reading us from the Google Discover feed.
SEE ALSO:
