Cold La Nina is returning for Winter 2021/2022, with a “La Nina watch” now officially issued for the coming months. New cooling in the tropical Pacific has begun, expected to intensify into Autumn and towards the Winter season.
But what exactly is this La Nina, and how can it be so powerful to impact the winter weather across the entire Northern Hemisphere? As you are about to find out, La Nina is actually a part of a large system that connects the ocean and the atmosphere called the ENSO.
We will also take a look at the first long-range forecasts for Autumn and Winter 2021/2022, to see if there is any hint of a La Nina impact on our weather.
EL NINO SOUTHERN OSCILLATION
To keep it as simple as possible, ENSO is short for “El Niño Southern Oscillation”. This is a region of ocean in the tropical Pacific, which is alternating between warm and cold phases, called El Nino and La Nina, respectfully.
ENSO has a major impact on the tropical convection patterns and the complex interaction of the ocean-atmosphere system. We can observe changes in large-scale pressure patterns in the tropics and with some delay also in the rest of the world, as ENSO shifts between its phases.
The image below shows the ENSO regions in the tropical Pacific. The main regions are 3 and 4 and together cover a large part of the tropical Pacific. Most forecasts and analyses are based on a combination of both regions, 3 and 4, seen on the image as the Nino 3.4 region. Region 3 covers the eastern tropical Pacific, while region 4 covers the central and western parts.

Each ENSO phase has a different effect on the weather in the tropics and the overall circulation and thus impacting the weather worldwide differently. A specific phase (cold/warm) usually develops in late summer and autumn and can last until next summer, or even up to two years in some cases.
The cold ENSO phase is called La Nina and the warm phase is called El Nino. The name La Nina literally translates to “the girl”, and the name El Nino translates to “the boy”, indicating an opposite relation between the phases.
We determine the ENSO phase by the sea surface temperature anomalies (warmer/colder) in the ENSO 3.4 region in the tropical Pacific, which you saw in the image above.
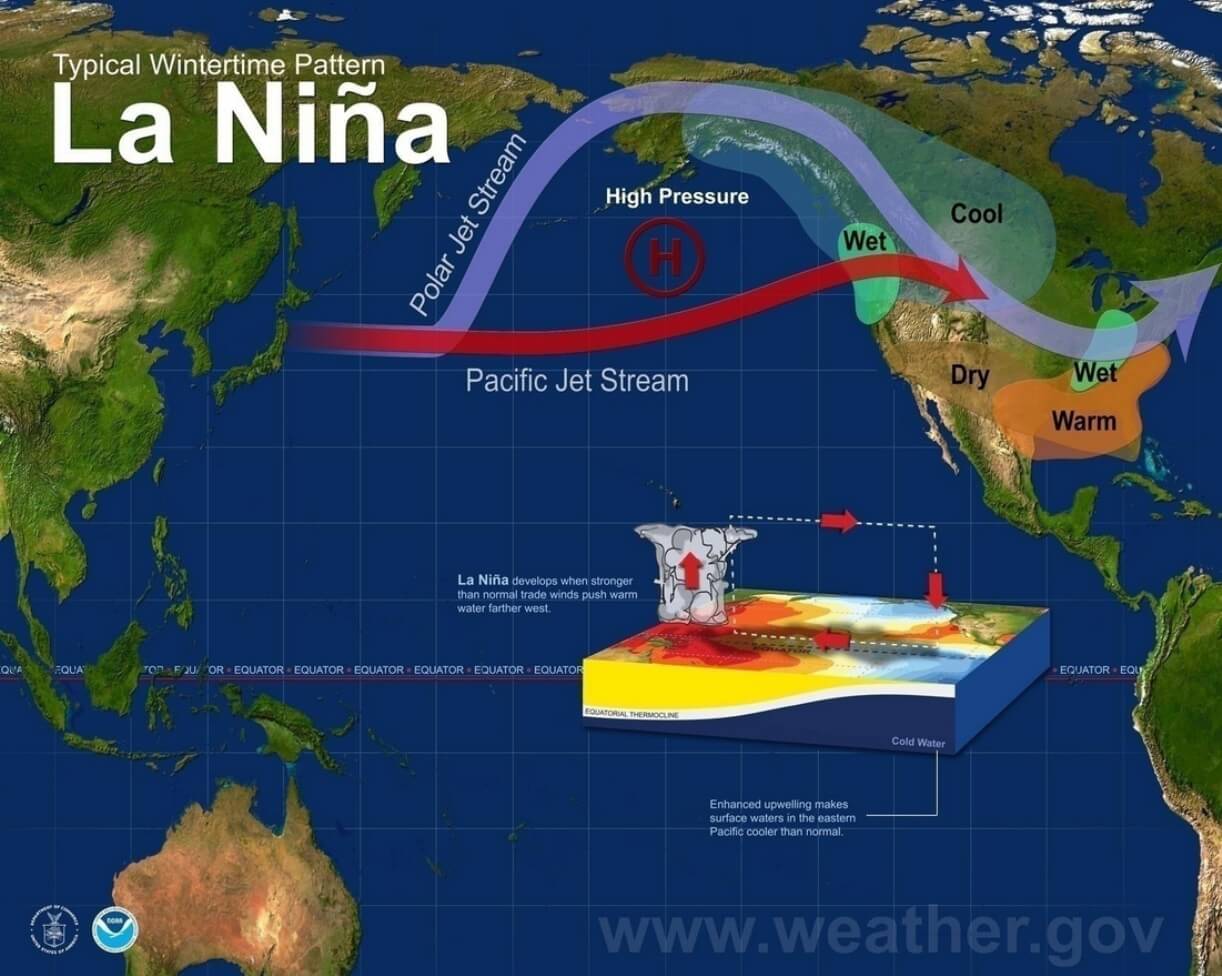
The image below from NOAA Climate shows the typical circulation during a cold ENSO phase. Air descends in the eastern Pacific, causing stable and dry weather, while air rises in the western Pacific, causing frequent thunderstorms and a lot of rainfall.
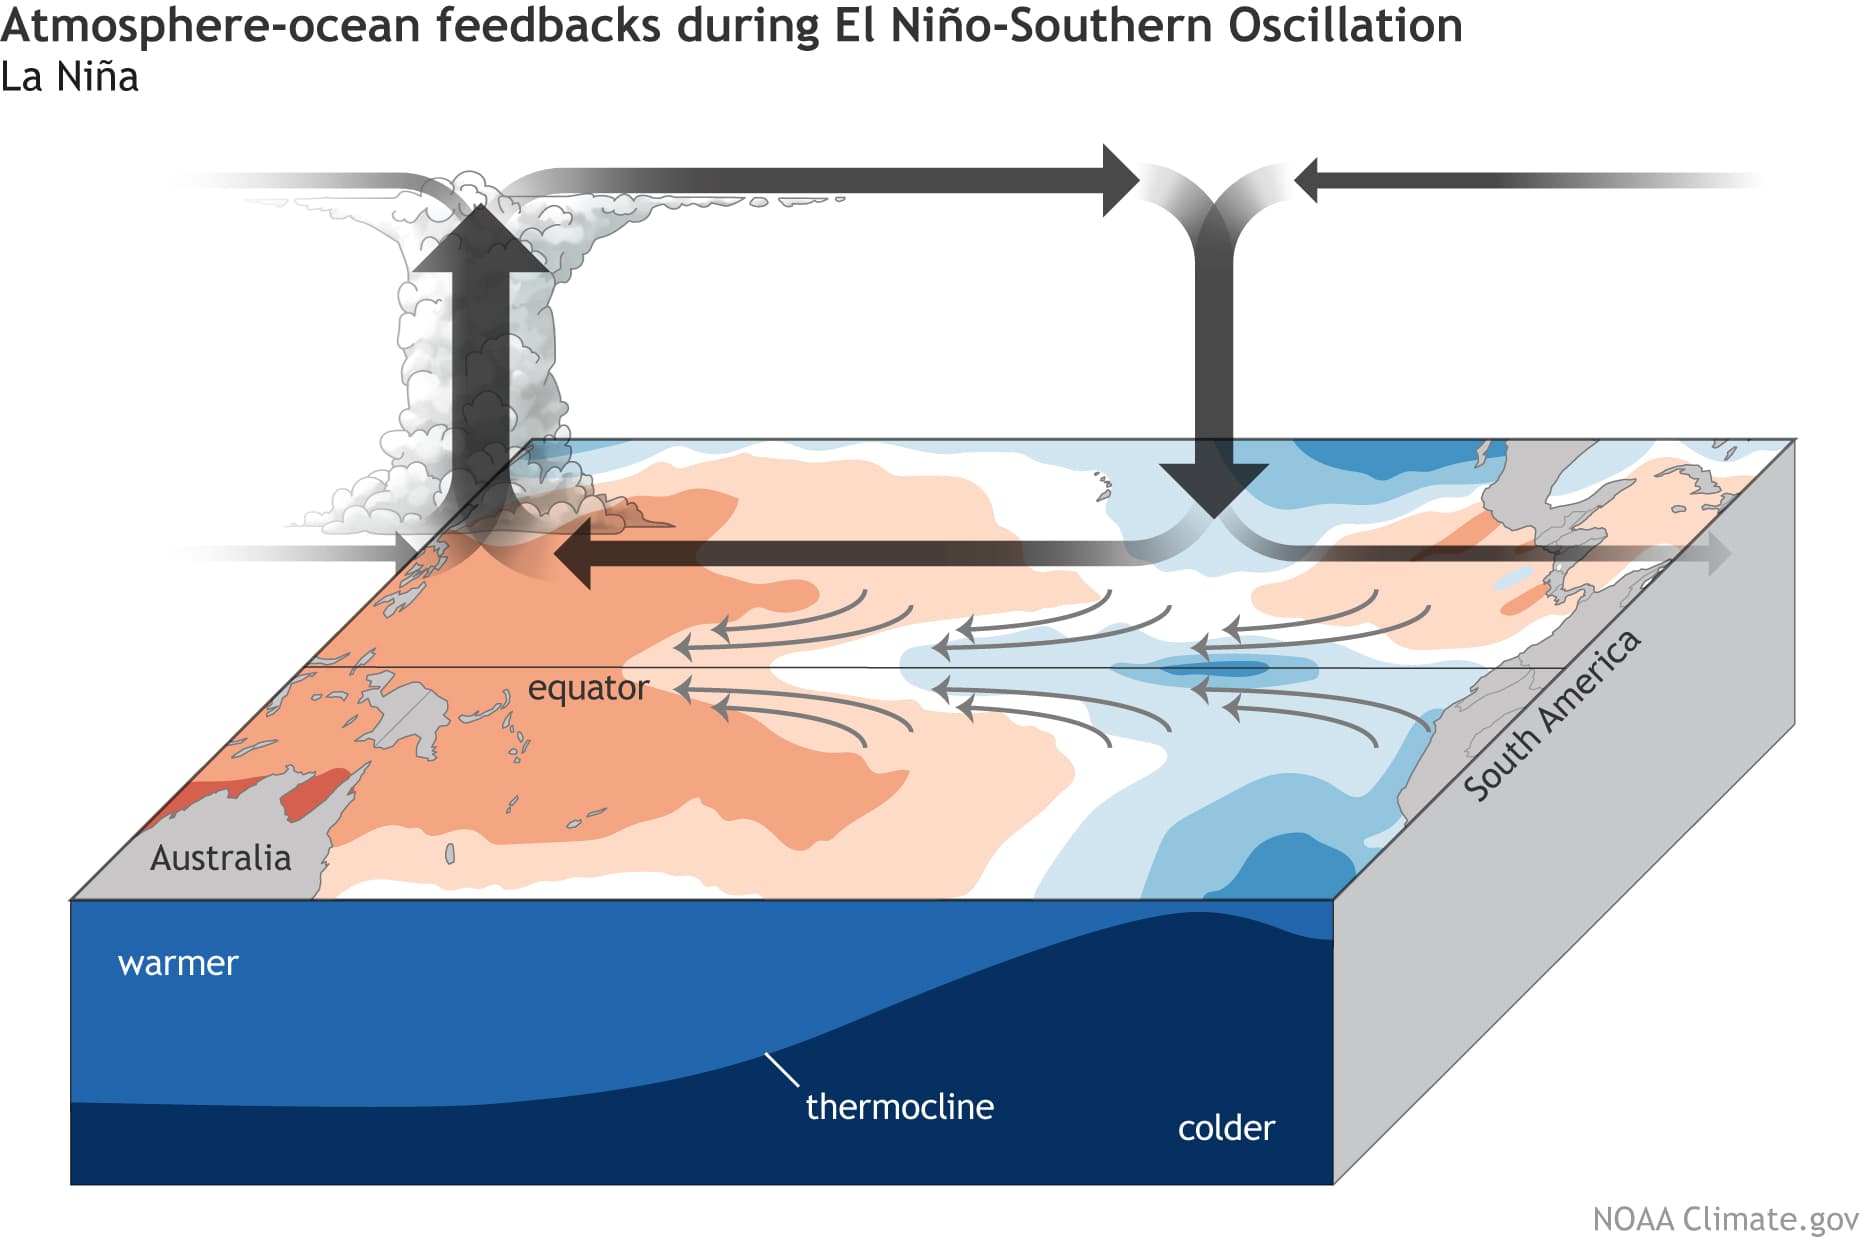
This way, ENSO has a major impact on the tropical rainfall and pressure patterns and impacts the ocean-atmosphere feedback system. Through this ocean-atmosphere system, the ENSO influence is distributed globally. We usually observe a global shift in pressure patterns during the emergence and duration of the ENSO phases.
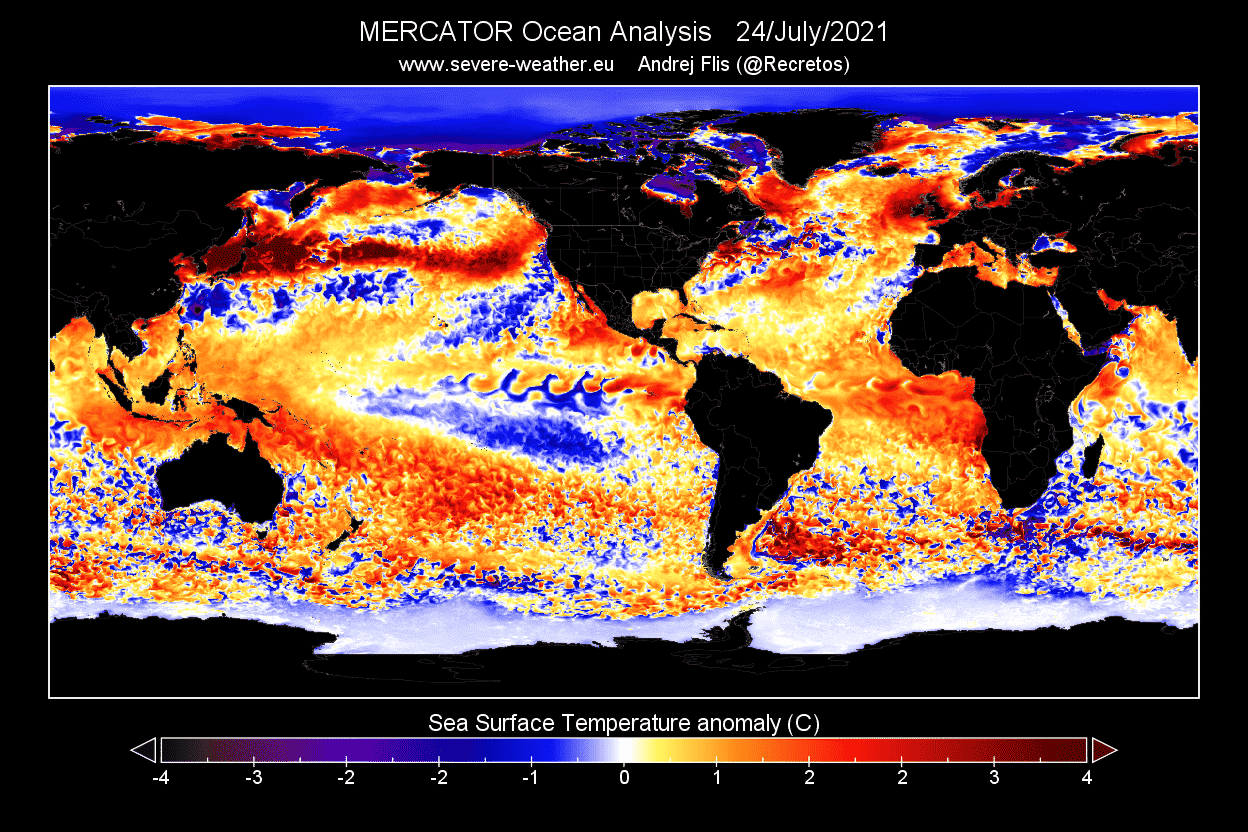
Current global ocean anomaly analysis reveals a cooling in the tropical Pacific. This is exactly in the ENSO 3.4 region, seen earlier above. The “wave-like” shape of the cold anomalies indicates that this cooling is in its early stages.
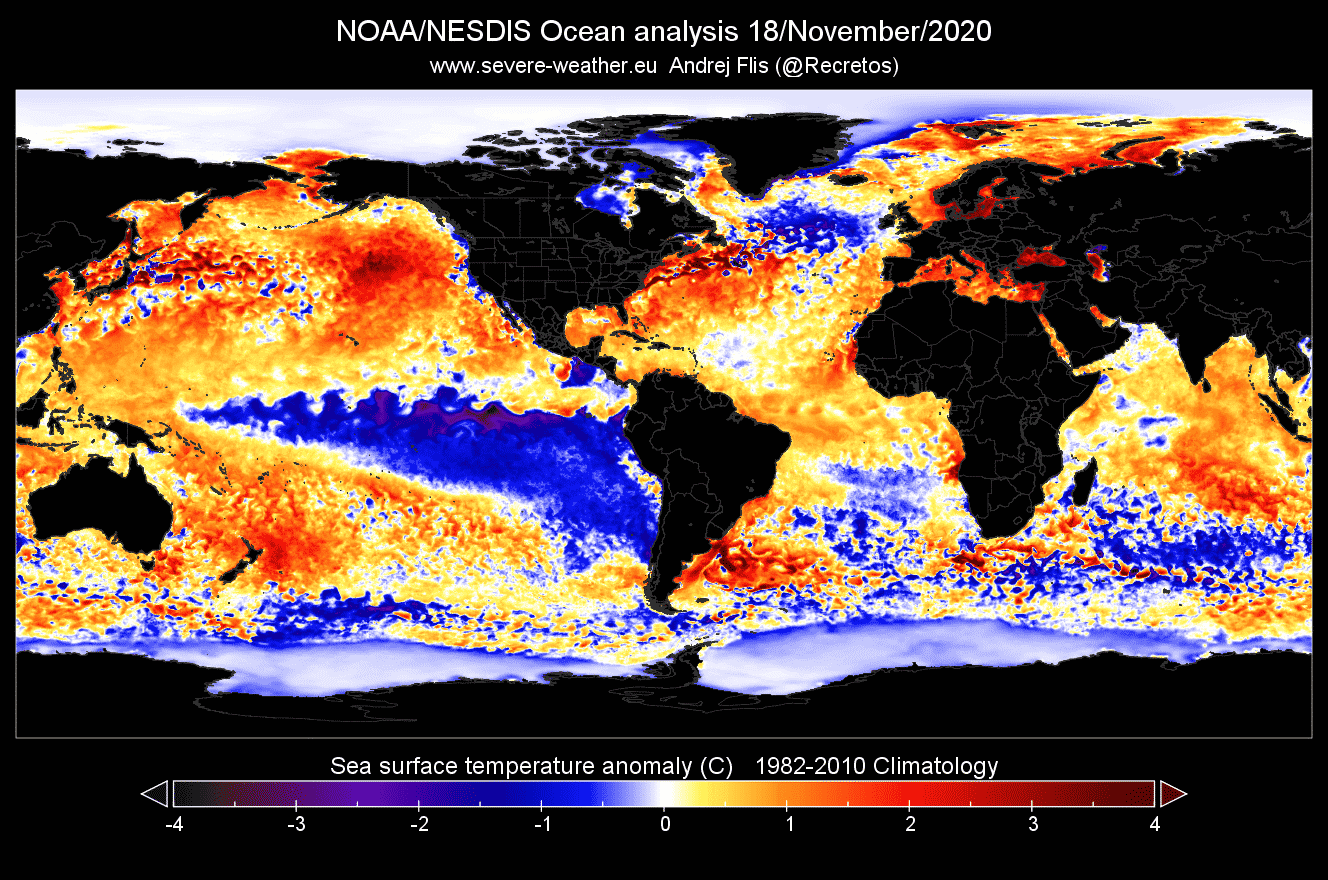
Some of the cold anomalies are actually leftover from the strong La Nina that lasted from last Autumn and over Winter, ending this Spring. The image below shows the temperature progression in the ENSO regions, where you can see the La Nina phase in 2020/2021, ending this Spring.
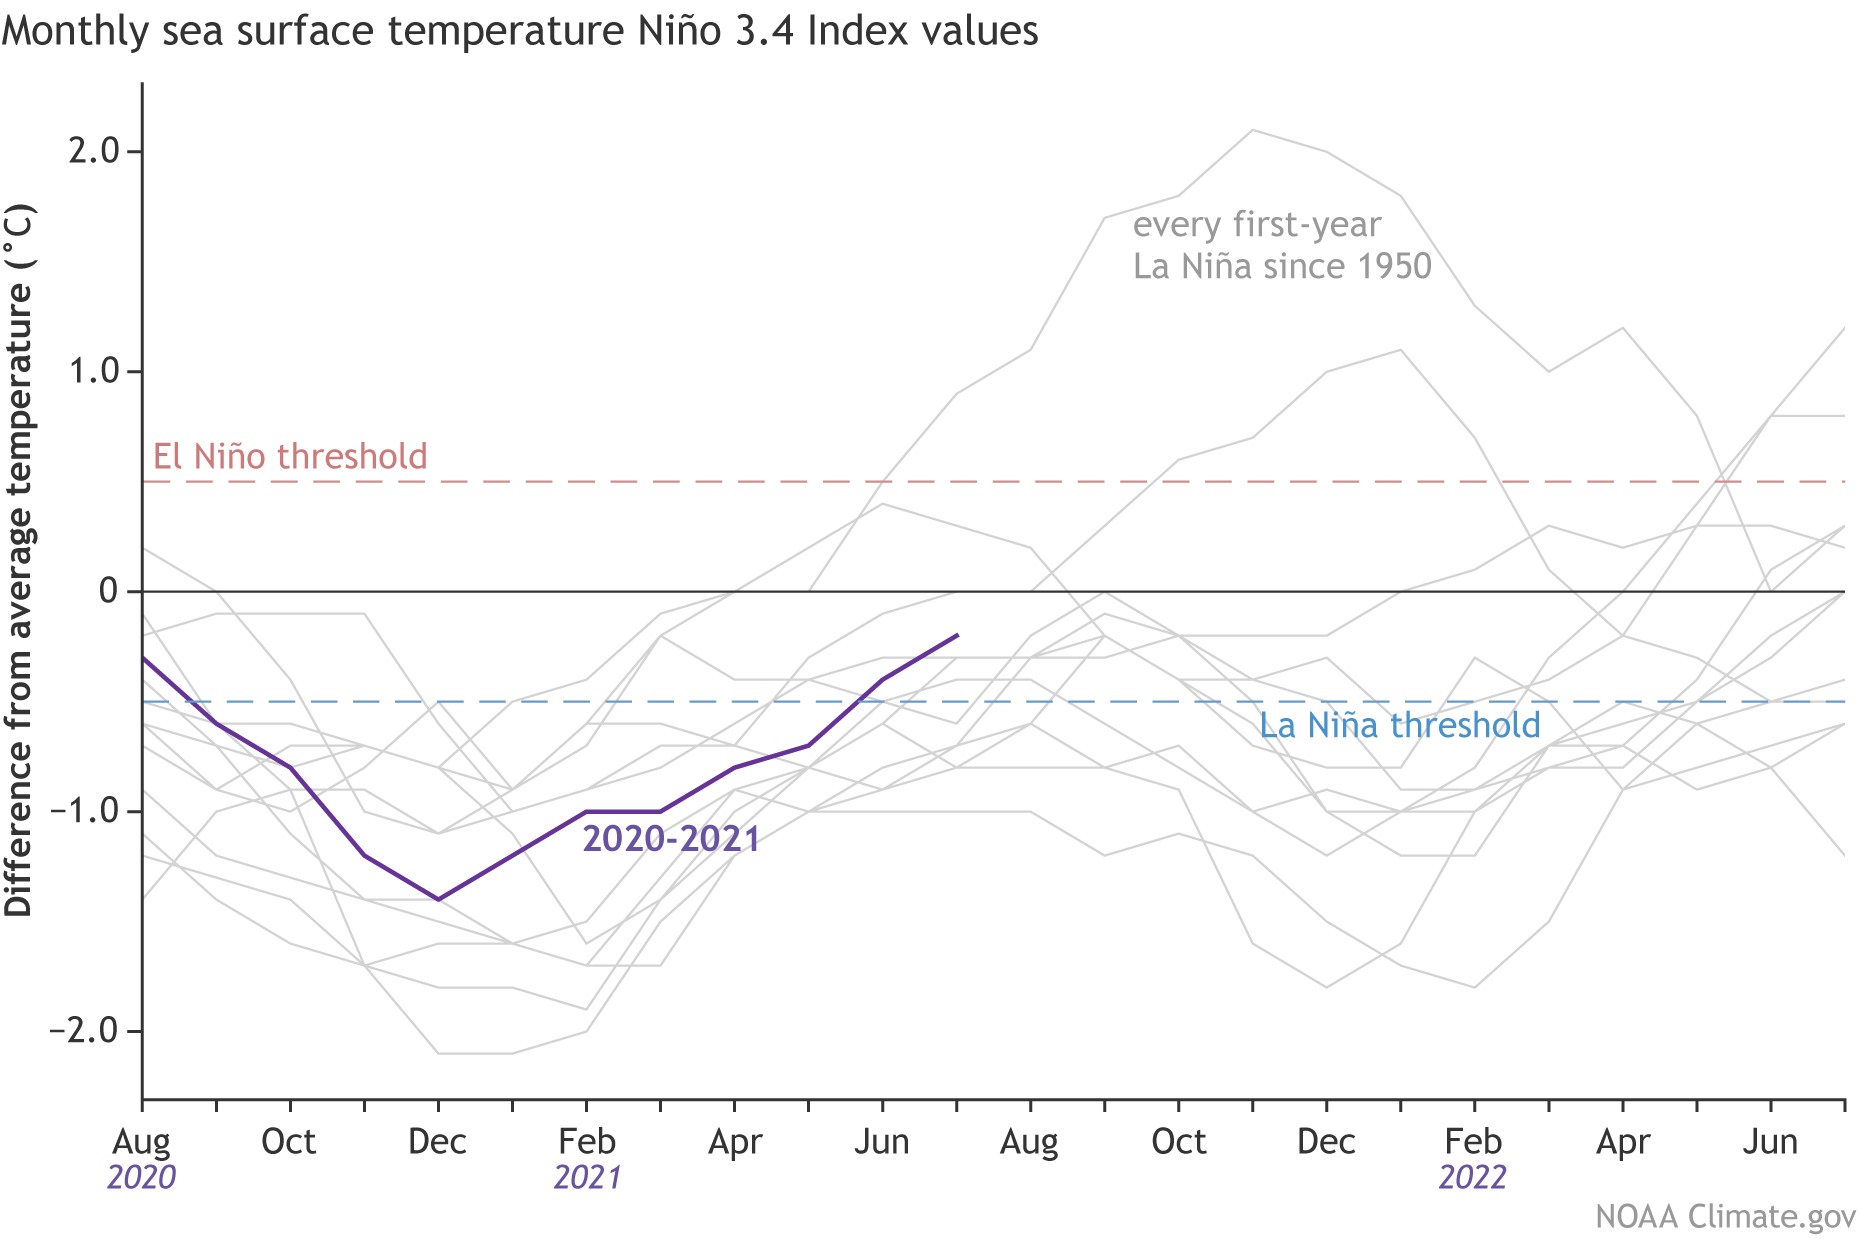
What is perhaps also interesting in the image above, is that a lot of first-year La Ninas continue to evolve into a second La Nina next season. This is exactly what we are expected to see this year, as new cooling is emerging in the ENSO region. Such an event is called a second-year La Nina.
But it is not unusual to have two La Nina events follow each other. In fact, of the twelve first-year La Nina events, eight were followed by La Nina the next winter, two by neutral, and two by El Nino.
This transition is much better seen on the video animation below, which shows the ocean temperature anomalies from Spring into Summer. You can see the cold anomalies of the first La Nina waning over Spring, and new cooling now starting in July.
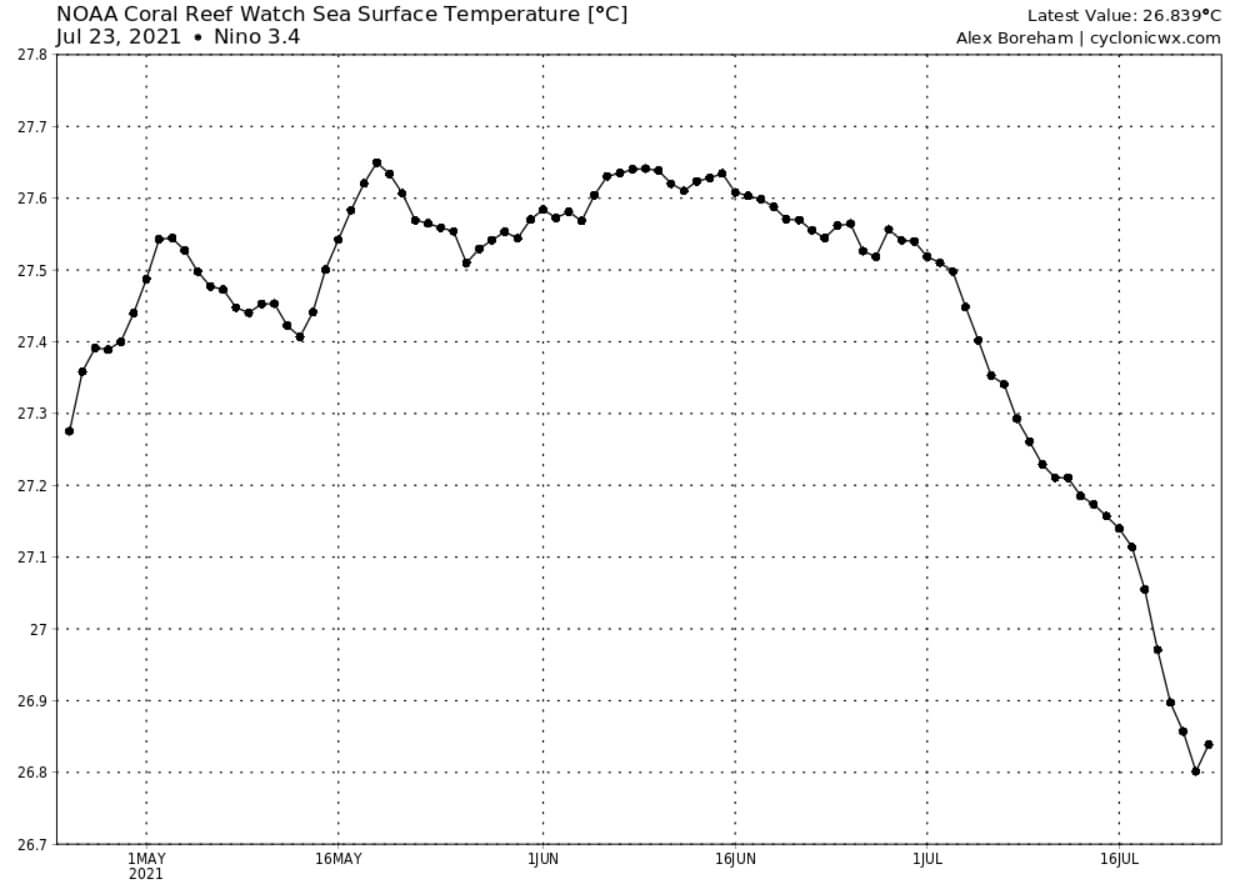
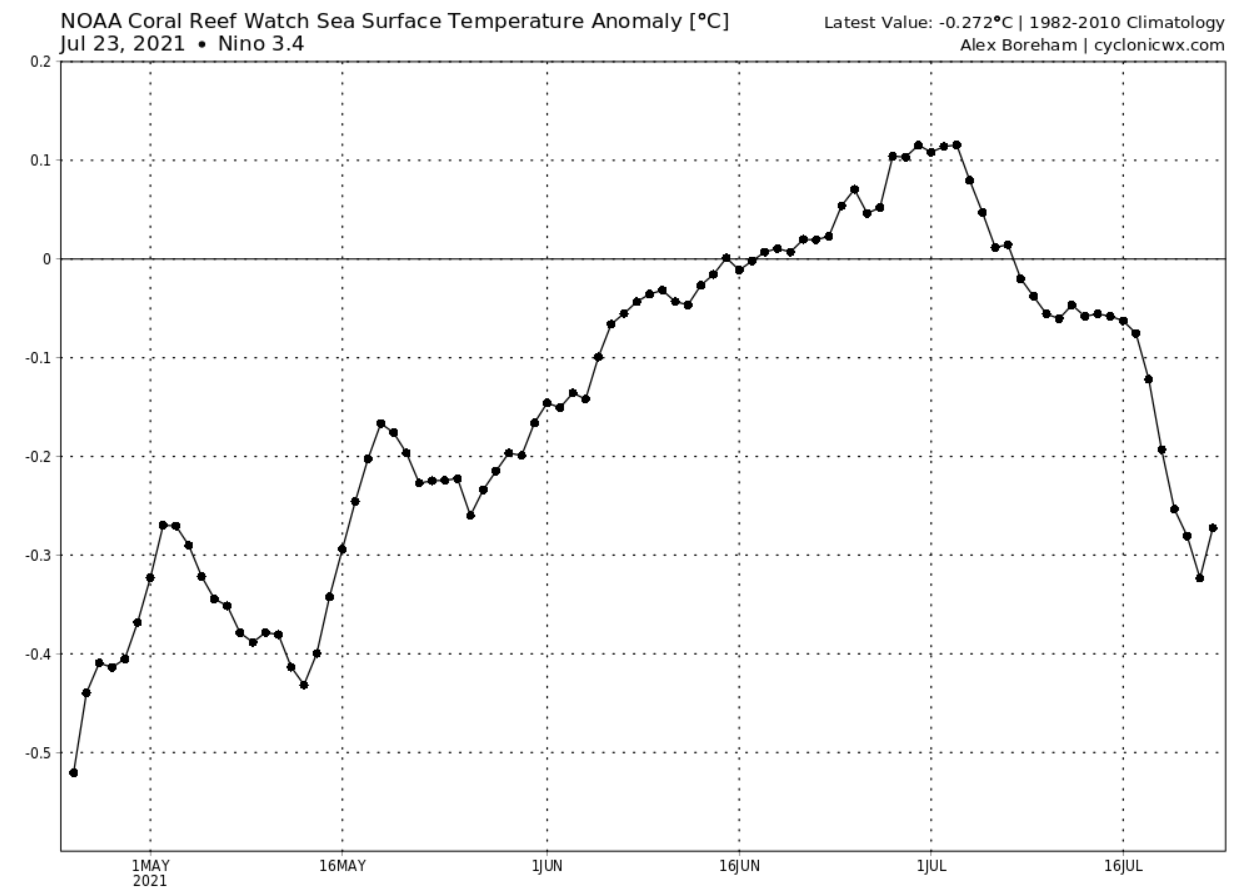
The current cooling has been quite substantial and persistent over the past weeks. The image below shows the sea surface temperatures in the main ENSO 3.4 region. We can see a steady temperature drop since early July, which is expected to continue, with some intermittent warming in-between.
But we have to remove the normal temperatures, to see the actual cooling, and the cold anomalies. The image below shows the temperature anomaly in the ENSO 3.4 region and reveals the ending of the first-year La Nina in Spring, and new cooling now starting the second-year La Nina.
Below we have a close-up image of the ENSO regions. You can nicely see the developing cold anomalies, as the pressure patterns are changing again, helping to initiate the wind-driven ocean cooling.

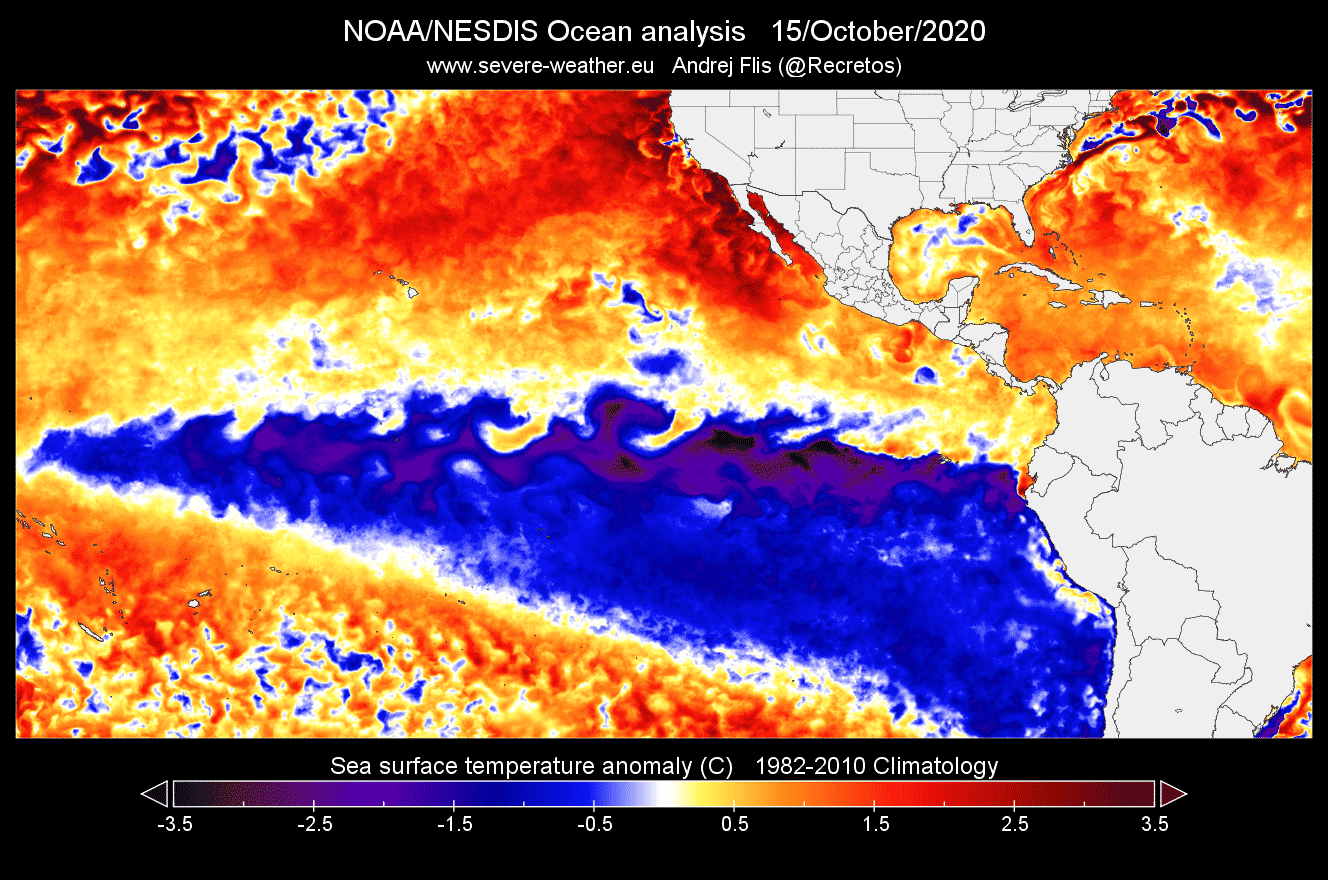
Looking back to last Autumn below as a comparison, you can nicely see the much stronger cold anomaly across the equatorial Pacific Ocean. This is the strong La Nina from last season, which reached its peak in late November and early December 2020.
If we look at the actual current temperatures, they reveal a “cold-tongue” extending from South America, towards the west, directly across the equator. In this region, the surface waters are always colder than the surrounding regions, but during a La Nina event, they can be up to 4°C colder than normal.

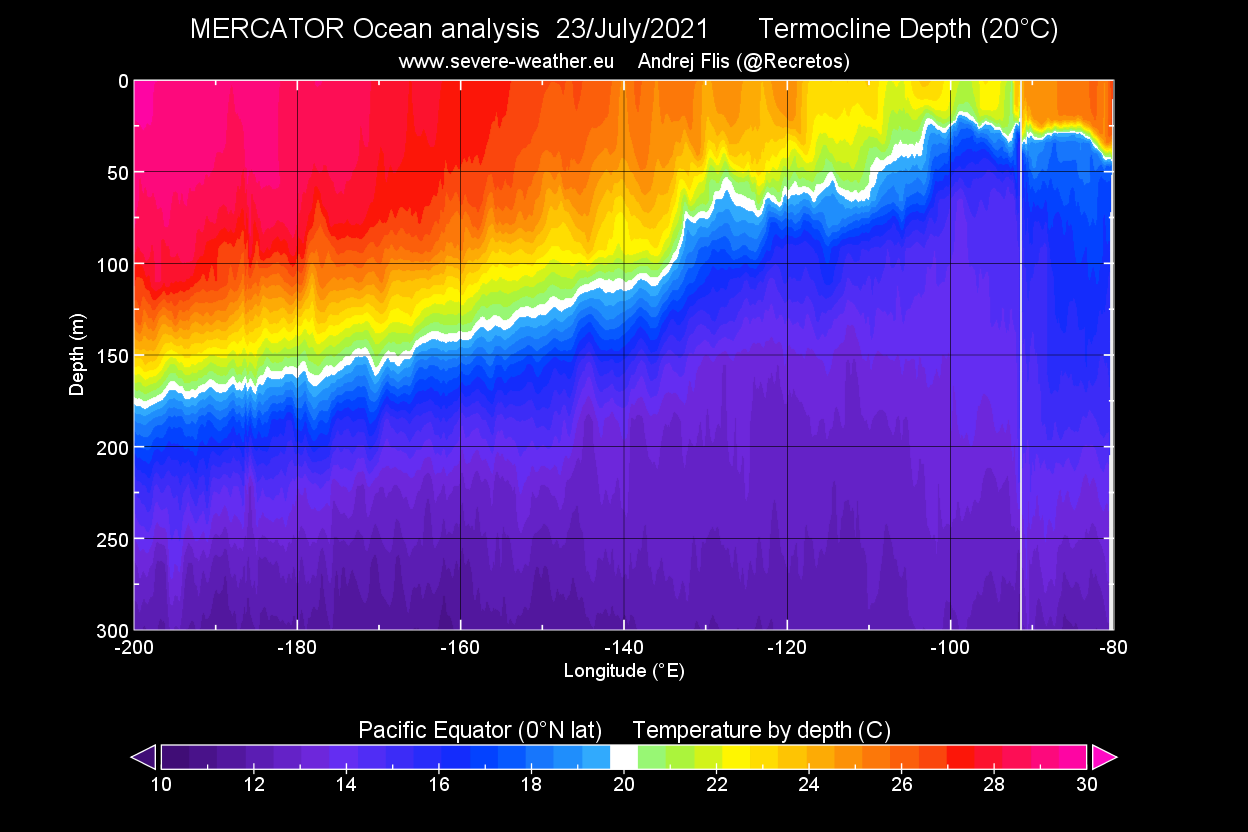
Next image below shows a cross-section by depth along the equator in the Pacific Ocean, from the Asian side on the left to South America on the right. The full vertical profile over the ENSO regions reveals the ocean temperature anomaly by depth. You can see that the strongest anomalies are found between 50 and 150 meters below the surface.
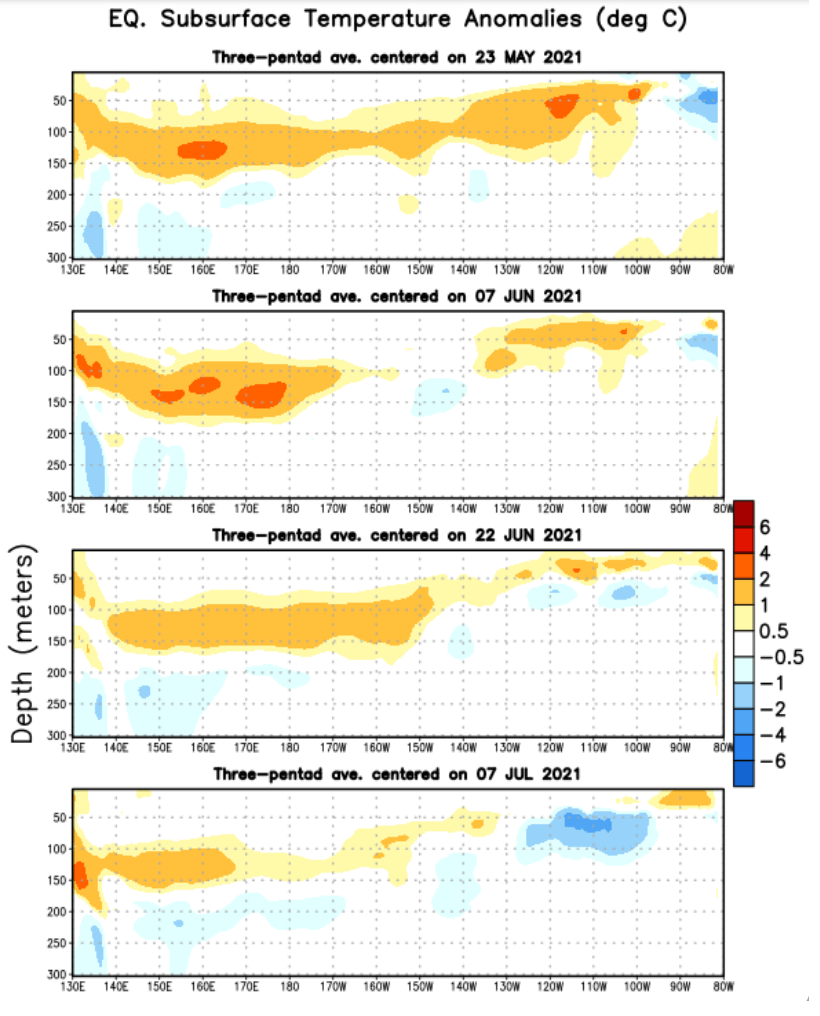
It is nicely evident how there were actually warmer than normal ocean temperatures below the surface this Spring. This has helped to end the La Nina event. But you can see that by July, the warm anomalies have substantially weakened, and cooling has begun at around 50 to 100 meters below the surface.
The latest depth analysis over the ENSO regions shows the cooling is continuing steadily. The large cold pool is now extending further west and going deeper, now reaching between 50 and 150 meters deep.

Based on all the available data, an official La Nina watch has been issued by the NOAA’s Climate Prediction Center:
“ENSO-neutral is favored through the Northern Hemisphere summer and into the fall (51% chance for the August-October season), with La Niña potentially emerging during the September-November season and lasting through the 2021-22 winter (66% chance during November-January).”
LA NINA VERSUS EL NINO
To fully understand the ENSO, we also have to look at its warm phase. Below we have two images of ocean temperature anomalies, one is the last La Nina in October 2020. The second is the strong El Nino event of the 2015/2016 winter season.
We can see a completely opposite situation and two different phases over the same area of the ocean. Cooler than normal ocean temperatures during a La Nina, and warmer than average temperatures during an El Nino. As we will see later, their influence on the weather is also diametrically opposed.
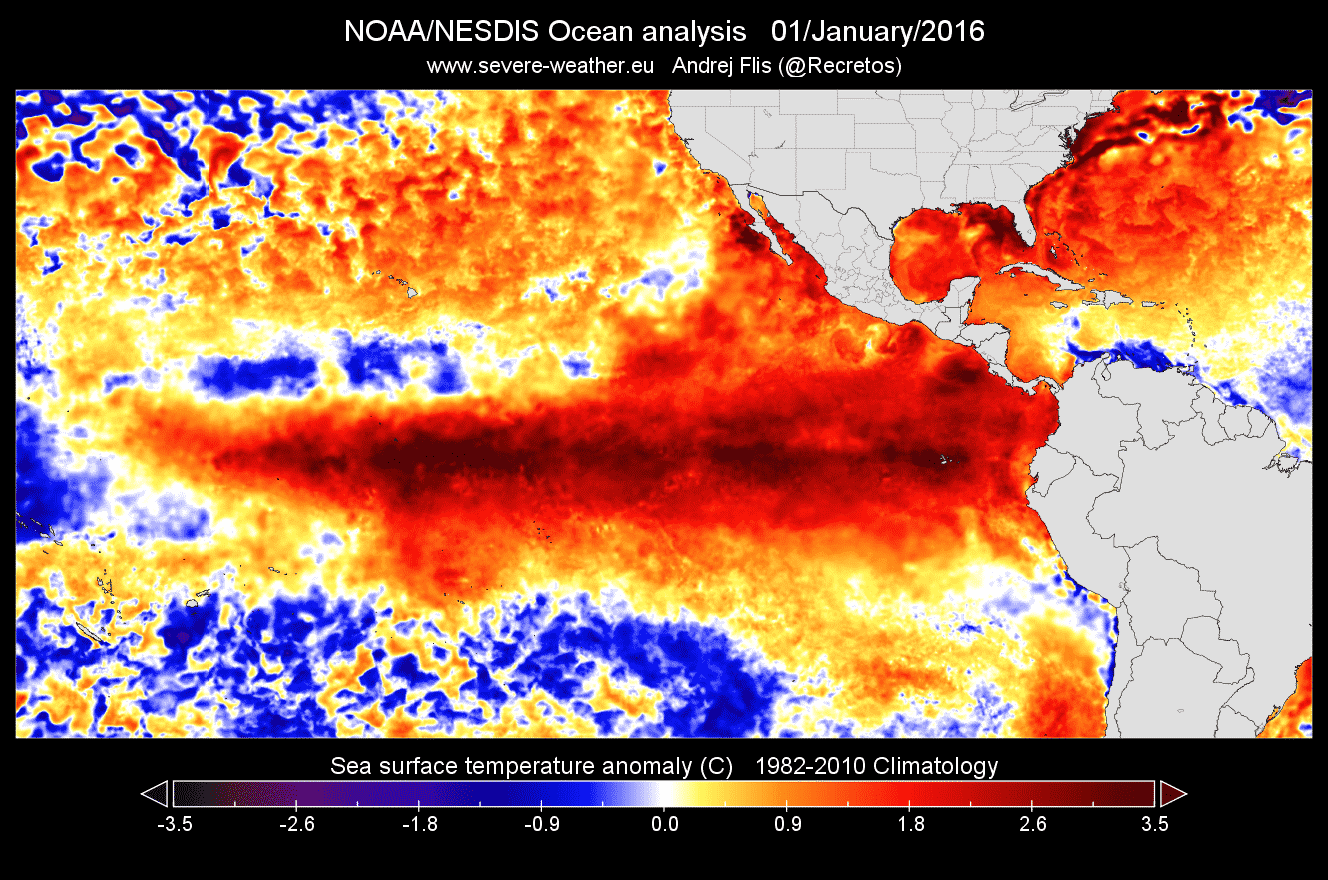
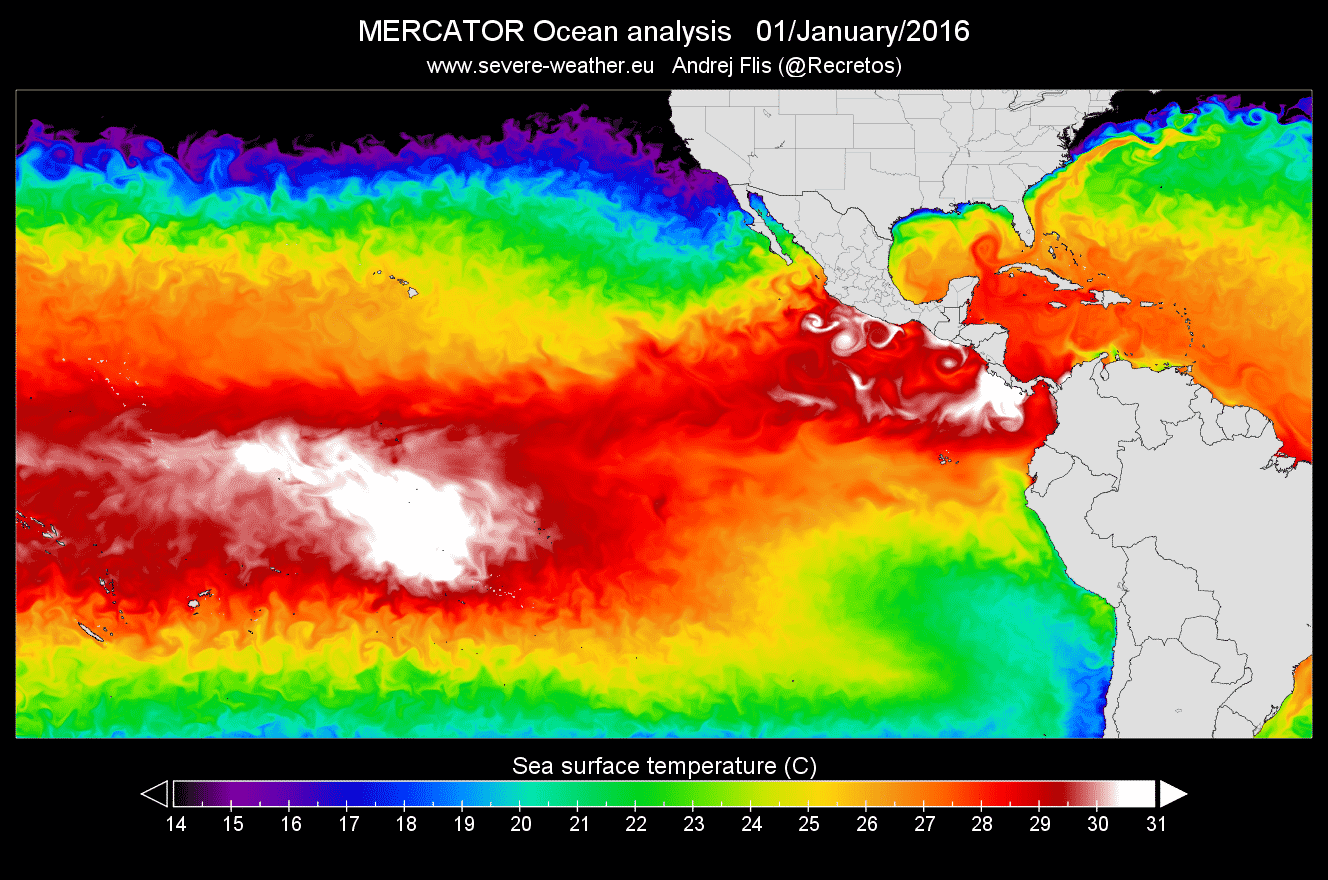
Looking at the actual temperature instead of the anomalies, we can also see a big difference in the temperature of the ocean surface. The first image shows the sea surface temperatures in the last La Nina, and the second image shows the temperatures during the 2015/2016 El Nino event.
Obvious again is the “cold tongue” of cooler ocean water during a La Nina, which creates these negative anomalies. The ocean temperature difference between the La Nina and El Nino can be quite large, up to 10 degrees Celsius in some places.

You can briefly see the “cold tongue” also in the warm phase below, but it is very suppressed, and much weaker than normal. This cold tongue is actually normal, but it is much stronger during a La Nina and much weaker during an El Nino.
But what causes these cold and warm phases? There is no simple answer, but we can say that it is a result of the complex dynamics between pressure patterns and winds. The tropical trade winds can usually initiate or stop a certain phase, as they mix the ocean surface and alter the ocean currents.
To keep it simple, the trade winds are steady, and persistent winds, which blow towards (and along) the Equator in both Hemispheres. The image below from Weather.gov nicely shows a simplified version of the global prevailing winds. Trade winds are in yellow and red, depending on the Hemisphere.

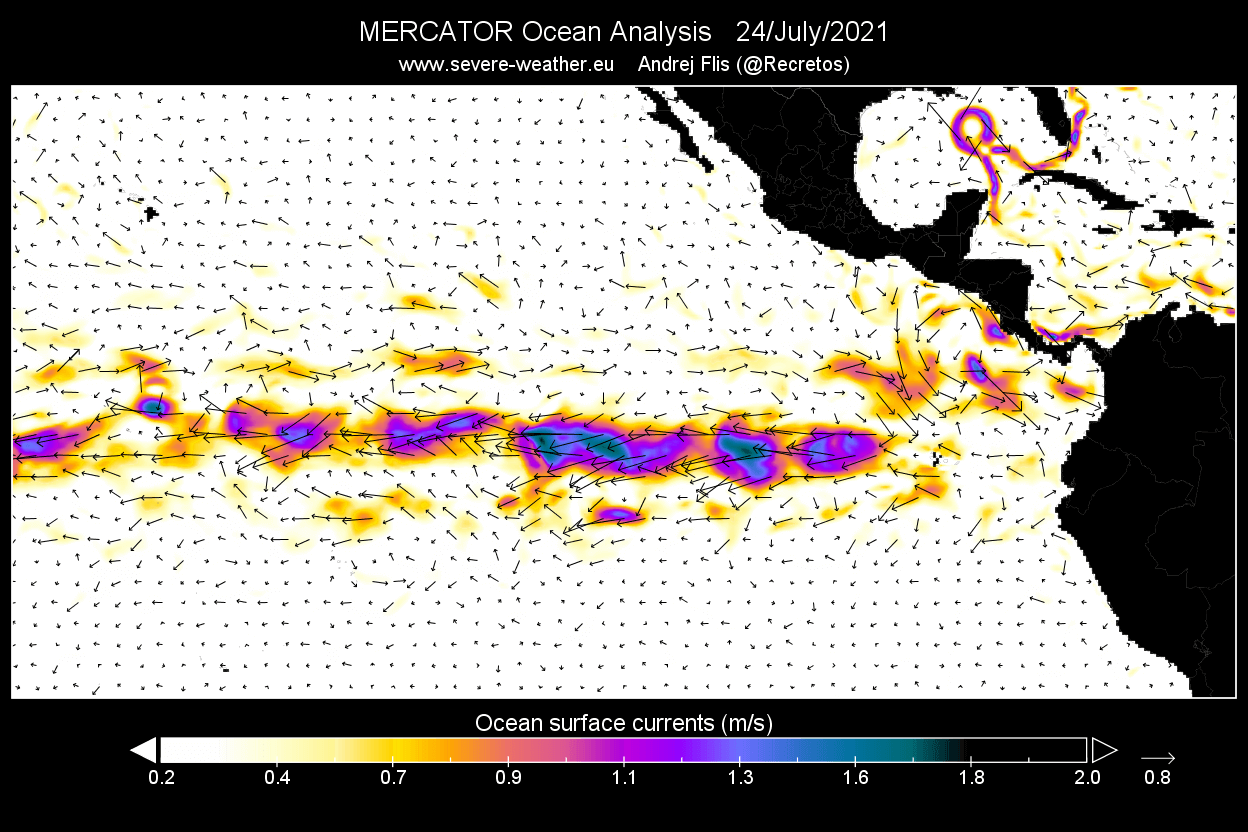
When these easterly winds get stronger, they can actually start changing the ocean surface currents, and they can start pushing the water from east to west. This moves warm surface waters towards the west, replacing them with the cooler waters from below the surface.
The image below shows the latest ocean surface currents in the ENSO regions. We can see strong easterly currents, which are pushing the water towards the west, and cooling the ocean surface. Also notice the nicely seen Gulf Stream, running from the Gulf of Mexico towards Florida, continuing towards the northeast, up the east coast of the United States.
But the secret is not just in the winds themselves, as they are being driven by pressure changes. The ENSO phase directly responds to a special atmospheric pressure variability, called the Southern Oscillation Index.
The Southern Oscillation Index or SOI represents the difference in average air pressure measured at Tahiti (French Polynesia) and Darwin (Australia). The image below shows the location of the two pressure zones.
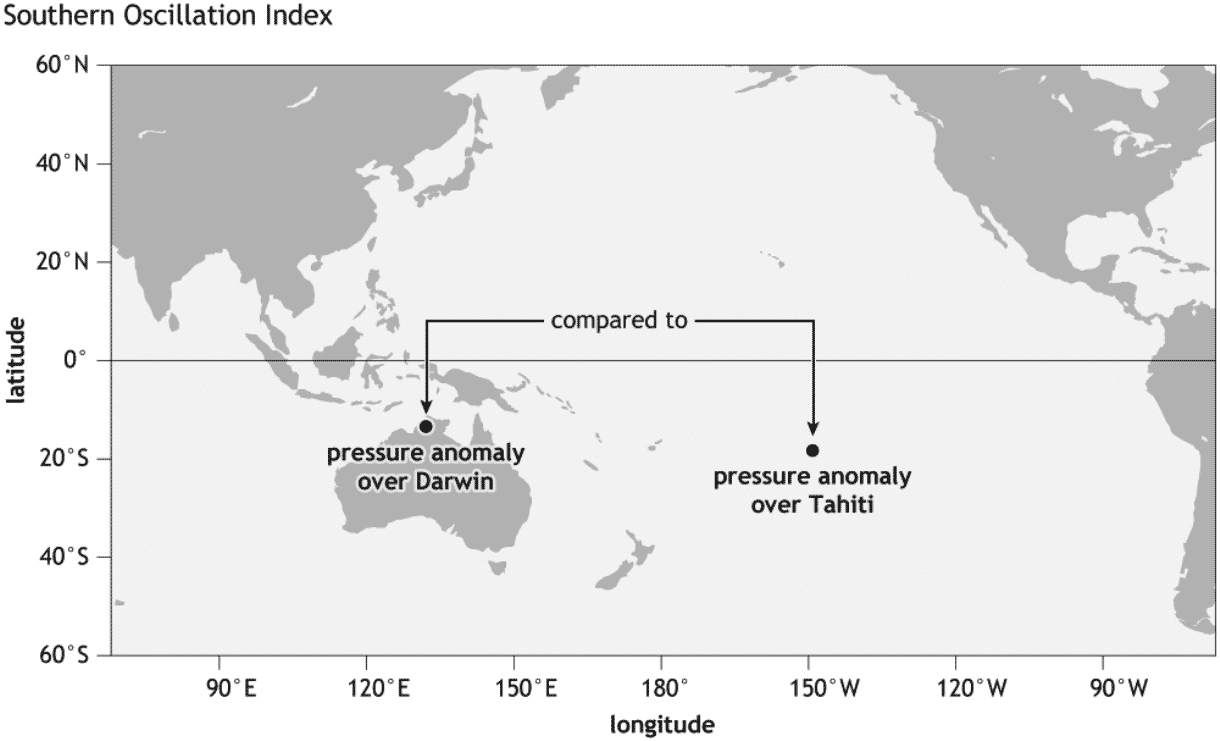
Positive SOI values indicate that the pressure over the Tahiti side is higher than over Darwin in Australia. This corresponds to La Nina conditions. But during an El Nino, we see lower pressure in the eastern Pacific and over Tahiti, and higher over Darwin, Australia. This produces a negative SOI value.
The SOI tells us what the pressure pattern looks like in the tropical Pacific, which then affects the trade winds, warming or cooling the ENSO regions.
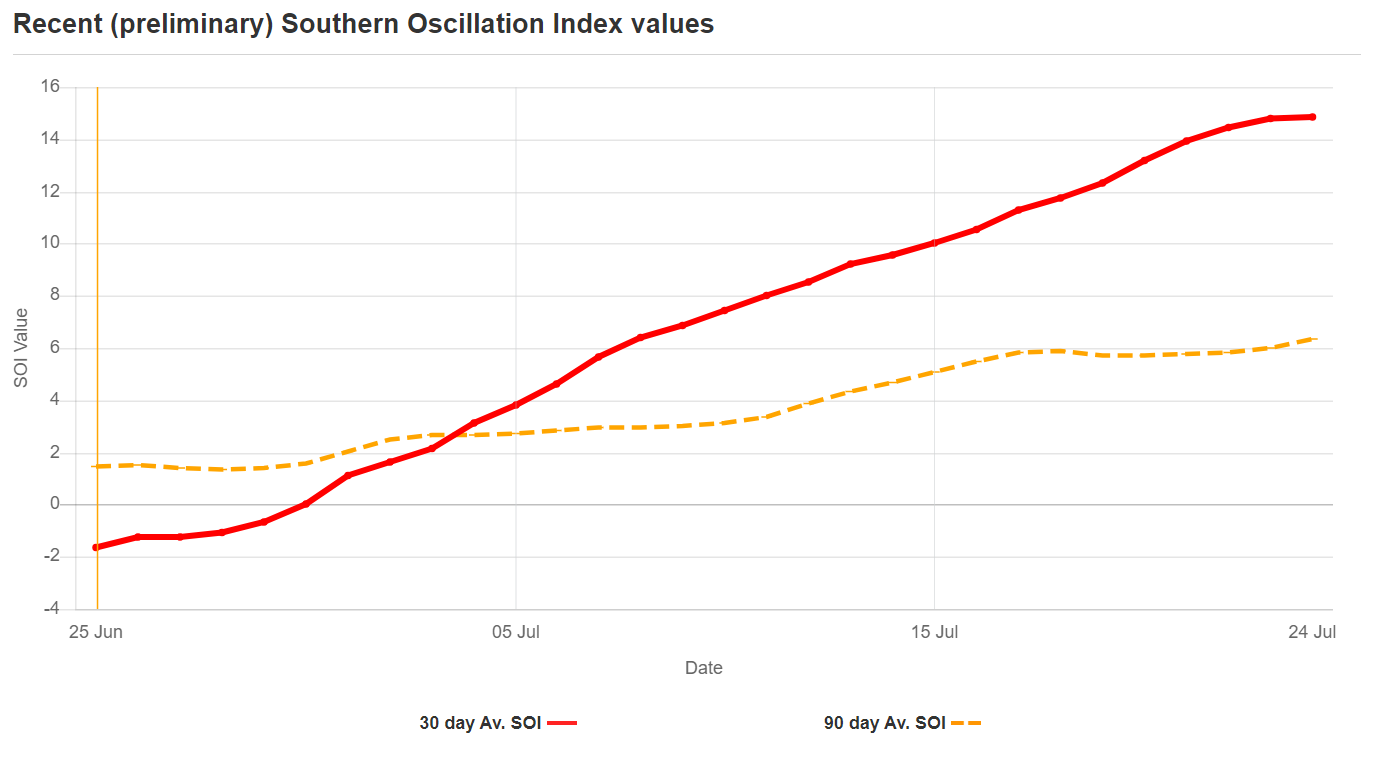
We have the 30-day and 90-day average SOI values on the image below, which show the increasing positive values and confirming the new development of the La Nina. The SOI can be used to determine the potential effect or influence of the ENSO phase on the climate in the western Pacific and Australia.
We can see this pressure change in the trade winds if we look at zonal (west-east) winds over time. The next image below shows the west-east movement of winds over the equator over time. The main ENSO regions are between 90W and 180W.
Positive zonal wind anomaly (red colors) mean weak easterly winds or even westerly winds. A negative zonal wind anomaly (blue colors) indicates stronger than normal easterly winds. We can obviously see for the next two weeks, there will be stronger than normal easterly trade winds present over the ENSO regions. That will support persistent cooling across the central ENSO regions. The graphic is by cyclonicwx.com.

Strong trade winds are also important because they affect the food chain across the tropical Pacific regions. Strong trade winds mean that deeper and cooler water rises up from beneath the surface to replace the water that was pushed away.
This process is known as “upwelling.” Essentially this is a vertical transport process, as shown in the image below, which transports cooler waters and nutrients to the surface.
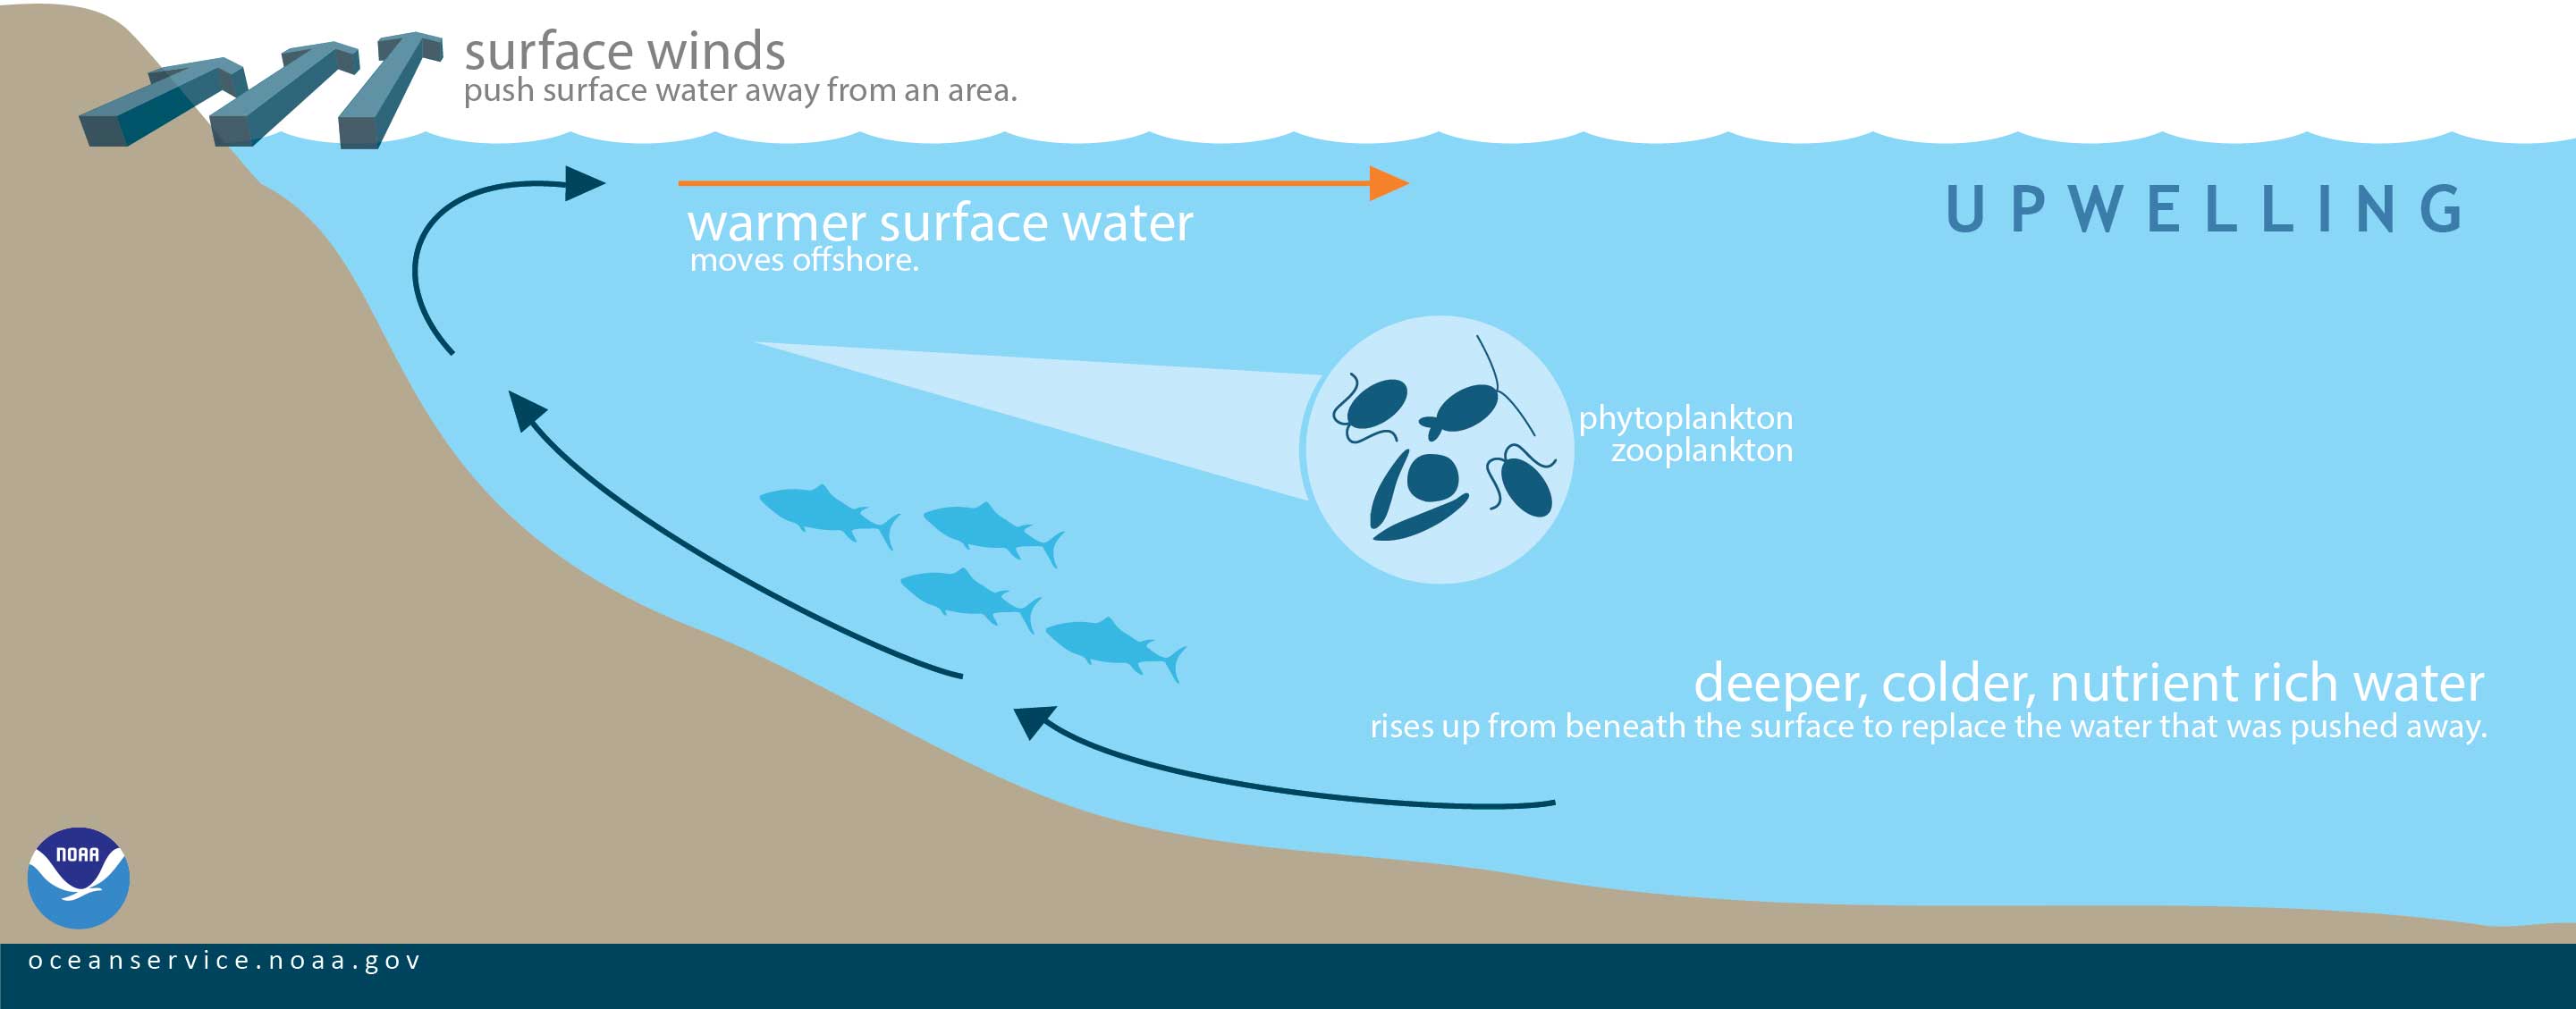
Water that rises to the surface as a result of upwelling is typically colder and is quite rich in nutrients. These nutrients can “fertilize” the surface waters, meaning that these surface waters often have high biological productivity. We can track that by looking at the amount of chlorophyll (phytoplankton) in the ocean.
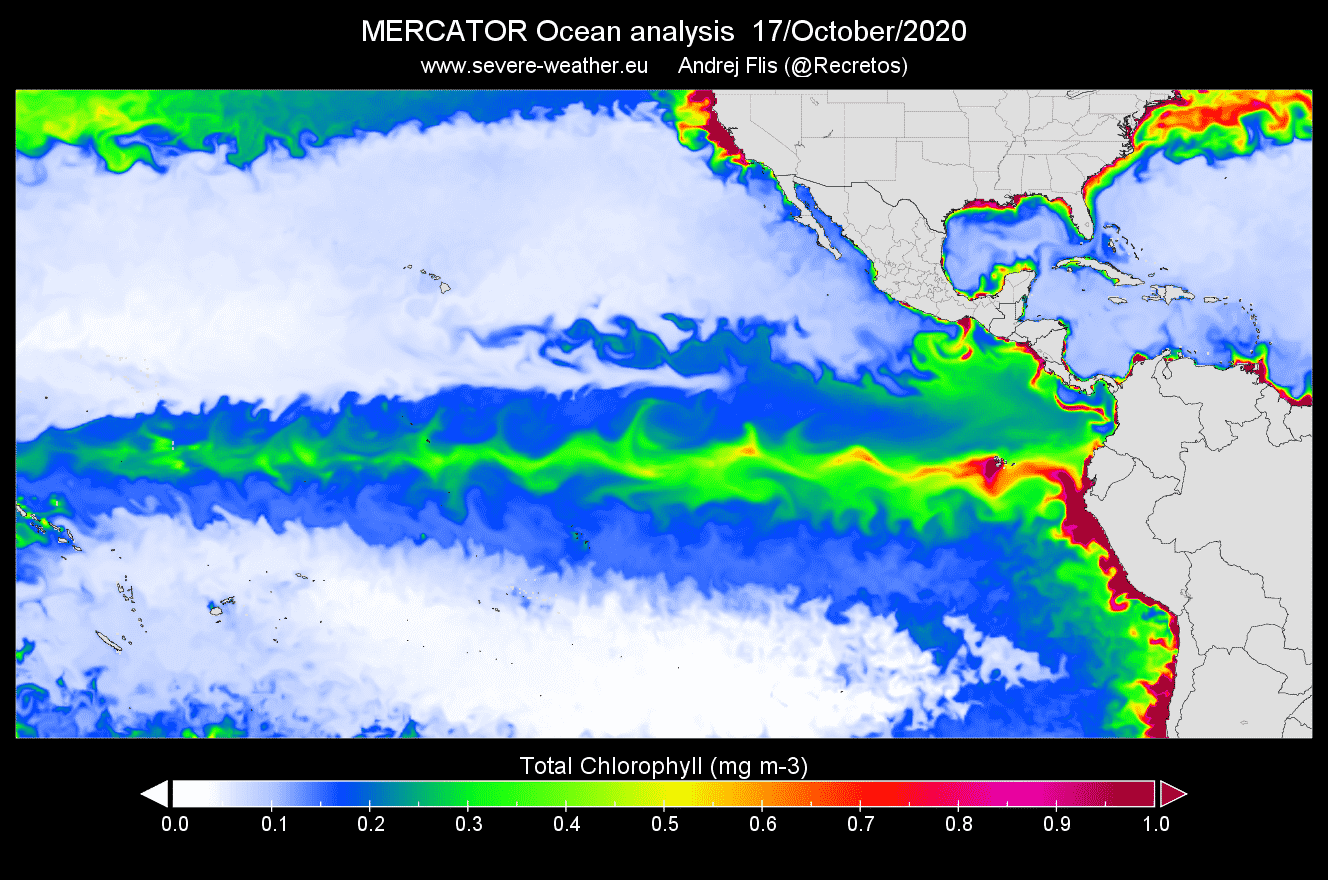
The comparison below shows the Chlorophyll concentrations in the last La Nina (first image) and during the same period in the 2015 El Nino event (second image).
We can see that during La Nina, much more nutrients are available along the entire ENSO region, and also by the coastal areas of Middle and South America. This means more food is available for the fish, indicating a potentially good fishing season in the eastern equatorial Pacific.

We can nicely see this upwelling effect when looking at the temperature by depth during a La Nina and an El Nino event. The first image below shows the water temperature by depth during the 2015/2016 El Nino event.
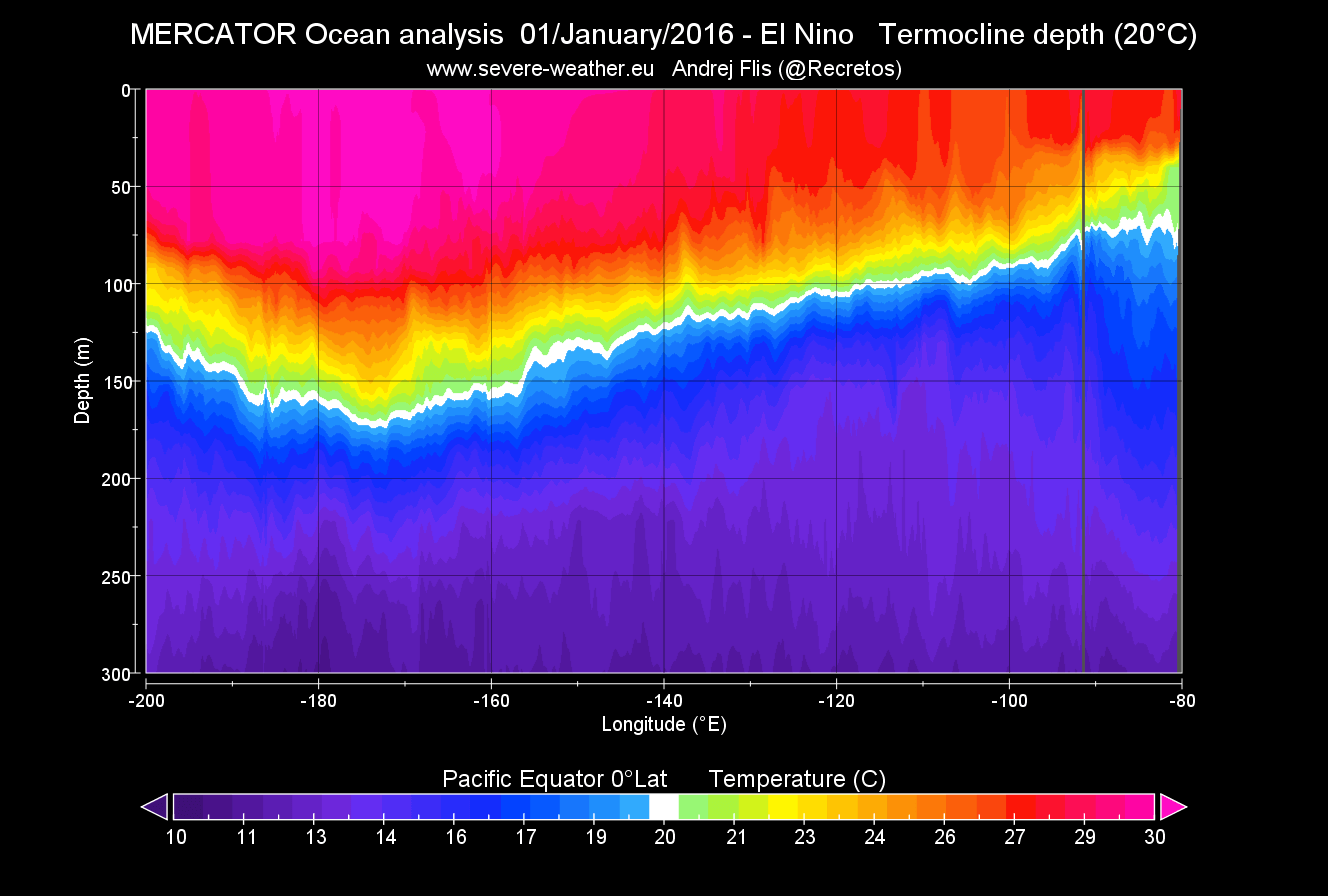
Below is the temperature during a La Nina event, and you can nicely see how the 20°C threshold is much closer to the surface during a La Nina. This is due to the upwelling effect, as the trade winds cause the deeper colder water to rise towards the surface.
LA NINA AND WINTER WEATHER
At this point, we have to add, that an ENSO phase is not just a pure “influencer” only for our weather. It can also be viewed/interpreted as somewhat of a response to the overall global state of the atmosphere. Almost like a “warning light” on the dashboard of a car. But generally, ENSO does indicate an important influence on the Jet stream in the Pacific Ocean, and consequently also around the world.
The jet stream is a large and powerful stream of air (wind) at around 8-11km (5-7mi) altitude. It flows west-to-east around the entire hemisphere, affecting the pressure systems, their strength, and thus shaping our weather at the surface.
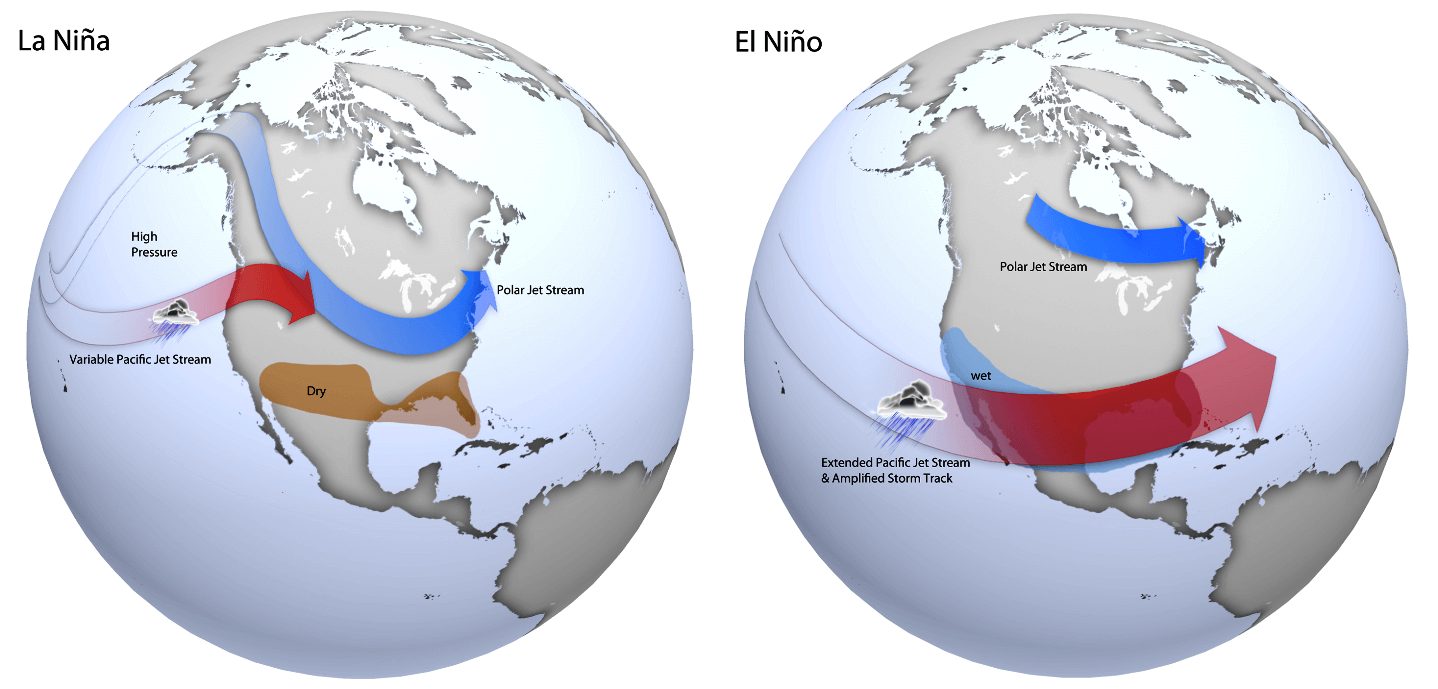
Comparing the two phases of the ENSO on the next image below, we can see that they can produce an entirely different winter weather pattern across North America, as they have a major influence on the position of the jet stream.
La Nina features a stronger and extended polar jet stream from Alaska and western Canada into the United States. While the El Nino features a stronger Pacific jet stream and an amplified storm track over the southern United States.
Looking closer at La Nina, we can see that its main feature is a strong and persistent high-pressure system in the North Pacific. It bends the jet stream from northwest to the southeast, creating a dipole pattern over the United States.
Alaska, western Canada, and the northern United States usually experience colder than normal winter, with more precipitation. Southwest and the southern United States usually experience warmer and a bit drier conditions during La Nina winters.
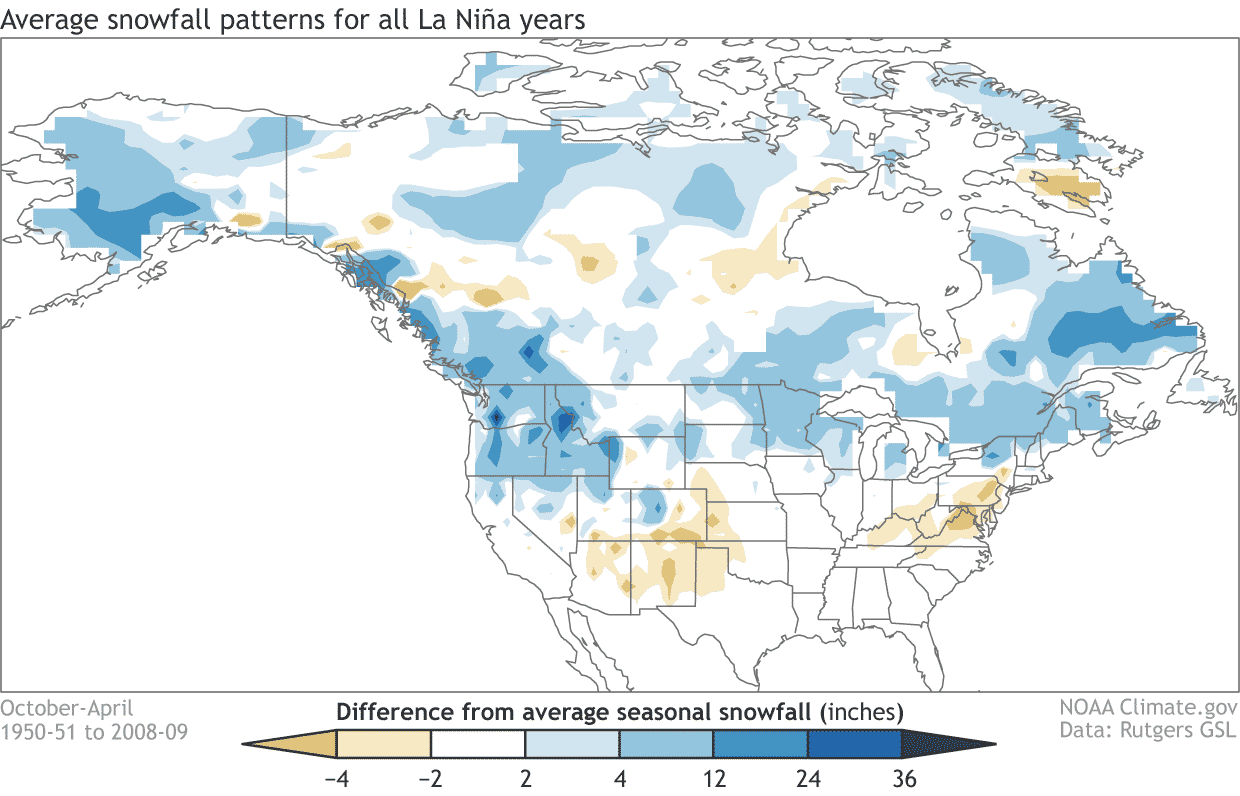
The shifted jet stream also means a different snowfall potential. The colder air is more easily accessible to the northern United States, which also shows to have an increased snowfall potential during the La Nina winters. Especially areas like Alaska, Canada, and the northwest United States benefit from the northerly jet stream to produce more snowfall. The graphic below is by NOAA-Climate.
WINTER 2020/2021 – LA NINA INFLUENCE
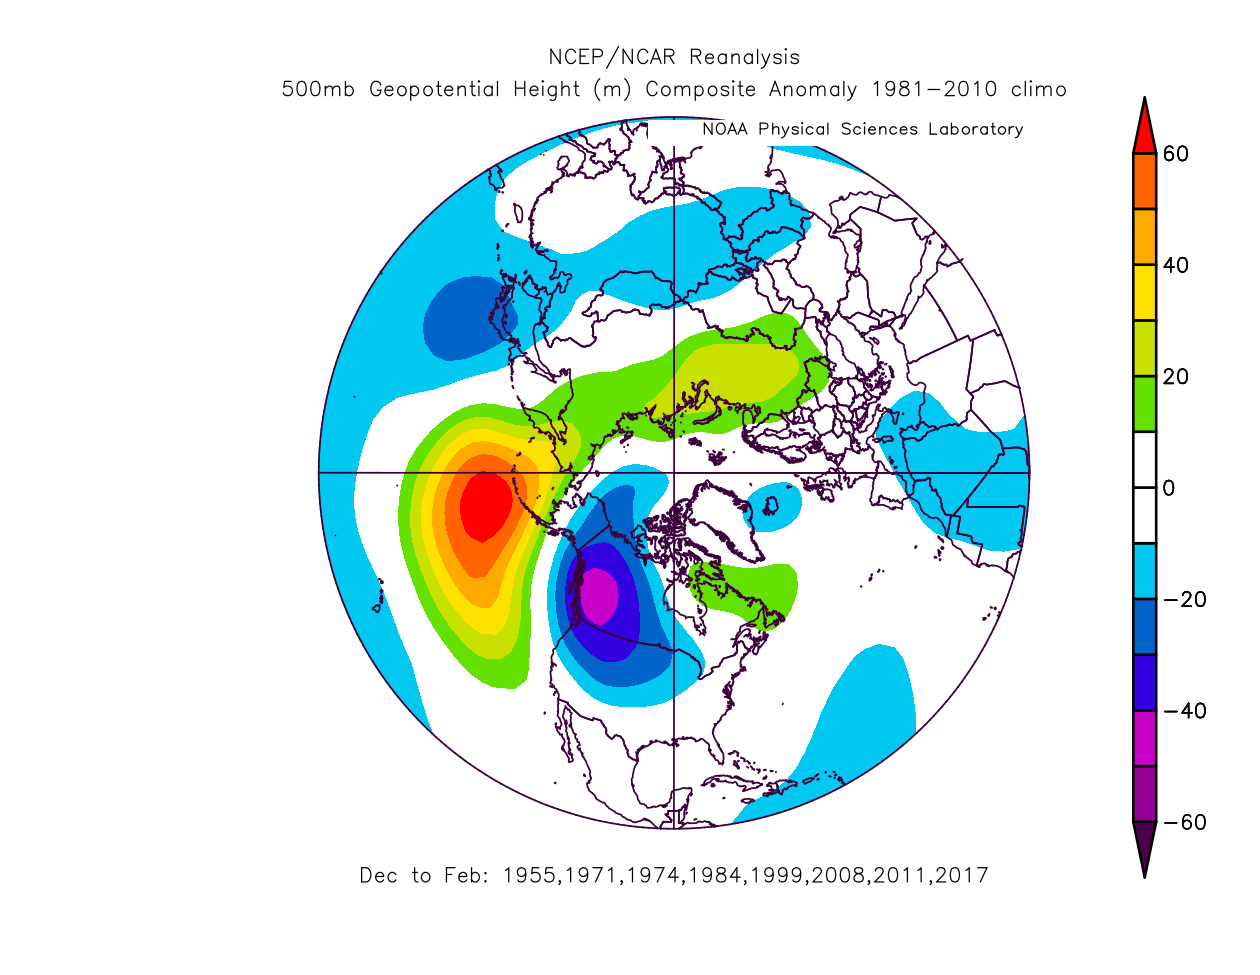
We have seen that the main feature of La Nina winters is a strong high-pressure system in the North Pacific. On the image below you can see the average winter pressure pattern during first-year La Nina events. First-year La Nina means that it was not preceded by another La Nina event like this year.
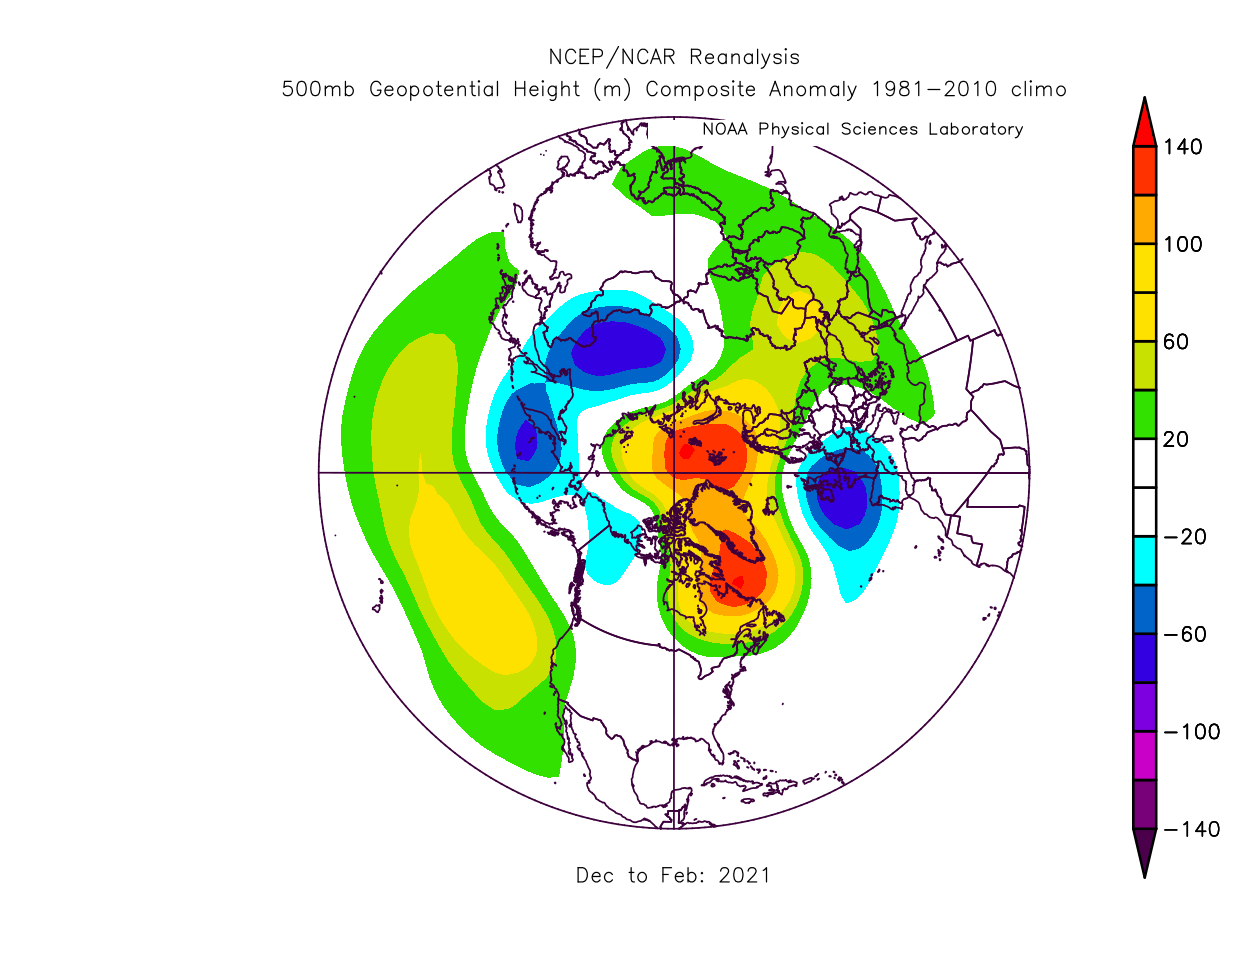
Winter 2020/2021 also had a first-year La Nina. But as you can see on the reanalysis image below, the pressure pattern was quite different than the normal La Nina pattern. There was no dominant high-pressure system in the North Pacific, with even some low-pressure over the Aleutians.
Looking closely at the North Pacific and North America, you can see that the Winter 2020/2021 did not play nicely with the La Nina. Below you can see two graphics. The top one shows the air pressure anomalies during the first two winter months in Winter 2020/2021. The bottom graphic shows the average air pressure anomalies during the strongest 13 La Nina events in the past 70 years.
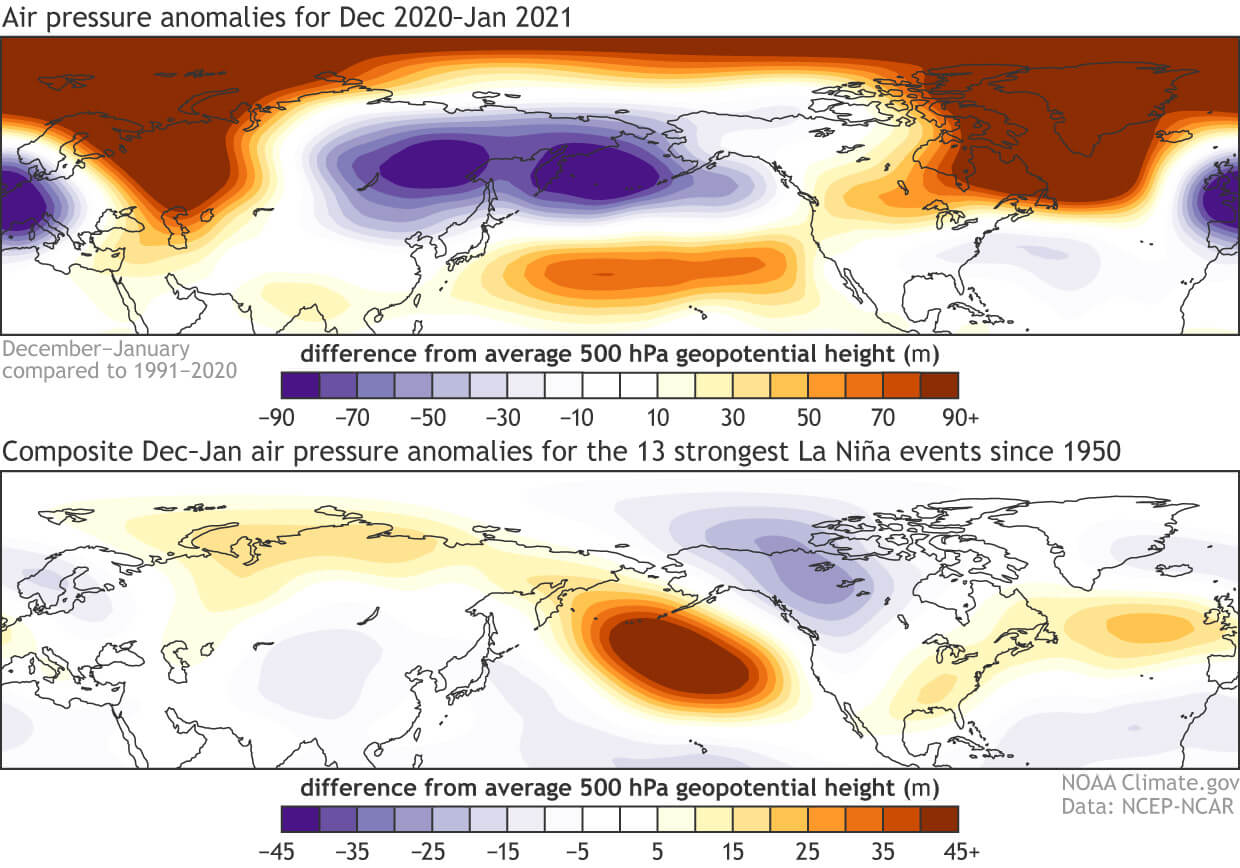
You don’t have to be a professional meteorologist or to see that they do not fit together very well. The actual winter patterns were not showing a strong La Nina influence. In comparison, the main difference was the strong Greenland/Arctic high-pressure system this winter.
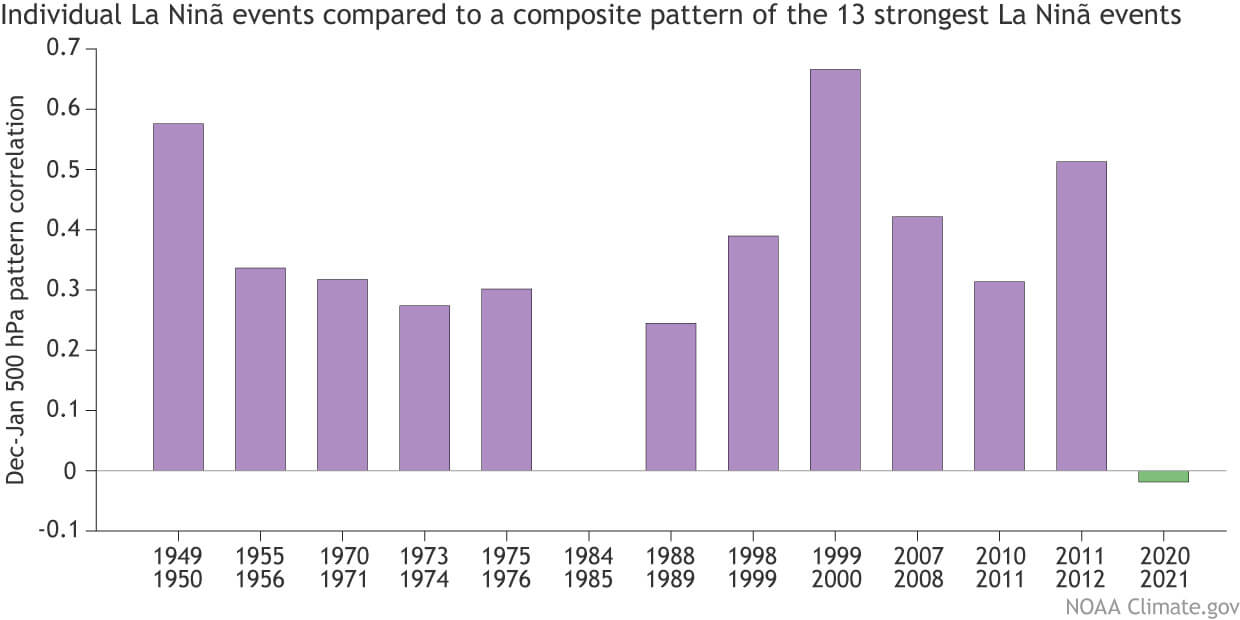
Next below is another image, which shows a comparison of the strongest 13 La Nina events since 1949, to the average La Nina winter pressure pattern. Basically, this image is a rough approximation of how strong was the La Nina signal or influence during its winter season.
All years show a certain level of correlation with the expected pressure patterns. The only ones standing out are Winter 1984/1985 and of course 2020/2021. Last winter is especially interesting, as it has a negative value, indicating an almost opposite development to that expected.
The main reason behind this is perhaps not so easy to pinpoint. Based on the available data, one of the likely reasons was the strong stratospheric warming event in late December into early January.
Below we have a simple graphic that shows the pressure anomalies in the lower atmosphere over the polar regions. The red colors indicate higher than normal pressure, which started in the stratosphere and made its way down towards the surface, changing the pressure patterns across the hemisphere.

This process packs a lot of energy and can cause a big shift in the weather patterns. There were more things at play this winter, but this stratospheric warming event is standing out as one of the main influencers, that heavily disrupted the La Nina influence.
These stratospheric warming events do not happen every year. Considering that we have now experienced two winter stratospheric warming events in a row, it is currently a low chance that we will witness another stratospheric warming event this Winter. This means that the La Nina 2021/2022 should see less disruption to its influence.
AUTUMN AND WINTER 2021/2022 FORECAST
Looking ahead towards Autumn, we have the ocean forecast below from the Australian BOM office. It shows the global ocean temperature anomaly forecast for October. You can see the developing cold La Nina in the tropical Pacific Ocean.
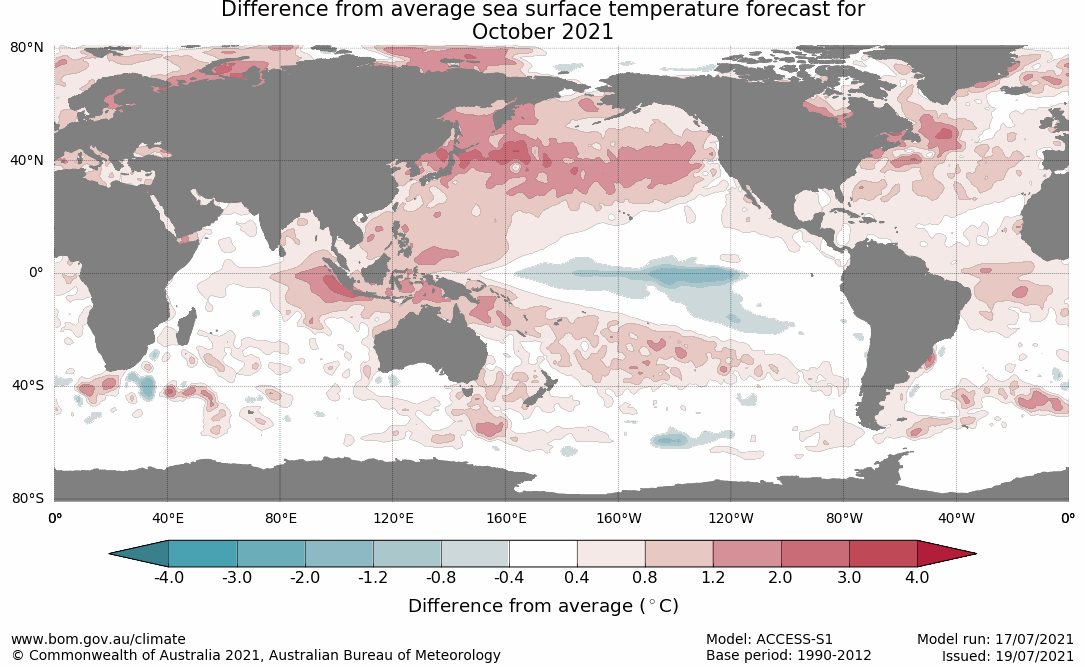
The ENSO forecast from BOM shows the cooling extending into late Autumn, reaching the La Nina threshold. A more accurate forecast will be released in the next two months, but this is an early indicator that supports the development of the second year La Nina.
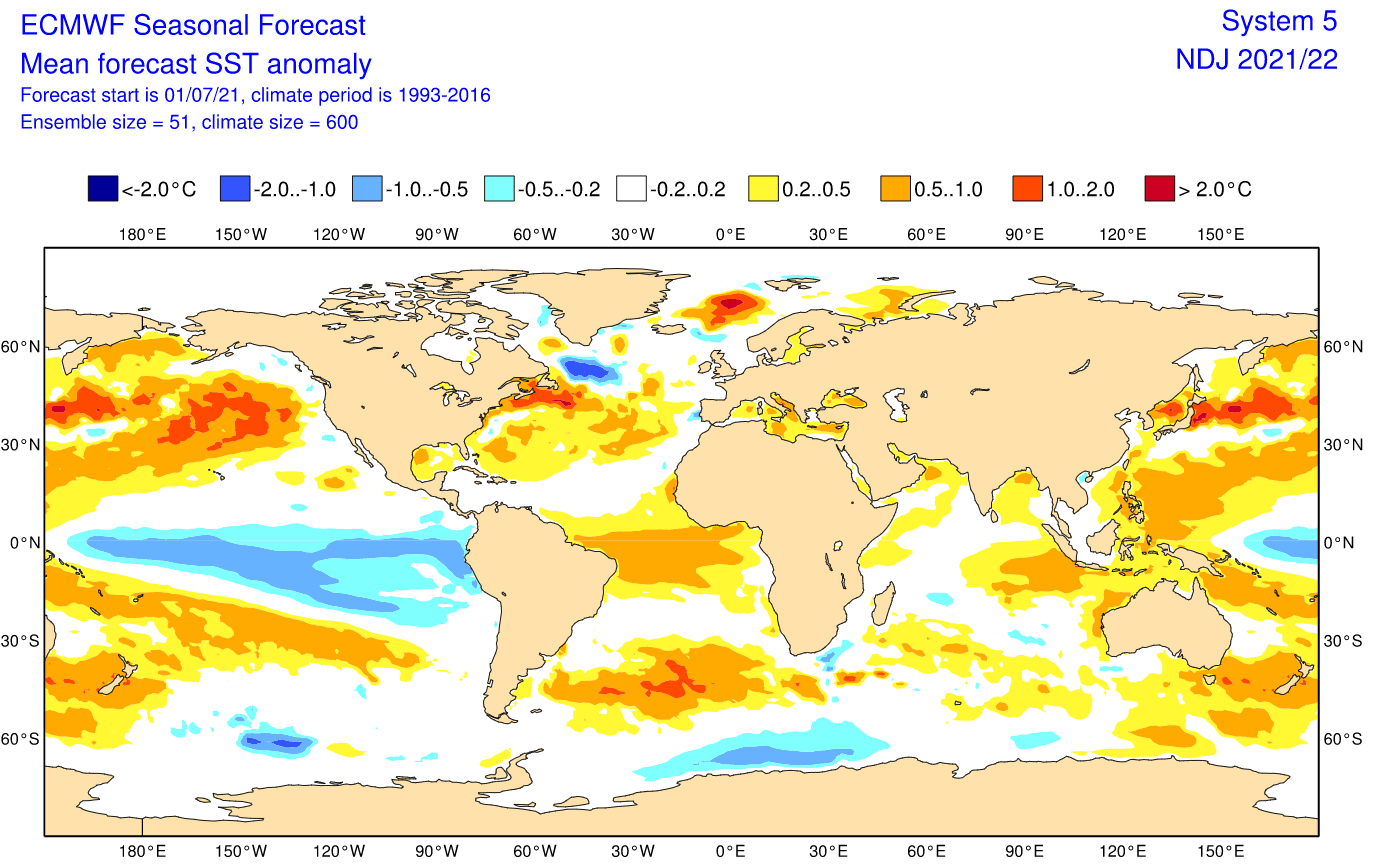
The European ECMWF seasonal forecast also shows the presence of the La Nina from Autumn towards Winter season 2021/2022. This does not look like a particularly strong La Nina, but second-year La Ninas are usually weaker than first-year events.
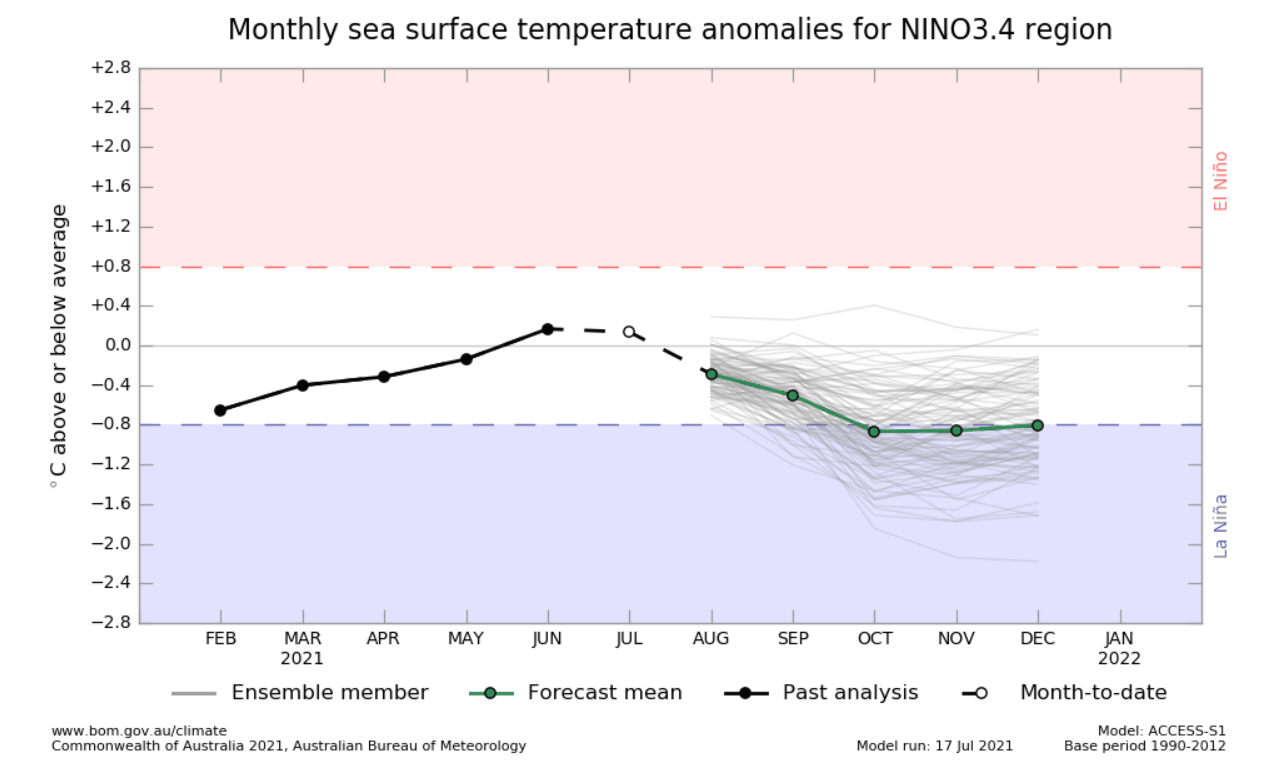
The ENSO region ensemble forecast below from ECMWF shows the La Nina starting to develop during late Summer, but it has a wide range going into Winter. Most scenarios support the development of the La Nina, but the ECMWF forecast still doesn’t show high confidence, which is normal for this time of year.
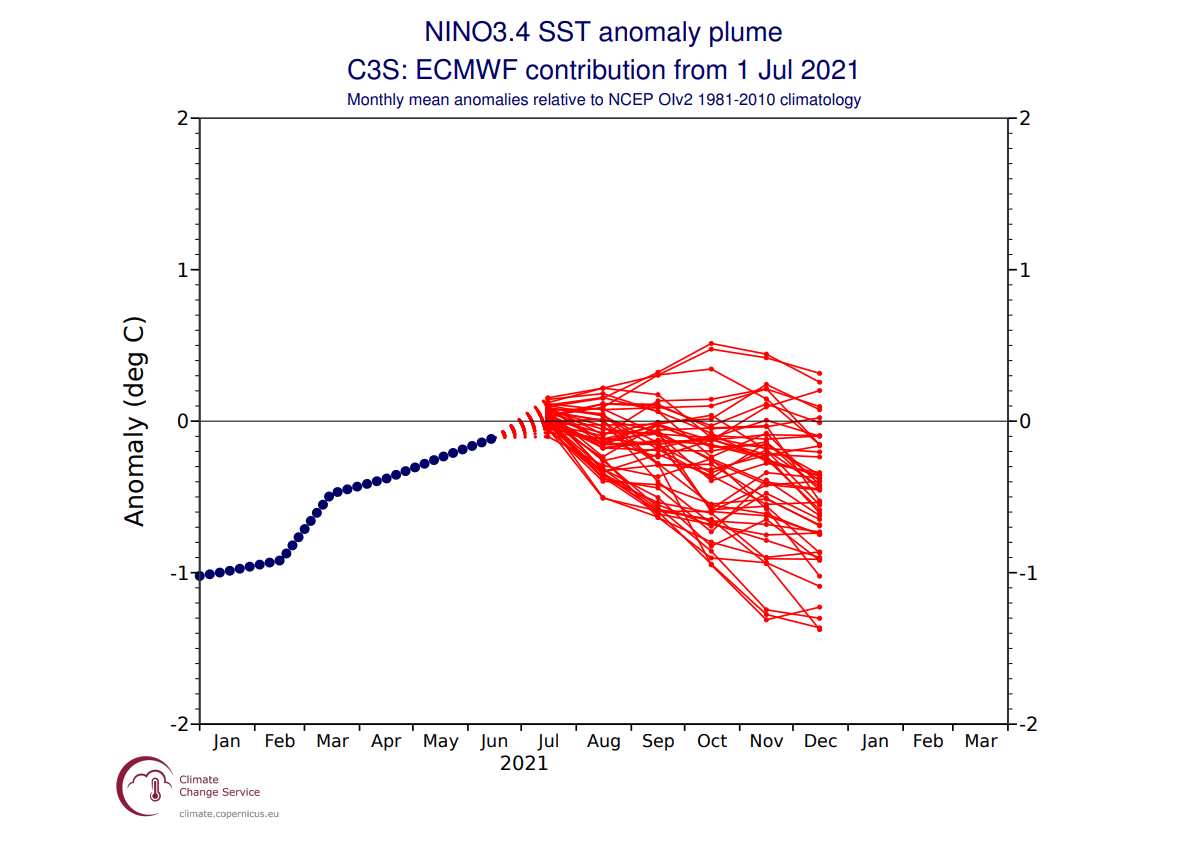
The CPC/IRI official probabilistic ENSO forecast shows the high probability for the development of the La Nina from Autumn into Winter. This is the forecast from early July and has an increased La Nina probability compared to previous forecasts from May and June.

Looking at the late Autumn-early Winter pressure pattern forecast by CFSv2, we can see a moderate high-pressure area developing in the North Pacific Ocean. This corresponds to the expected developing La Nina influence from Autumn into Winter.

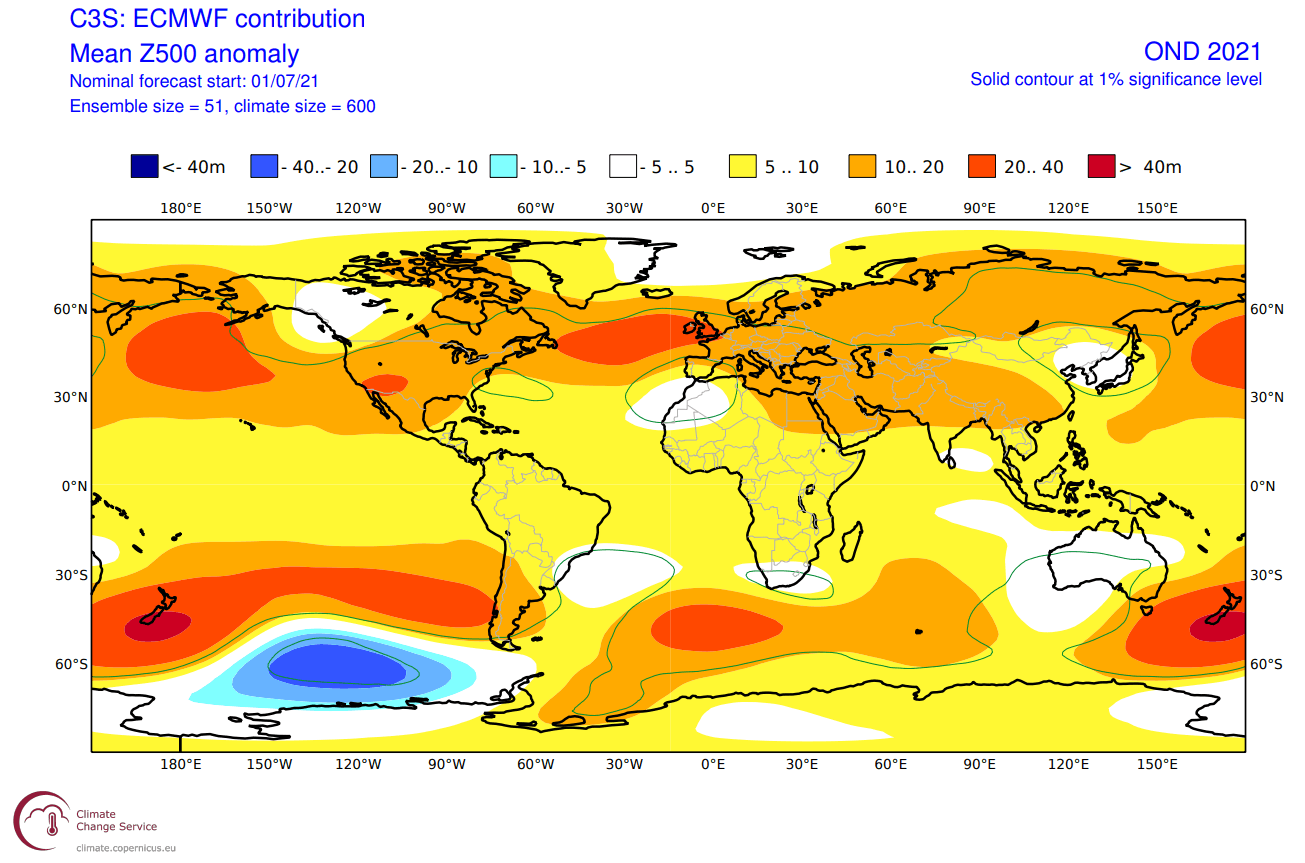
The ECMWF forecast for the same period also shows the strong presence of a high-pressure system in the North Pacific, with a hint of a low-pressure area over western Canada. This is a quite typical La Nina pattern developing on the transition from Autumn into Winter 2021/2022.
Below we can see the average pattern during second-year La Nina events. As we have seen earlier already, the main sign of a La Nina winter is the strong high-pressure system in the North Pacific. This helps to bend the jet stream, creating a low-pressure system over western Canada and the northwestern United States.
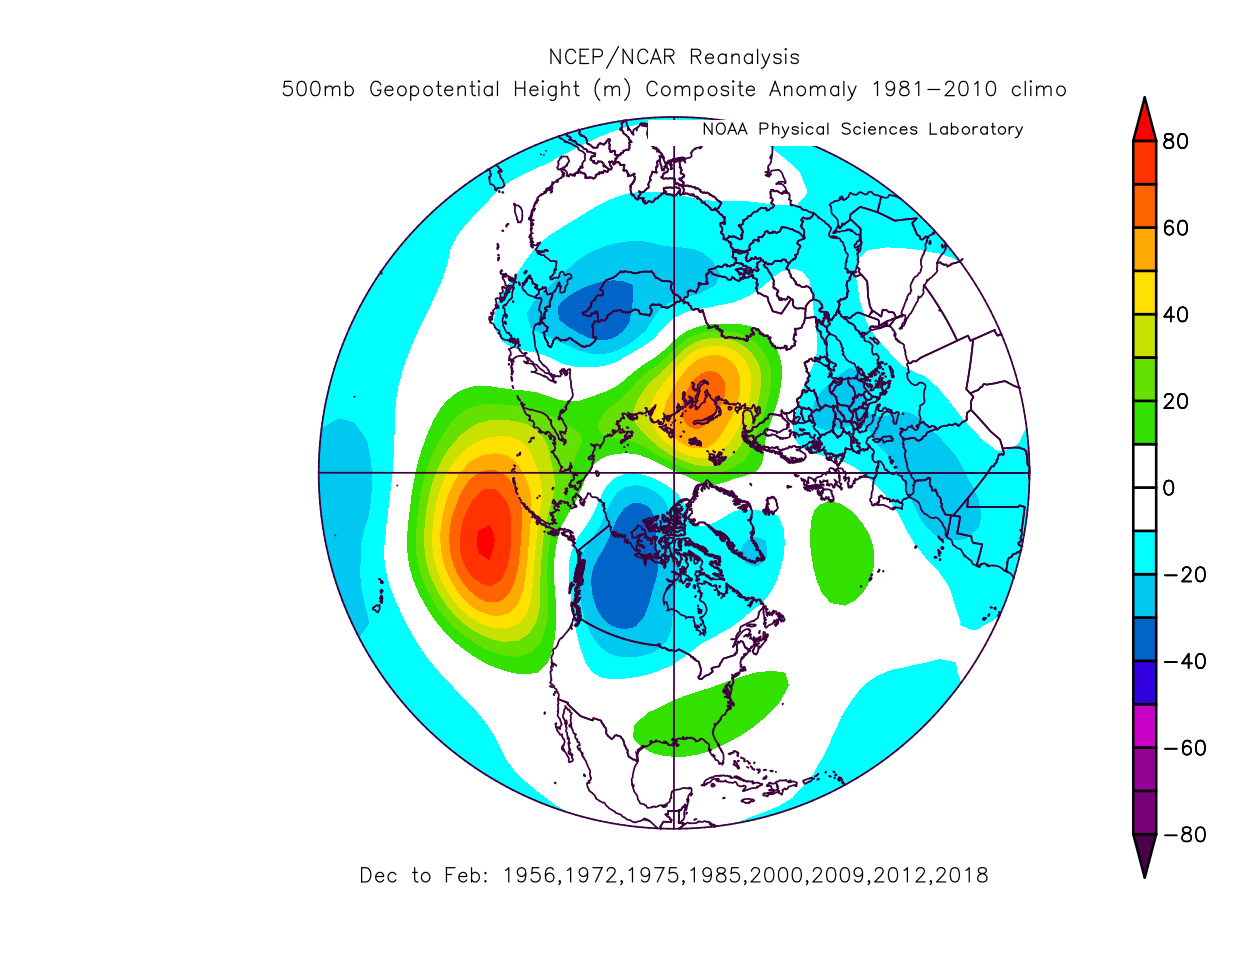
But there is another anomaly that stands out during second-year La Nina events, and that is the high-pressure system over northwestern Siberia. That can have a major role in the European winter pattern, as we can see lower than normal pressure over much of mainland Europe, which would mean colder weather.
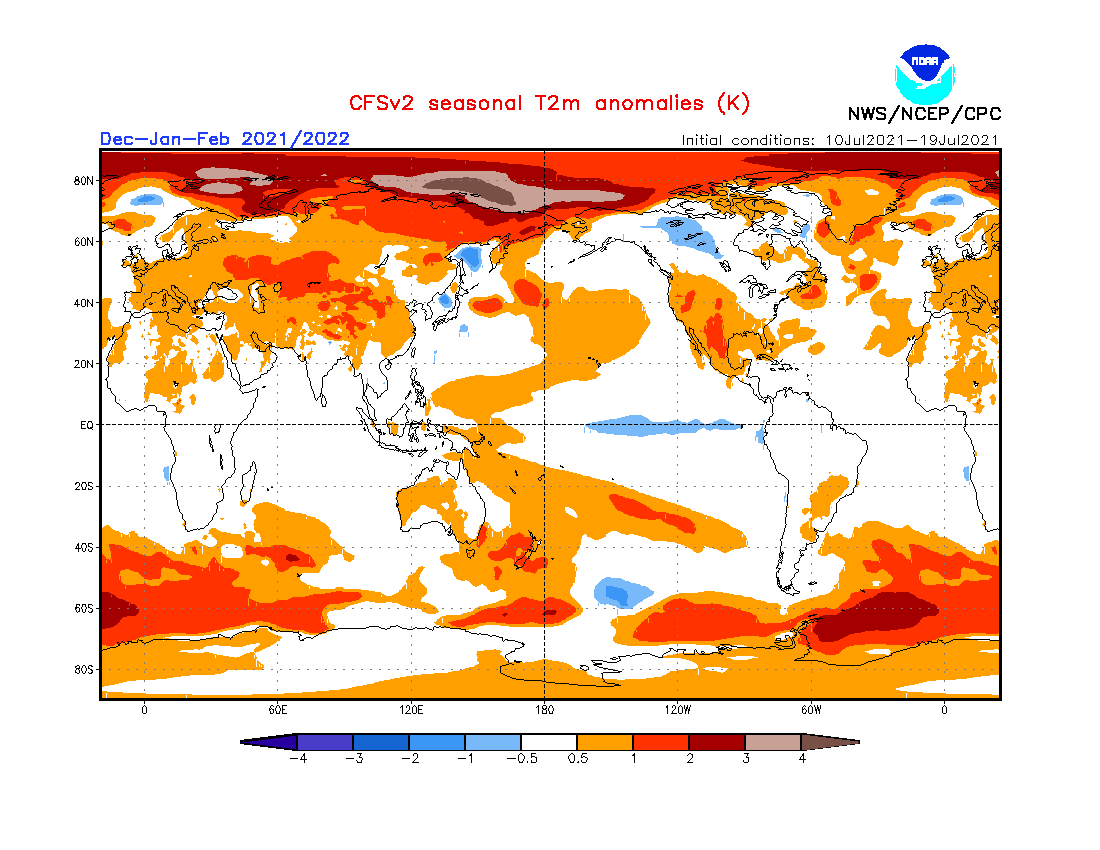
The actual early winter forecast from CFSv2 shows the high pressure in the North Pacific, and the hint of a low-pressure system over western Canada and the northern United States. Much more impressive is the high-pressure anomaly over the Polar Regions. This is just a first look forecast, with major changes likely as we will get closer to Winter.

The temperature forecast for the same period shows the warmer conditions over much of Europe and the western United States. But we can see the typical La Nina colder weather in western Canada, hinted to extend into northeastern United States.
Unlike North America, this forecast does not correspond directly to an expected second-year La Nina influence over Europe. But Europe is much further away from the ENSO region and does not have a direct connection to its influence. Over Europe, the ENSO influence comes mostly distorted, changed by the pressure patterns in the North Atlantic and the Polar regions.
We will keep you updated on the developing La Nina and its Winter 2021/2022 influence, so make sure to bookmark our page. Also, if you have seen this article in the Google App (Discover) feed, click the like (♥) button to see more of our forecasts and our latest articles on weather and nature in general.
SEE ALSO: