A wave of above-normal temperatures is currently spreading across much of the United States. It comes after a round of cold weather, but the winter has not said its last word yet, as another cold weather pattern change is forecast around mid February.
Another strong low-pressure area has developed over the North Pacific, enabling a strong jet stream pattern that will push mild ocean air into North America.
We will first look at the latest weather patterns and the strong jet stream development forecast. You will also see how the weather patterns are expected to shift in February and what is driving these strong weather changes.
WEATHER COMES IN WAVES
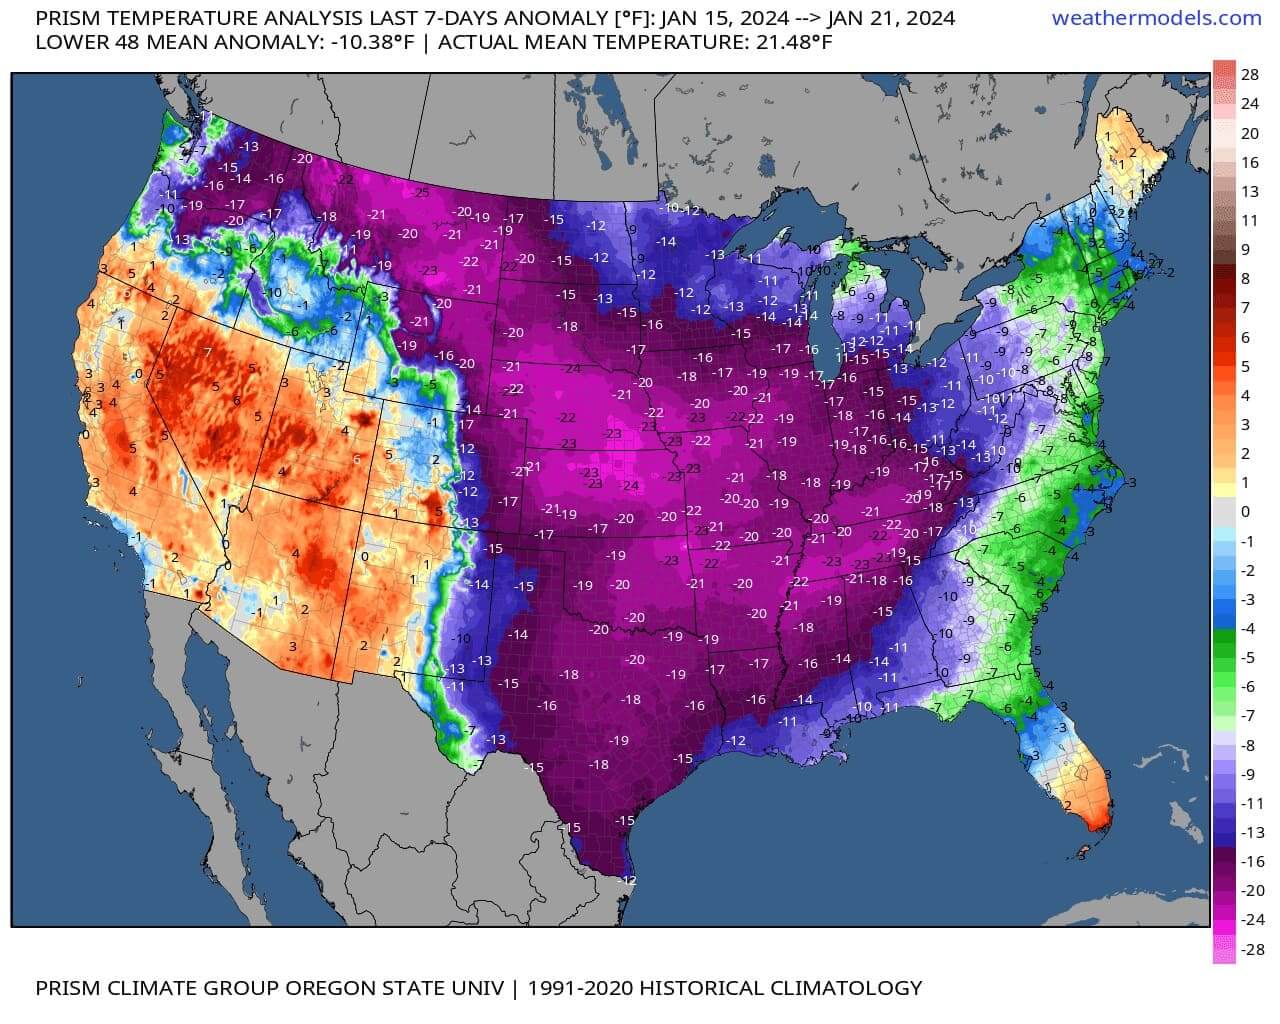
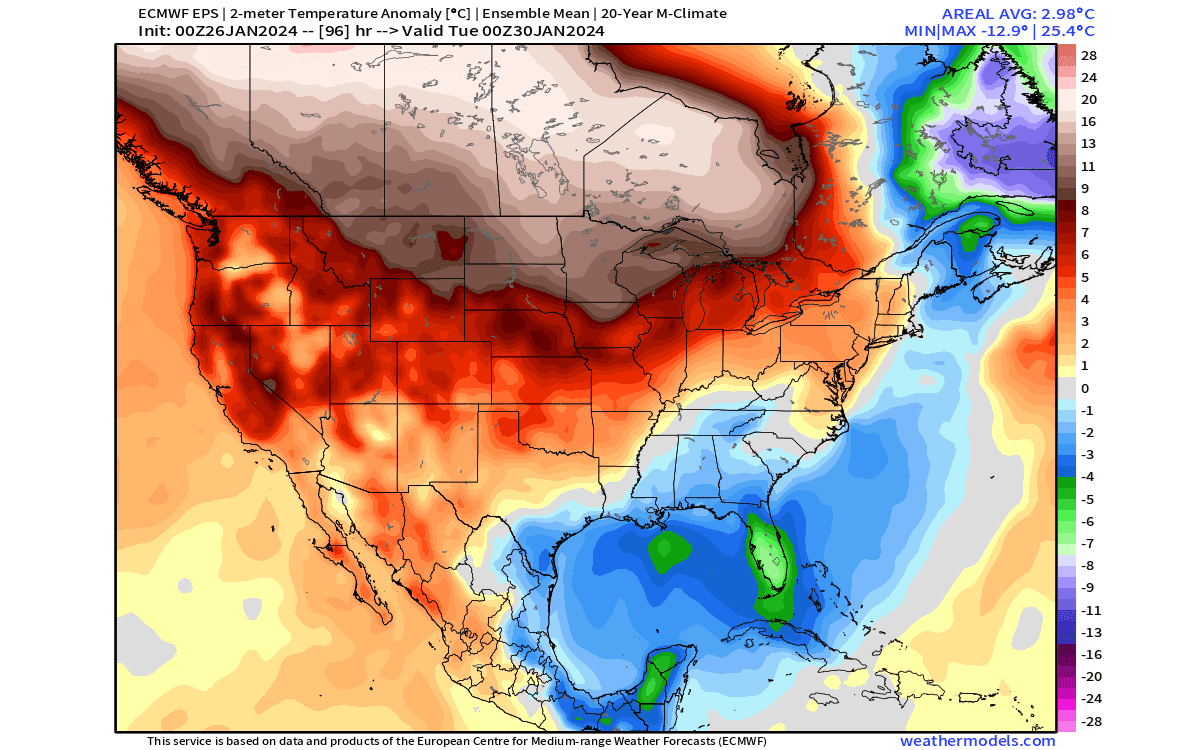
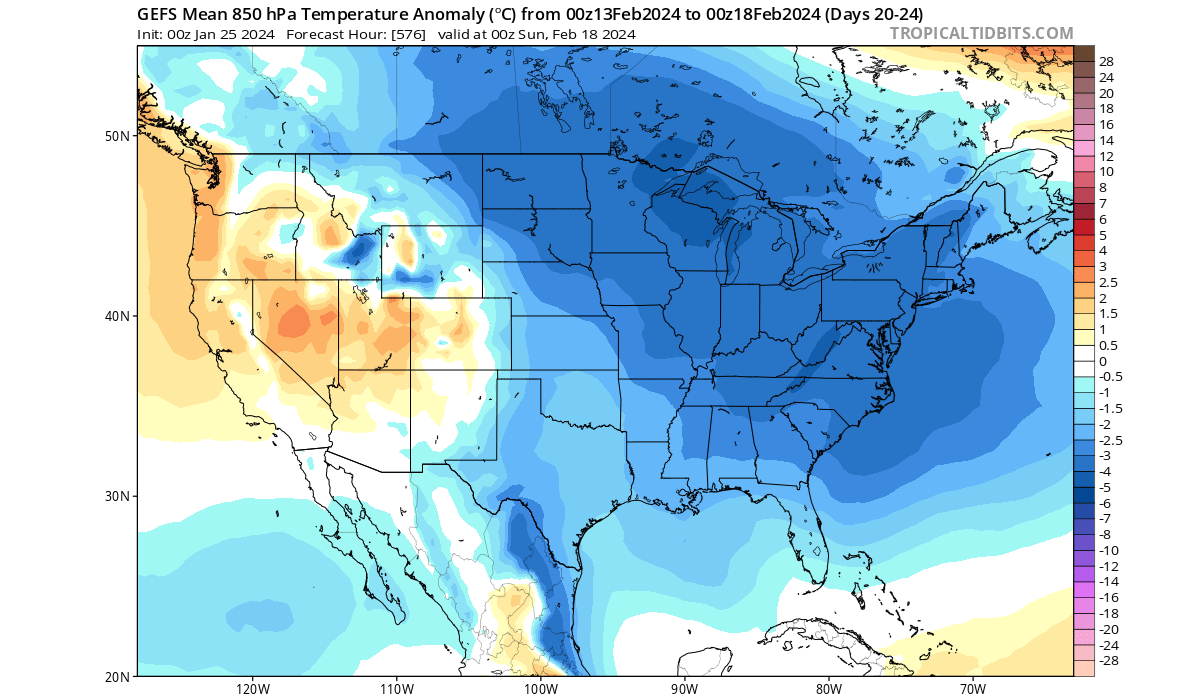
First, looking below at the temperature anomaly in the mid-month, you can see a significant cold weather pattern that has unfolded and is now moving out. The unusually cold air has spread from the northern United States down into the central, southern, and much of the eastern parts of the country.
But as you will see, the North Pacific pressure patterns are starting to change. As we discussed in one of our previous articles, the atmosphere is fluid and also has its own waves. A strong wave pattern is starting to develop in the Pacific, like the one in December that brought warmer weather to the United States.
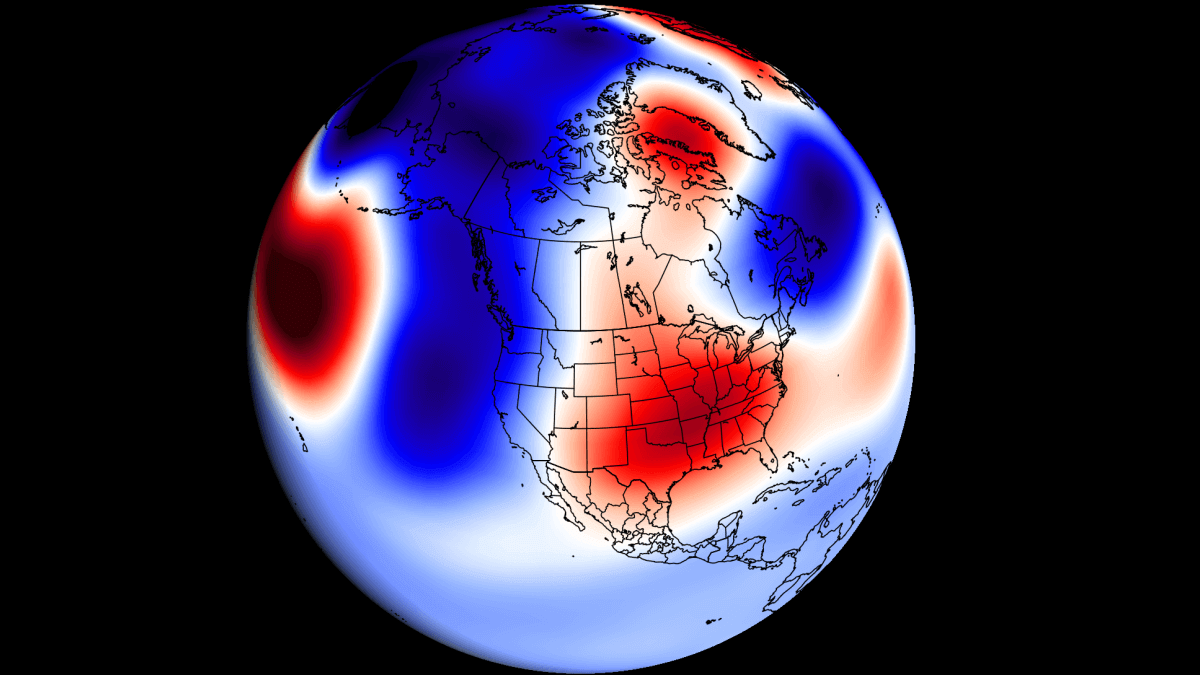
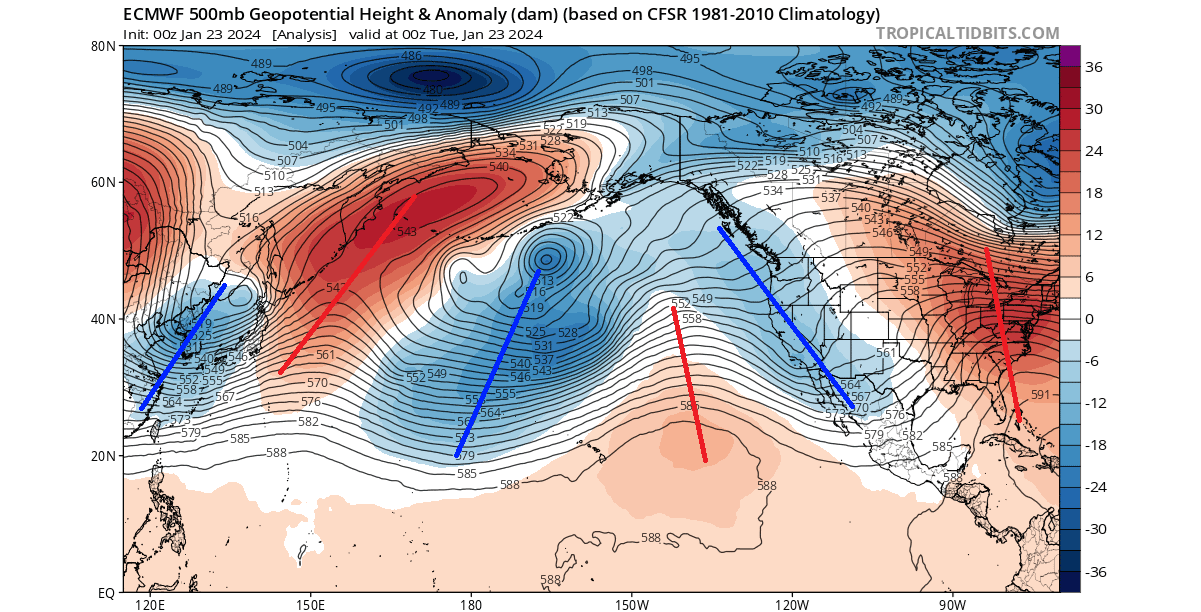
Below is the latest pattern analysis, which shows the pressure anomalies in a wave-like pattern. Such pressure waves are the atmosphere’s attempt to balance out the temperature difference between the cold poles and the warm tropics.
These pairs of pressure systems are also known as Rossby Waves. The image below by NOAA shows an example of Rossby waves. Compared to the image above, the latest pattern is a textbook example of a Rossby wave train from the Pacific into North America, bringing along large-scale weather changes.
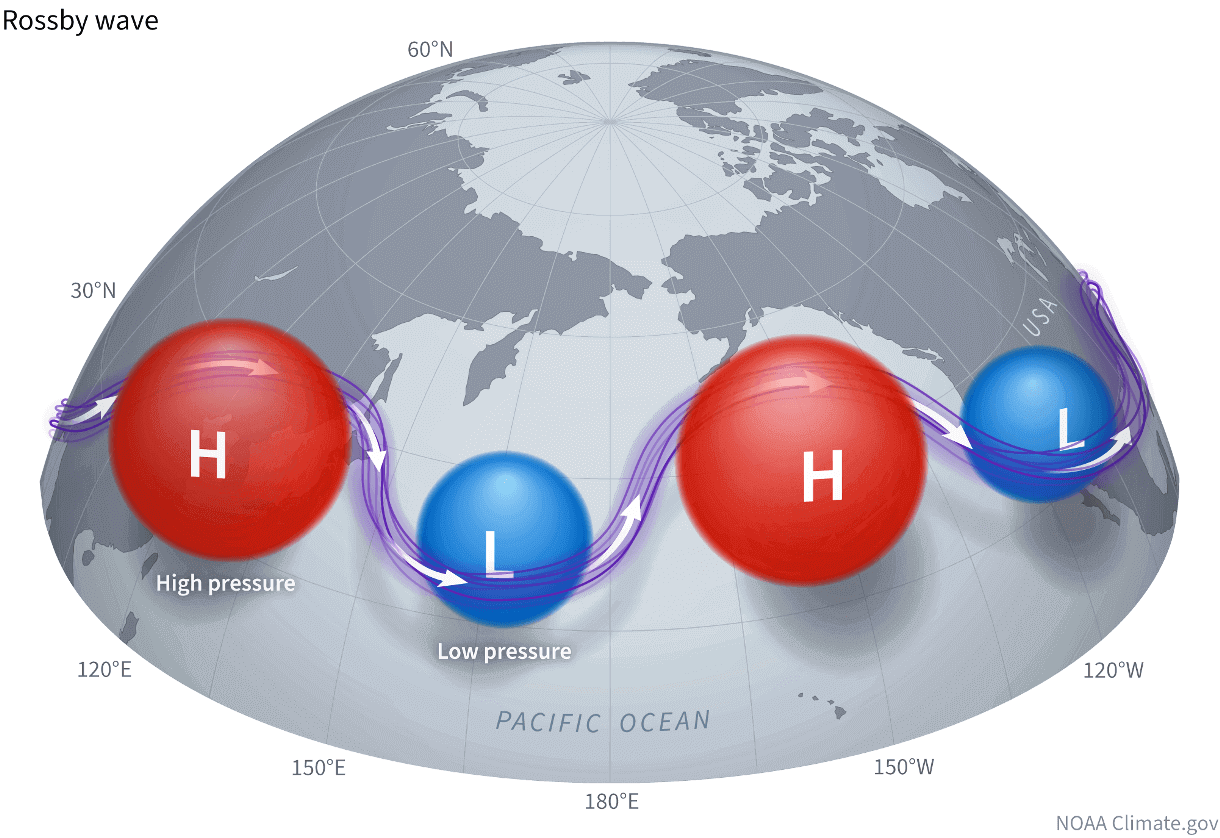
The violet line connecting these pressure systems is the jet stream. It drives and interacts with the pressure systems, thus helping to directly influence our daily weather. That is why any changes in the jet stream are very important to monitor.
The term jet stream is behind strong weather events, from cold spells and flooding to heatwaves and droughts. It is a fast, narrow current of air flowing from west to east that surrounds the globe. Below is a video that shows the jet stream forecast for the next ten days.
The forecast shows a strong and persistent subtropical jet stream across the Pacific. This brings mild ocean air toward the United States and also a lot of moisture in the form of atmospheric rivers.
This all comes together if we look at the latest surface temperature forecast across the United States and southern Canada. You can see much warmer than normal temperatures across much of the eastern half of the United States and across southern Canada.
This temperature pattern reflects the atmospheric waves, with a warmer airmass under the ridge in the eastern United States. At the same time, normal to slightly warmer temperatures are forecast for the plains and the southwest under the lower pressure and the influence of the mild Pacific airmass.
But there is a reason we are analyzing the current pressure patterns and learning about atmospheric waves and the jet stream.
In the following days, the dynamic waves in the North Pacific will evolve into a large low-pressure area in the North Pacific, creating a longer-wave pattern and helping to build a large high-pressure area over the United States.
LARGE SCALE PRESSURE ANOMALY
Pressure systems are always stronger during winter, especially the low-pressure systems. As they are a result of the atmospheric imbalance, a stronger/bigger low-pressure system can sometimes mean a stronger high-pressure area to form as a result downstream.
The graphics below show the ensemble forecast from the ECMWF data, available to the public by the Copernicus data hub. Images are provided by weathermodels.com, using a commercial license.
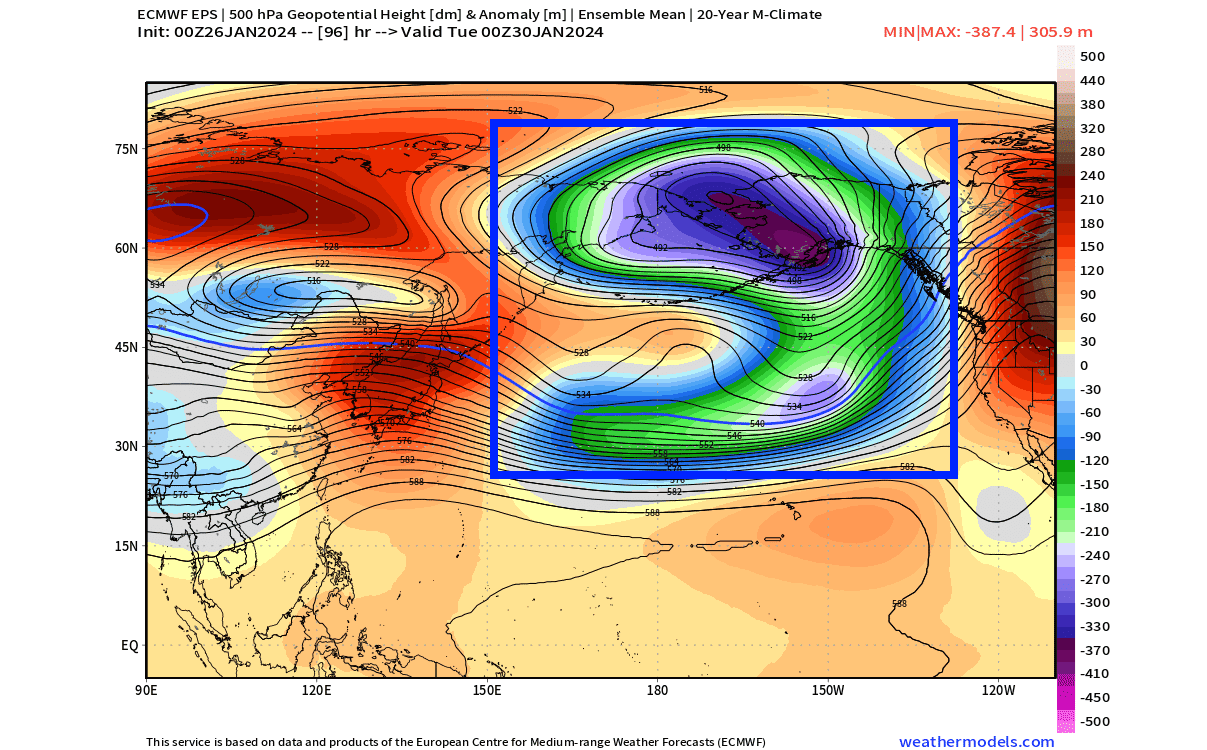
The forecast below shows that a broad low-pressure area will develop over the Aleutians and the North Pacific early next week. Such a broad low-pressure system has two important impacts on North America in terms of the overall weather pattern.
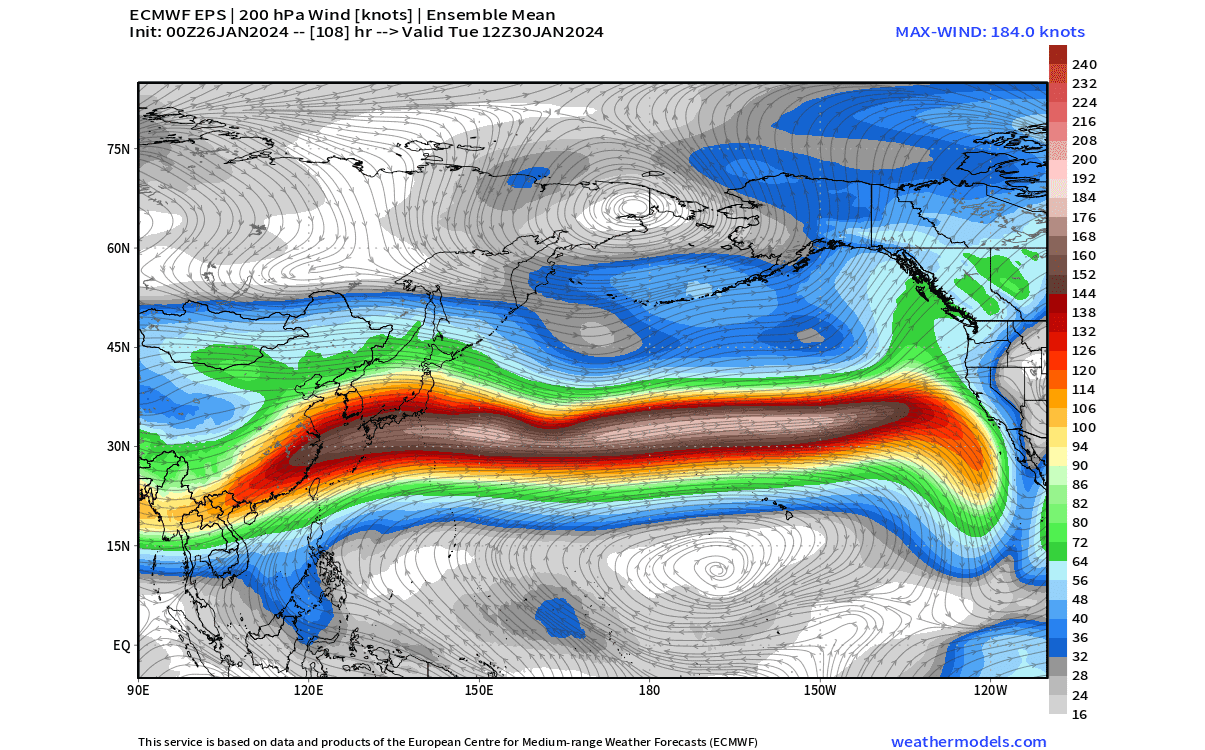
First, it creates a very strong jet stream in the upper levels. You can see it in the graphic below, which shows the wind speed at the 200mb level (12km/7.4 miles). This helps to bring much milder oceanic airmass to the United States, along with moisture that increases precipitation over the west.
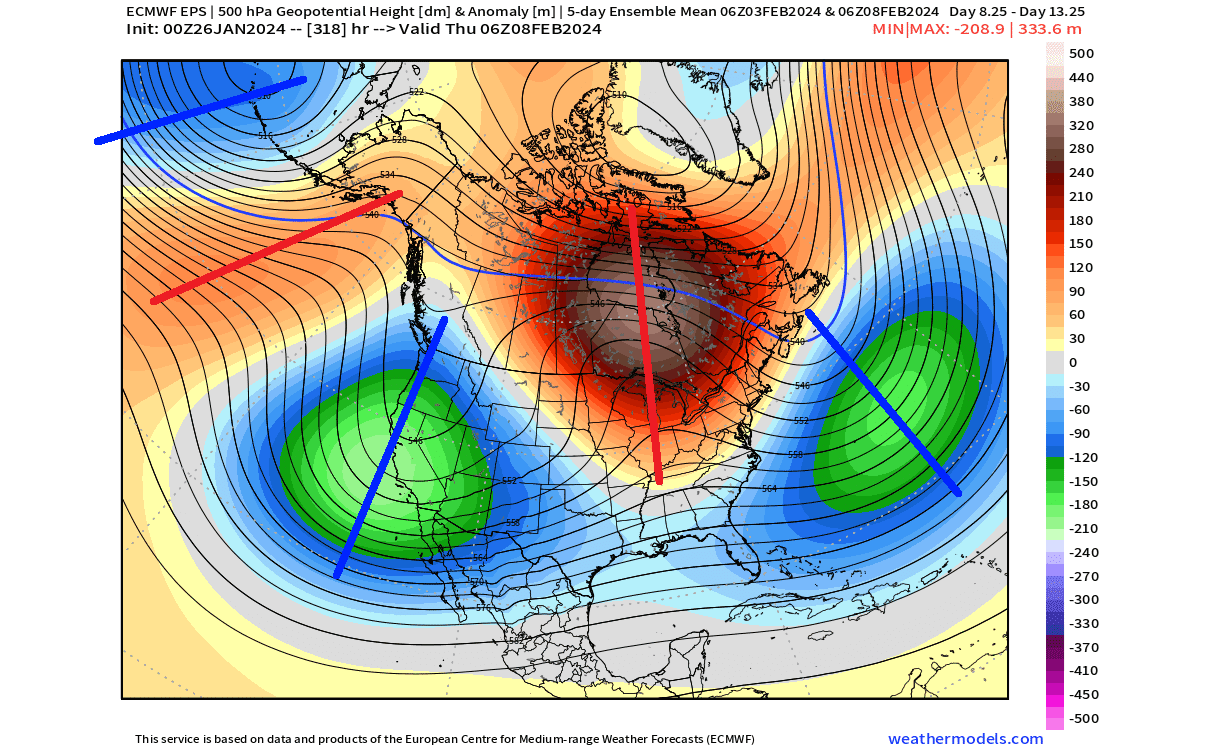
Secondly, it helps to create a strong high-pressure ridging over the United States and Canada. You can see another Rossby wave pattern across North America, having a low over the Pacific, a high over the United States, and another low out in the Atlantic.
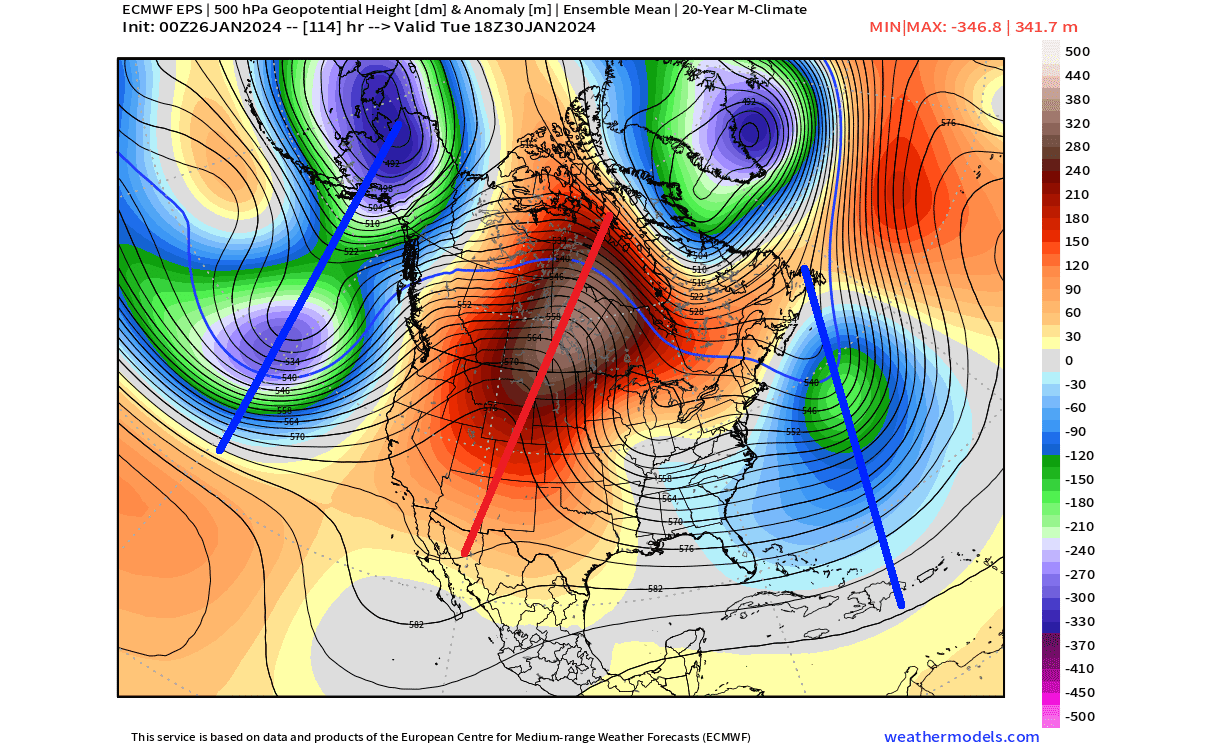
Such a pressure wave pattern creates a strong pressure difference across North America, which means strong winds. This brings strong westerly and southwesterly low-level winds into the western United States and western Canada, creating much warmer weather than normal.
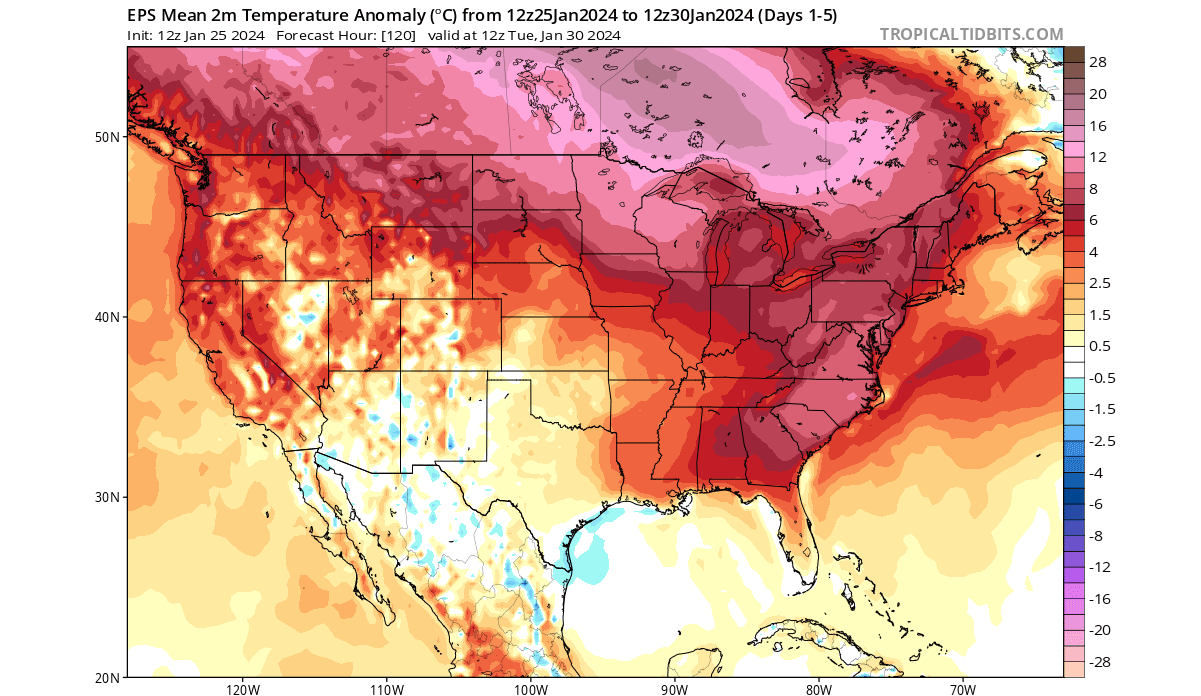
The image below shows the surface temperature anomaly for early next week across the United States and southern Canada. You can see strong warm anomalies over much of the United States, and especially southern Canada.
But you can also see some cooler areas over the southeastern United States and over the Northeast. Both areas are under the influence of the low-pressure area over the Atlantic, while the rest of the country is warmer than normal under a high-pressure area.
THE PRESSURE ANOMALY PERSISTS
Just like on the ocean, waves also progress in the atmosphere. Below is the pressure anomaly forecast for the first week of February. You can see the same wave pattern as this week, but it will progress further to the east.
That is the normal Rossby wave progression, but it also brings along slight weather changes. The high-pressure system moves further east, along with the core of the warm anomalies. A low-pressure system enters the western United States, changing the temperature and precipitation over the west.
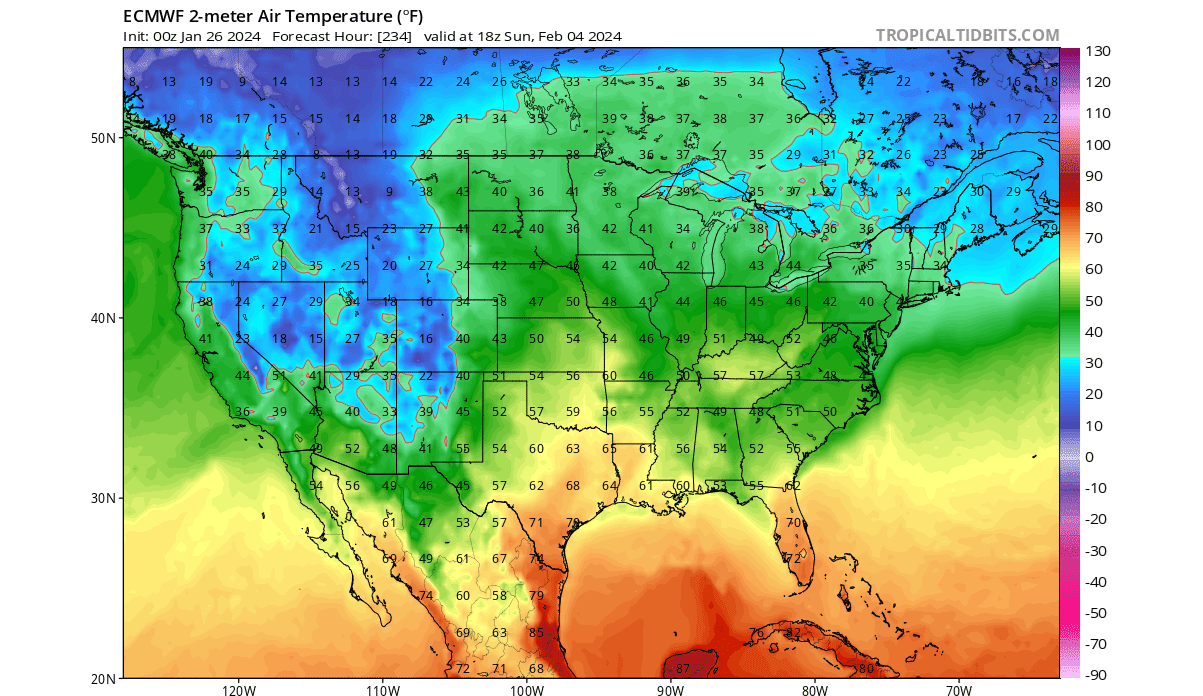
Looking closer at surface temperatures, you can see the daily temperatures not dropping below freezing levels across the eastern half of the United States and parts of southern Canada. At the same time, below-freezing temperatures expand over the western United States, with the low-pressure systems bringing a more northerly flow.
That is why we use anomalies, as they show just how much and where the temperatures are above or below the long-term normal. You can see the temperature anomaly forecast below, showing much higher than normal temperatures over the northern United States and southern Canada. Lower temperatures than normal are forecast over the southwest.

The NOAA 8-14 day temperature outlook sums up this forecast period for the United States. Warmer than normal weather is predicted over much of the eastern half of the country, with a low-pressure system bringing lower temperatures to the west.
A stronger subtropical jet stream also brings a lot of moisture from the ocean into the United States. In the NOAA precipitation forecast below for the same period, you can see much above-normal precipitation over the United States, except for the northeast.
But when we look at the snowfall forecast for the next ten days, we can see some snowfall over the northeast. This is a very good example, how even under large pressure anomalies, a brief cold front still sneaks in and can drop some snowfall over the northeastern United States.
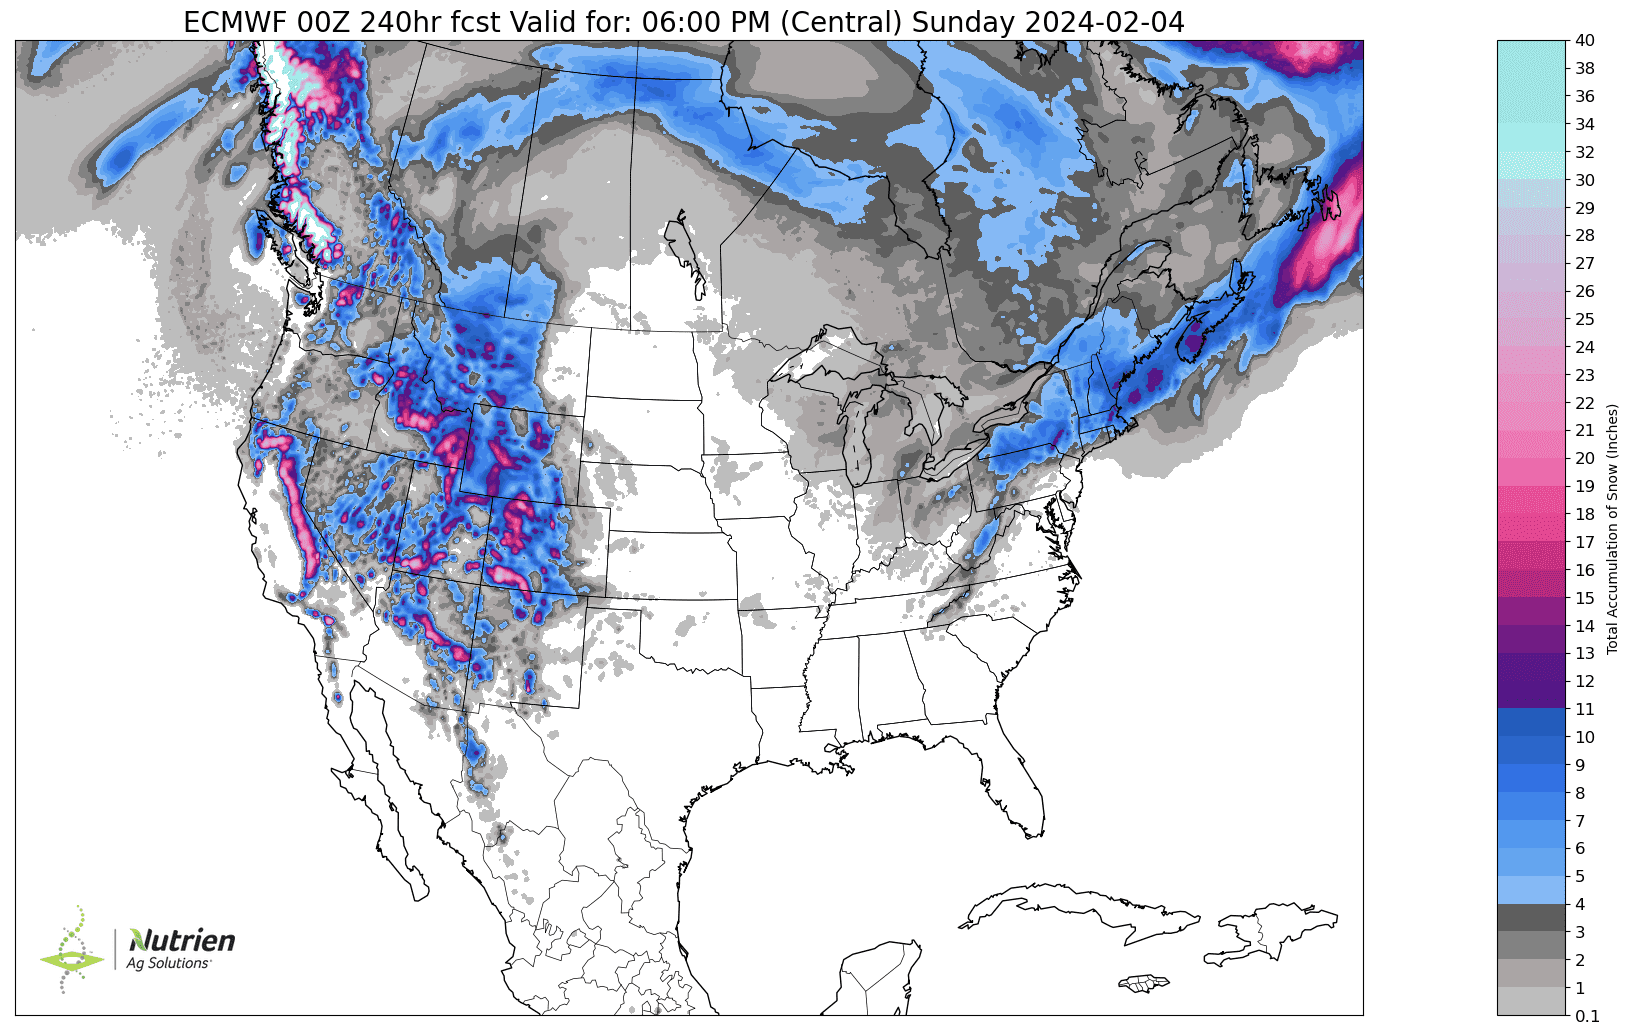
Another batch of decent snowfall amounts is forecast over the Rockies and some higher elevations over the West. That is a combination of high moisture and precipitation and cooler temperatures from the low-pressure system.
But this is just a brief cold front. What we want to know is if widespread cold will still make a return this winter.
ANY COLD ON THE HORIZON?
Looking at the ensemble forecast, we can see changes in the weather pattern as we get into the middle of February. The main high pressure is forecast to move up north, over northern Canada and Greenland. That opens the door for a low-pressure area to take over the eastern United States, creating a northerly flow.
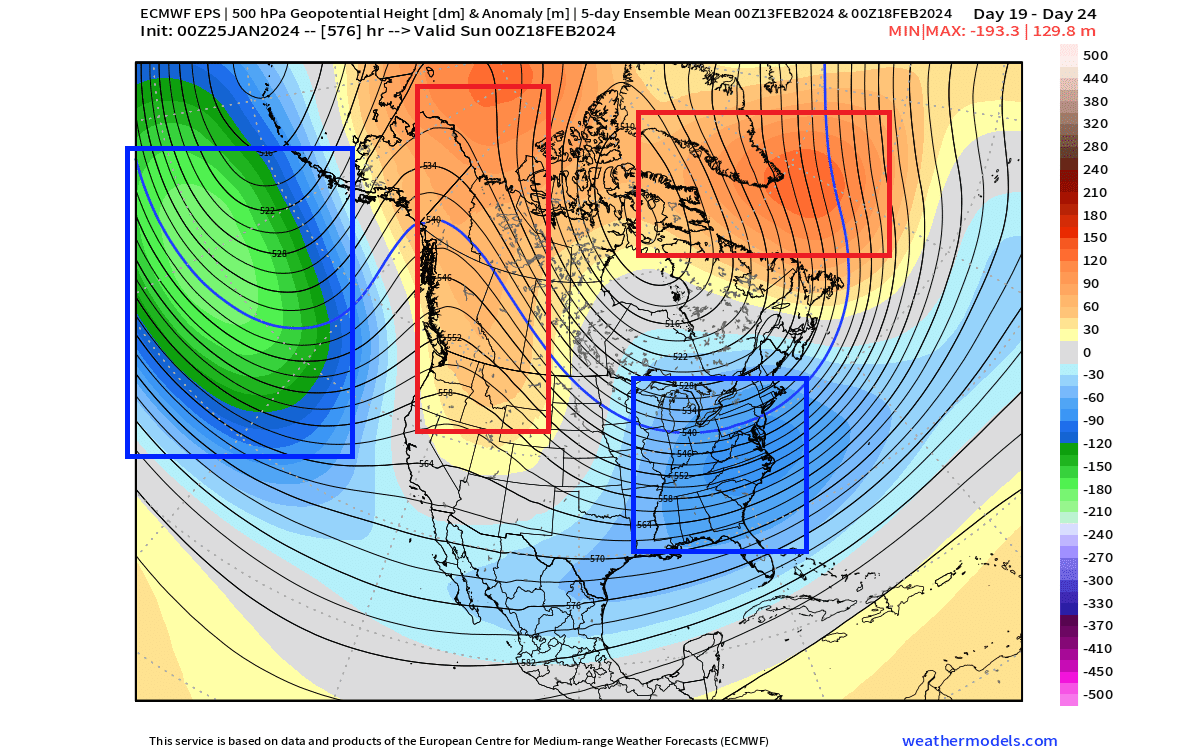
Another strong low-pressure system is visible in the Pacific, helping to build a ridge over the Pacific Northwest.
The temperature forecast for the same period shows broad cold anomalies across the eastern half of the United States. This indicates the westerly flow is being replaced by a colder northerly flow as a low-pressure area establishes.
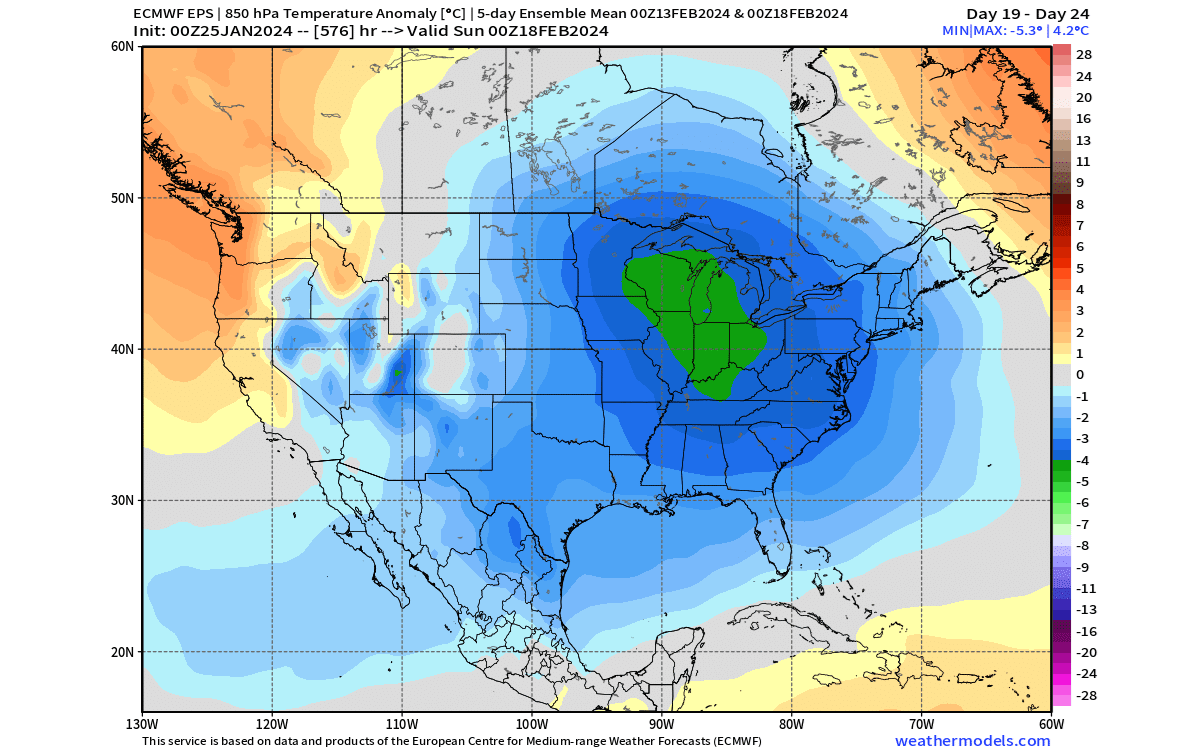
Looking at the American GEFS model for the same period shows a very similar temperature pattern. This is an extended forecast range, so it is a very good sign of confidence when different model solutions see the same weather development.
The snowfall forecast below from ECMWF shows the snowfall potential returning across the northern United States, upper plains, the Midwest, and, of course, the northeastern United States.

But will this pattern remain in place for long? Well, even the extended-range models have their limits. While we can easily look at the period into early March, we need to take it with some reserve.
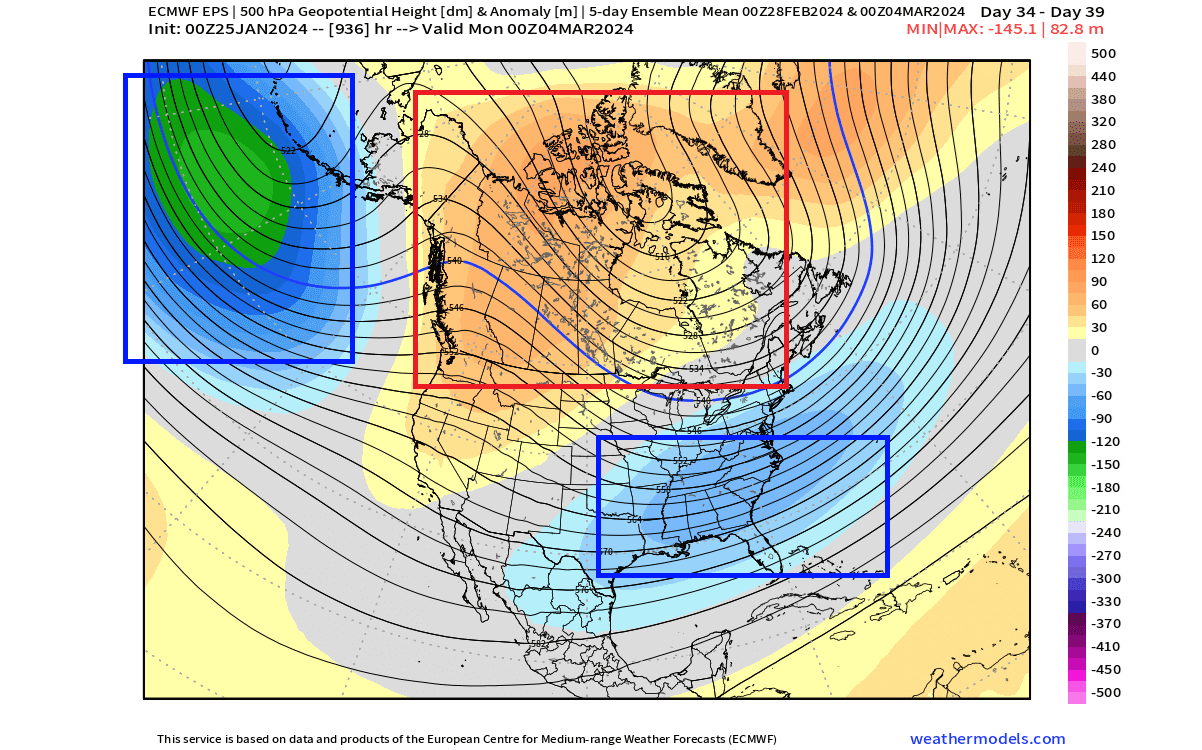
Nonetheless, below is the pressure anomaly forecast for early March, showing a stable pattern of a low-high-low pressure wave. A strong low in the Pacific raised a ridge over Canada, which in turn helped to drive a northerly flow and low pressure into the eastern and southern United States.
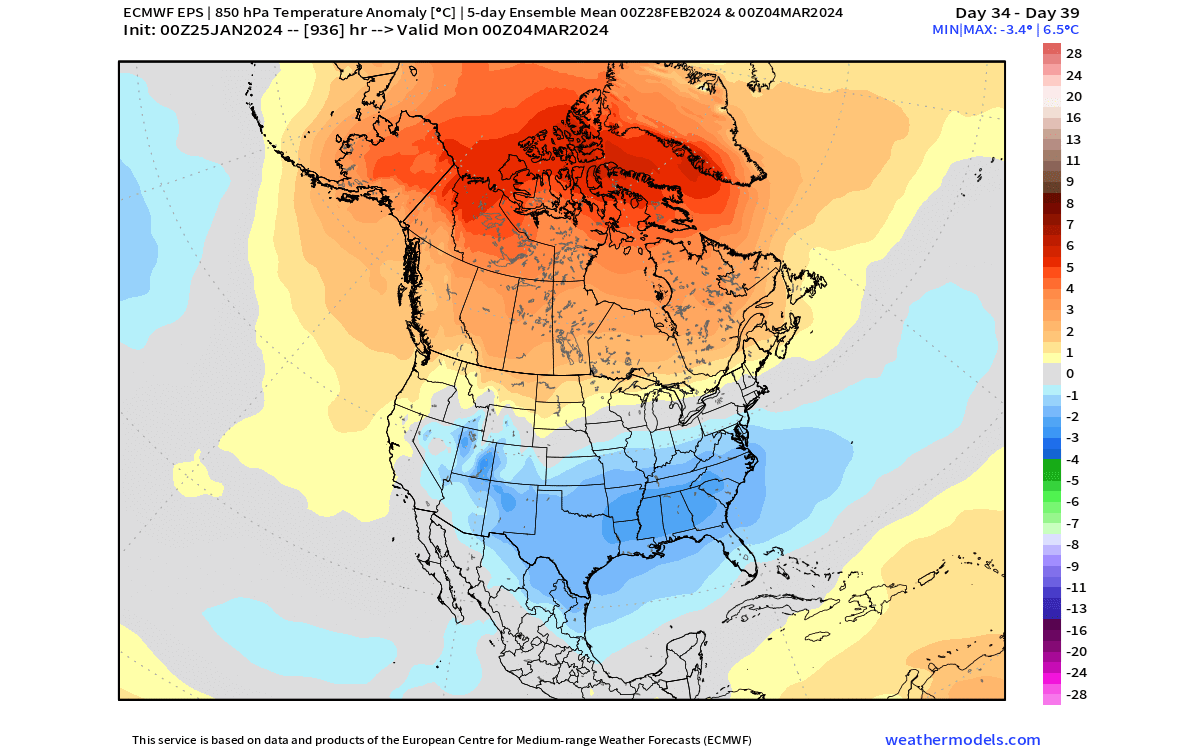
The resulting temperature pattern is similar to mid-February, with below-normal temperatures over the eastern and southern United States. It looks very close to the expected long-term impact of the El Nino event, which is likely the main driver behind these weather waves this winter.
You have probably heard the term El Nino before. But if it doesn’t ring a bell, we will quickly look at what it is and how it usually changes the weather patterns over North America.
WHAT DRIVES THESE WEATHER PATTERNS?
The late 2023 has been influenced by the strong El Niño event in the Pacific Ocean. This is an area of above-normal ocean temperatures in the tropical Pacific. As the ocean temperature changes, it also changes the pressure dynamics and tropical rainfall, creating a “butterfly effect” on a large scale across the globe.
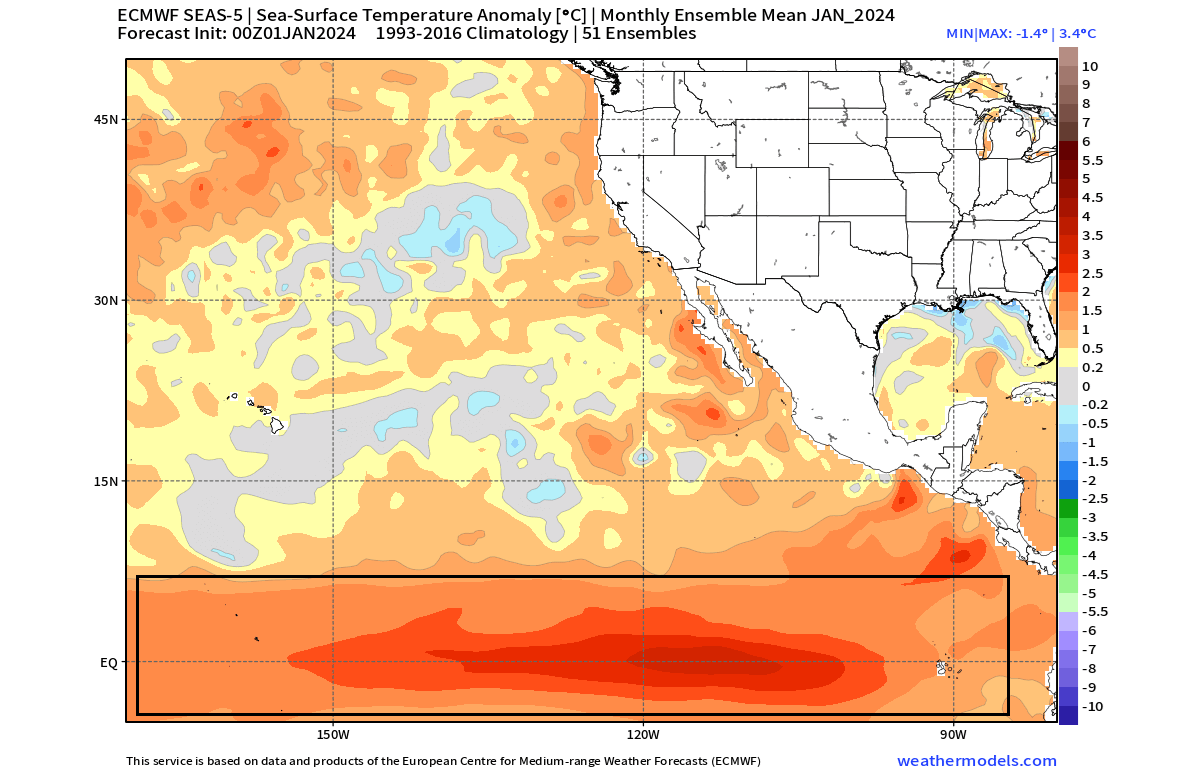
Below is an ocean temperature forecast for January 2024. You can see the strong ocean temperature anomaly in the Pacific Ocean. In the image, we can see a central/basin-wide event strong enough to have a very noticeable atmospheric impact on weather patterns.
The periodical appearance of these anomalies means that several such events have occurred in the past decades. This gives us an opportunity to examine previous events and how they impacted the atmosphere.
Below, you can see the average El Niño winter pressure anomalies. Notice the strong low-pressure anomaly in the North Pacific, expanding across the United States and onwards into the Atlantic.
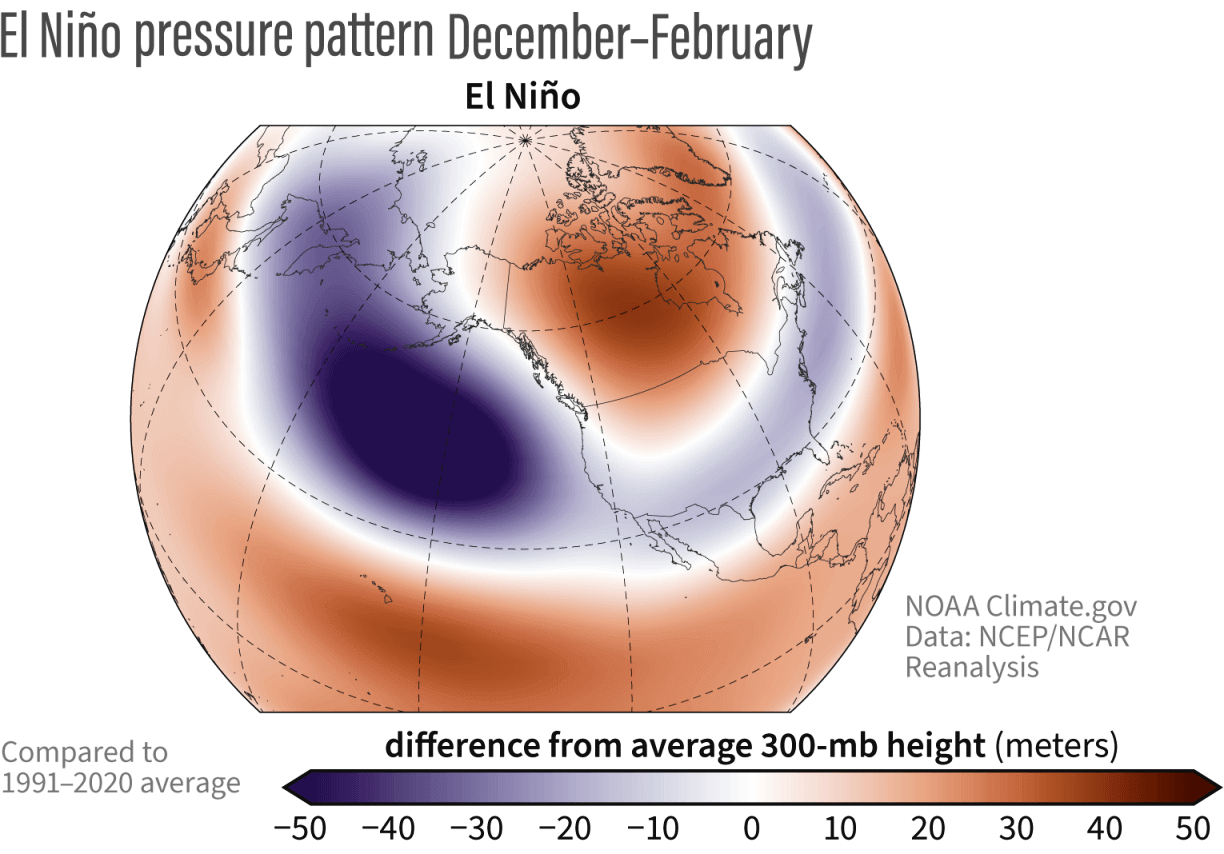
You can also see the high-pressure area over Canada and the northern United States, covering part of the polar regions. This pressure anomaly is very similar to what you saw in the forecast for the coming weeks, confirming the very likely El Nino influence.
The next NOAA image below shows all this information combined, revealing the average weather during the El Niño winter season.
You can see the strong and persistent low-pressure area in the North Pacific. That pushes the polar jet stream further north, bringing warmer-than-normal temperatures to the northern United States and western Canada.

The southerly Pacific jet stream is extended and amplified, bringing low pressure and storms with lots of precipitation and cooler weather to the southern and southeastern United States. This is similar to what we have seen this winter so far.
We will keep you updated on the developing weather trends in the coming weeks, so make sure to bookmark our page. Also, if you have seen this article in the Google App (Discover) feed, click the like and follow button there to see more of our forecasts and our latest articles on weather and nature in general.
Don’t miss:
How will the Spring Weather unfold over the United States and as the El Nino starts to decline?