The global weather system is currently undergoing a massive atmospheric reset as the tropical Pacific transitions from a multi-year La Niña into a potential record-breaking Super El Niño. Latest subsurface ocean analysis reveals a rapid shift below the ocean surface occurring in the western Pacific, similar to how the past Super El Niño events emerged.
A Super El Niño acts as a massive planetary heat engine, releasing vast amounts of stored oceanic energy into the atmosphere and significantly altering the global jet stream. Studies have confirmed that a Super El Niño can affect global climate for several years, transforming typical seasonal patterns and altering everything from international agriculture to winter storm tracks.
In this article, we will analyze the latest oceanic data and compare the current 2026 signatures to the strongest historical events of recent decades. We will also look at the latest seasonal forecasts and why this El Niño could be a record breaker. Also, we will find the first major weather impacts across the United States, Canada, and Europe, from Summer to the Atlantic Hurricane season, and into the Winter 2026/2027.
ENSO Cycle: Between the Ocean and the Atmosphere
ENSO is short for “El Niño Southern Oscillation”. This is a region of the equatorial Pacific Ocean that changes between warm and cold phases in about every 1-3 years.
The cold ENSO phase is called La Niña, and the warm phase is called El Niño. Each ENSO phase has a major influence on the complex ocean-atmosphere feedback system. These changes gradually affect global circulation, altering weather patterns worldwide.
In the image below, you can see a direct comparison between ocean temperature anomalies for each of the ENSO phases. Both examples show realistic data from the 10 strongest events for each anomaly, revealing the obvious ocean signature of the ENSO event.
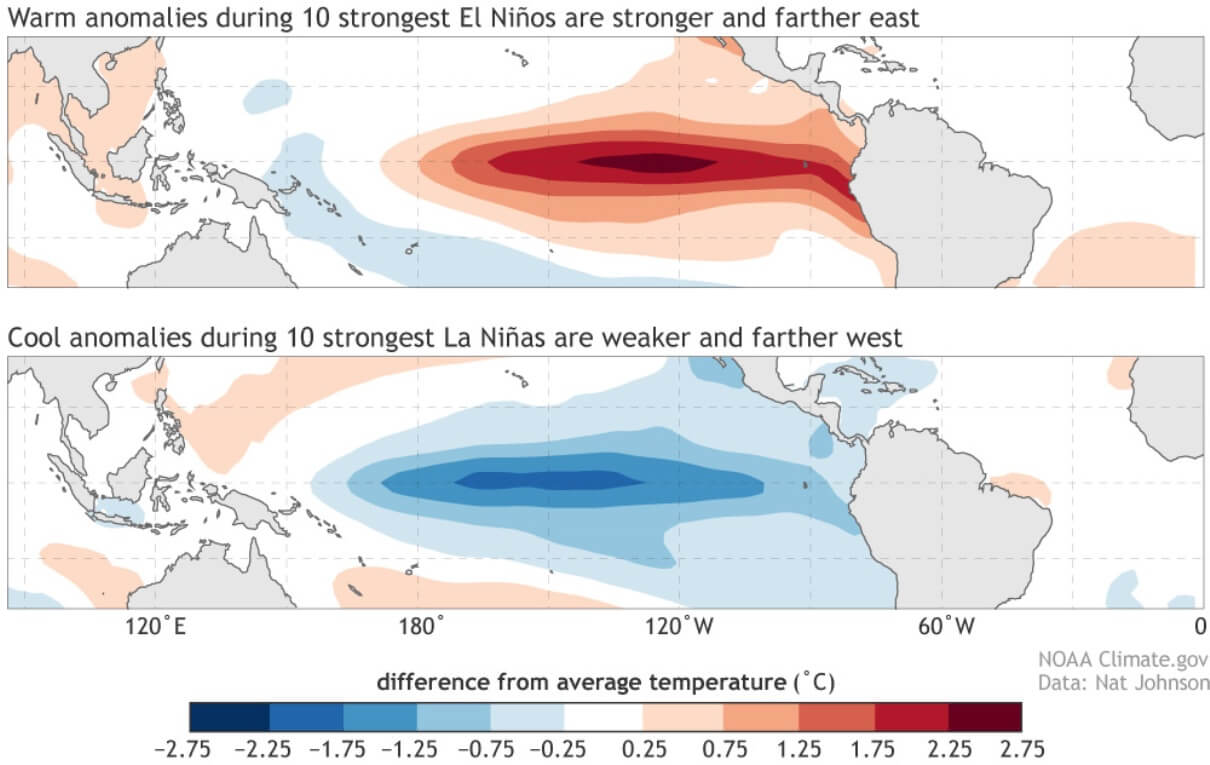
Some of these events can reach really strong anomalies, reaching a special “Super” class, most notably the El Niño phase. A Super El Niño is the “extreme” version of this event, officially defined by sea surface temperature anomalies sustained at +2.0°C or higher.
The key difference between a normal and a “Super” event is the intensity of atmospheric connection (coupling). A normal event shifts the jet stream, but a Super El Niño can cause a strong disruption to the atmospheric circulation.
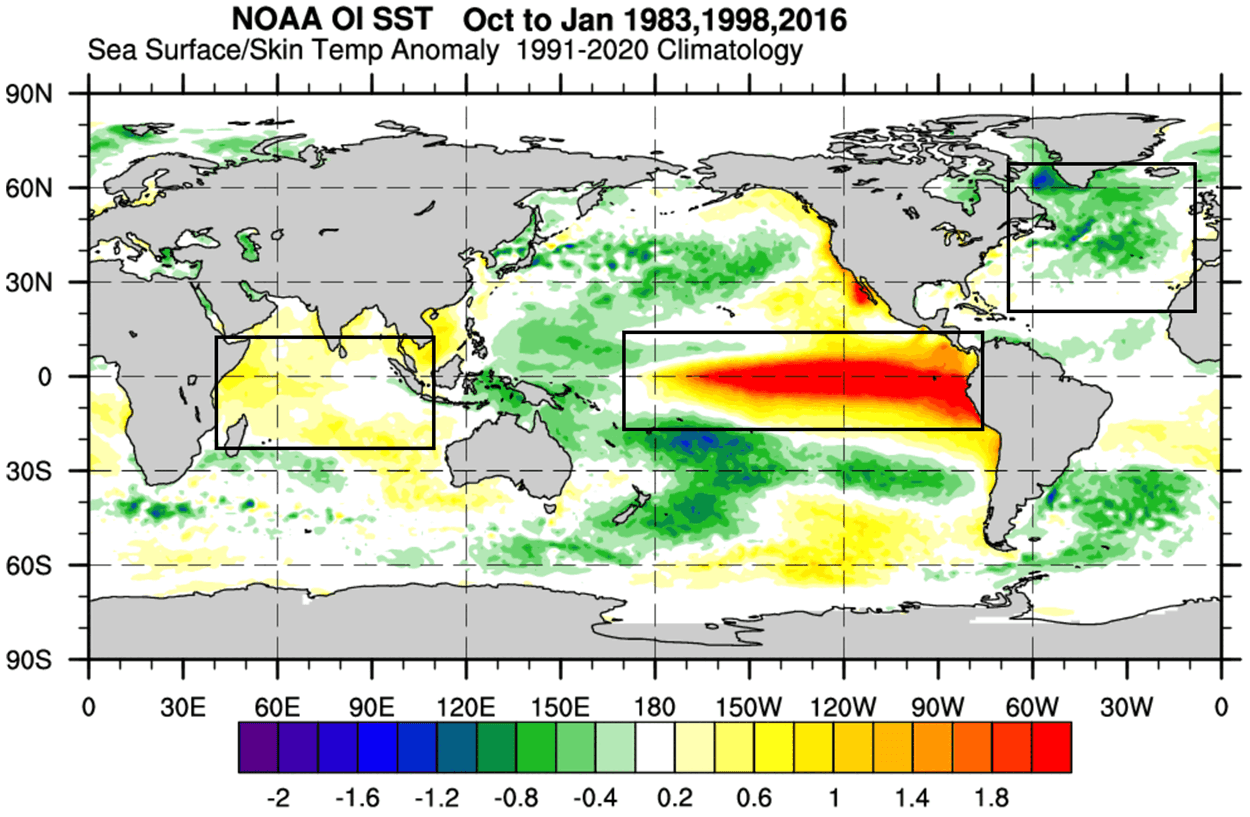
Below is the combined analysis image of the last 3 Super El Niño events, showing ocean temperature anomalies. You can see a strong warm anomaly in the ENSO region in the Pacific. But also note the cooler North Atlantic and another anomaly in the Indian Ocean.
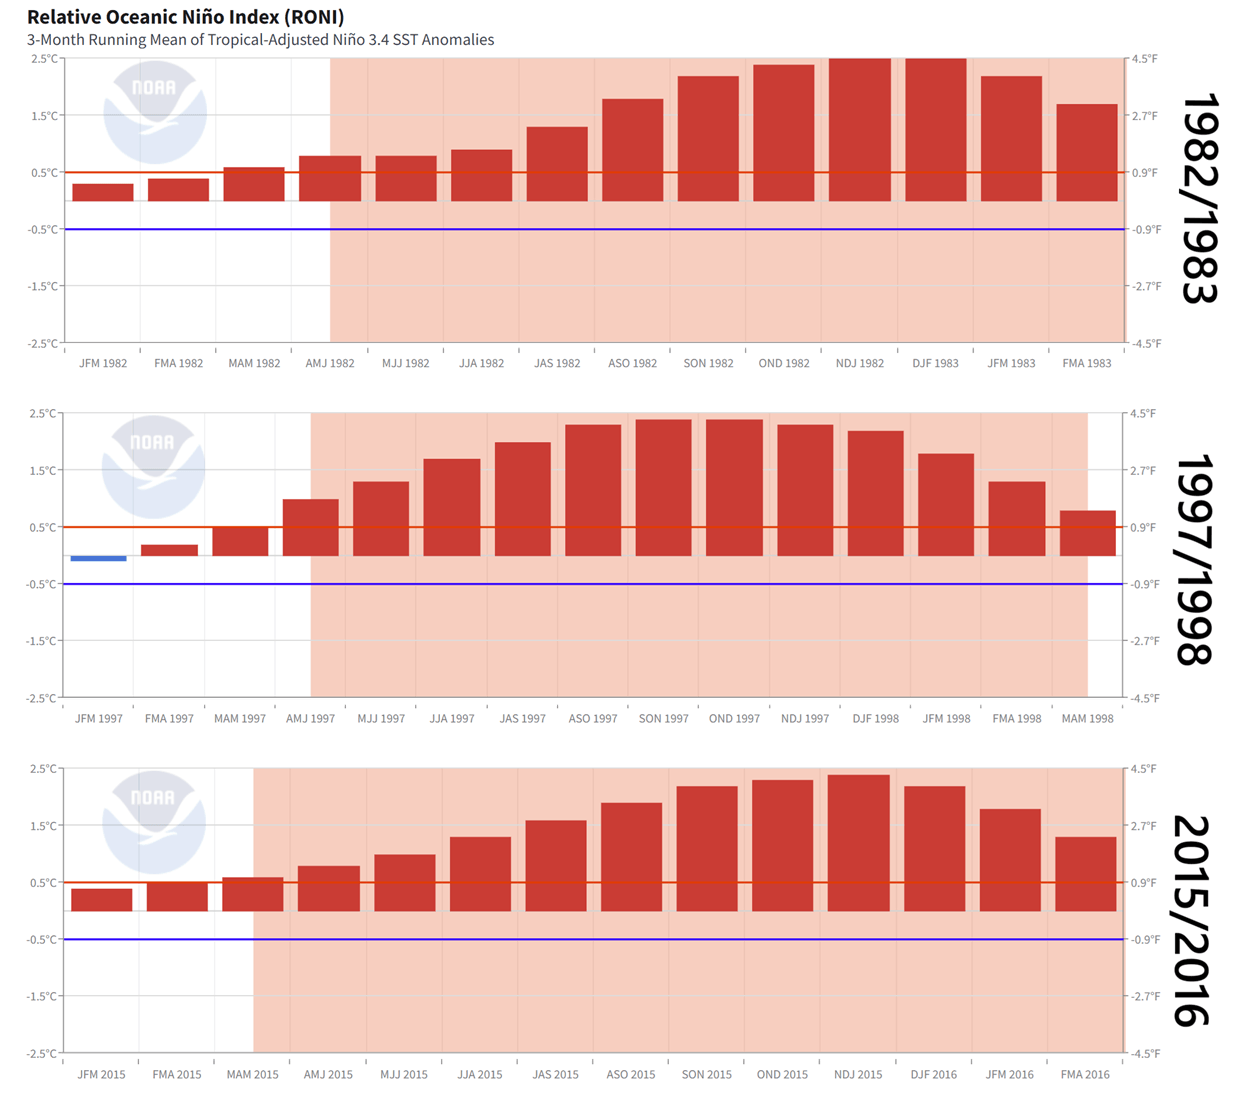
El Niño events happen every few years. But Super events tend to occur once per decade or less. The last three such events were in 2015/16, 1997/98, and 1982/83. Below are graphs from NCEI, showing the monthly progression of each event, starting in spring and peaking during the Winter season, breaking the Super event threshold (+2 degrees).
But how does an El Niño even reach a “Super” status? During La Niña, the trade winds pile up warm water in the western Pacific. This creates a warm oceanic layer at depth, raising ocean heat content and sea levels in the western Pacific.
A Super El Niño acts as a massive “pressure release valve” for this piled-up warm water and energy. Once La Niña collapses, a trigger (usually a series of Westerly Wind Bursts) allows that ocean heat to surge eastward. If the western ocean heat content is very high before the El Niño event starts, the energy “discharge” from there is much stronger, leading to a stronger Super event.
We have already detected several of these westerly wind burst anomalies, which have already started the rapid shift into an El Niño event. And given the latest forecasts, more are on the way, marking the start of a global atmospheric shift.
The Power Source: How Westerly Wind Bursts Spark a Super El Niño
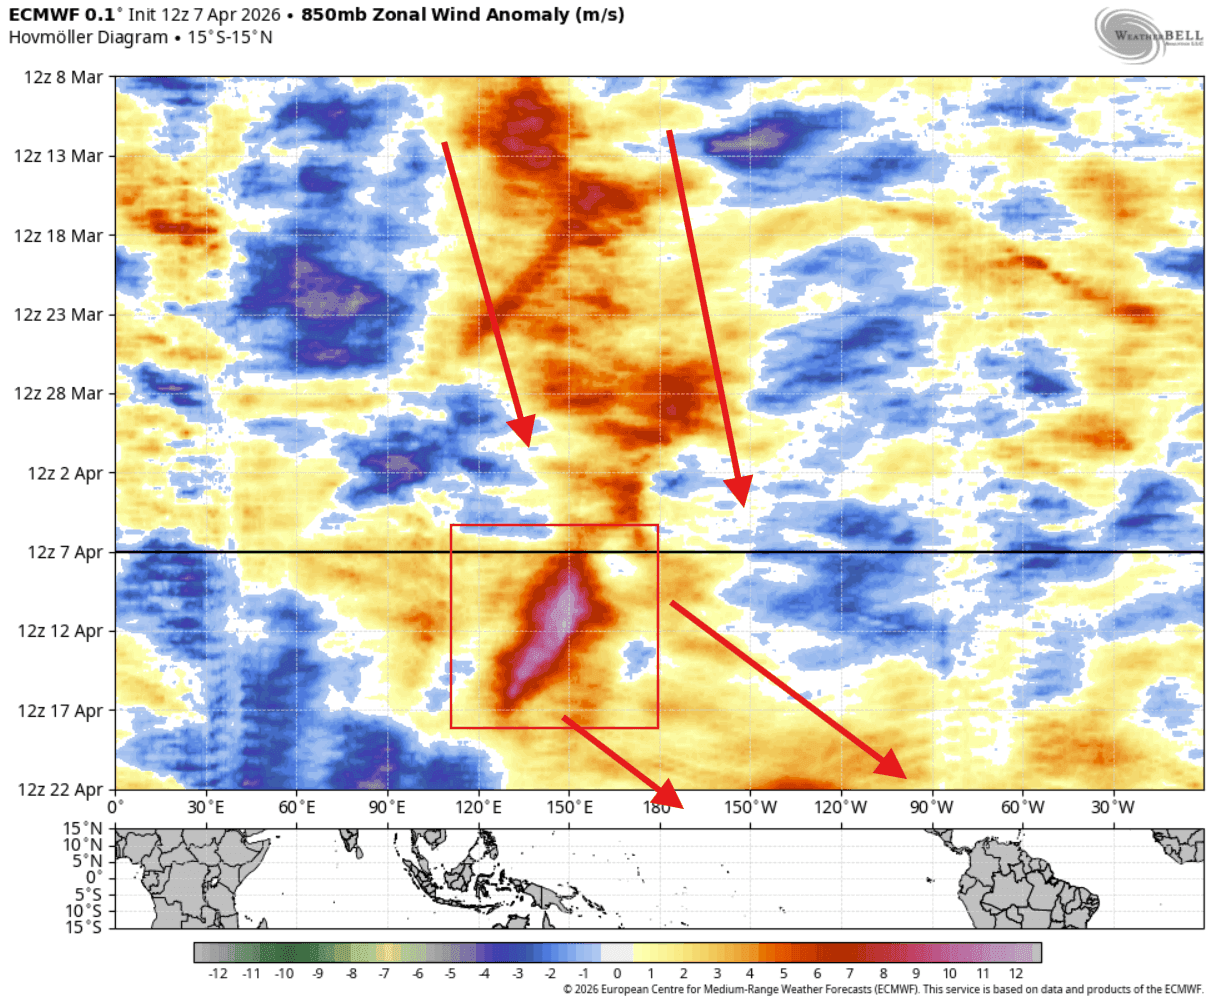
Below is the latest trade wind analysis and forecast, which shows strong westerly wind bursts occurring across the Pacific in recent weeks. In the forecast part, you can see an unusually strong westerly wind burst, with a trend to spread the westerly trade wind anomaly fully across the ENSO regions. This was one of the main “engines” of the past Super El Niño events, so this is a clear sign of the strong El Niño potential in 2026.
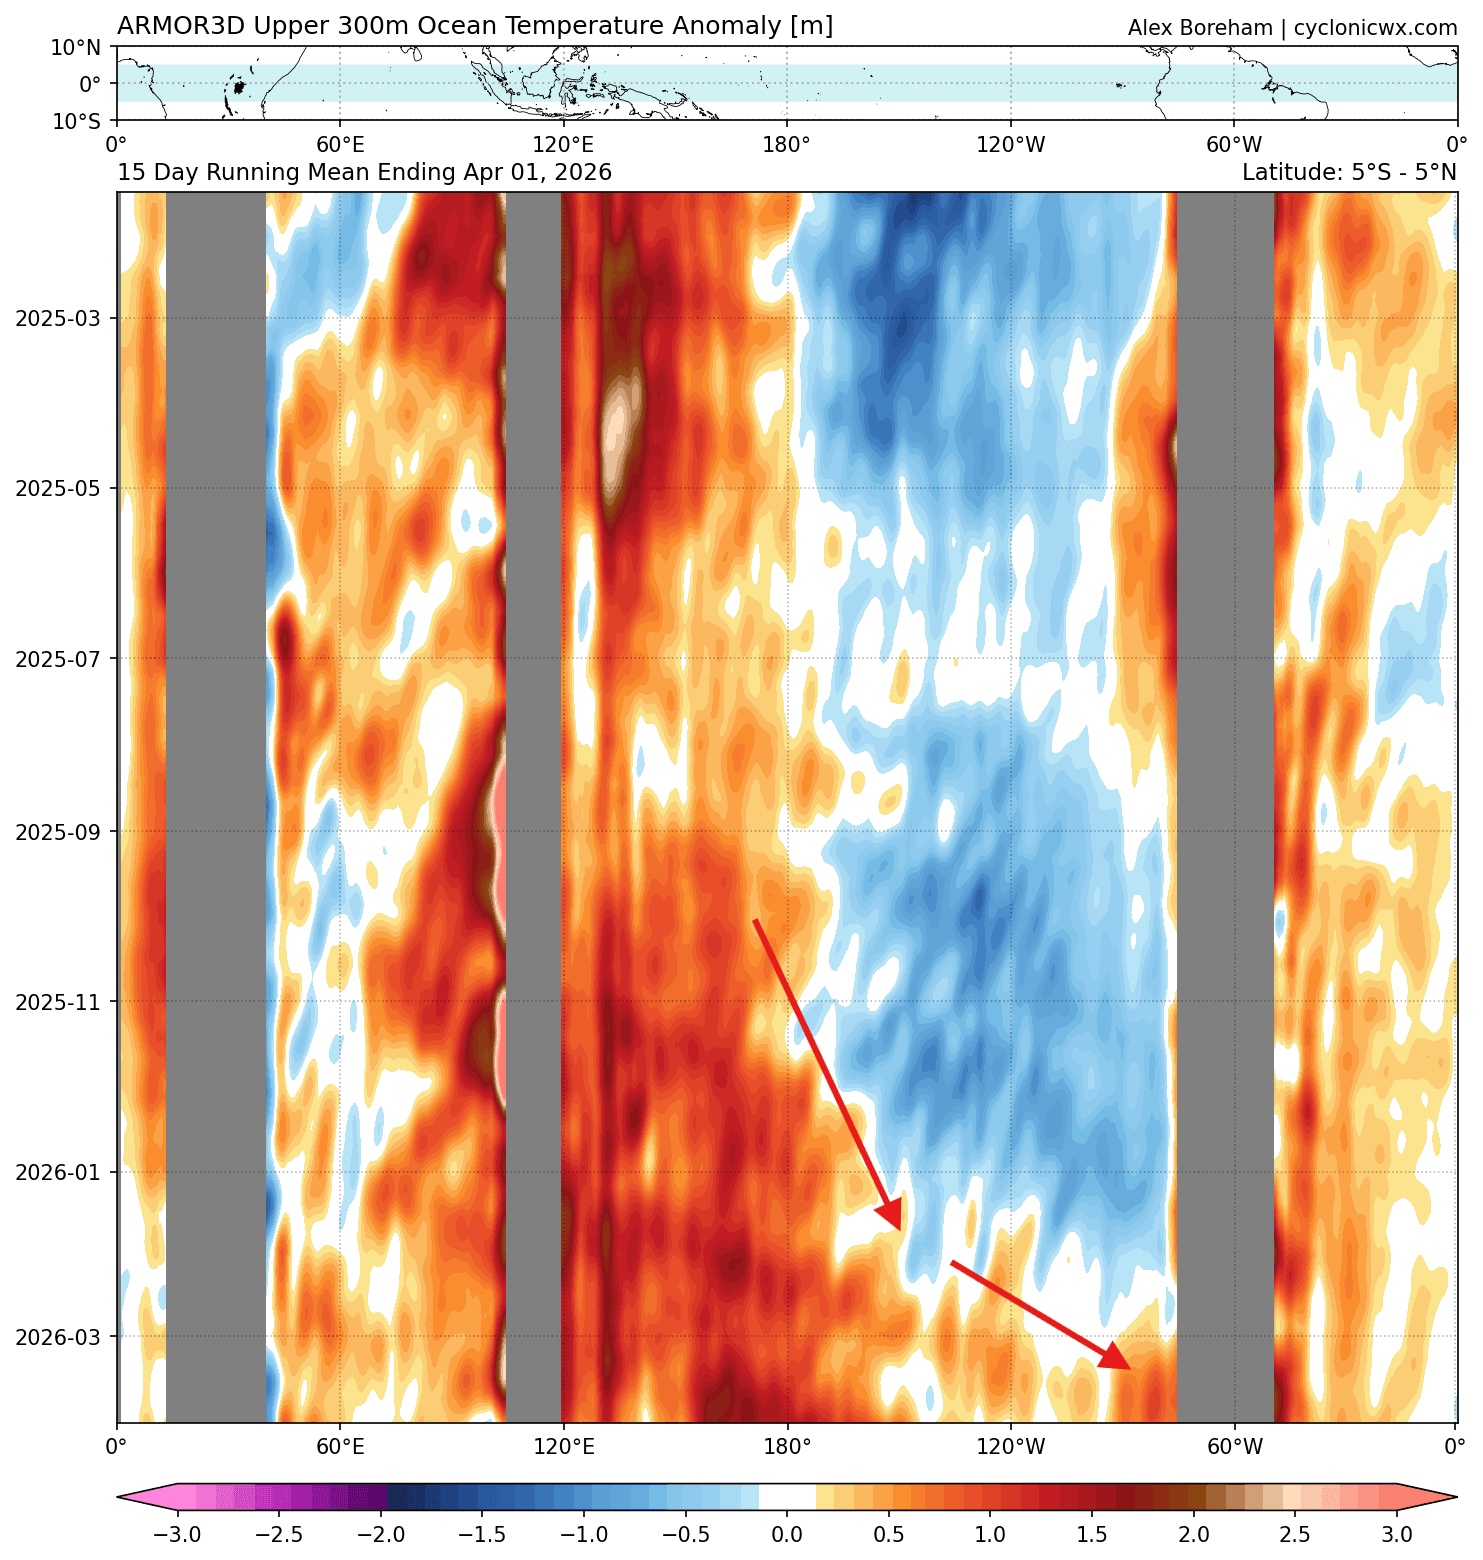
While the westerly wind burst is an “engine”, the true power of a forming El Niño comes from the large subsurface warm anomalies. That is monitored as the ocean heat content, which looks at the ocean down to 300m (1000ft) depth. Below is the latest analysis, which clearly shows an expanding warm anomaly across the tropical Pacific and ENSO regions, extending throughout the whole upper oceanic layer.
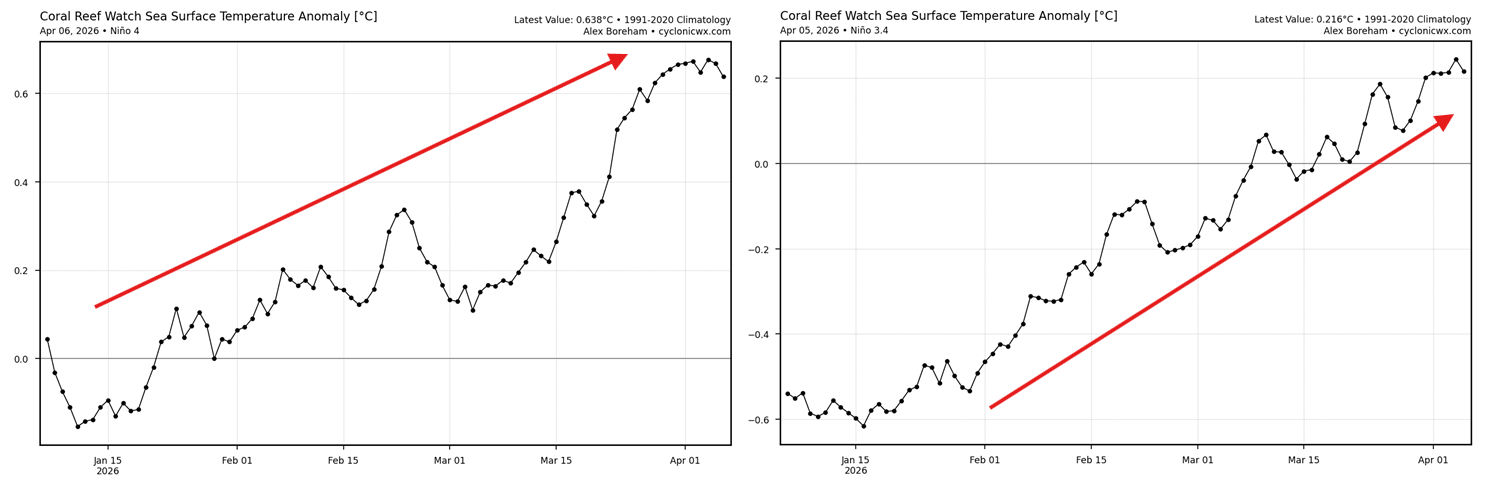
These changes are also confirmed at the surface, which we can see in the analysis graphs below. These graphs show the anomaly data for the past 3 months in the main region (right and in the western region (left). You can see a clear and rapid temperature anomaly rise since mid-Winter, driven by the westerly wind bursts in the western Pacific and the expanding subsurface warm anomalies.
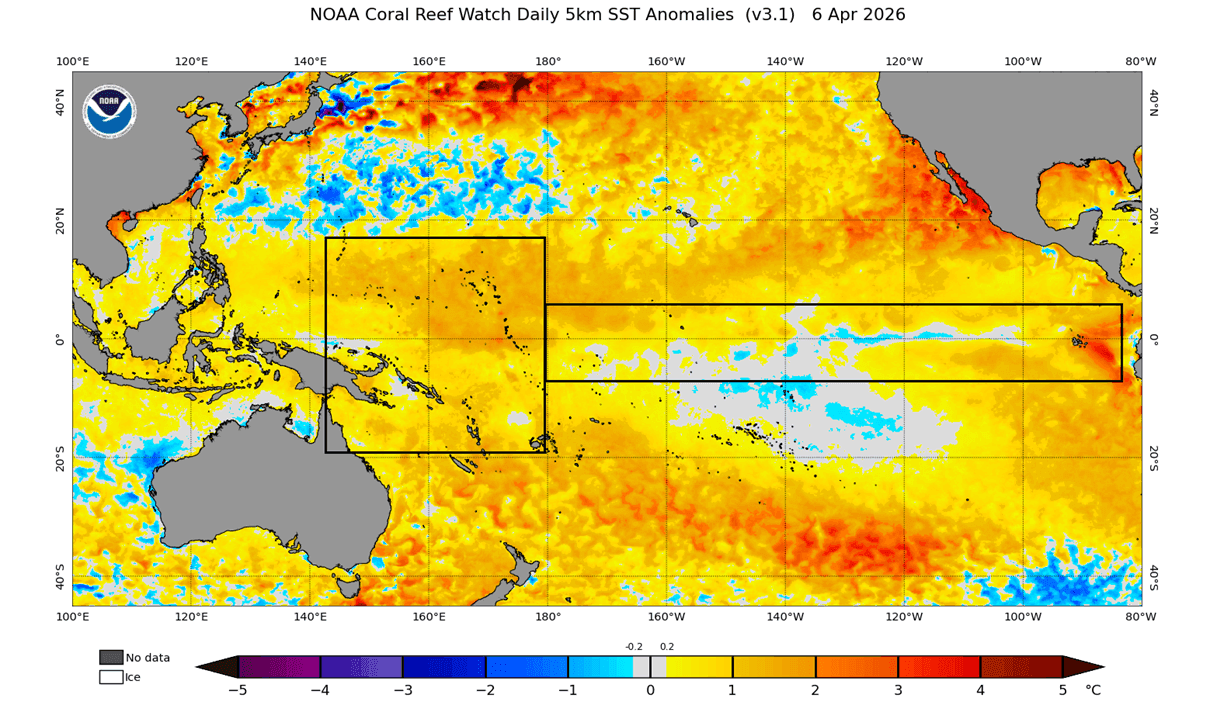
The latest surface analysis below also shows the main ENSO region with disappearing cool patches, and most of the region is already in positive anomalies. What we are currently monitoring is also the western Pacific area, which is expected to undergo further westerly wind burst events and will push more of the warmer waters to the east, at the surface and below, as an oceanic Kelvin Wave.
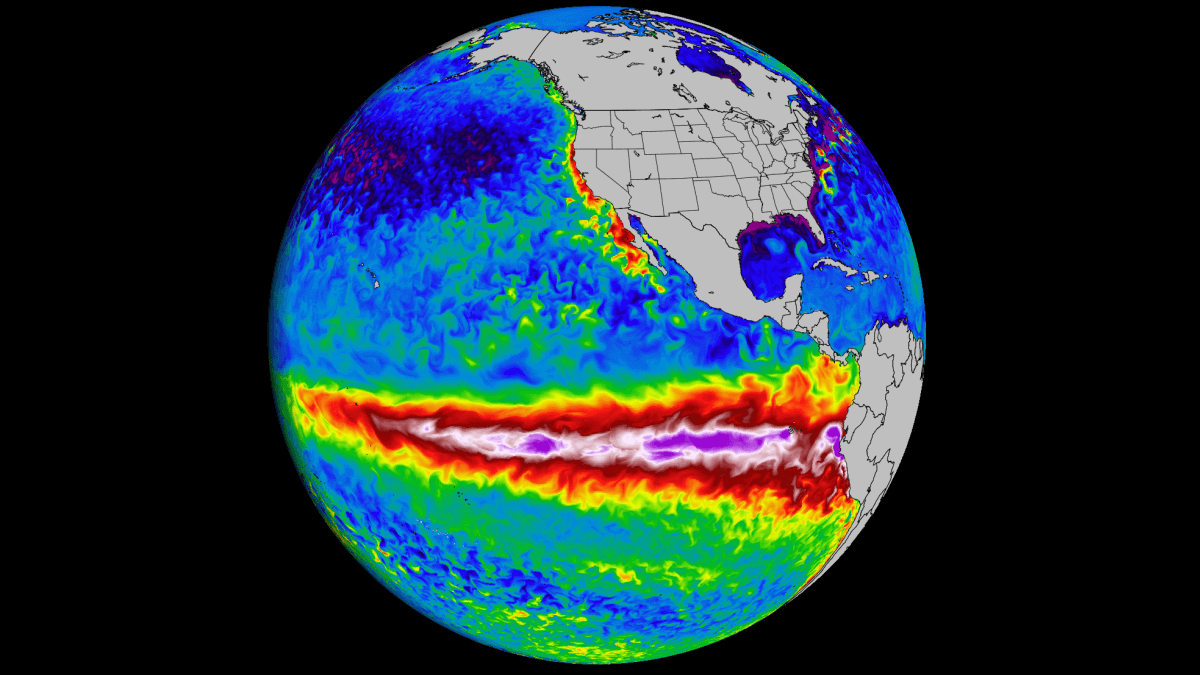
This is much better seen in the video below, which shows the last 90 days of ocean temperature changes in the ENSO region. You can see an active weak La Niña event just two months ago and how rapidly it started to dissolve in recent weeks, with a warm anomaly emerging.
As mentioned, the strong temperature changes deep beneath the ocean surface are a key (invisible) dynamic in this story for 2026/2027. The image below shows the latest subsurface ocean temperature anomalies across the tropical Pacific, with a large subsurface warm pool at around 100-250m (300-800ft) depth.
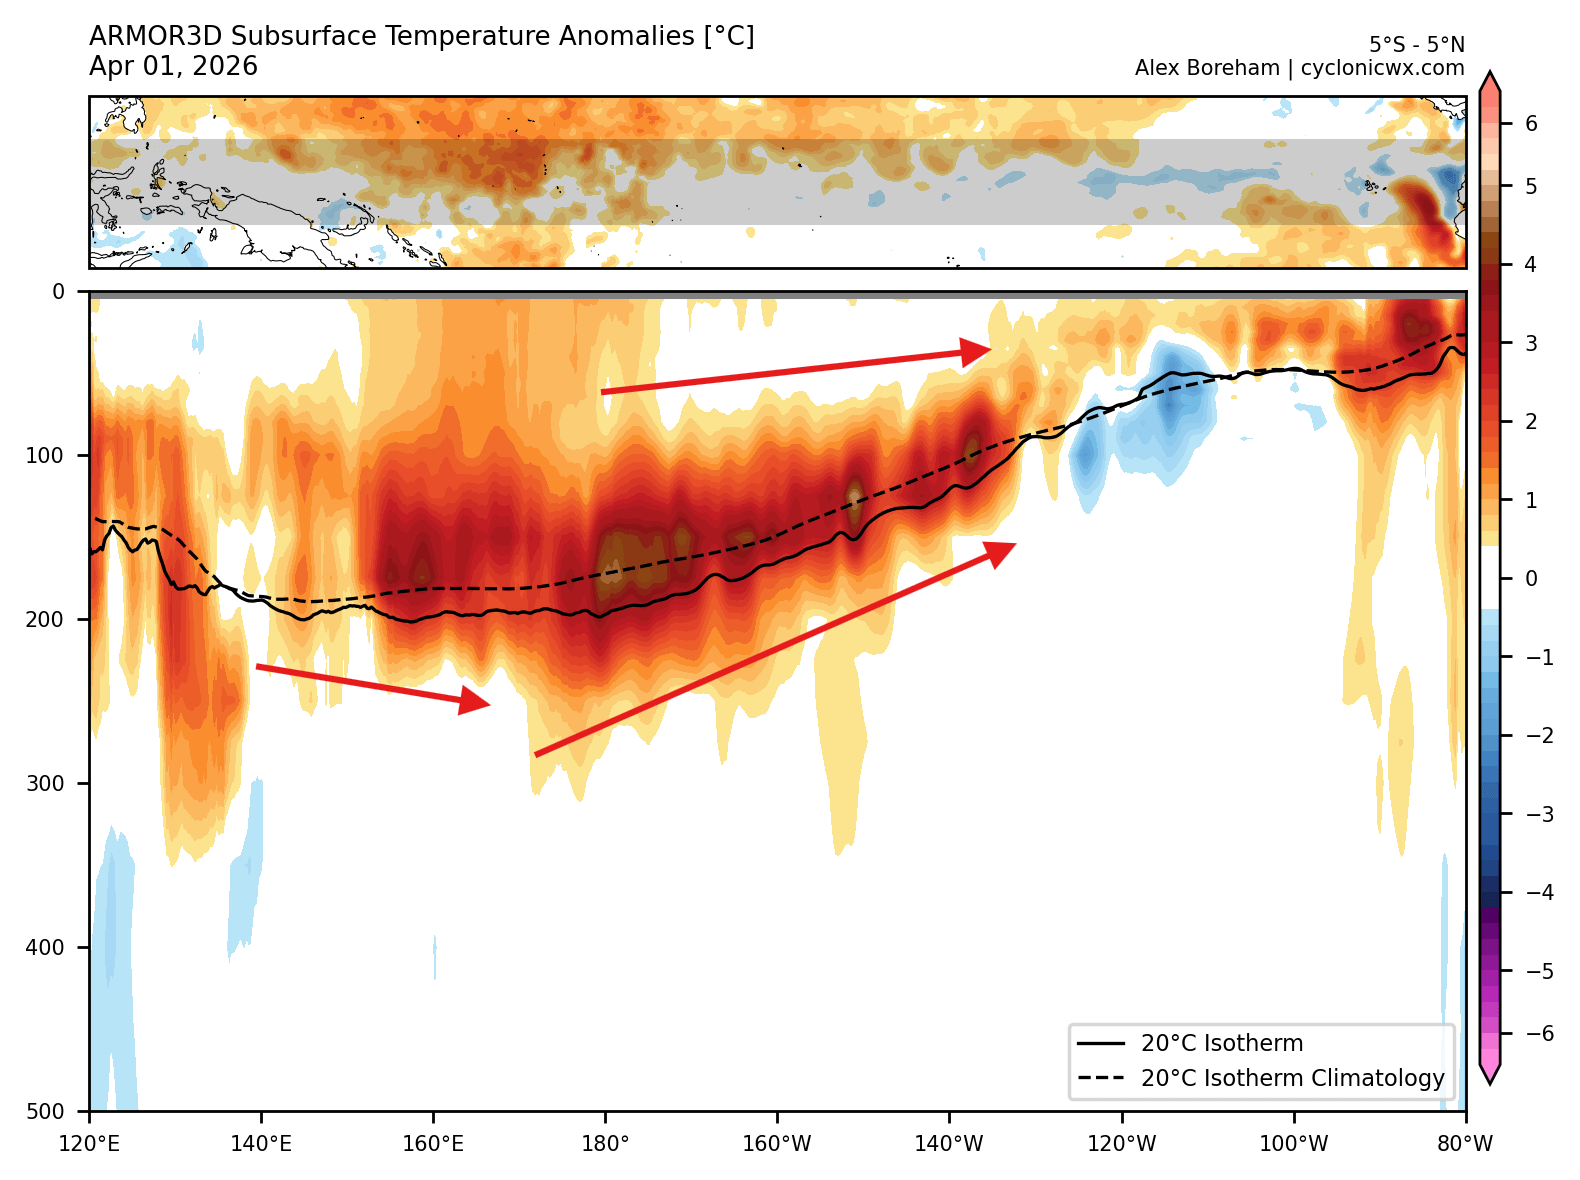
This is called an oceanic Kelvin wave, and is making its way east, fully eroding the subsurface cold and emerging on the surface as the eventual El Niño event. These subsurface Kelvin waves are driven by the westerly wind bursts we saw above, really emphasizing the important, strong connection between the oceans and the atmosphere.
We can use this to compare the 2026 development to the past Super El Niño events, as the subsurface component is one of the key aspects of development.
The Heavy Hitters: Measuring 2026 Against the Strongest Events Ever Seen
When we compare the subsurface heat of 2026 to past Super events, we start to see a very familiar and powerful signature.
We can look at the subsurface temperature anomalies across the tropical Pacific, in the top 300m (1000ft) of the ocean. The image shows a direct comparison of subsurface anomalies for the first week of April, between this year and the past two Super El Niño events. What it tells us is that the west Pacific is much warmer below the surface, and the main warm pool is not fully developed yet.
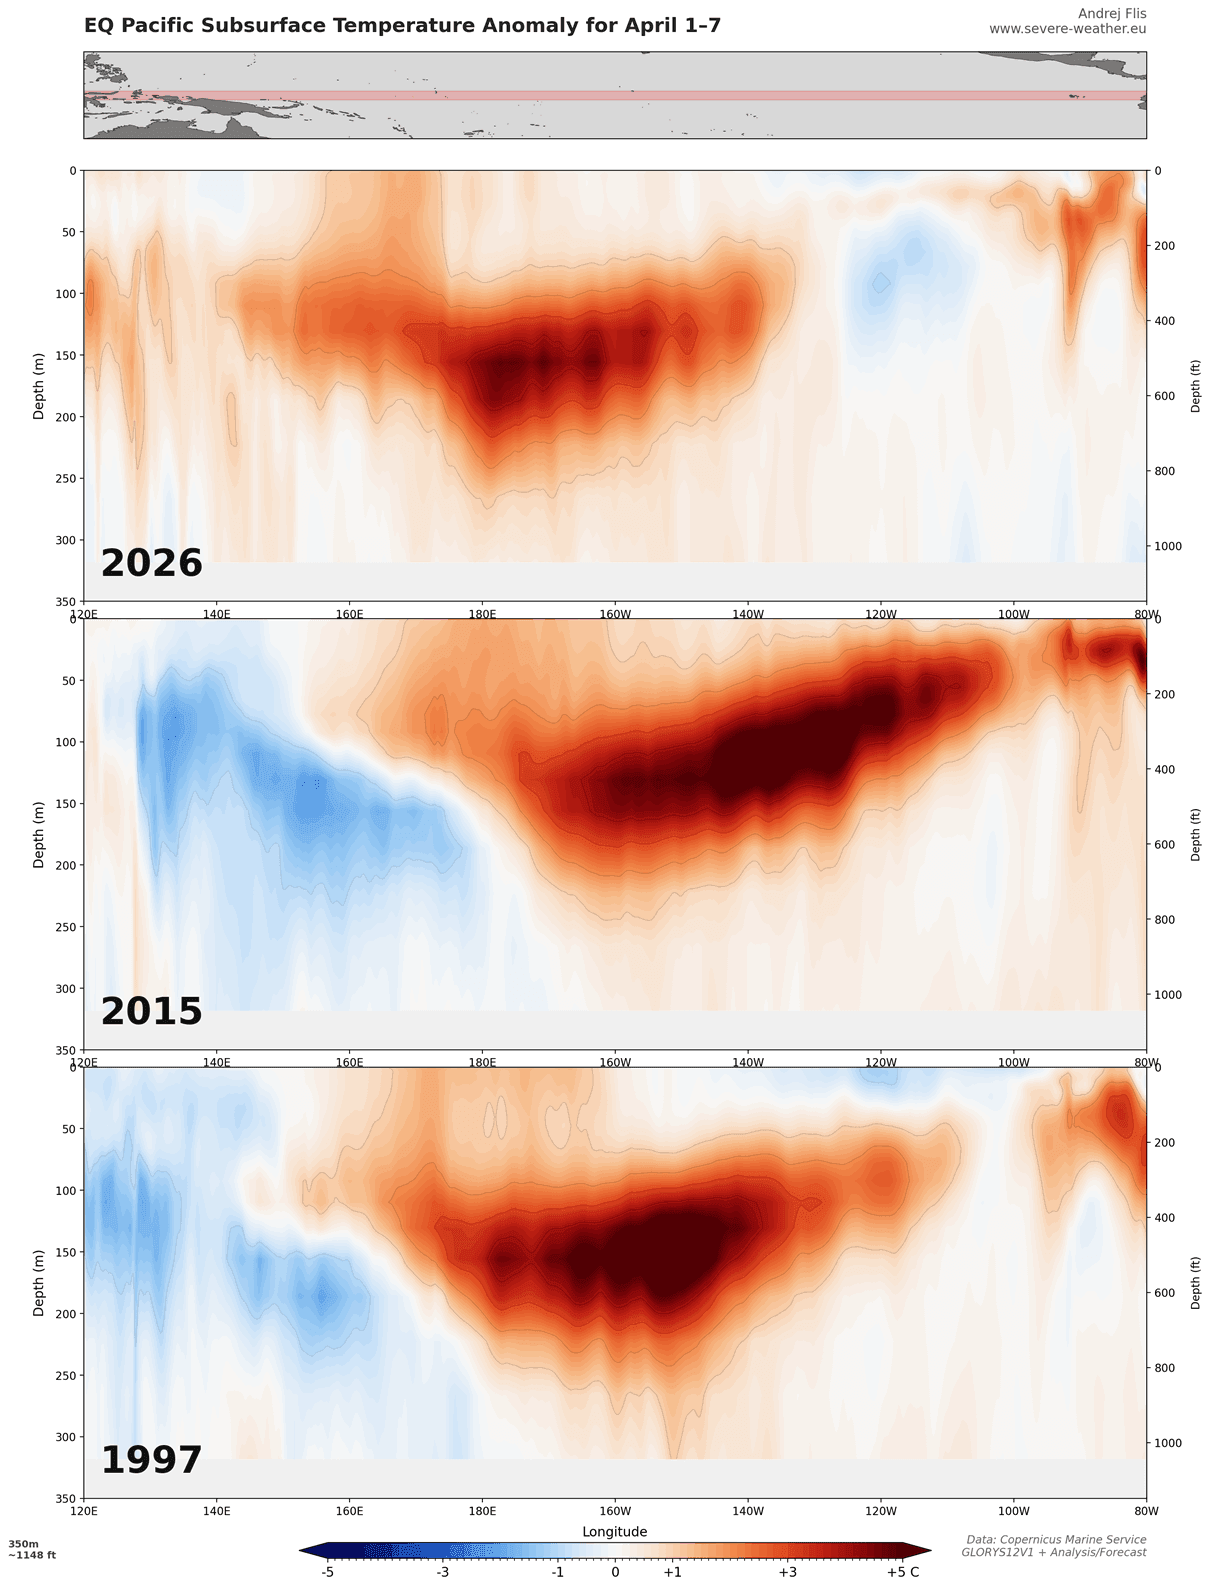
This difference comes from the fact that, unlike the two Super El Niño events, we are just coming off a weak La Niña, so there is some catch-up to do in terms of time. But it’s remarkable how fast it’s catching up, boosted by the strong westerly wind bursts.
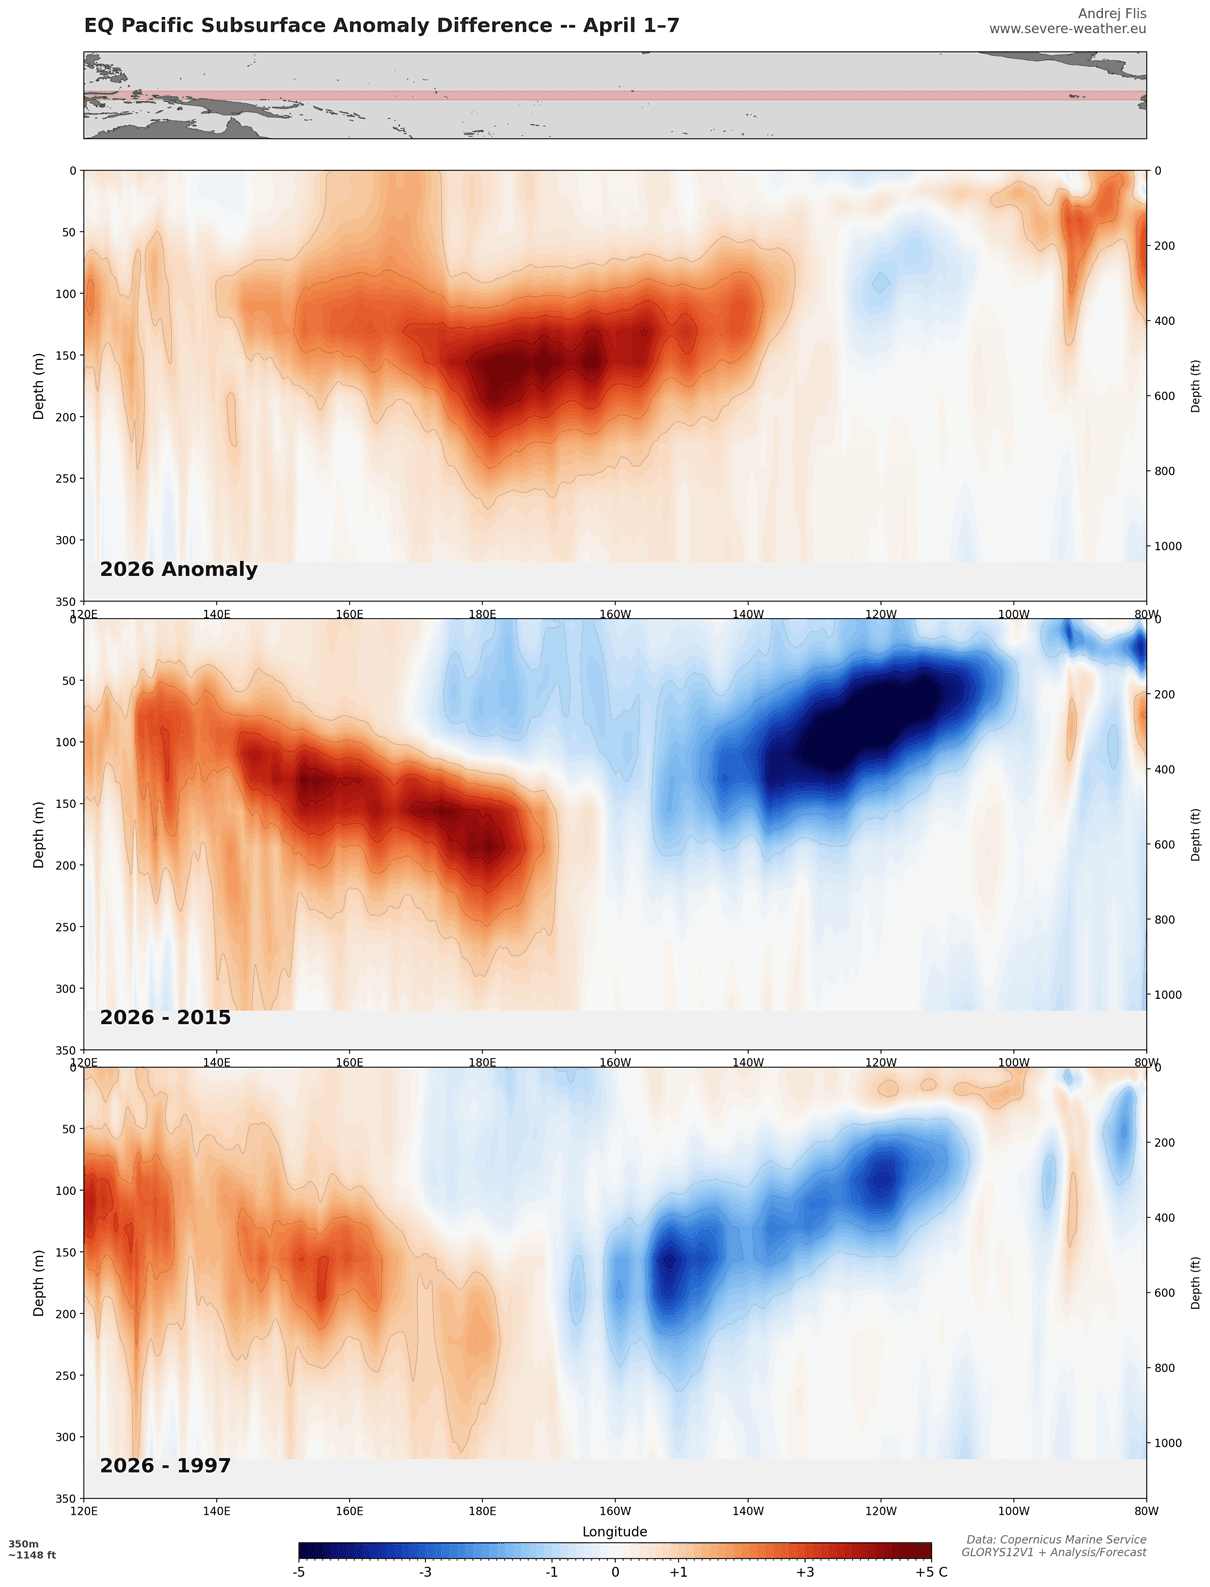
We can also plot a direct difference between 2026 and the past two super events. And it shows the proper subsurface difference, which reveals that 2026 is only behind in time, because it has a much warmer western Pacific zone, which will push further east, with more westerly wind bursts in the next days and weeks.
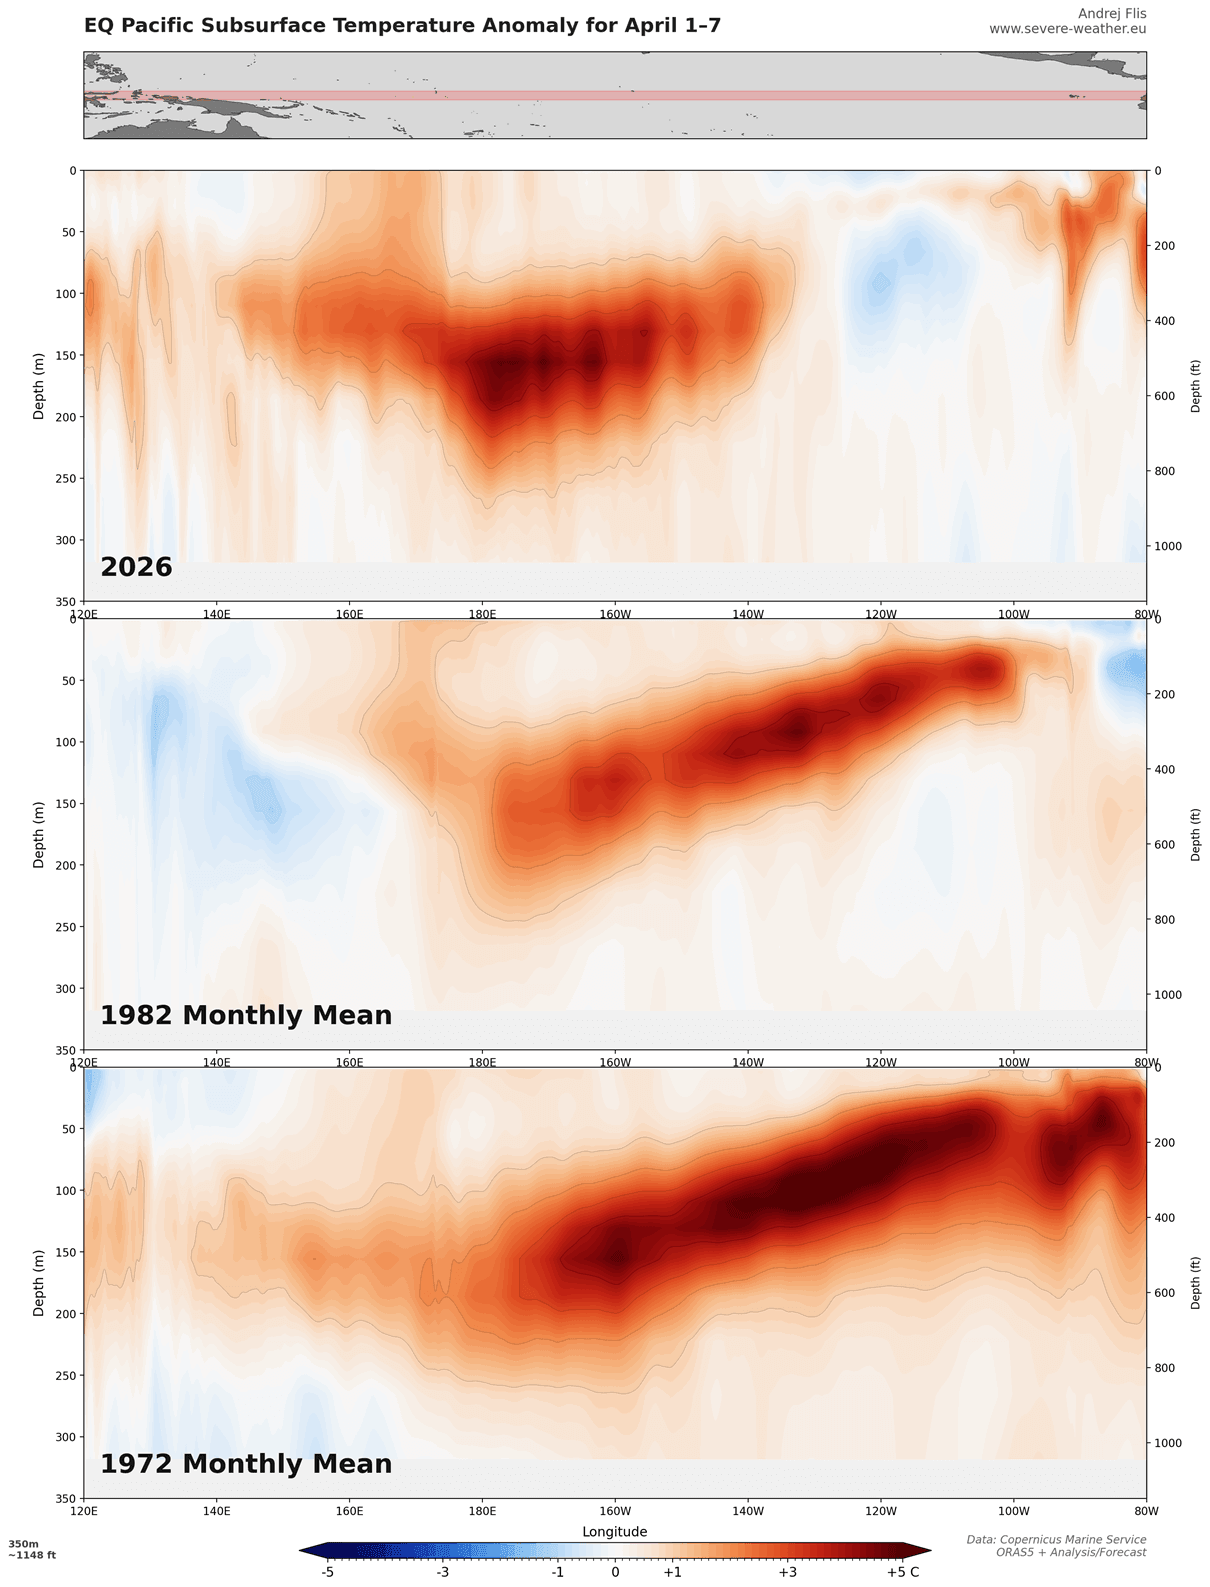
Otherwise, it looks overall ready for a strong El Niño event, which the latest forecasts indicate could be the strongest in decades. We can also compare it to the two Super El Niño events further back, in 1982 and 1972.
In this comparison, the two years show fully monthly data, as daily data is not available for the first week of April. But we can see that we are perhaps closest in evolution to 1972/1973, especially when we take the time delay into account.
The latest forecast data also reflects these massive oceanic and atmospheric changes, and shows an even stronger signal for the new El Niño event than previous runs. New data is also beginning to confirm the intensity of the new El Niño event.
Latest Forecast Data: Why the 2026 Event Could Be the Strongest in Decades
As we enter the long-range forecasts, a single question usually arises: Why bother with monthly trends when we are not sure of the temperatures in our city 5 days ahead? But there is a difference between forecasting backyard temperatures and forecasting a global-scale event.
We can think of weather as the specific lines an actor says on stage in a play, which are very specific and can vary. But seasonal drivers like El Niño are just as the script and the scenery. It tells us if we are going to watch a drama or a comedy, so we know exactly what kind of “show” to expect for the coming months.
Below is the latest ENSO multi-model forecast for the next few months from the North American forecasting system (NMME). Both graphs are for the main ENSO region, showing multiple long-range models and spread, confirming a shift into a strong El Niño event for 2026, with the mean value exceeding the +2.0 threshold.
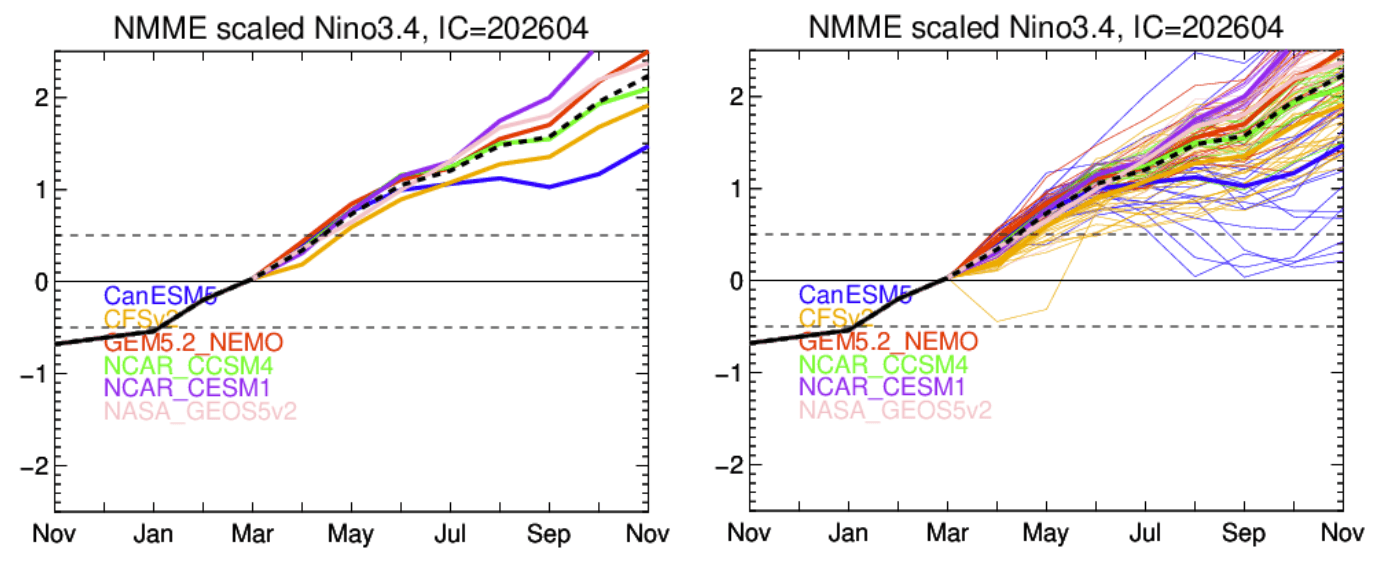
A Super El Niño is scientifically recognized when sea surface temperature anomalies in the Niño3.4 region exceed a threshold of +2.0 or higher above the long-term average. This identifies events of high intensity in which atmospheric coupling is strong enough to shift global weather patterns into a high-impact state.
Below is also the latest ECMWF model forecast for the next few months. This also shows a strong El Niño developing into 2026, easily exceeding the +2 degrees threshold and pushing it into the Super event category. Most ensemble members exceed this boundary, aiming even higher for the later peak.
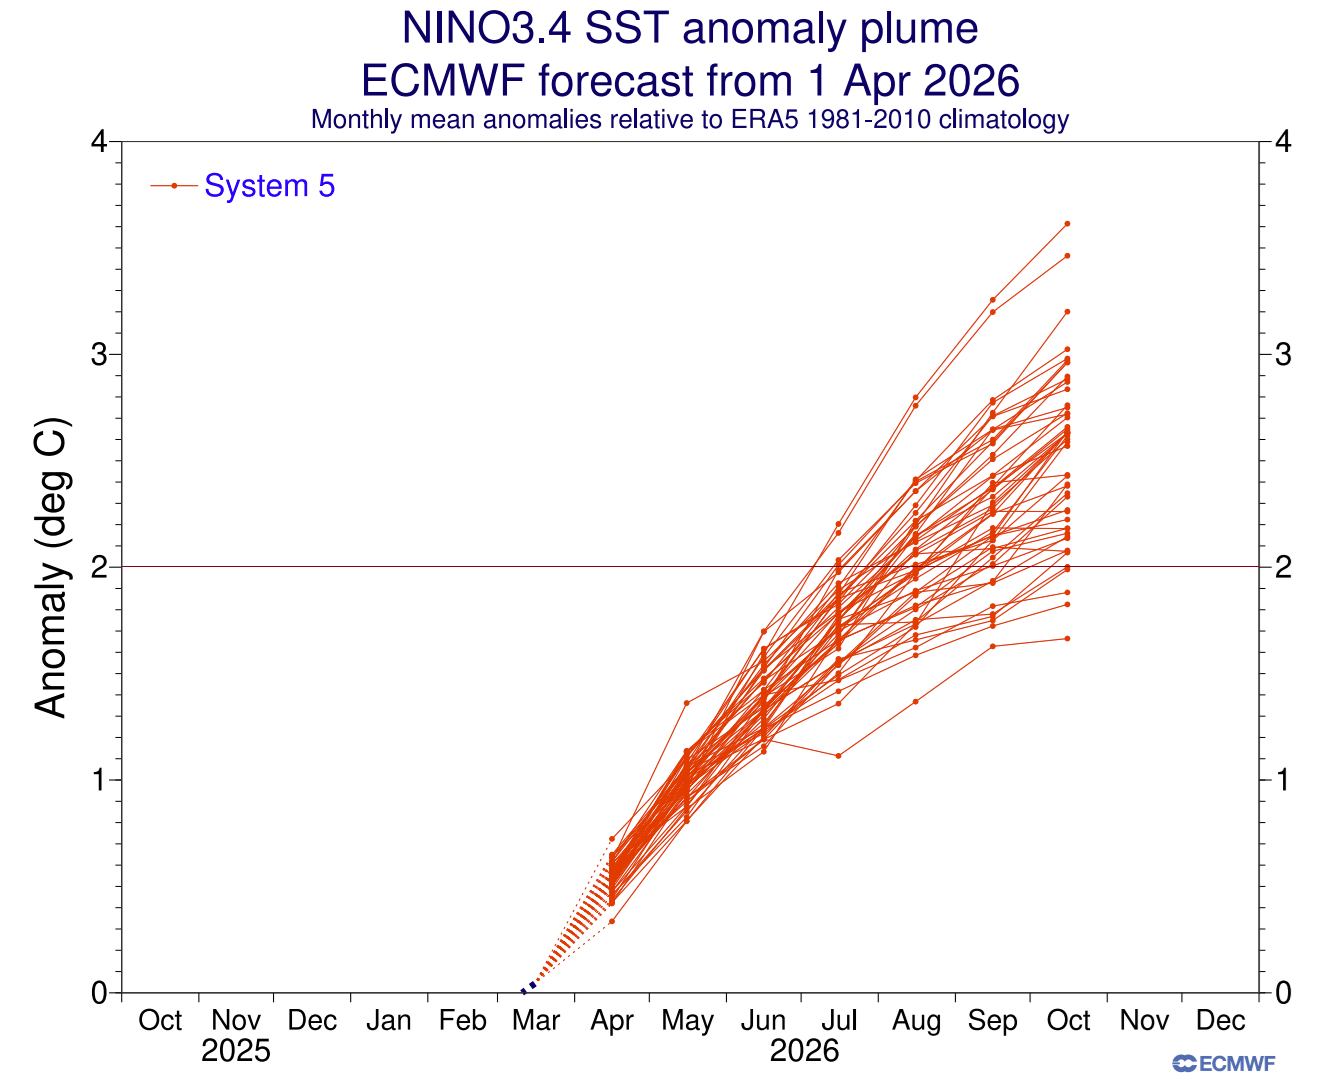
Both leading seasonal ensemble systems indicate a high likelihood of a Super El Niño in the second half of 2026. The usual peak occurs between Fall and early Winter, so the true peak is likely not yet visible or properly defined in the current forecasts.
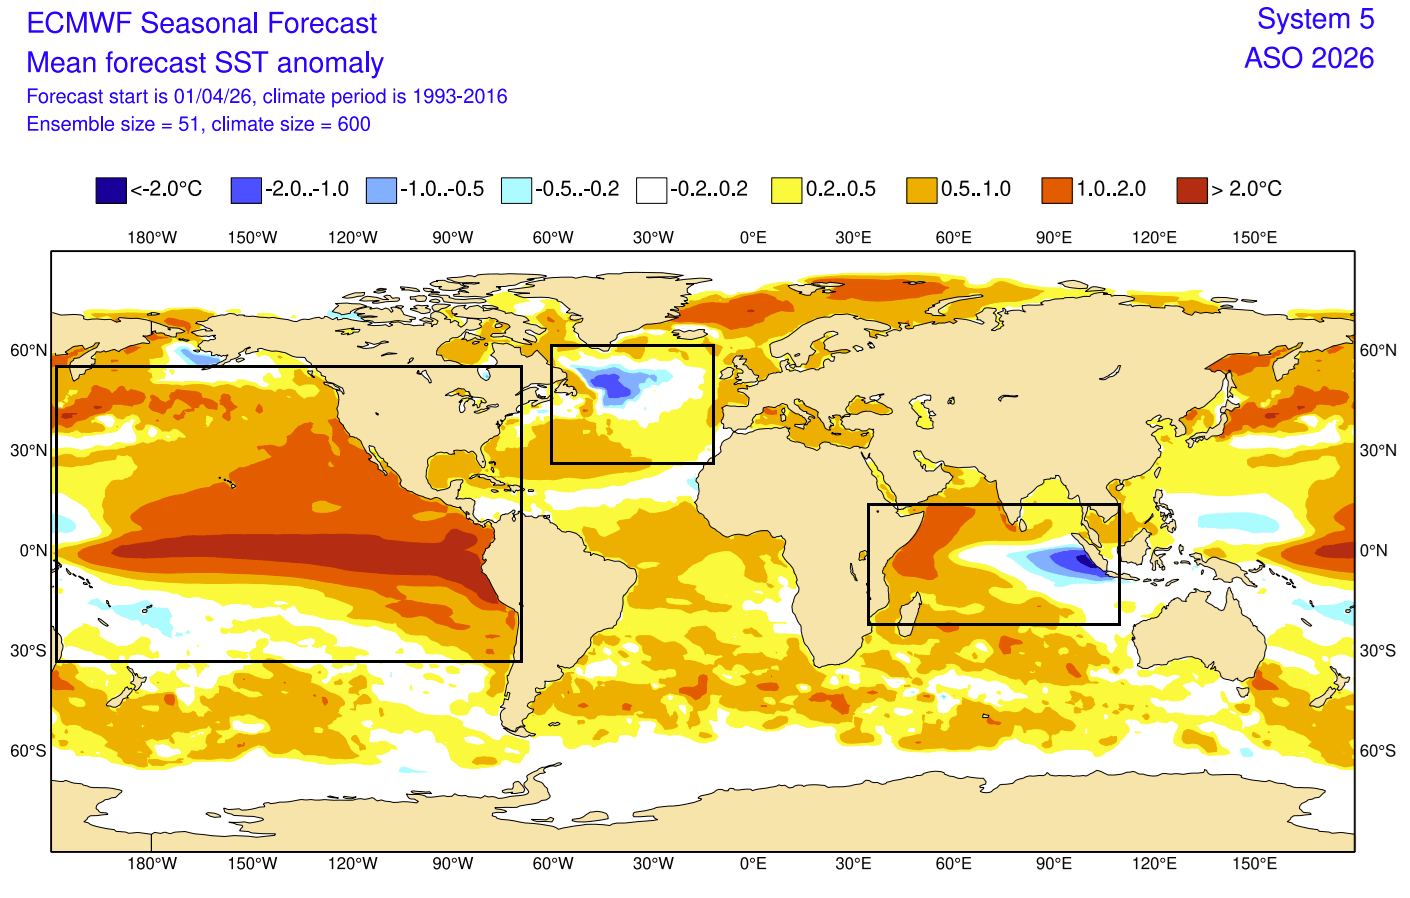
Below is the latest ECMWF forecast for the August-October period, and it shows a significant El Niño anomaly across the tropical and northern Pacific. The values exceed +2 degrees across the whole ENSO region, consistent with the strength of a Super El Niño event.
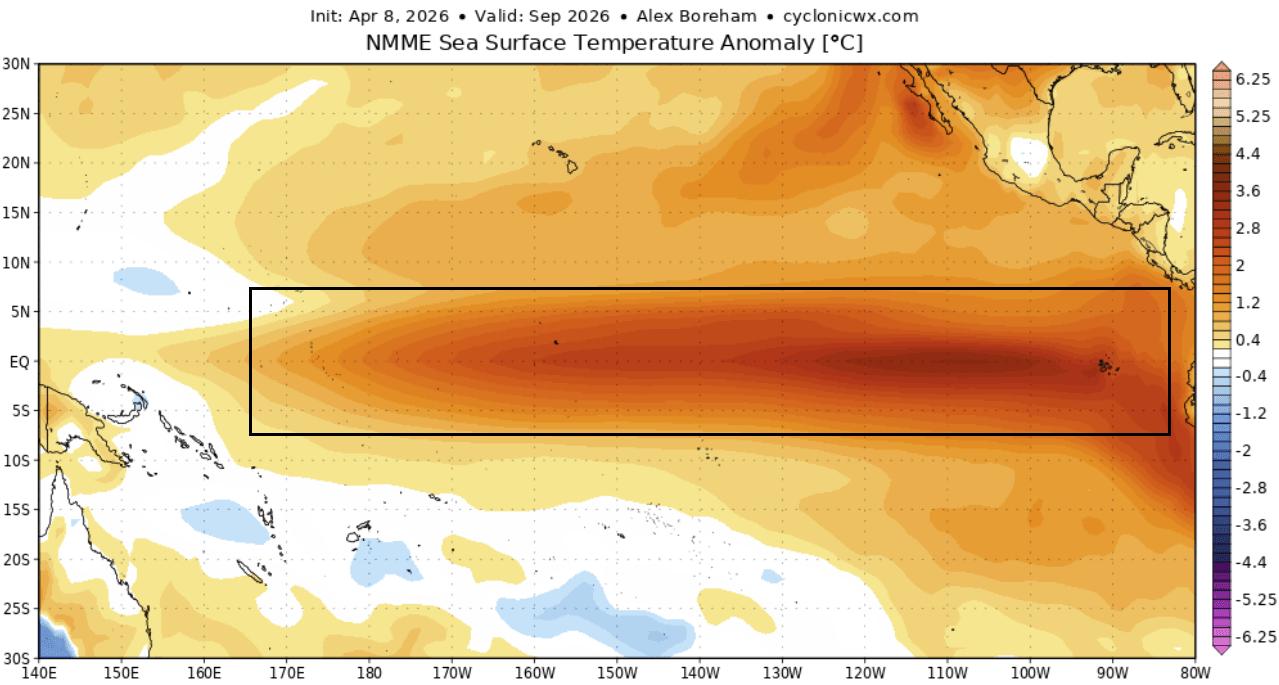
Looking also at the latest NMME multi-model forecast for early Fall, you can see a strong El Niño anomaly in the Pacific. This also shows the distribution of peak anomalies to resemble a proper Super El Niño evolution in 2026/2027. Based on all the combined forecasts and analysis, we could be looking at the strongest Super El Niño event in decades.
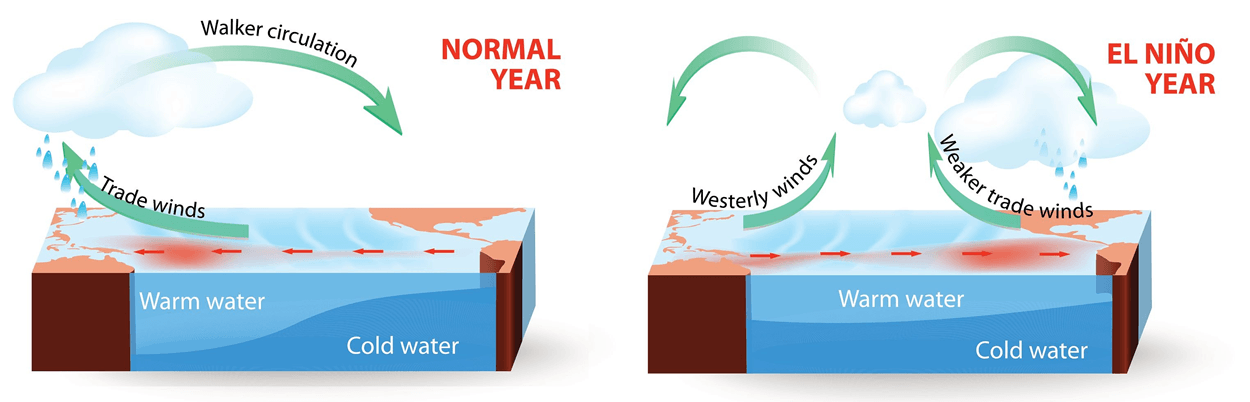
But just having an El Niño warm signature in the ocean is not enough. For a proper impact, we have to see it starting to impact the atmosphere. That usually happens in a very specific way, as El Niño causes rising air in the eastern Pacific and sinking air in the west.
This upward and downward atmospheric motion in the tropical regions is called the Walker Cell, and is especially sensitive to strong El Niño and La Niña events. The schematic below shows the outline of atmospheric motion in a normal atmosphere and during an El Niño event, and how its impact spreads into the global weather system via this atmospheric cell.
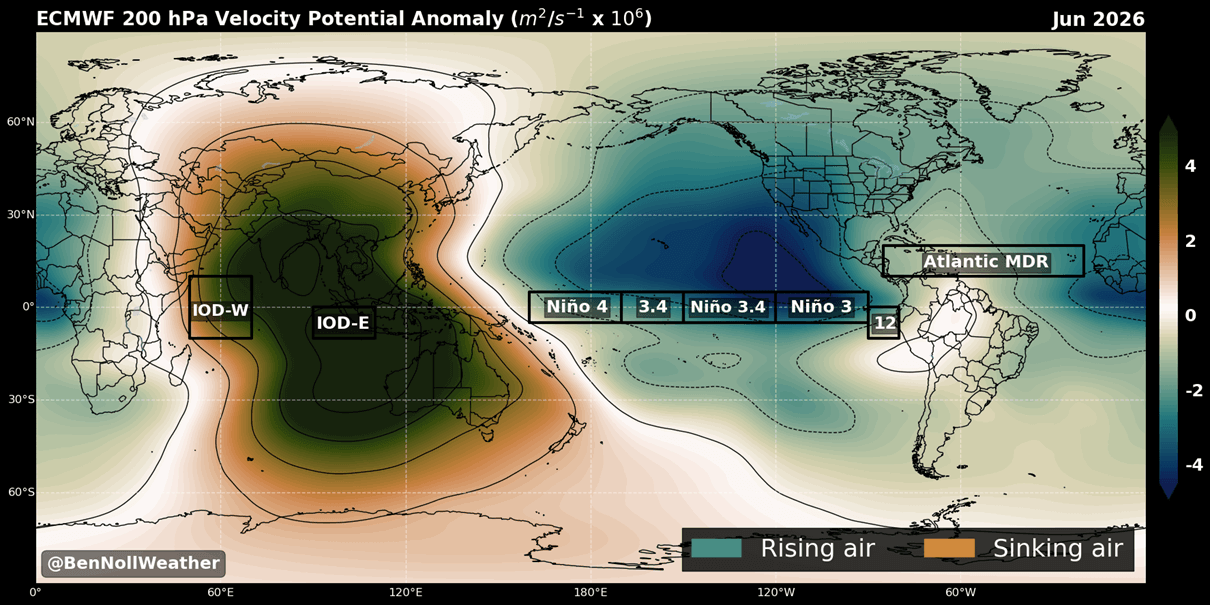
We can already see this specific impact clearly in the June 2026 forecast, for the parameter known as Velocity Potential (VP). It shows rising air and sinking air, revealing the overall atmospheric circulation mode and the state of the Walker Cell. This forecast shows a strong onset of an El Niño atmospheric circulation as early as the start of Summer. Image by meteorologist Ben Noll.
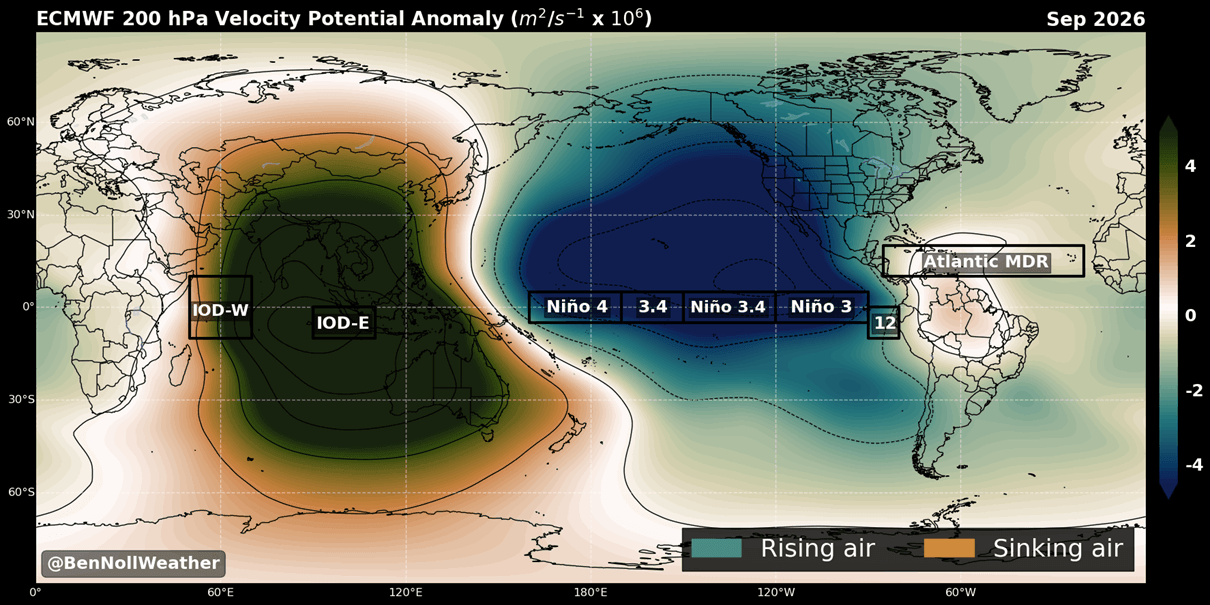
Going forward into early Fall, we can see this process much more amplified, with a significant El Niño circulation taking over in the atmosphere. This has profound impacts on the developing weather patterns in both the Northern and Southern Hemispheres. But also more of a direct regional impacts over North America, Australia, etc.
Knowing that we are likely going to deal with a Super El Niño event in 2026/2027, we can look at the past super events to have an idea of what we might expect during the upcoming season. We will take a closer look at Summer, which is the first season with an obvious El Niño interference.
The First Impact: Emerging Atmospheric Responses in Summer 2026
The El Niño is forecast to start impacting the Atmosphere by Summer, but its impact is usually not immediate or overnight. Given how the forecast patterns look, the atmosphere is already expected to show El Niño-like patterns during Summer 2026 in the Northern Hemisphere, while there is Winter in the Southern Hemisphere.
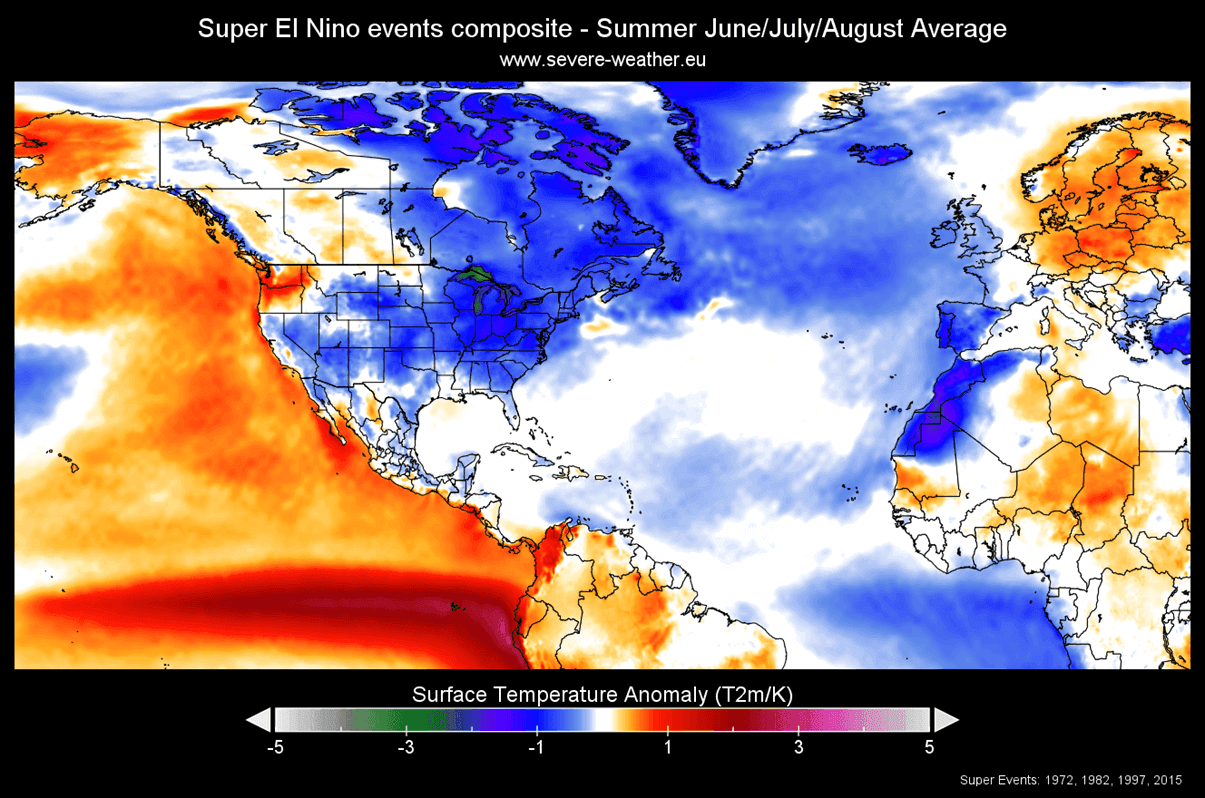
Below is the meteorological Summer reanalysis for the Super El Niño years. The reanalysis of past such years shows a tendency for a low-pressure area somewhere over the eastern United States or eastern Canada, and somewhere along the west coast of Europe and the North Atlantic.
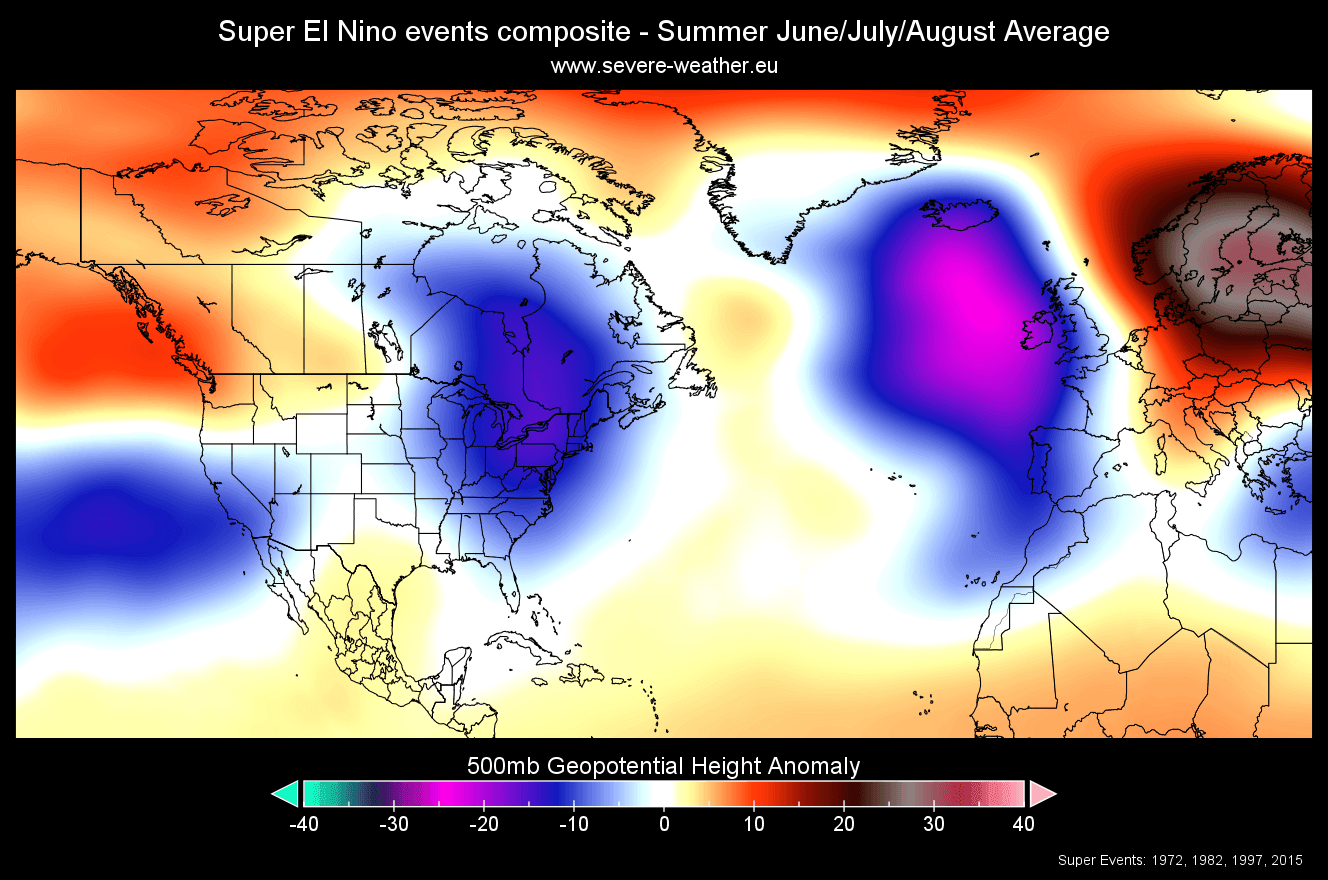
A low-pressure area over the eastern U.S. or eastern Canada supports a more northerly flow, which means more controlled summer temperatures. You can also see a low-pressure tendency over the southwestern United States, which is driven by the stronger subtropical jet stream with the El Niño.
If we look at the latest long-range pressure forecast for Summer (June-August), you can actually see a very similar pressure pattern to that in the Super El Niño seasons above. A low-pressure area is forecast over eastern Canada and over the Azores.
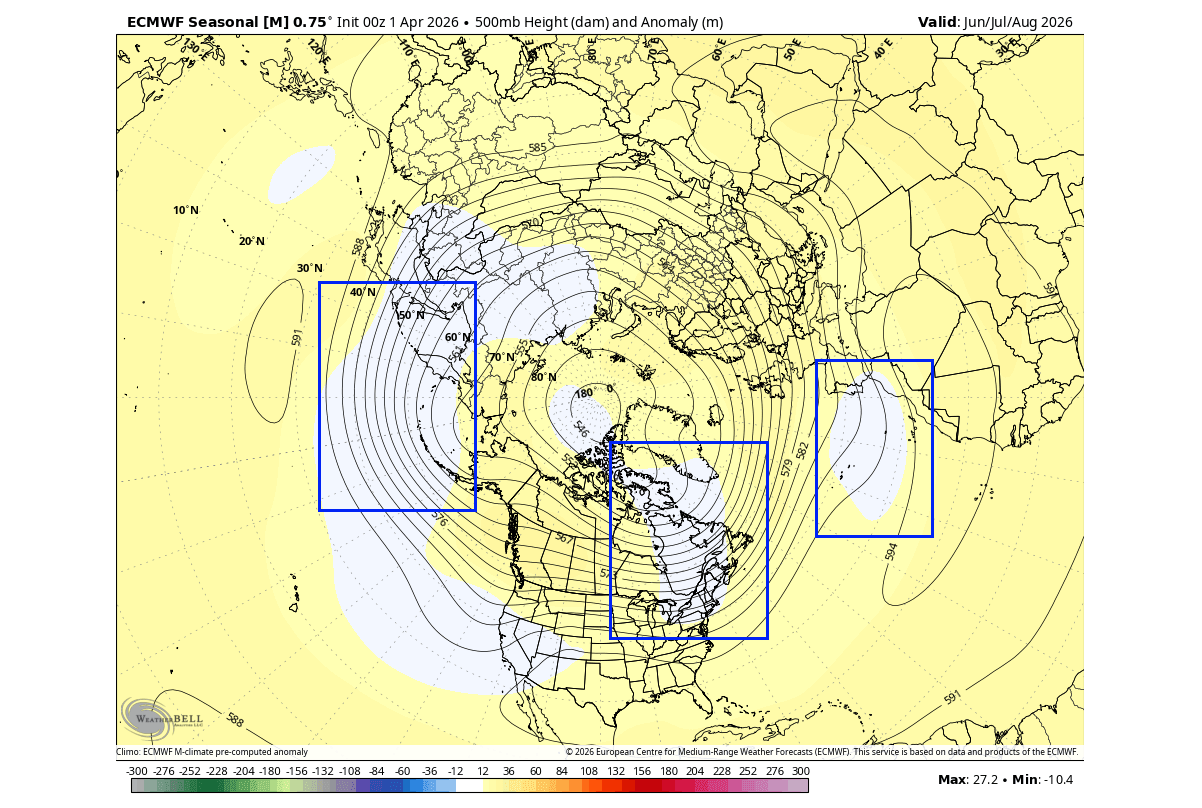
This indicates that the atmosphere is likely to undergo a similar development to that in those years. But since each year has its own specific conditions, we are just looking at large-scale trends.
Looking at temperatures from the past super events, you can see a below-normal trend over the northern, central, and eastern United States and eastern Canada. Warmer temperatures are found over the Pacific Northwest and over a large part of central and northern Europe. But note the below-normal trend in the western parts of Europe.
If we look below at the very latest long-range Summer temperature forecast, we can actually see the normal temperature area over the northern and northeastern United States, and over much of central and eastern Canada. This coincides with the trends of the past data, indicating the presence of the background (El Niño emergent) forcing.
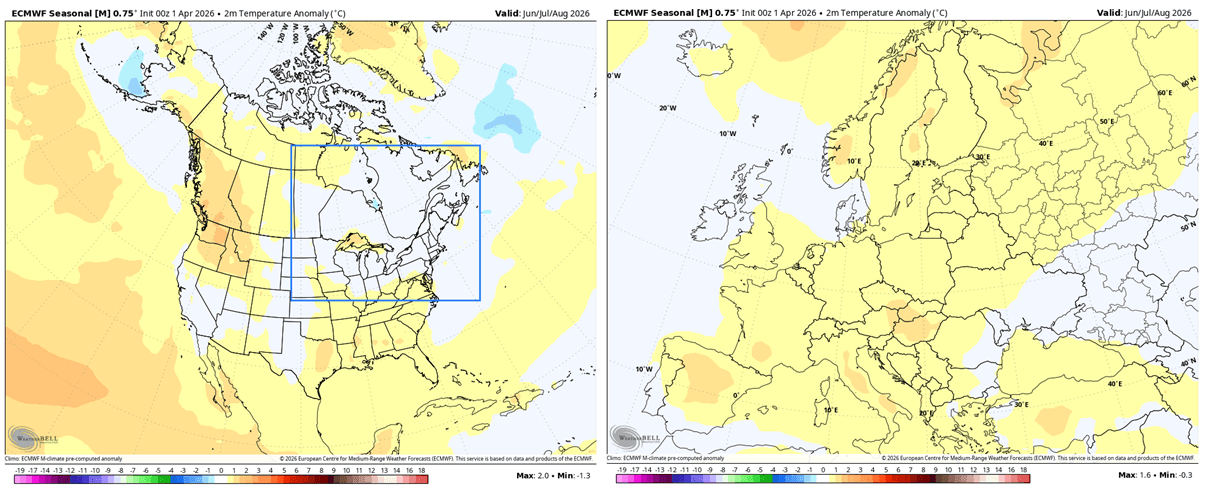
Above-normal temperatures are forecast for Summer 2026 over the northwestern and southern United States and far western Canada, very similar to the data for past events. But across Europe, we see the whole mainland forecast with above-normal temperatures for Summer as a whole.
This is normal, since Europe is not usually affected by the first direct impacts, as it’s farther from the ENSO source region. There are also local factors that affect the weather, such as the North Atlantic pressure patterns.
But while we have Summer in the Northern Hemisphere, there is Winter in the Southern Hemisphere. The obvious case for El Niño impacts is Australia, seen in the image below by ARC, during its Winter-Spring season and weather impacts during an El Niño event.
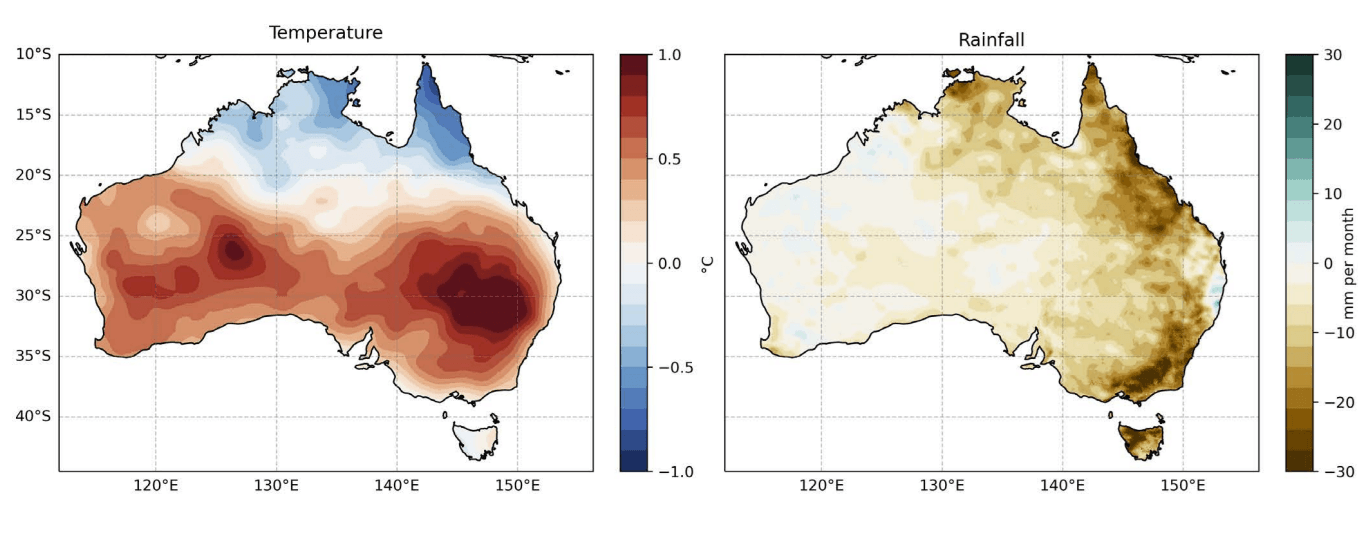
You can see that an El Niño event leads to a much drier season in Australia, increasing drought risk across the northern and eastern parts of the continent. Also, we can see warmer-than-normal Winter-Spring temperatures across the southern half, while below-normal temperatures prevail in the northern half.
Overall, these images and data show what we can expect in the coming months, as a strong El Niño event emerges and disrupts global weather patterns.
Speaking of global impacts, one that is not often discussed is crop yield. The image below shows the significant impact of El Niño on crop yields and food production, driven by its global changes in pressure and rainfall patterns. Image by NASA-Science
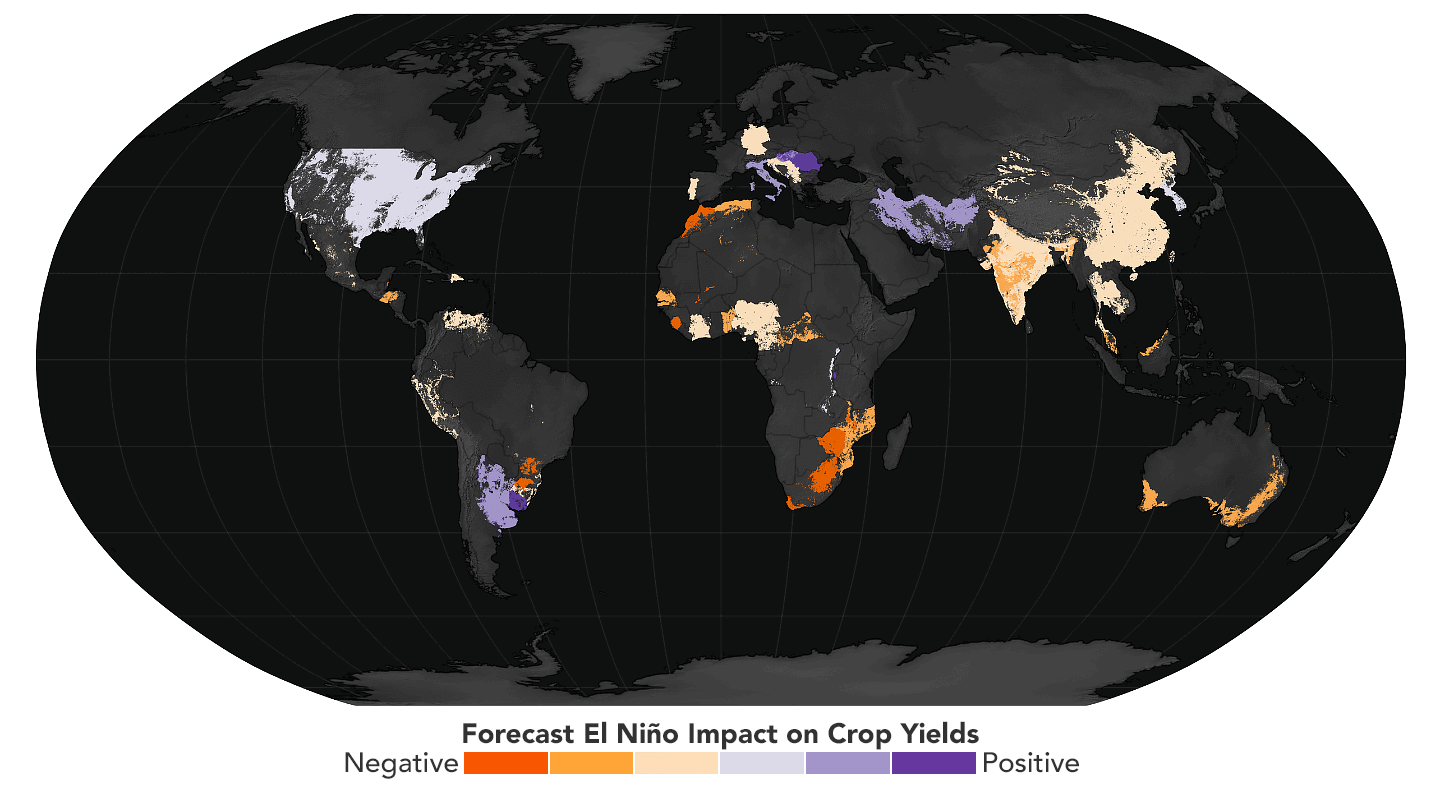
While many areas show a strongly negative impact on food production, such as South Africa, Australia, and India, some areas do benefit from El Niño. What stands out is that a large part of the United States shows a slight to moderate positive impact on crop yields and food production.
But as we go deeper into the year, El Niño will get stronger. And one of the well-known impacts of El Niño occurs during the Atlantic Hurricane season, resulting from the changes it makes to atmospheric circulation.
The Atlantic Barrier: How can El Niño Suppress the 2026 Hurricane Season
Based on many studies, the El Niño event is well known to reduce the number of Hurricanes and tropical systems in the Atlantic. This is because El Niño brings higher pressure over the Atlantic, stronger wind shear, and a more stable atmosphere, preventing storms from organizing and developing into large systems.
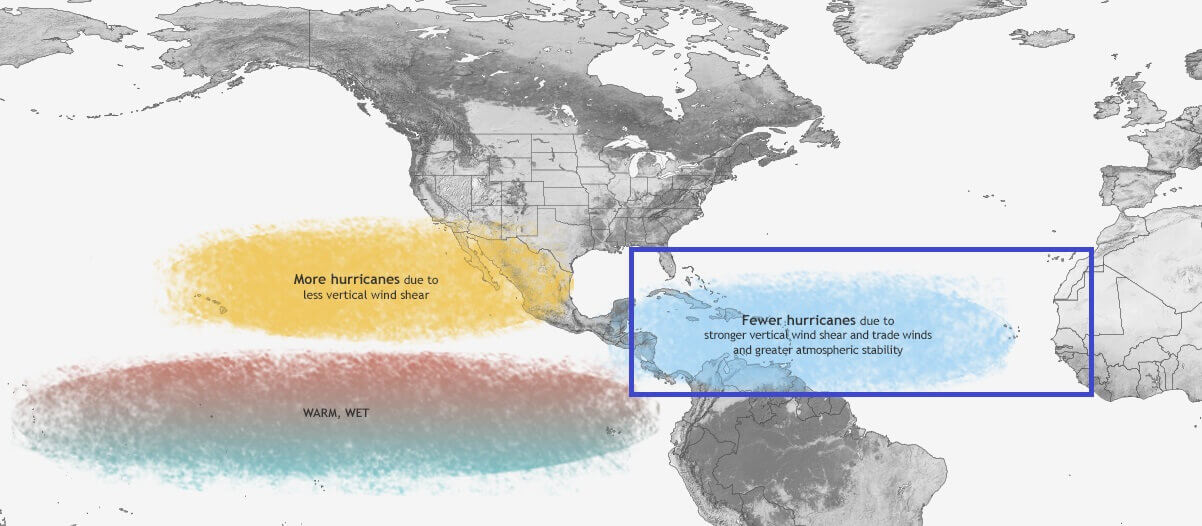
This means fewer tropical storms and/or weaker systems. So, an El Niño can greatly reduce the chance of strong hurricanes impacting the United States.
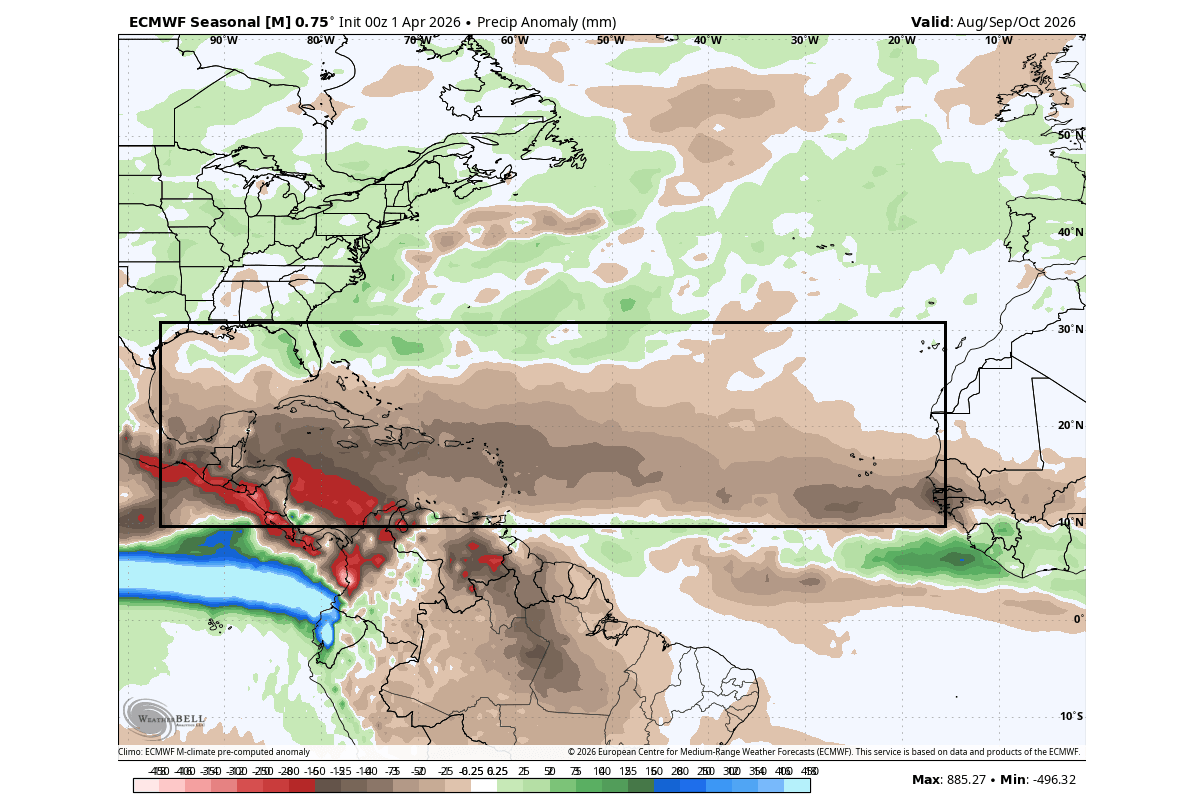
Below is the latest long-range precipitation forecast for the 2026 Hurricane season, and it shows drier conditions in the main development region (MDR). This indicates well below-normal tropical activity and a lower chance of a major hurricane making landfall along the southern and eastern U.S. coast.
The next forecast below is interesting because it’s an analog system based on past data. It looks at predicted ocean anomalies, identifies similar past years, and generates the forecast based on the activity in those years. Overall, you can see a very quiet (below normal) Hurricane season, with some storms near the United States East Coast but staying out. Image by TropicalTidbits
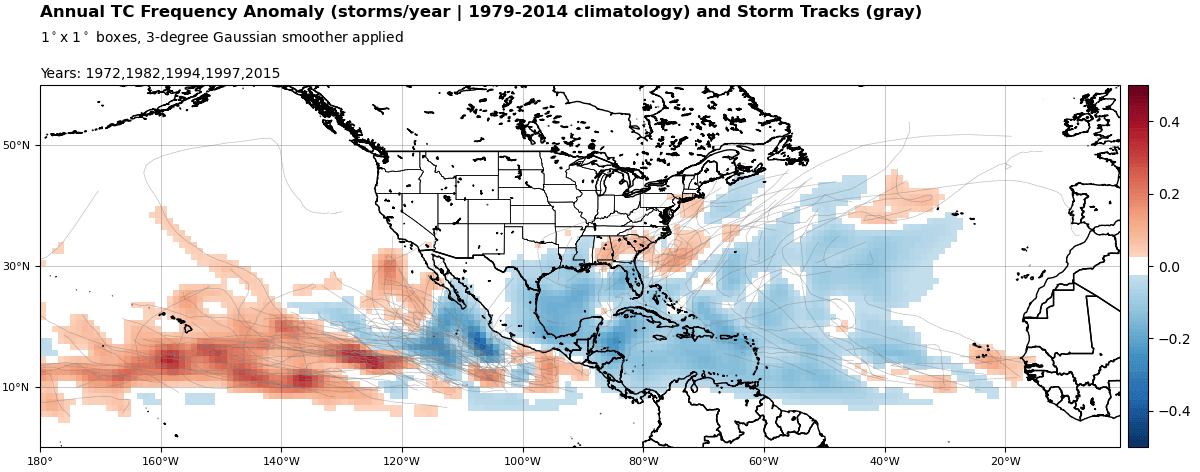
You can see the selected past years, and 4 out of 5 selected years are Super El Niño events. This shows that the forecasting system does recognize the ocean forecast as reaching into the Super event category.
El Niño makes it much harder for storms to organize properly and grow into large systems. But even in the calmest of seasons, we still see some tropical storm activity, even during the strongest El Niños. So while the El Niño acts as a natural “shield” for the U.S. coasts, we still have to monitor every potential system.
After the Hurricane season and Fall, we enter Winter, which is where the main impact of El Niño usually occurs.
The 2026/2027 Predictions: A Super El Niño Winter Footprint
During an average El Niño winter season, there is typically a strong and persistent low-pressure area in the North Pacific. That pushes the polar jet stream further north, bringing warmer-than-normal temperatures to the northern United States and western Canada.
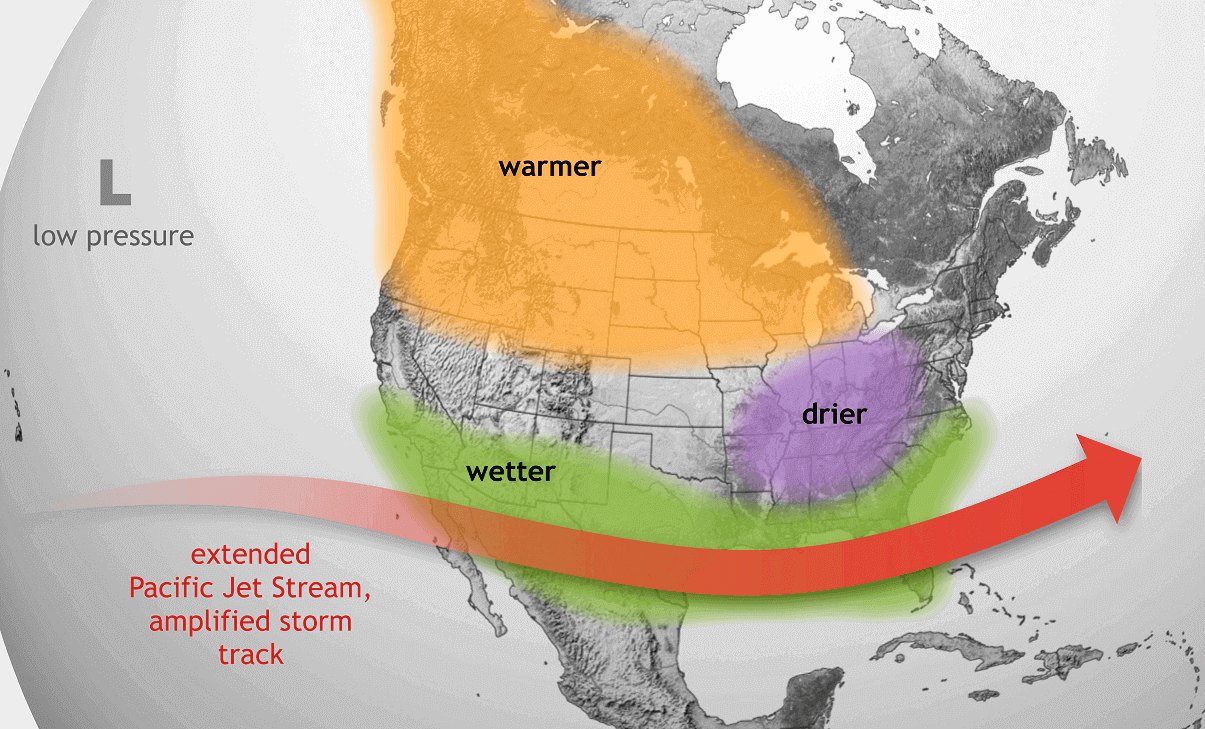
At the same time, the southerly Pacific jet stream gets amplified during an El Niño. That means more low-pressure systems and storms over the southern half of the United States, with more precipitation and cooler weather.
An El Niño event also significantly alters snowfall patterns. Below is a snowfall analysis of all recent Super El Niño winters, combining their data to produce an average snowfall pattern for such winters. You can see increased snowfall in the western and southern United States during a Super El Niño, as well as over parts of the Southeast.
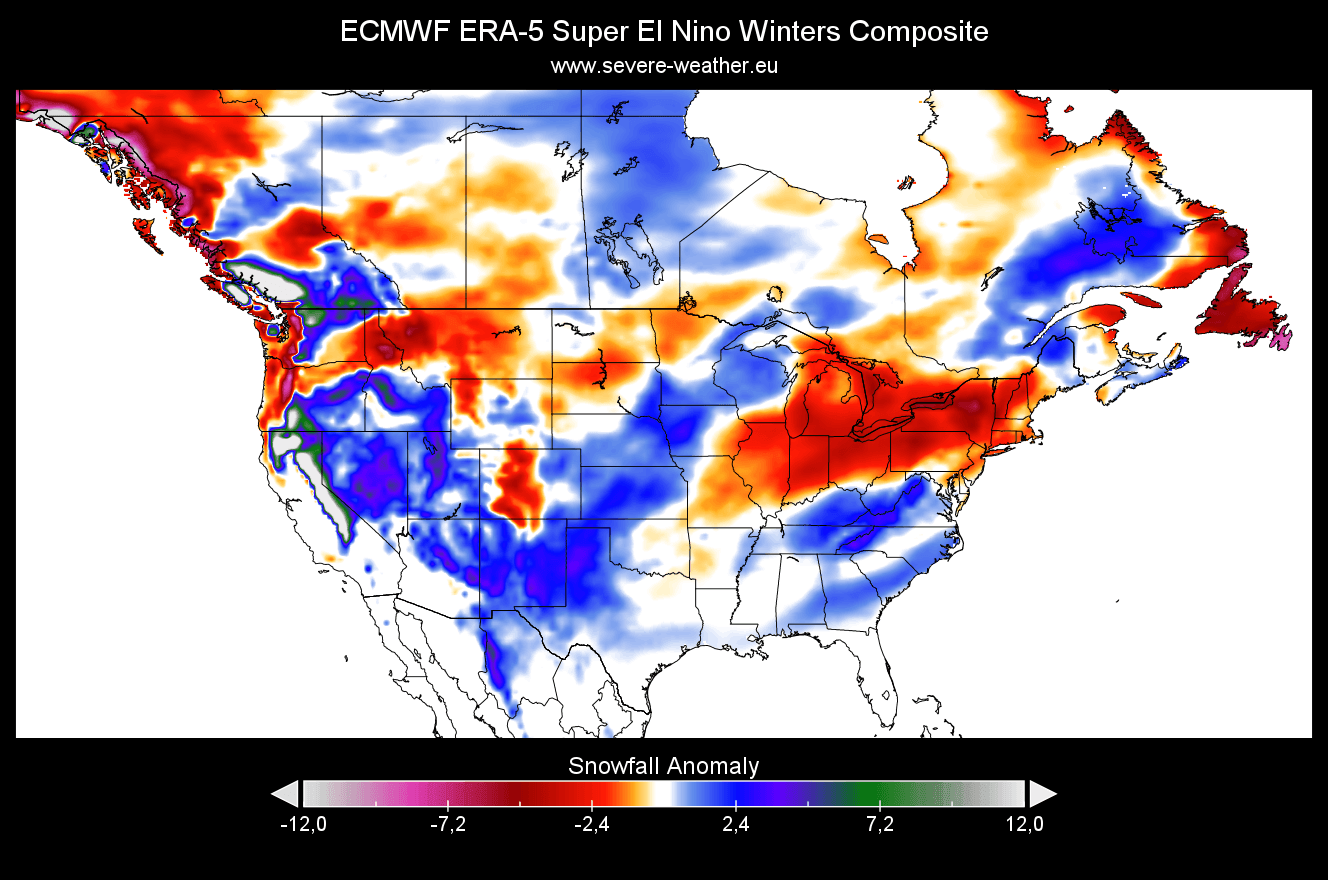
We can also see increased snowfall in the belt from the central Plains up towards the upper Midwest. But there was less snowfall around the Great Lakes, over the northern U.S., and towards the Northeast. Canada shows a more sporadic pattern, with more snowfall in the southeastern and south-central parts.
This is because low-pressure systems are trailing across the southern United States during an El Niño. The chances of snowfall increase in the southern half of the country and towards the east, but only if enough cold air is available.
Europe also feels the impact of an El Niño in winter. But, as mentioned above, the impact here is buffered by North Atlantic pressure anomalies and patterns.
Looking at the snowfall anomaly for Europe, Super El Niño years show reduced snowfall across much of the continent. More snowfall was measured in the far north and in some central areas. This is likely due to the low-pressure area near western Europe, driving a more southerly flow across the continent.
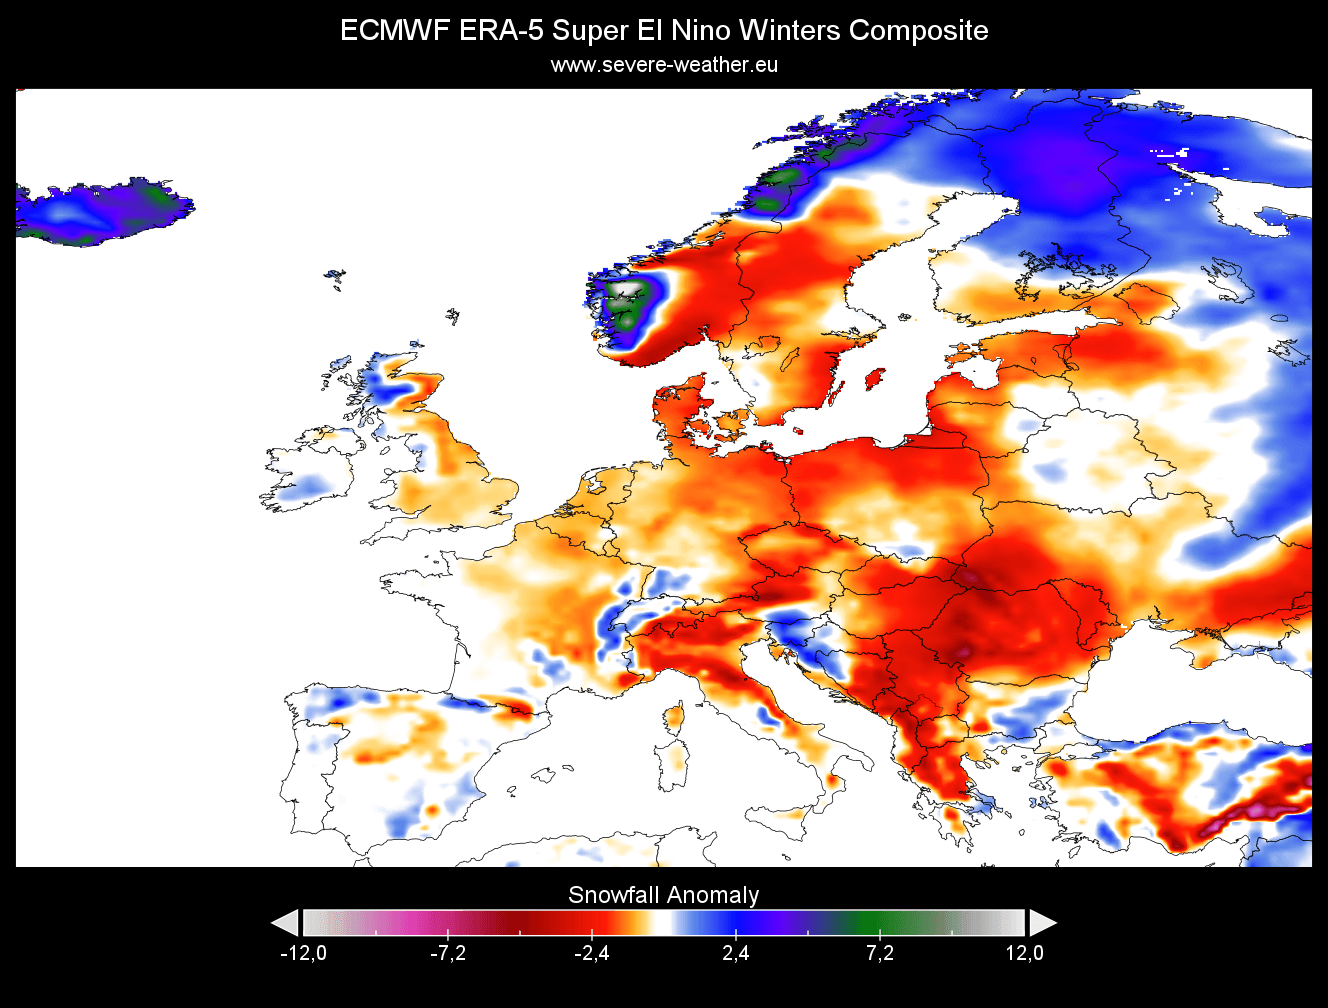
We do have to consider that Europe is usually not directly under El Niño’s influence, but can still feel global changes that affect weather patterns across the whole Northern Hemisphere.
Forecast and analysis images in this article are from cyclonicwx.com and WeatherBell, using a commercial license, unless specified otherwise.
We will keep you updated on global weather development and long-range outlooks, so bookmark our page. Also, if you have seen this article in the Google App (Discover) feed, click the like (♥) button to see more of our forecasts and our latest articles on weather and nature in general.
Don’t miss: