Winter season is passing by, but winter weather can persist well into the official Spring season. So what will the coming months offer regarding snowfall? First, we will look at the latest global drivers and then the snowfall predictions and trends from February into the first half of Spring across the United States, Canada, and Europe.
We will quickly look at the leading background drivers of global weather these past months. What does the latest analysis data show, and what influence does it play on temperature and snowfall patterns?
Then we will focus on global long-range weather forecasting systems. We will show you their snowfall predictions for the rest of Winter and the first half of Spring, revealing where the winter season might linger a bit longer.

GLOBAL WEATHER CONNECTIONS
A significant global weather factor in these past months was ENSO. This is a region of the equatorial Pacific Ocean that changes between warm and cold phases. Typically there is a phase change around every 1-3 years.
ENSO phases significantly influence tropical rainfall, pressure patterns, and the feedback between the ocean and the atmosphere. The image below shows the circulation pattern of a cold phase (currently active) and its ocean-atmosphere connection.

This way, the ENSO impacts tropical rainfall and pressure patterns, changing the atmosphere-ocean feedback system. In addition, the ENSO influence is spread globally through this feedback system, creating a strong change in temperature and snowfall patterns across both hemispheres.
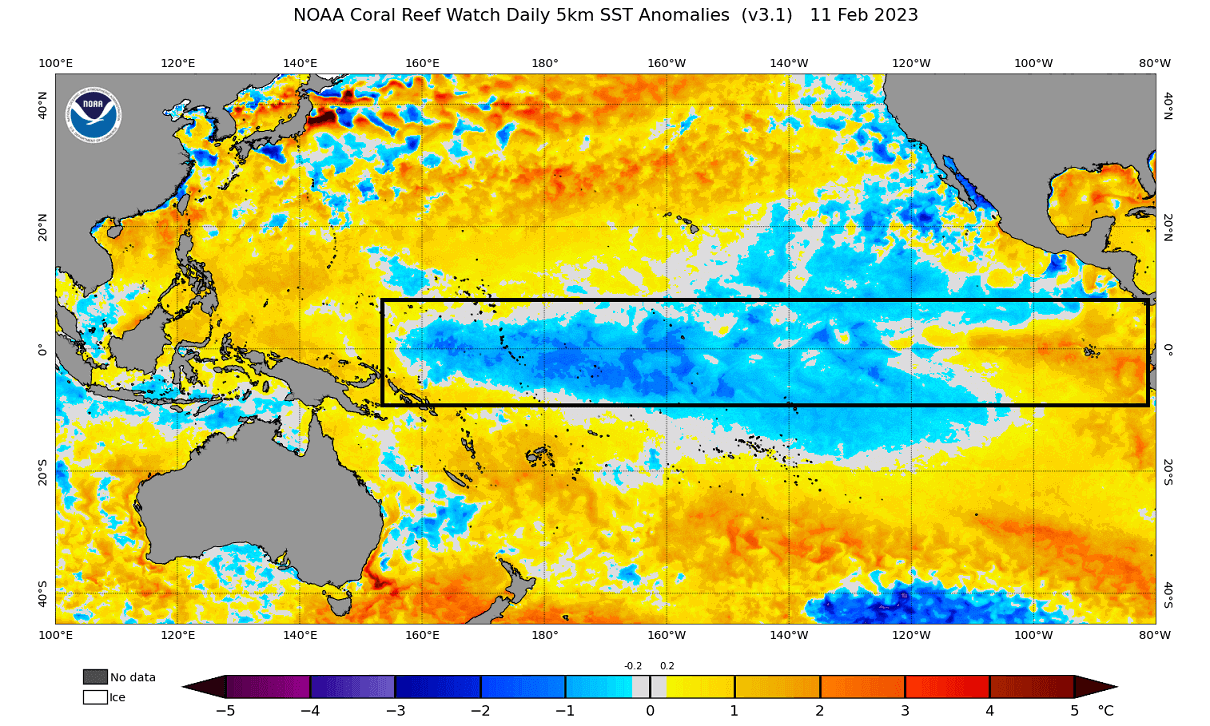
In the image below, you can see the recent ocean temperature anomaly across the equatorial Pacific. You can see colder than normal surface waters in the tropical Pacific regions. That is a La Nina event, which is currently weakening. You can see that on its far eastern side, where the cold anomalies are already replaced by warmer waters.
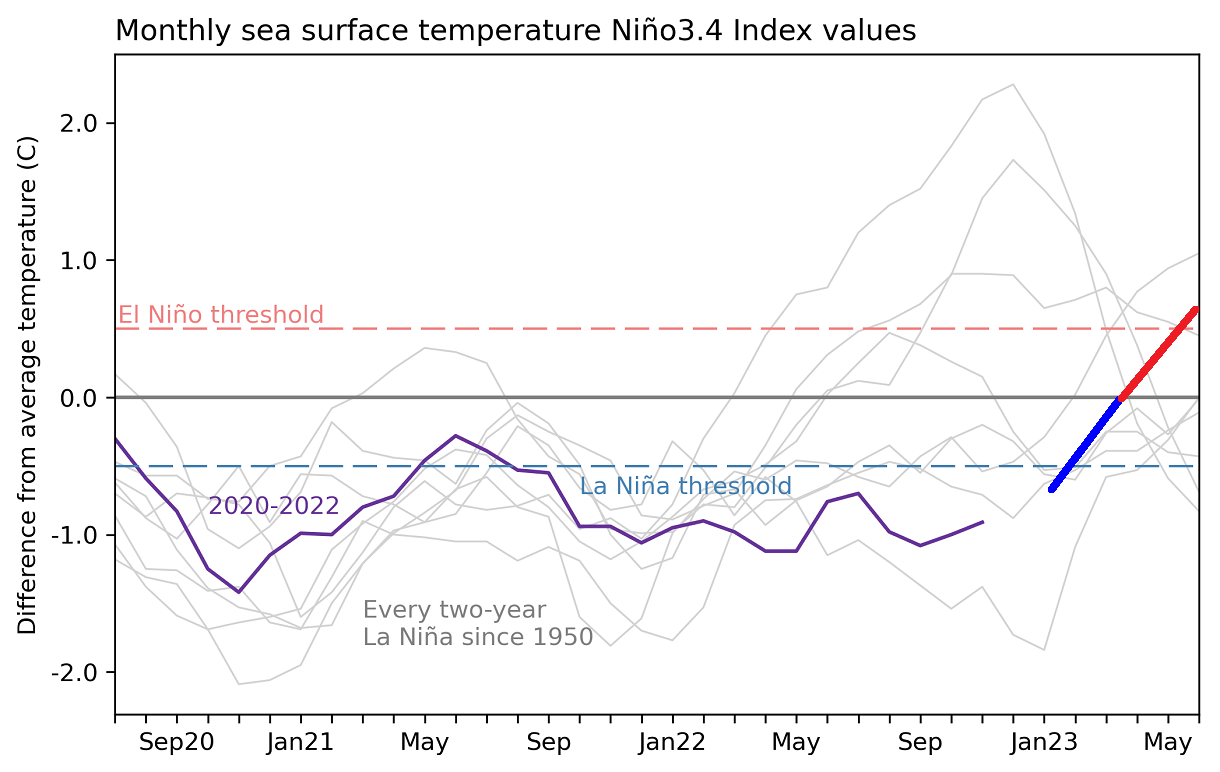
Below, you can see the progress of the ENSO temperature in the last two years. It shows that we are now ending a moderate negative phase that lasted for a prolonged period. Based on the latest forecast data, this is the final cold phase for at least the next two years.
Speaking of the forecast data, we will quickly look at the latest ENSO trends.
ENSO SEASONAL OUTLOOK
Below we have an Official NOAA CPC probability forecast graphic, which shows the long-range forecast of the central ENSO region. The cold La Nina conditions are forecast to decay quickly as we enter Spring. In addition, going deeper into 2023, you can see an increased probability of a warm phase (El Nino) developing over the Summer and Fall 2023.

The still-lasting La Nina conditions will transfer the atmospheric impacts into at least the early Spring. In many cases, the atmospheric conditions can last slightly longer than the ocean anomalies.
To better understand the ocean changes across the ENSO regions, we produced a video showing the La Nina anomalies from Summer into Fall.
The video below shows the developing cold ocean anomalies in the equatorial Pacific, boosted by the strong easterly trade winds. It shows how ocean surface anomalies evolve over a certain period in the ENSO regions.
We will take a closer look at the weather effects that La Nina usually shows over North America, which is under a more direct influence.
Europe is not known to have any specific/direct influences, as it is too far from the source regions. But that does not mean it has no impact.
La Nina does change the weather globally, but apart from the direct influence over North America, places like Europe have many other factors in circulation before any La Nina influence can spread this far.
NORTH AMERICA WINTER PATTERNS
Typically, the first influence of these ocean anomalies can be seen in the jet stream changes. The jet stream is a large and powerful stream of air (wind) at around 8-11km (5-7mi) altitude.
Historically, a strong blocking high-pressure system in the North Pacific is the most typical effect of a cold ENSO phase. That tends to redirect the polar jet stream down over the northern United States, with the cold air following the same path.
The image below shows the average pressure pattern in several La Nina seasons from February to April. You can see a strong high-pressure system in the North Pacific and a low-pressure area over western Canada and the northern United States. Images by NOAA Physical Science Laboratory.
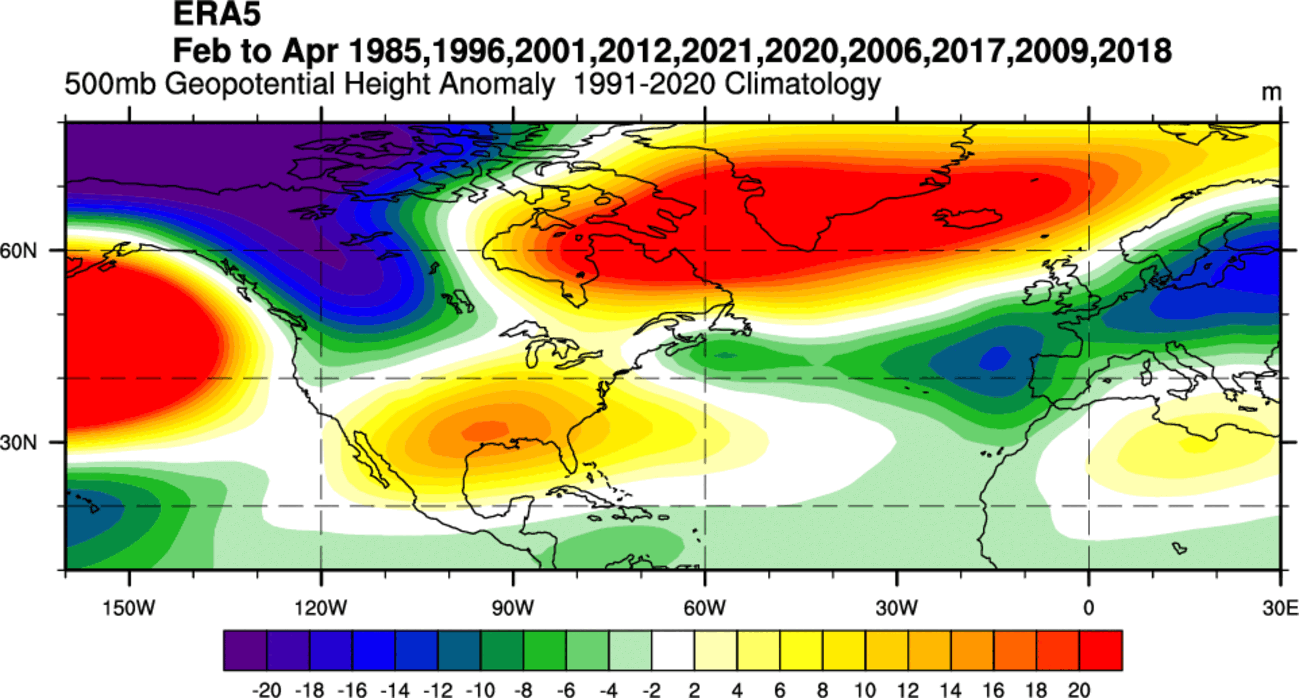
The circulation of the strong high-pressure system promotes the development of a low-pressure region over Canada. That relocates the jet stream downwards between the two strong pressure systems, marked above by the blue lines.
You can also see a high-pressure system over Greenland and the North Atlantic. That would produce a colder pattern over Europe. But that is more of a seasonal variability than a pure La Nina effect.
Looking at the temperature analysis for the same years, we can see a cold anomaly following the jet stream from western Canada into the northwestern United States. But the southeast ridge keeps warm anomalies over the southern and eastern United States.
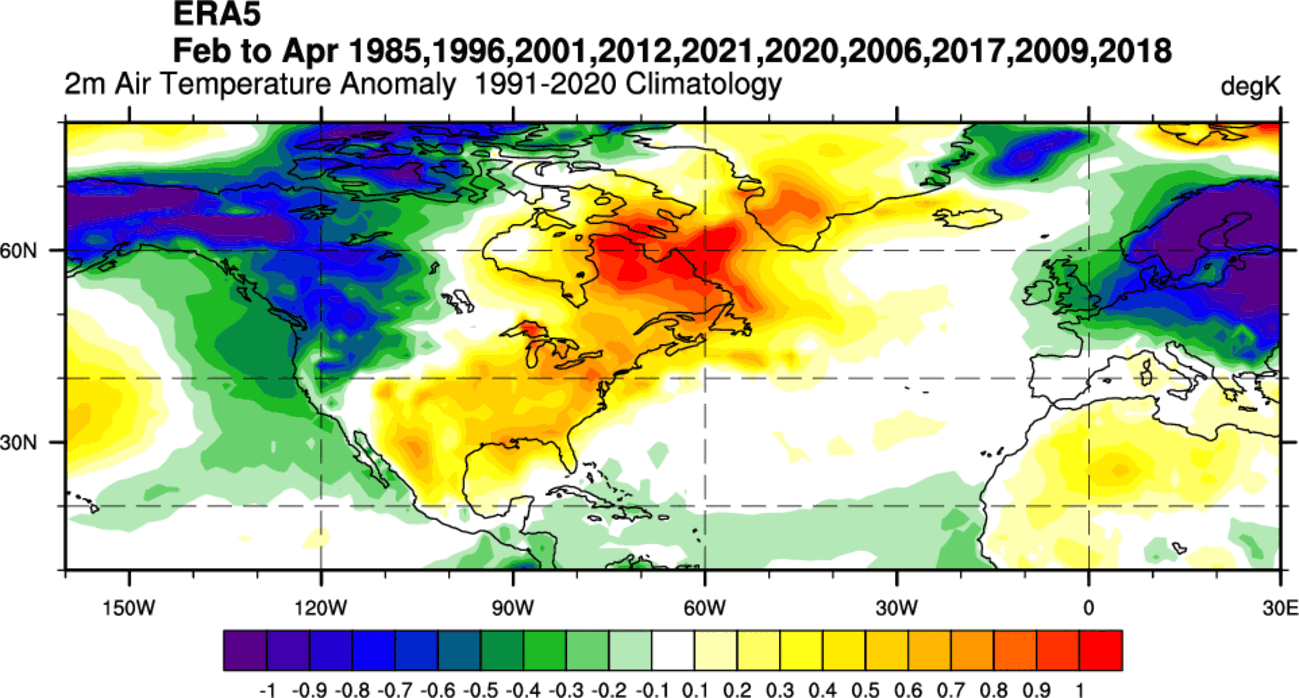
The most dynamic weather tends to occur between the warm and cold anomalies in the Midwest and the central United States. In addition, we can see strong cold anomalies in Europe, but this signal is less related to La Nina specifically, unlike in North America.
Precipitation-wise, La Nina seasons are usually drier over the southwestern United States. Drier conditions are also seen below in the northeastern United States. More precipitation can be seen over the central United States, the Great Lakes, and Canada.

Again, for Europe, we see a signal for more precipitation. But this results from a strong Greenland blocking anomaly in the historical average and is not necessarily a pure La Nina signal.
You can see the La Nina jet stream redirection in the image below. It shows the average jet stream position and the resulting weather patterns over the United States and Canada in cold-ENSO seasons.

The displaced jet stream brings colder temperatures and winter storms from the polar regions down into the northern and northwestern United States. Warmer and drier winter weather prevails over the southern states.
But what does that mean for snowfall potential? Of course, any change in the jet stream also changes the snowfall patterns over North America. The pressure systems can take a different path along with the cold air required for snowfall.
The colder air is more easily accessible to the northern United States, which increases the snowfall potential if enough moisture is available. The graphic below by NOAA Climate shows the average snowfall pattern for weak/moderate La Nina years in the October to April season.

Besides the northwestern United States and the Midwest, we can see more snowfall potential over the northeastern United States and eastern Canada.
We will look at snowfall predictions for mid-Winter and early Spring. Data is from the leading global long-range forecasting systems.
The format of this forecast is simple. We will look at the ECMWF and UKMO seasonal forecasting systems. We used the latest data available at present, released in January.
You will see the average snowfall forecast for the late Winter season and early Spring, covering the February-April period.
ECMWF SNOWFALL LATEST FORECAST
As always, we start with the ECMWF. It is the most often used and highly regarded seasonal forecasting system. The Copernicus-EU open project provides both the ECMWF and UKMO data.
In the February snowfall forecast, there is quite a strong negative anomaly over most of the continent. This shows the last winter month having less snowfall than normal over much of the continent, except for far northern Europe.

The March snowfall forecast shows no major improvement. However, we do see increased snowfall potential over the Alpine region. We can also see a positive snowfall anomaly over southern Ireland and parts of the United Kingdom.

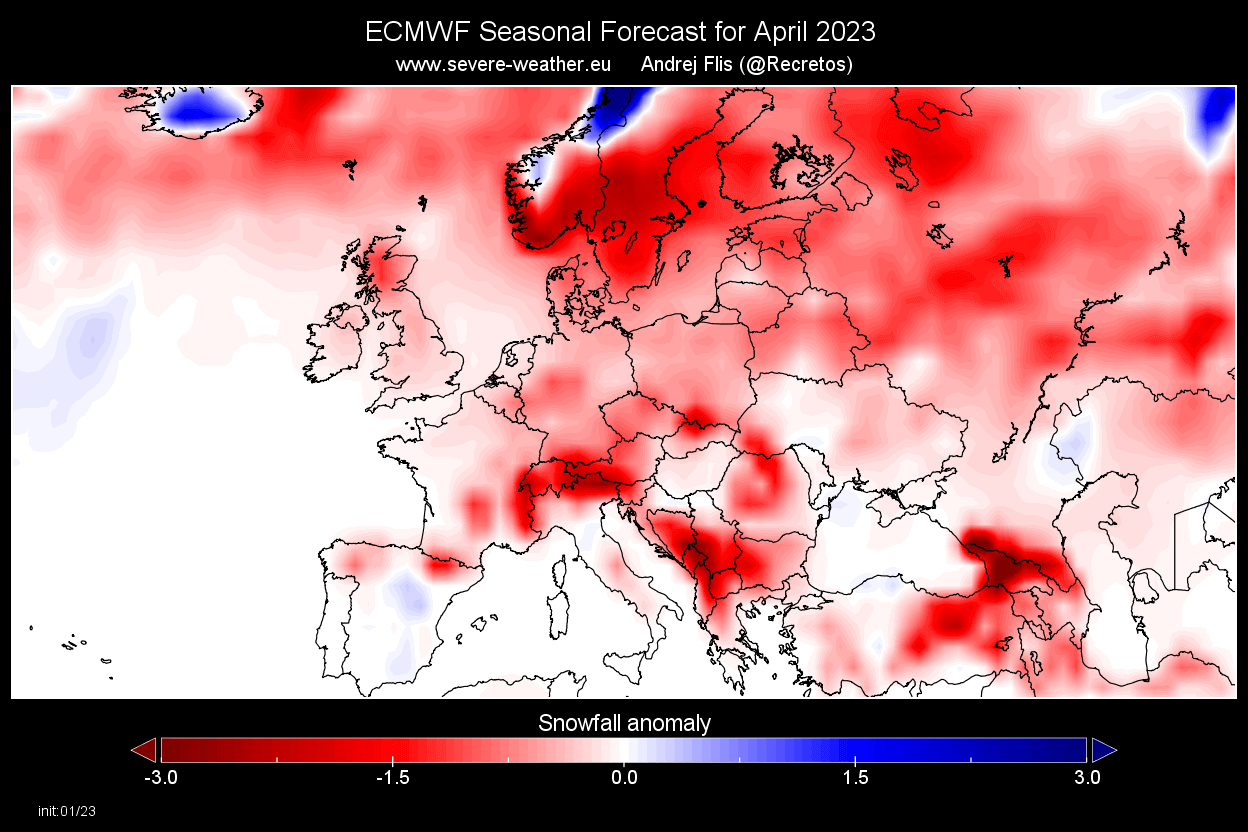
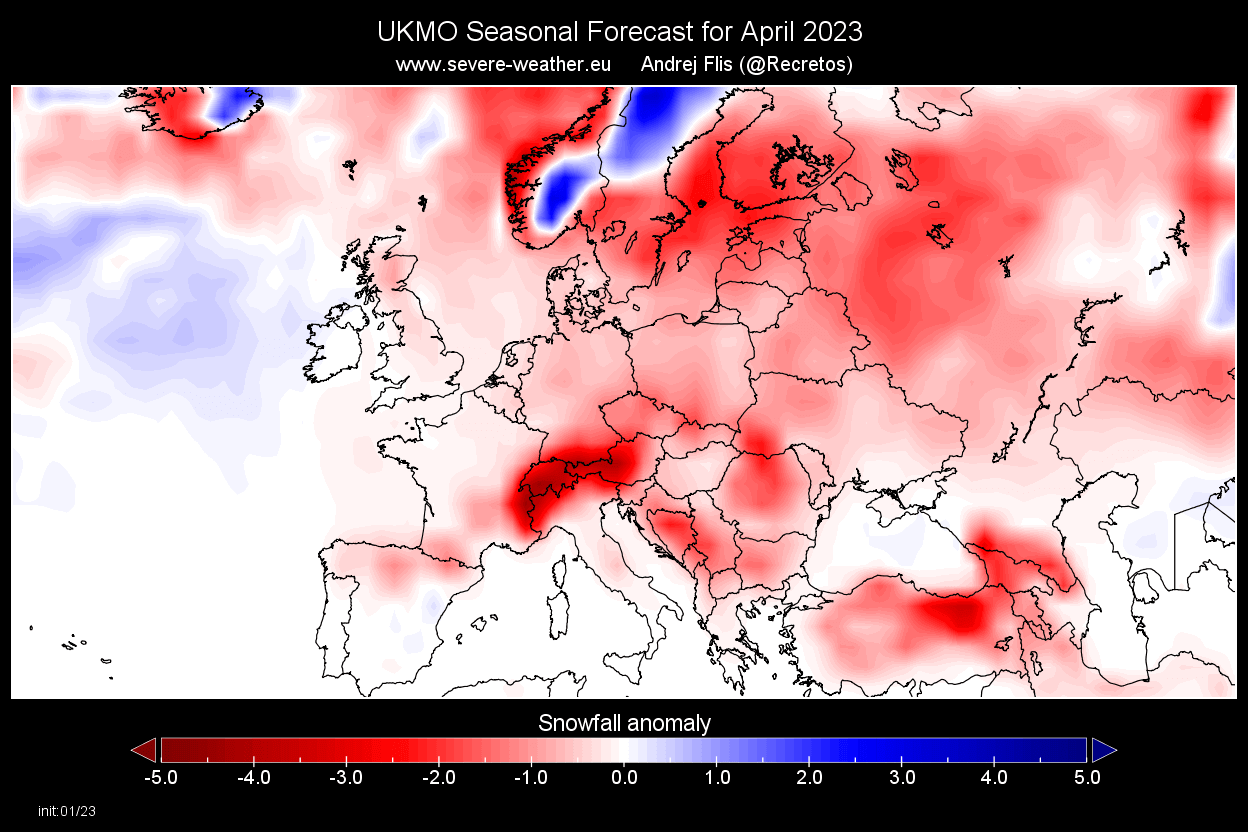
Looking at the April snowfall forecast data, we again see reduced snowfall potential over most of Europe. But in April, the snowfall potential is already low. For this reason, you need a strong pattern to have above-normal snowfall in April over much of central and southern Europe.
NORTH AMERICA ECMWF SNOWFALL FORECAST
Over North America, the spring snowfall season is usually more dynamic. Especially in Canada, we can have prolonged cold-air pooling. That means we can see late-season cold air outbreaks with snowfall in the United States, as the cold air is still available in the north.
The February snowfall forecast shows a pattern of more snowfall from western Canada into the western United States. We see a reduced snow potential over the Midwest and the northeastern United States. But parts of the central and eastern United States show more snowfall than usual, and also over southeastern Canada.

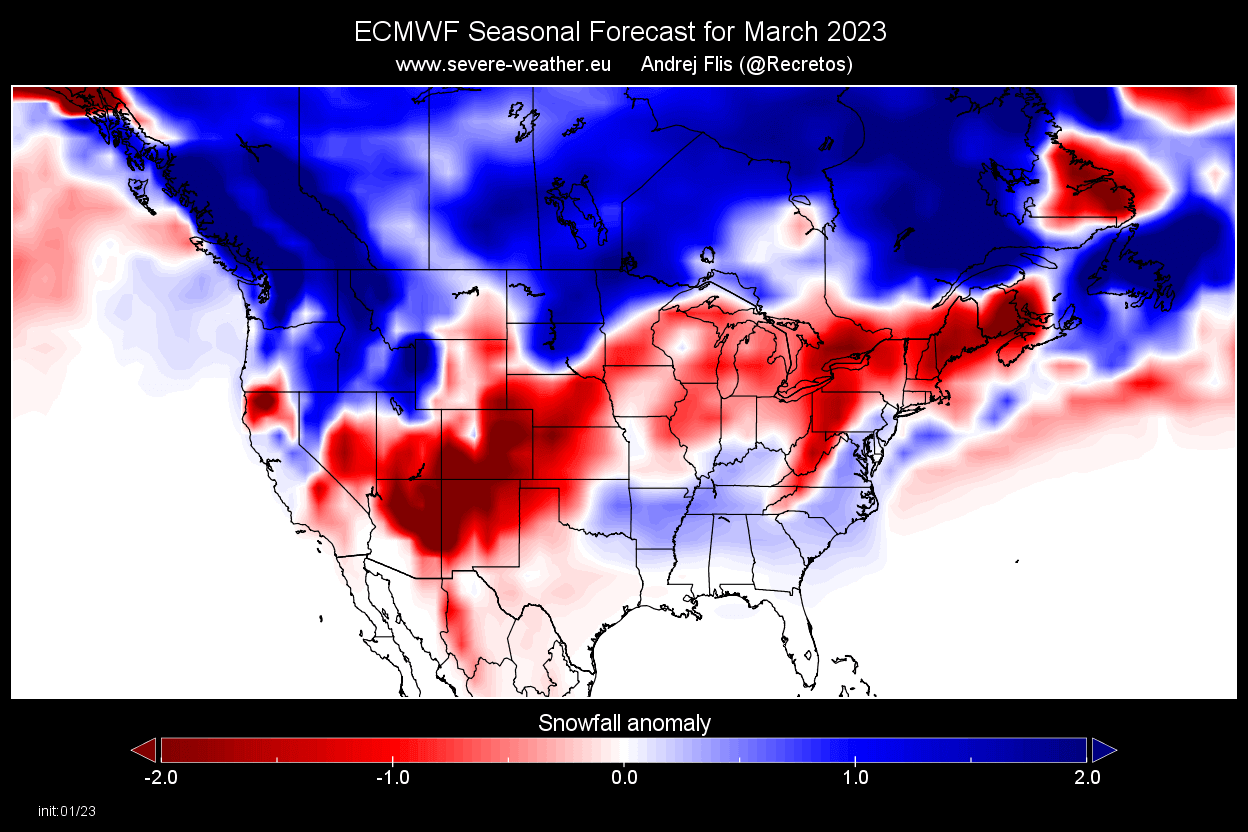
The March snowfall forecast shows continued snowfall potential over the northwestern United States and expanding over southern and eastern Canada. More snowfall is still forecast in the upper Midwest and also for parts of the southeast. Less snowfall is forecast in a belt from the southwestern to the northeastern United States.
Now going deeper into Spring, we have the April snowfall forecast below. You can see more snowfall than average, covering an area from south-central Canada into the upper-Midwest and parts of the eastern United States. The western half of the United States and the northeast are forecast to see less snowfall this month.

UKMO SEASONAL SNOWFALL FORECAST
Long-range weather forecasting is not simple. There are a lot of factors that can impact seasonal climate. We always focus on trends and probabilities, but still, variation is critical. Therefore, the more forecast data you can look at, the better idea you can get about the expected weather patterns.
As you can never trust a single forecast model, we always have at least one other long-range forecasting system along the ECMWF. Here comes UKMO. It was developed by the United Kingdom Met Office, where the initials UKMO come from.
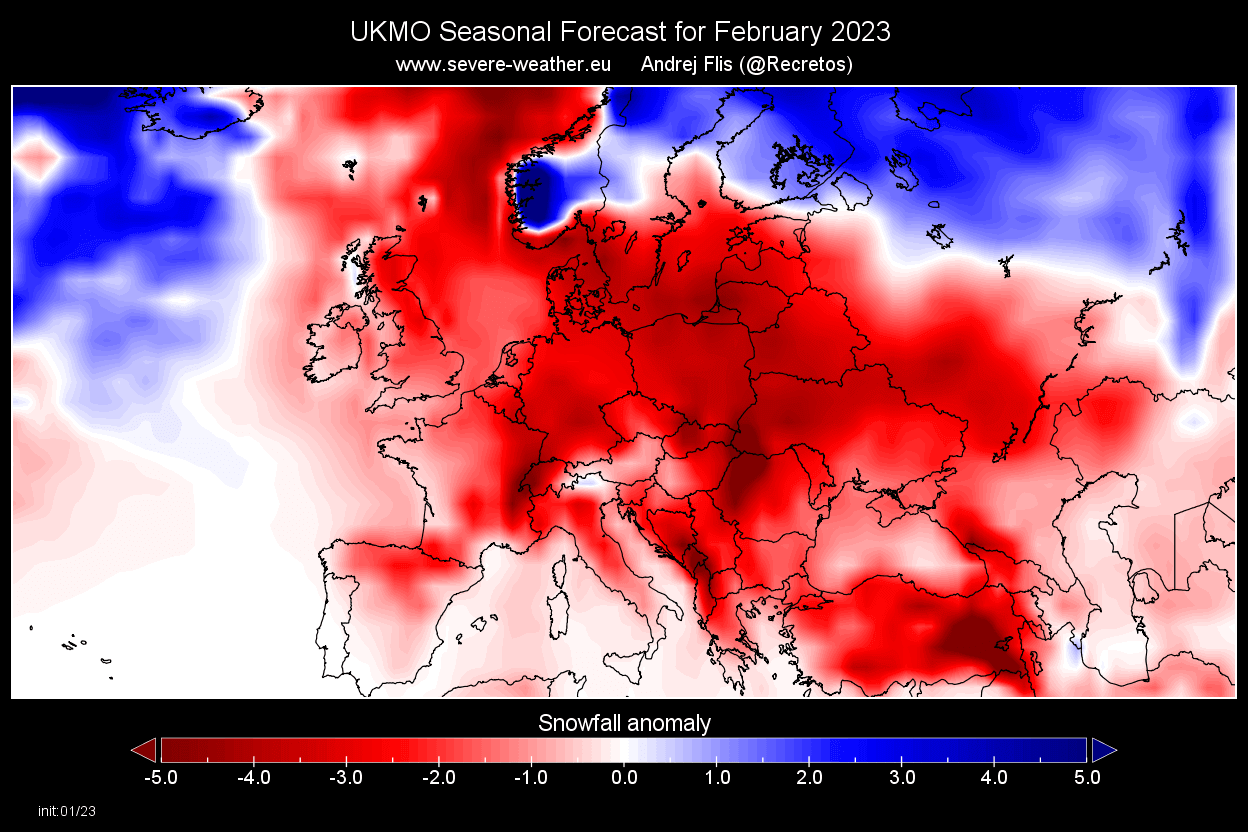
The February snowfall forecast shows more potential in far northern Europe, just like the ECMWF. The rest of the continent sees less snowfall than normal for this time of year.
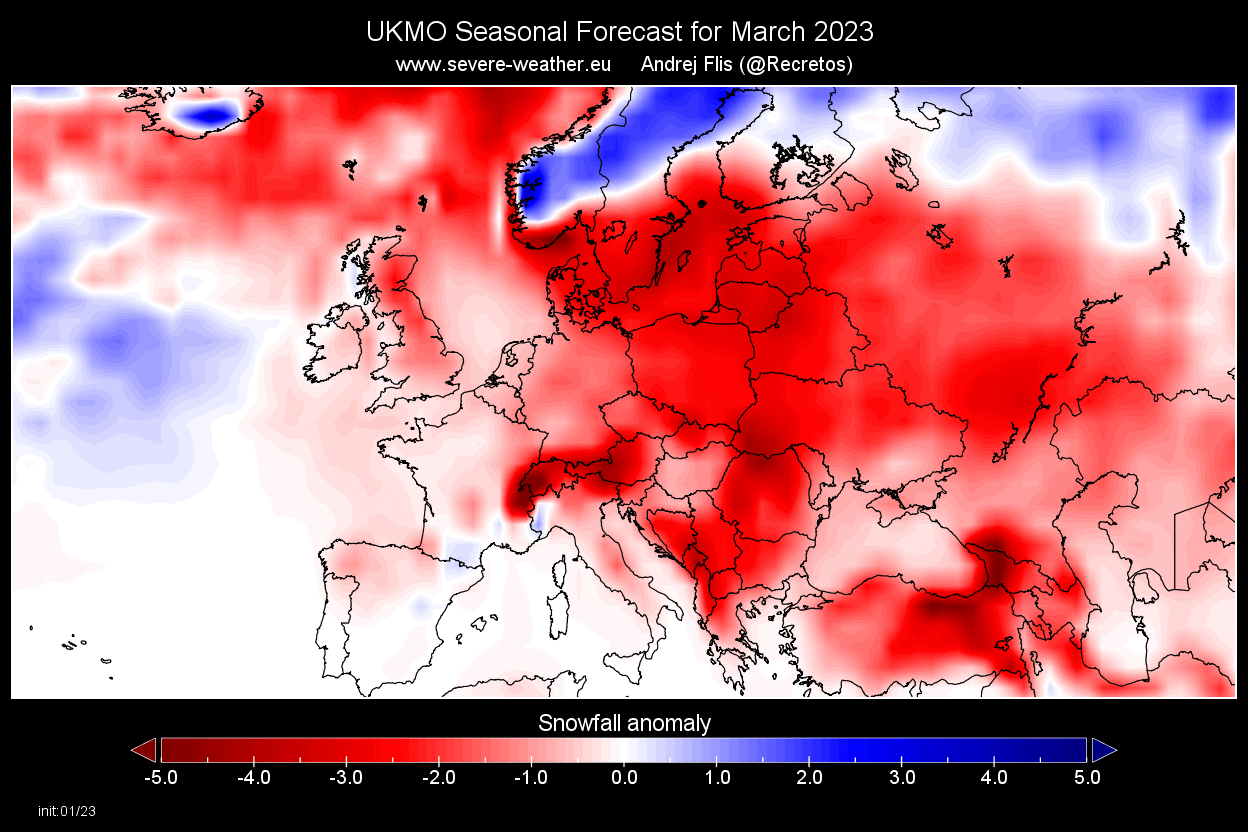
The March snowfall forecast indicates continued potential over the northern parts of Europe. But otherwise, the rest of the continent shows less snowfall this month. This month, the forecast differs from the ECMWF, showing no positive snowfall anomalies over southern Ireland or the United Kingdom.
Looking at April, there is no late-season surprise in the forecast. Likewise, early Spring shows no real snowfall potential in the UKMO outlook. But that does not mean we can’t see a cold outbreak or two in this period.
NORTH AMERICA UKMO SNOWFALL PREDICTIONS
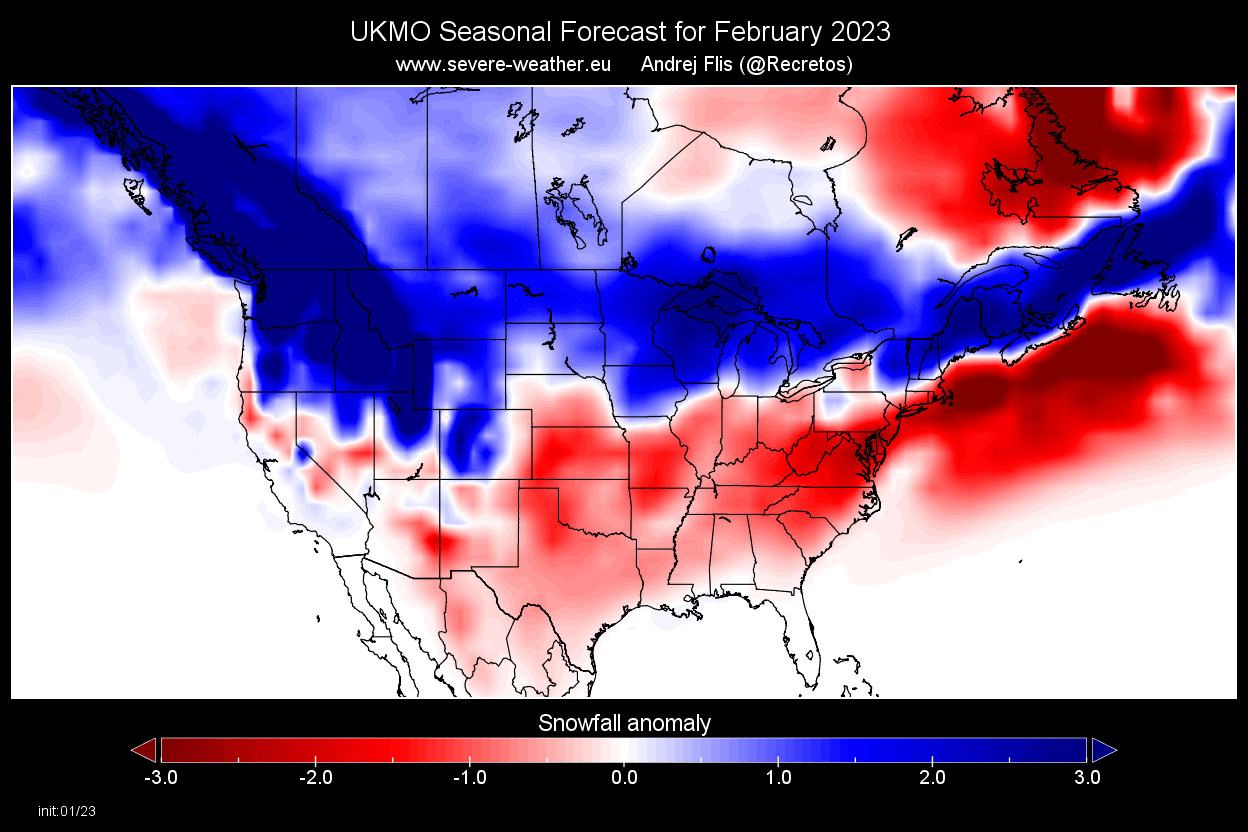
UKMO generally showed a more typical La Nina snowfall pattern in many previous forecasts. And the February-April forecast period is no different.
February snowfall forecast shows a typical La Nina pattern, with more snowfall over much of southern Canada and the northern parts of the United States. However, most of the southern half of the United States shows less snowfall than normal for February.
The March snowfall forecast shows increased snowfall potential continuing over the northwestern United States, upper Midwest, and northeastern United States. Most of the central and southern United States shows less snowfall than normal in this UKMO forecast.

The April snowfall forecast shows a decent snow season continuing over the northwestern United States and the upper Midwest. You can also see slightly increased snowfall potential over parts of the Ohio Valley and the far northeastern United States.

Overall, the UKMO shows a decent snow season across the northern parts of the United States, typical for a La Nina season.
NOAA OFFICIAL SEASONAL OUTLOOK
We can also monitor snowfall potential with temperature and precipitation patterns. The highest snowfall potential is usually in regions with colder temperatures and more precipitation.
Below is the official February-April temperature forecast for the United States by NOAA. It shows the temperature probability, with colder to equal chances in the northern United States. The southern half of the country and the northeast have a higher probability of warmer than normal weather.

The official precipitation forecast is also quite similar to the model forecast. We see an equal-to-higher probability for more precipitation in the northwestern United States, across the Ohio Valley, and around the Great Lakes. On the other hand, the southwestern United States is forecast to have a drier-than-normal spring season.

But there is one event that can significantly impact the Spring weather patterns.
SUDDEN STRATOSPHERIC WARMING
Below is the pressure and temperature forecast for the middle Stratosphere next week. You can see a strong stratospheric warming wave advancing across the Polar regions. The Polar Vortex is pushed out of the North Pole and is strongly weakened, with a reversed circulation.

This means that the stratospheric circulation is breaking down, changing the influence of the Stratosphere downward on the lower levels. This is called a Sudden Stratospheric Warming (SSW) event.
Looking at the vertical pressure anomalies below, you can see the marked forecast for mid-to-late February. Again, it shows high-pressure anomalies in the Stratosphere, associated with strong warming anomalies.
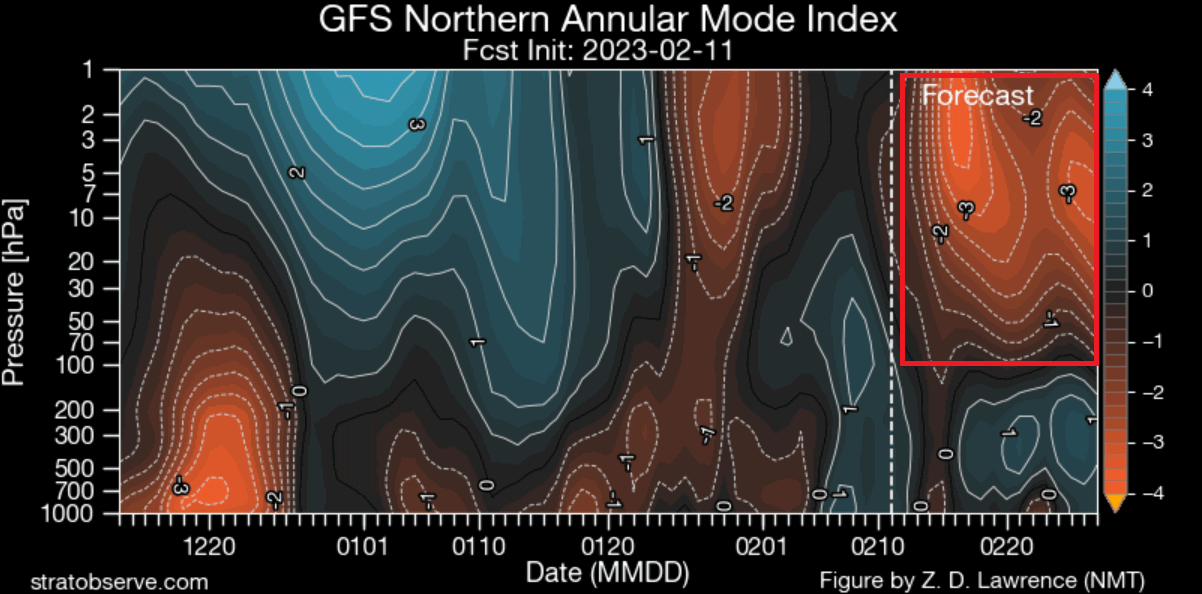
It is unknown how this will pan out exactly and how strong the post-SSW effects will be. But based on the first indications, we are likely dealing with a proper breakdown of the stratospheric circulation that can influence the weather in the early part of Spring.
Below is a special chart showing typical snowfall anomalies 0-30 days after a major stratospheric warming event. You can see above-average snowfall over much of the eastern United States and Europe. Again, this is an expected response after major stratospheric warming, as the colder air has an easier path towards the south and into these regions.
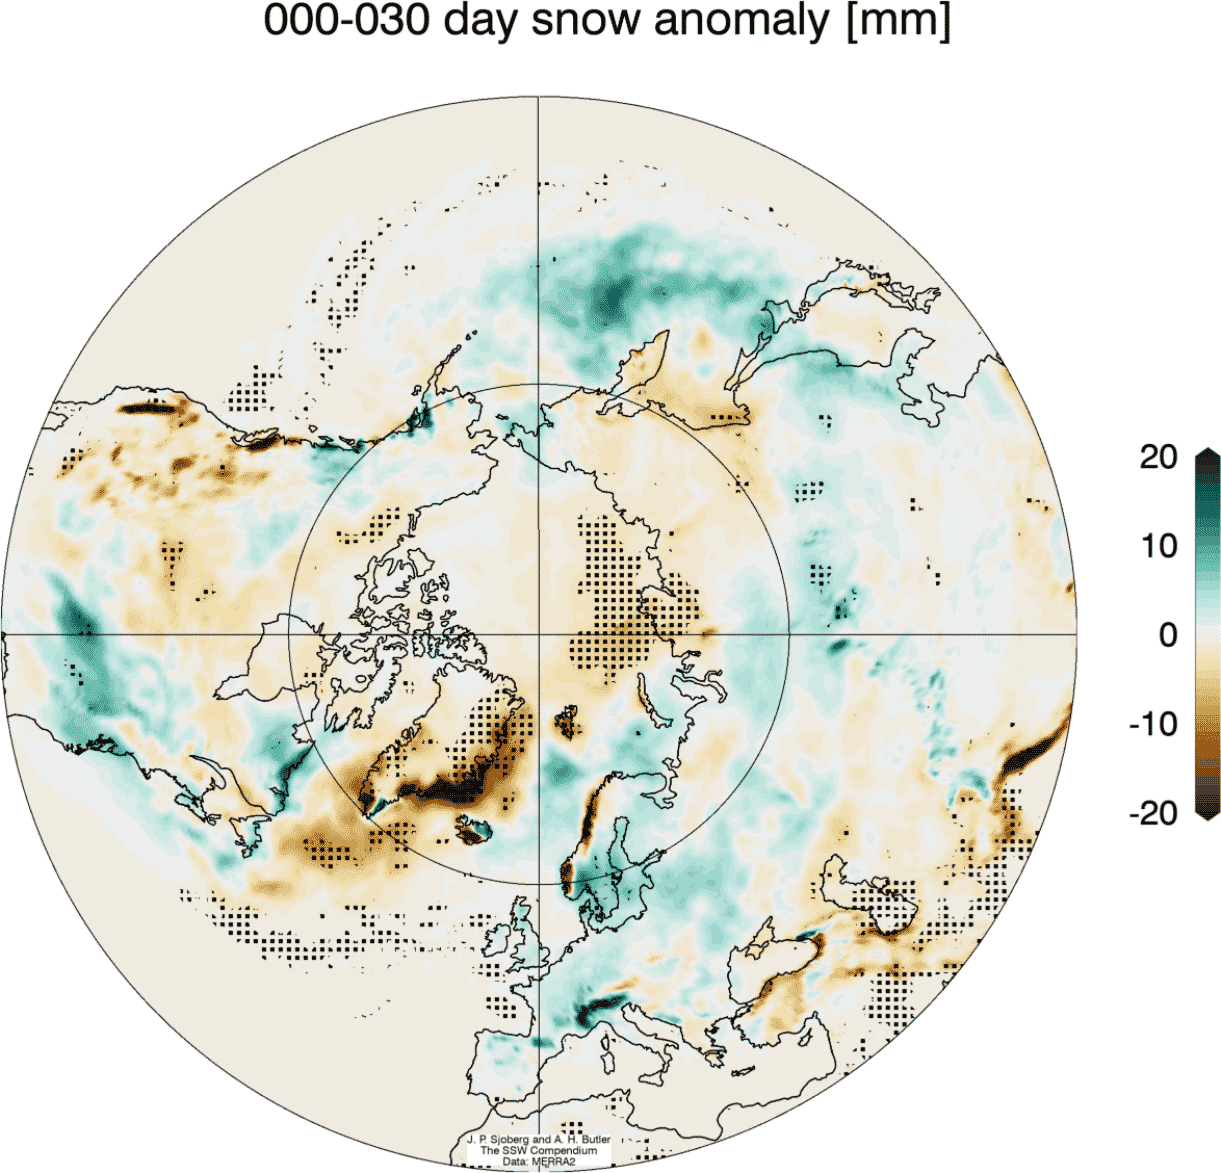
But, we must add that this is an average picture of many major stratospheric warming events. So not every event is the same, and a lot depends on the pre-existing weather patterns in the lower levels of the atmosphere.
Also, we will keep you updated on other developing weather trends, so bookmark our page. Also, if you have seen this article in the Google App (Discover) feed, click the like button (♥) there to see more of our forecasts and our latest articles on weather and nature in general.
Don’t miss our full breakdown of the upcoming Sudden Stratospheric Warming event: