La Niña has begun to break down rapidly across the tropical Pacific Ocean. Cold anomalies are now weakening from the west, but the atmospheric influence is forecast to persist through the early Spring season over North America and Europe. A transition into a new El Niño event is forecast by Fall, completely altering the weather patterns for the 2026/2027 Winter season.
The tropical Pacific has been dominated by a cold phase over the past months, but recent data confirms that a major collapse is underway. Driven by large-scale pressure shifts and the trade winds, this transition marks a major “reset” for the global weather system.
In this article, we analyze the latest oceanic anomalies and the subsurface warming currently eroding the cold pool. We will examine the latest 2026 long-range forecasts to see how these shifting signals will change the course of weather across North America and Europe.
ENSO: The Global Weather Engine
ENSO is short for “El Niño Southern Oscillation”. This is a region of the equatorial Pacific Ocean, changing between warm and cold phases. Typically, there is a phase change in around 1-3 years.
These ocean anomalies don’t just bring the main “impact” for global weather, but can also act as the “indicator light”, indicating the changes in the global weather system.
The image below shows the ENSO regions across the tropical Pacific. The main area covers the central part, shown in the image as the Niño 3.4 region. In this region, we determine the ENSO phases by looking at the seasonal sea-surface temperature anomalies (warmer/colder).
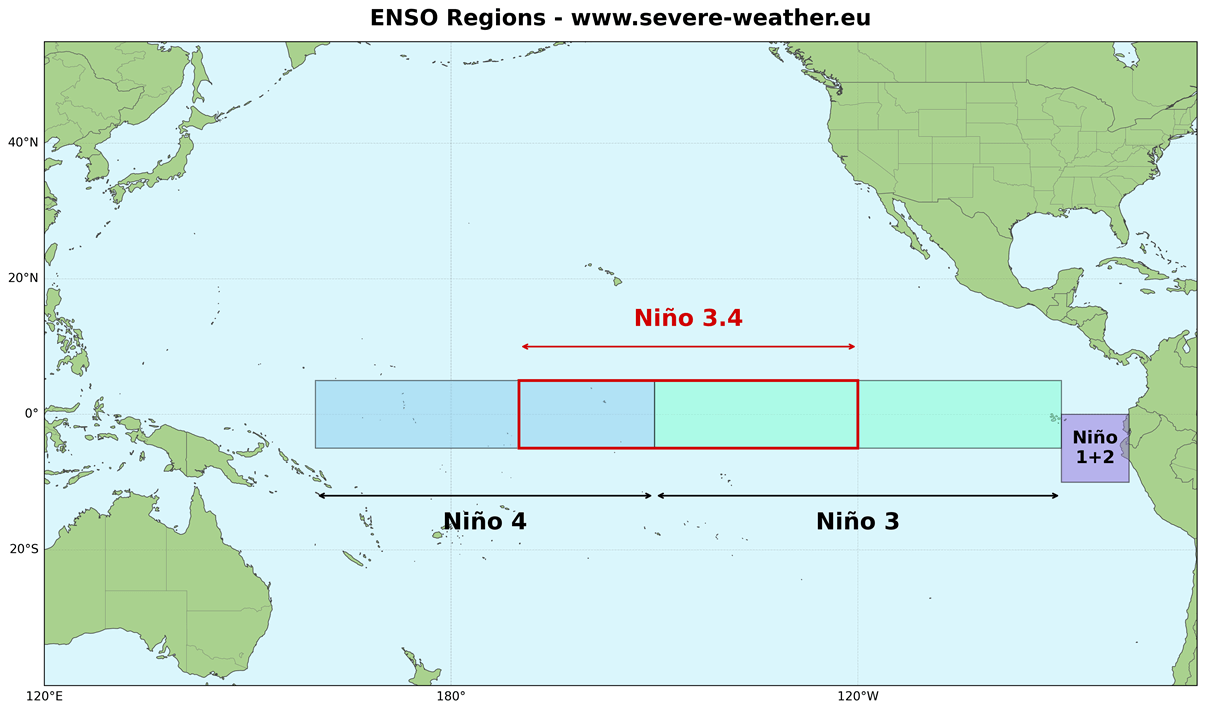
The cold ENSO phase is called La Niña, and the warm phase is called El Niño. Each ENSO phase has a different effect on the pressure and weather in the tropics. This translates into changes in the global circulation over time, altering weather patterns worldwide.
A specific phase (cold/warm) usually starts to develop between late summer and early fall and typically lasts until next summer. But some events can last even up to two years.
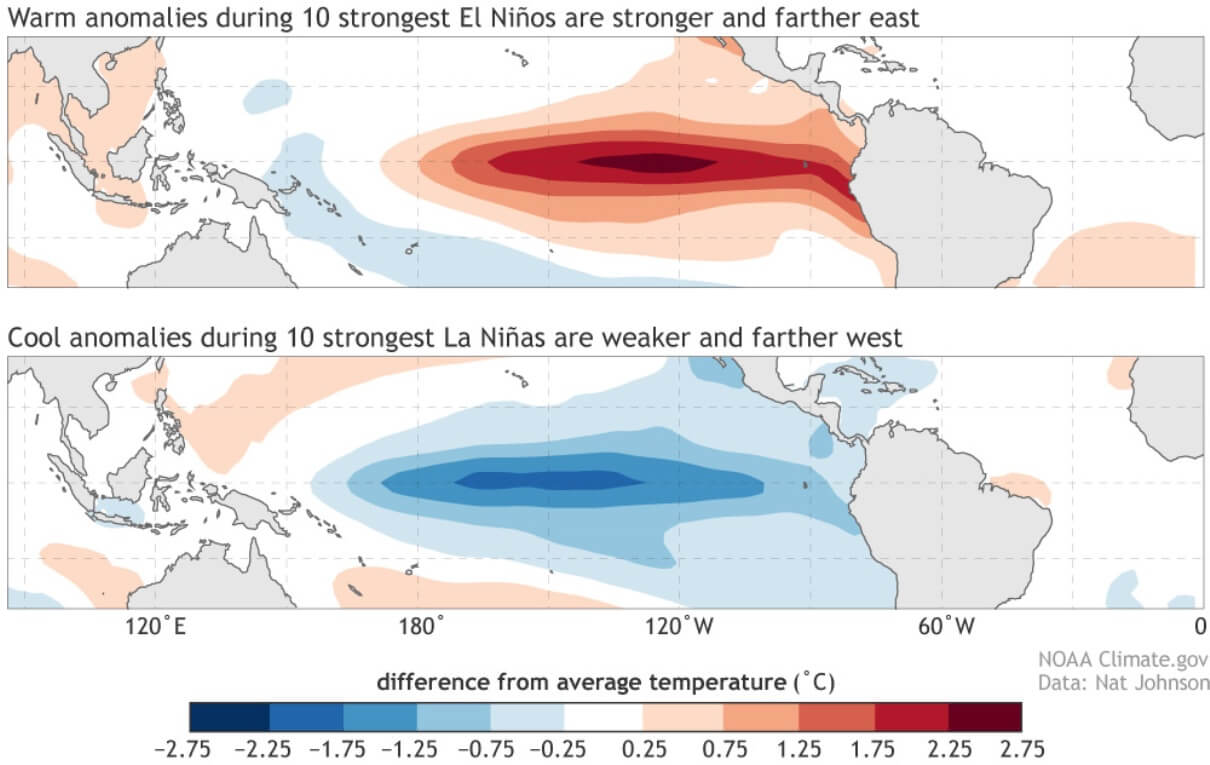
In the image below, we have a direct comparison between the ocean temperature anomalies during a warm and a cold event. Both examples show realistic data from the 10 strongest events for each phase.
ENSO has a major influence on the tropical pressure and rainfall patterns, and the complex exchange between the ocean and the atmosphere. Each phase has a very different (or opposite) pressure and rainfall impact on the tropics, and (over time) on the global weather circulation.
But how does ENSO shift between cold and warm phases? The answer is that the tropical trade winds usually start or stop a certain phase by mixing the ocean surface layers and altering the ocean currents, and thus the ocean temperature.
The trade winds are steady and persistent, blowing towards (and along) the Equator in both Hemispheres.
Below is our map showing the prevailing near-surface winds, based on actual data from the past 4 decades. You can nicely see the easterly trade winds in the Atlantic Ocean and in the Pacific Ocean, which help to drive the ENSO region warming and cooling.
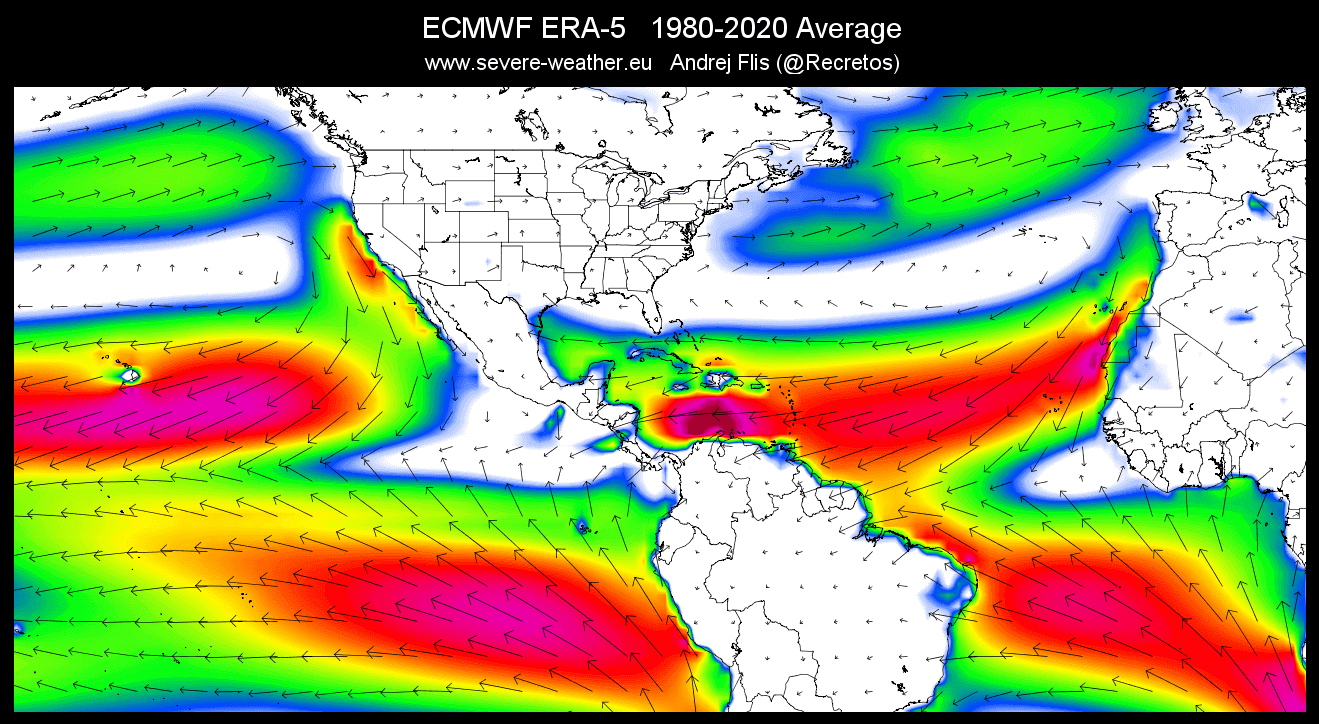
When these easterly winds get stronger, they actually start changing the ocean surface currents, and they start pushing the water from east to west. This moves warm surface water towards the west, bringing up deeper (colder) water closer to the surface to replace it, starting a La Niña.
But when these trade winds get weak or reversed, the westerly flow promotes warmer ocean temperatures on the surface, reversing the ocean cooling and creating an El Niño event.
These trade winds are also the main reason behind the recent onset of the La Niña breakdown, as a westerly wind burst in the western Pacific will start to dissipate the cold anomalies.
La Niña Collapse: Westerly Wind Burst starts
Below you can see the zonal winds forecast over the tropical regions from ECMWF. The upper part shows analysis for the last two weeks, and you can already see the westerly anomalies over the west-central ENSO regions in recent days. But the main event is in the forecast for the second half of January in the bottom part.
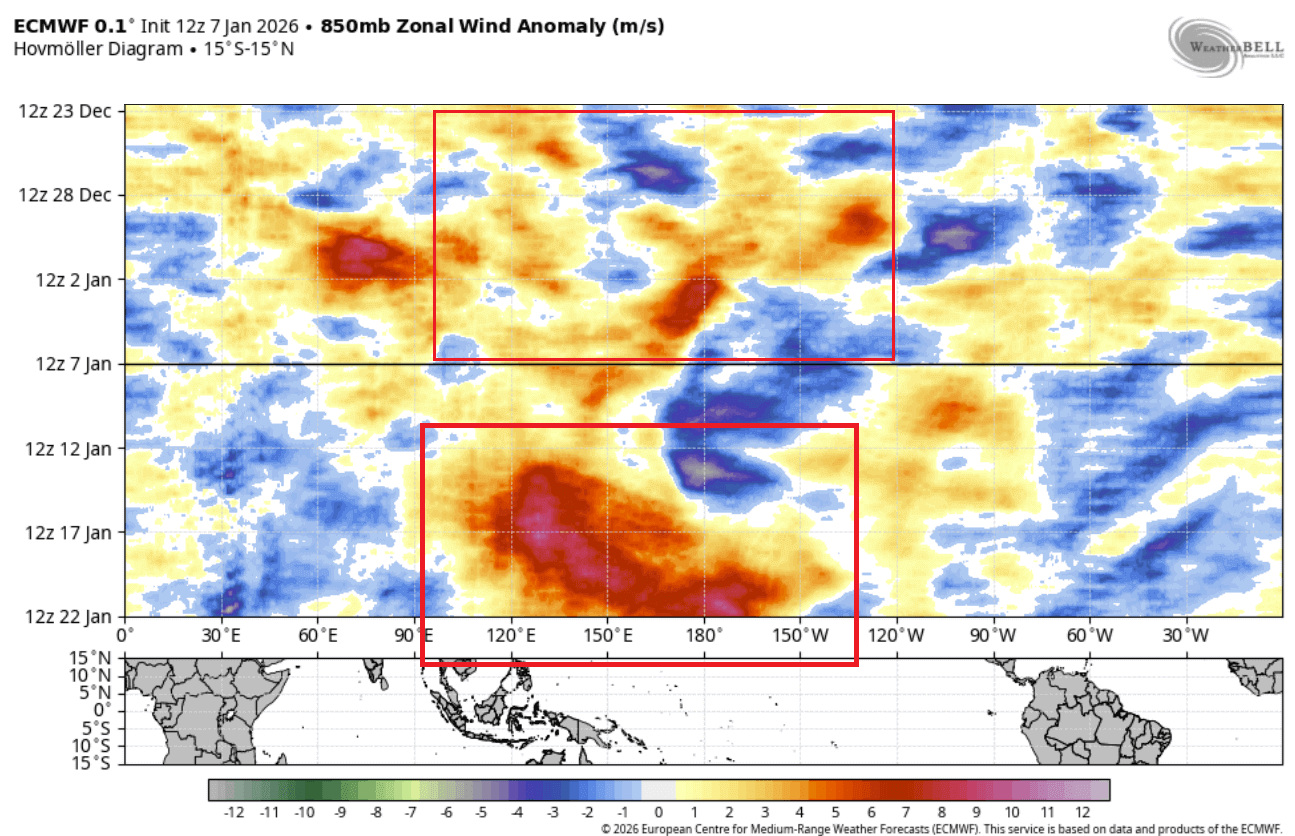
That forecast shows a proper Westerly Wind Burst across the western and central tropical Pacific. An event of this magnitude can rapidly erode a La Niña event from the west, promote ocean surface warming ,and also strengthen the subsurface warm anomalies.
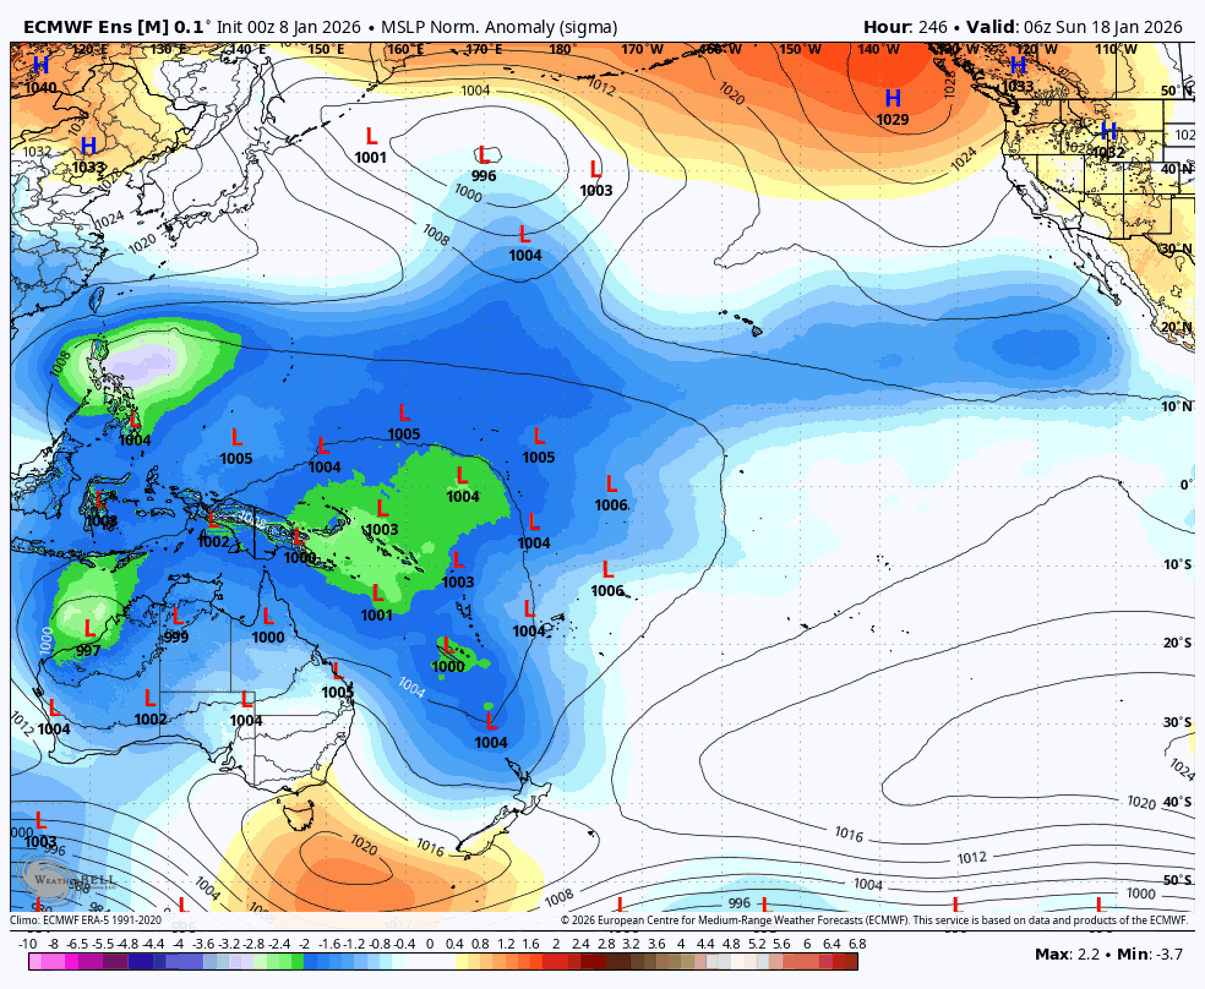
The driver of this westerly wind burst is the broad area of low-pressure over the western Pacific, seen in the ECMWF forecast below for mid-month. You can see the low-pressure areas, which will amplify the westerly momentum, creating one of the strongest westerly wind bursts seen in recent years.
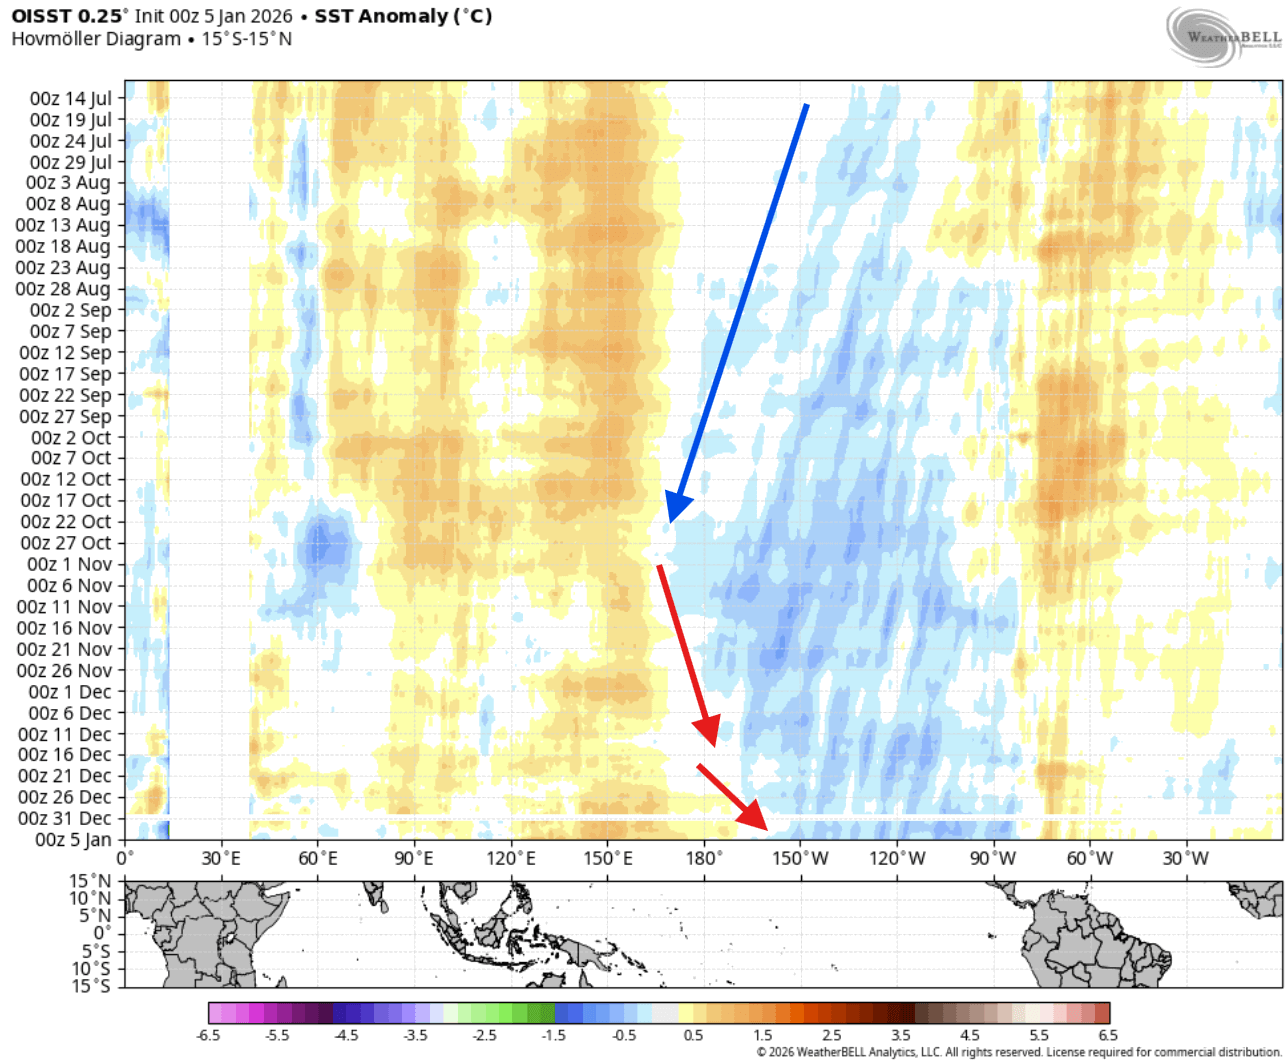
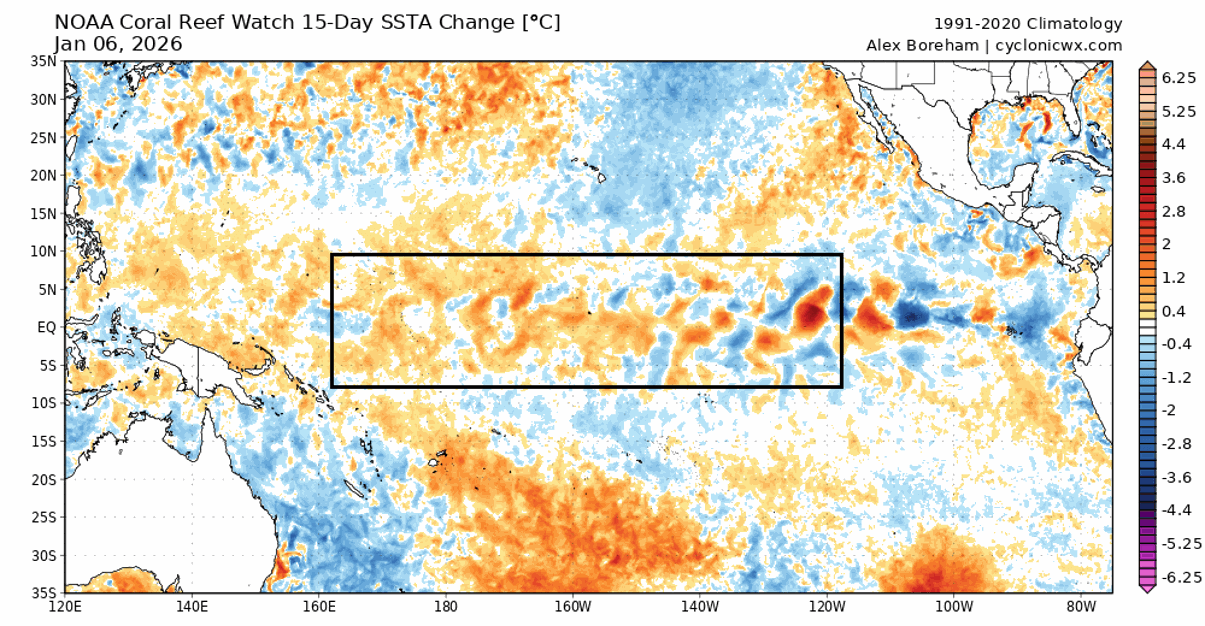
Below is a special graphic that shows the changing SST anomalies in recent months. This shows the La Niña event was growing since late summer, reaching a peak in late Fall. You can also see the cold anomalies starting to shrink rapidly from the west, with further reduction forecast with the upcoming westerly wind burst.
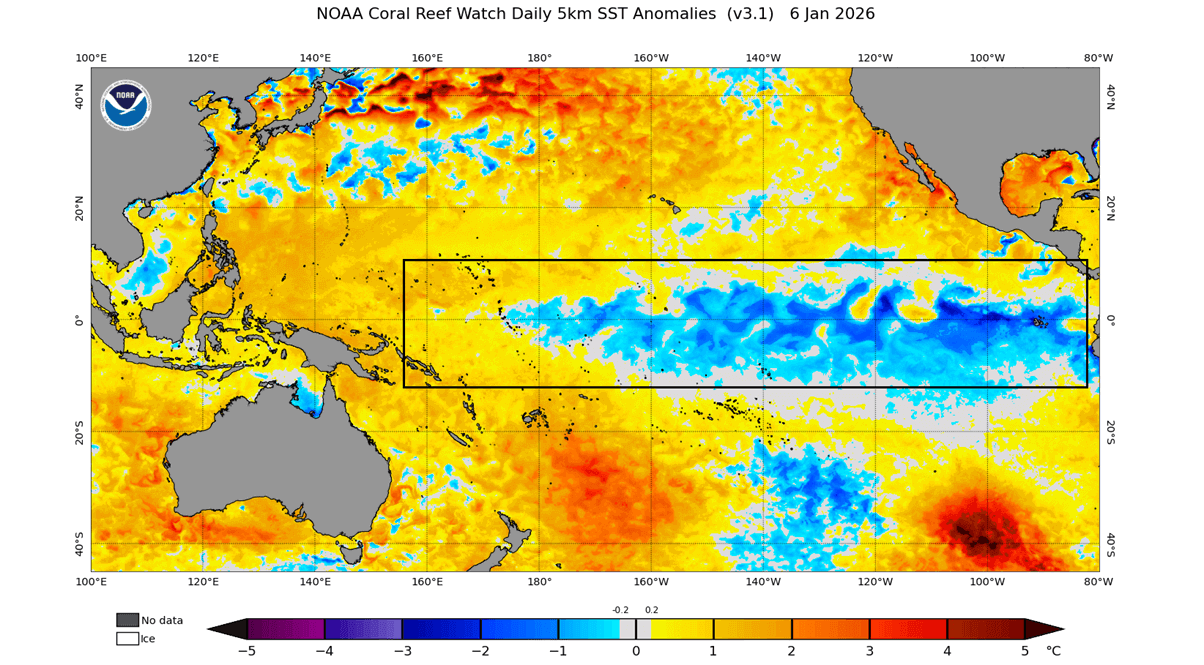
The latest ocean analysis below shows the main ENSO region that we usually watch. You can see the cold anomaly of the current La Niña, but it’s getting weaker on its west side (region 4). It has just reached its peak in recent weeks, but it is already starting to weaken, earlier than normal for such events.
Below is the latest 15-day ocean temperature change, where you can see the warming trend in the western and central ENSO regions. There is still some mixing in the eastern parts, but it appears that the end of this La Niña is starting from the west and will be amplified in the coming weeks.
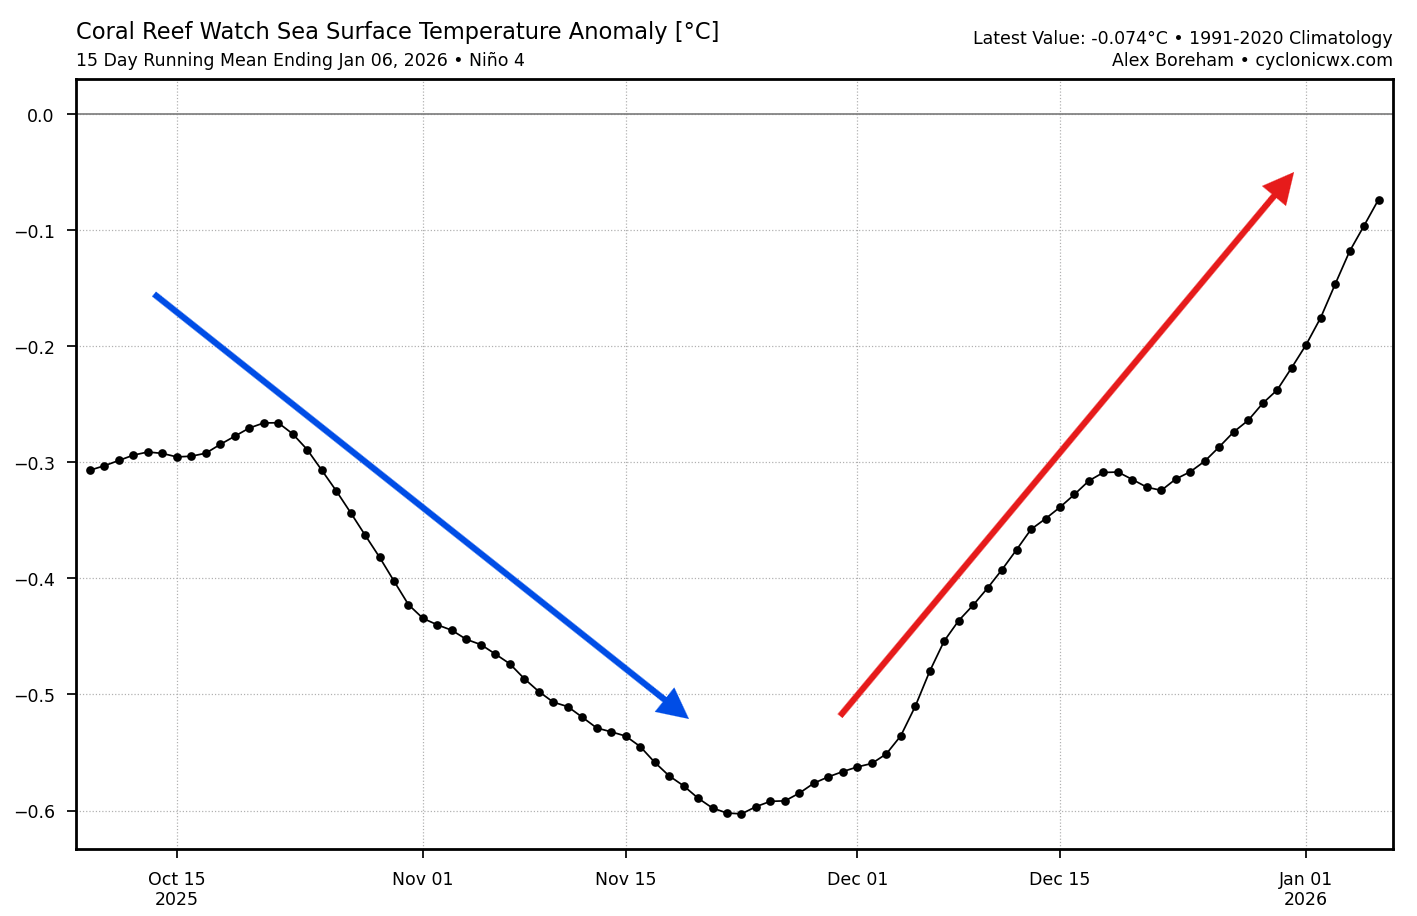
This is confirmed by the ENSO region 4 (west) analysis below, which shows the anomaly data for the past 3 months. The La Niña cooling is clearly visible, peaking in late November. But since then, the ENSO temperature anomaly has started to rise back rapidly, and will continue as this region gets swarmed with the westerly wind anomalies in the coming weeks.
An important change is also occurring deep below the ocean surface. The image below shows the subsurface ocean temperature anomalies across the tropical Pacific. You can see a large warm pool in the west, at around 100-250m (300-800ft) depth. This is another reason for the La Niña weakening starting from the west, as these anomalies expand below the surface.
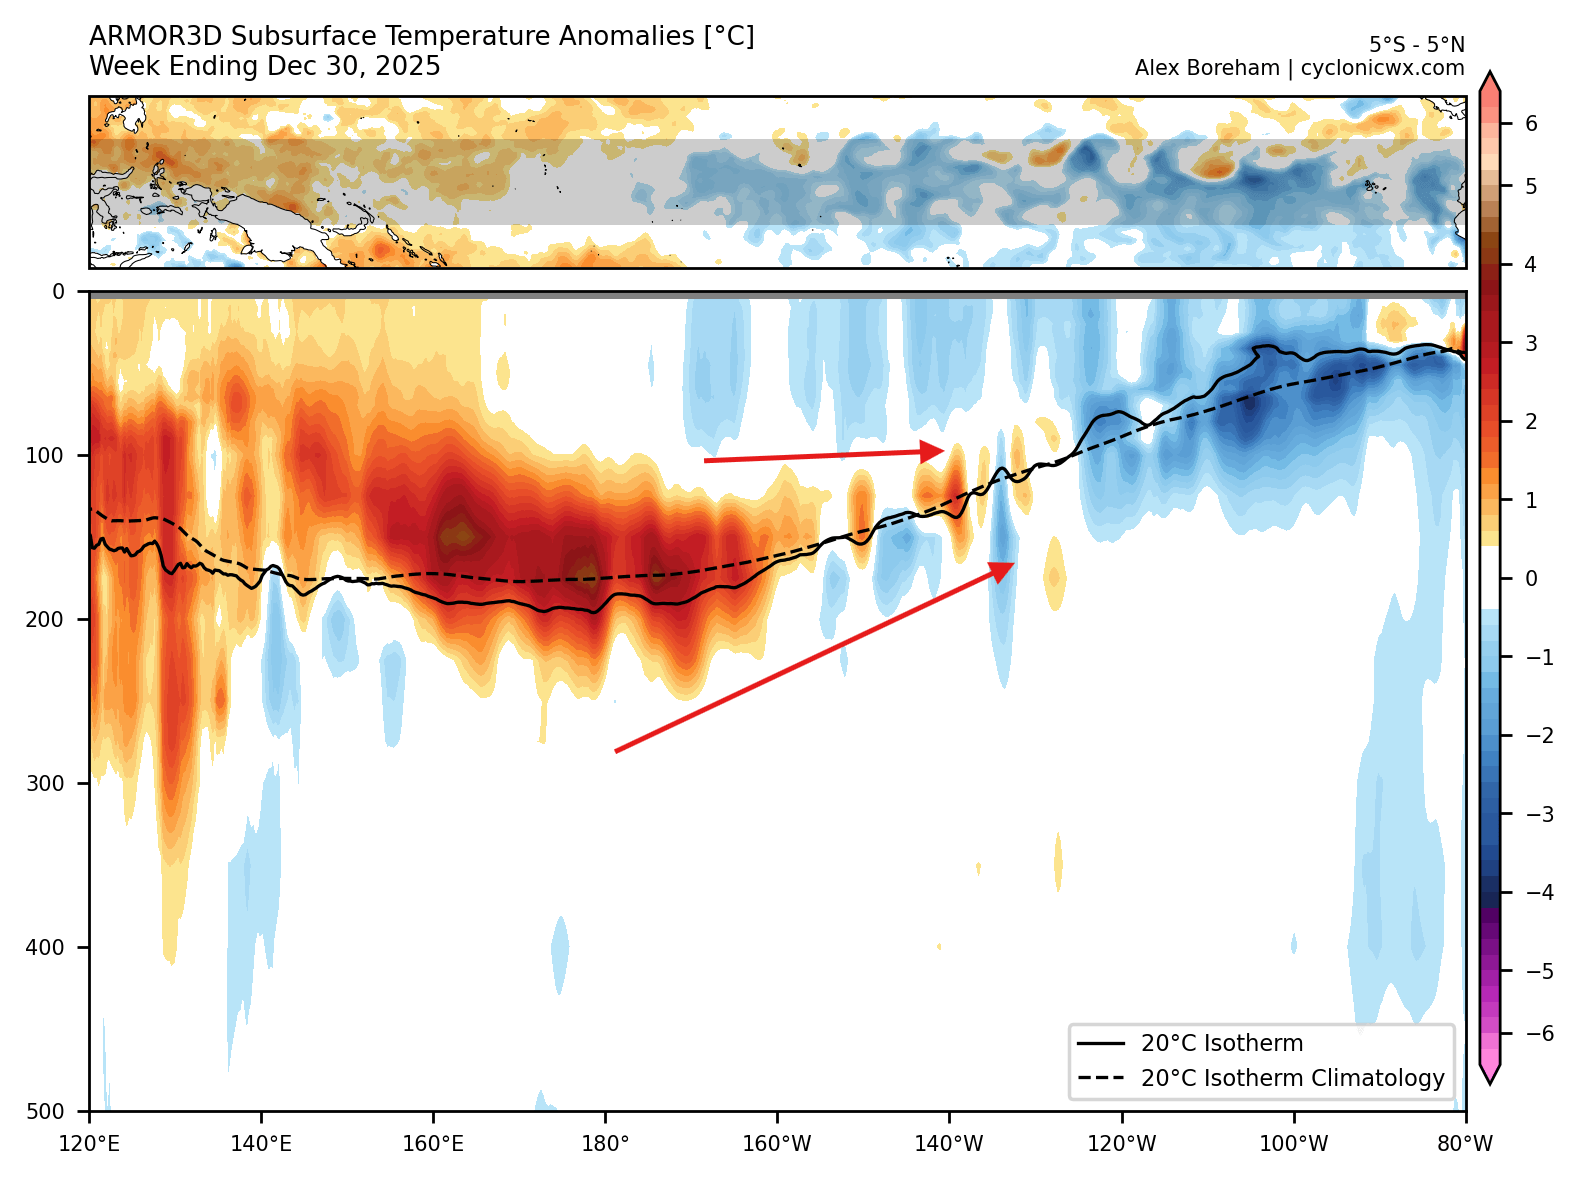
This subsurface warm pool is also amplified by surface westerly winds and is forecast to expand and erode the La Niña below the surface. Below is a video that shows the subsurface ocean development in the past weeks, showing a clear expansion of the warm pool and the weakening cold anomalies below the surface.
A strong subsurface warm pool is the first clear sign of an impending El Niño event. That is why we closely monitor the atmospheric winds, pressure changes, and ocean currents across the tropical Pacific, which create and amplify these anomalies.
But the atmospheric impact of La Niña still takes time to disappear from the atmosphere, as it’s not an instant response to the ocean anomalies. That’s why we can still expect to see the La Niña weather influence at least into the early part of Spring.
Early Spring Forecast: The Final La Niña Pattern
La Niña has a well-known atmospheric impact during the Winter and Spring seasons. Below is a typical late Winter/early Spring pressure anomaly pattern during or after a La Niña phase. You can see the high-pressure anomaly in the North Pacific, but more importantly, a low-pressure area over Canada and the northern United States, expanding into the Atlantic.
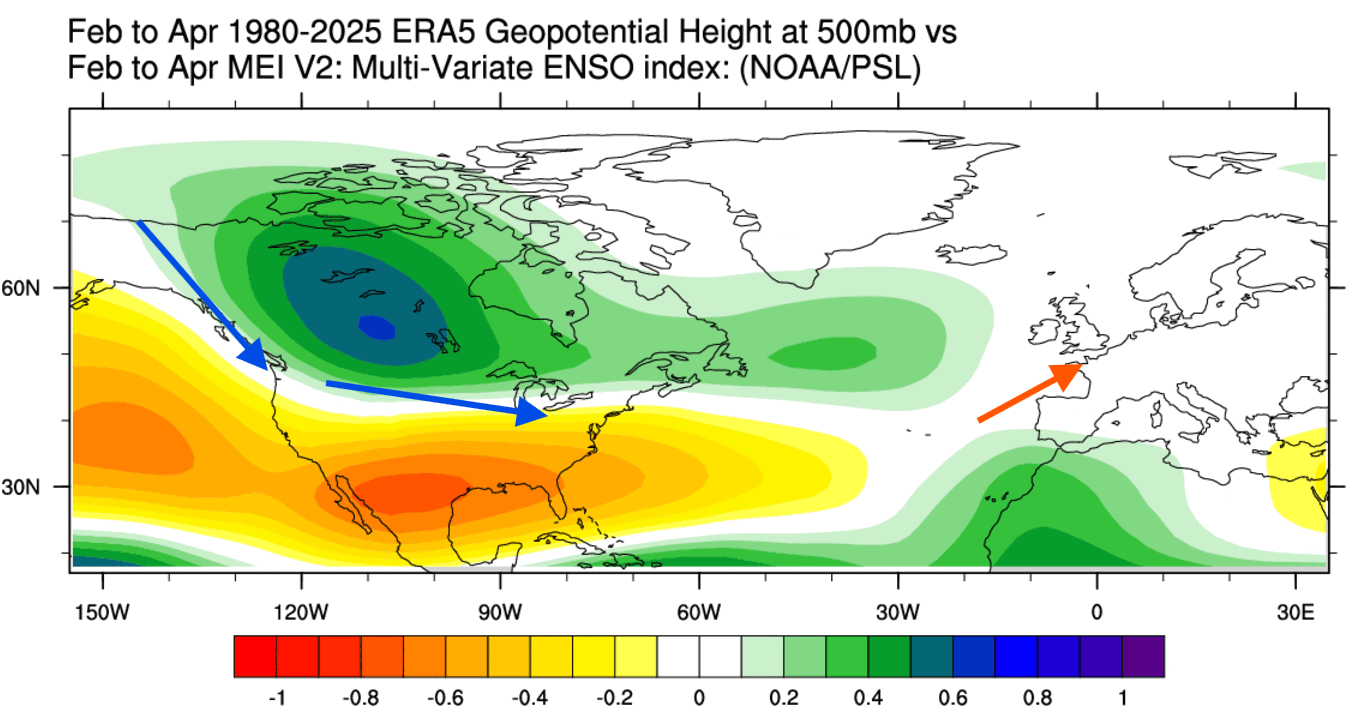
A high-pressure area in the North Pacific allows a low-pressure area to expand over Canada and into the northern and central United States. This typically supports a more northerly flow, transporting colder/cooler air into the northern half of the United States. But this tends to bring a warmer flow into Europe.
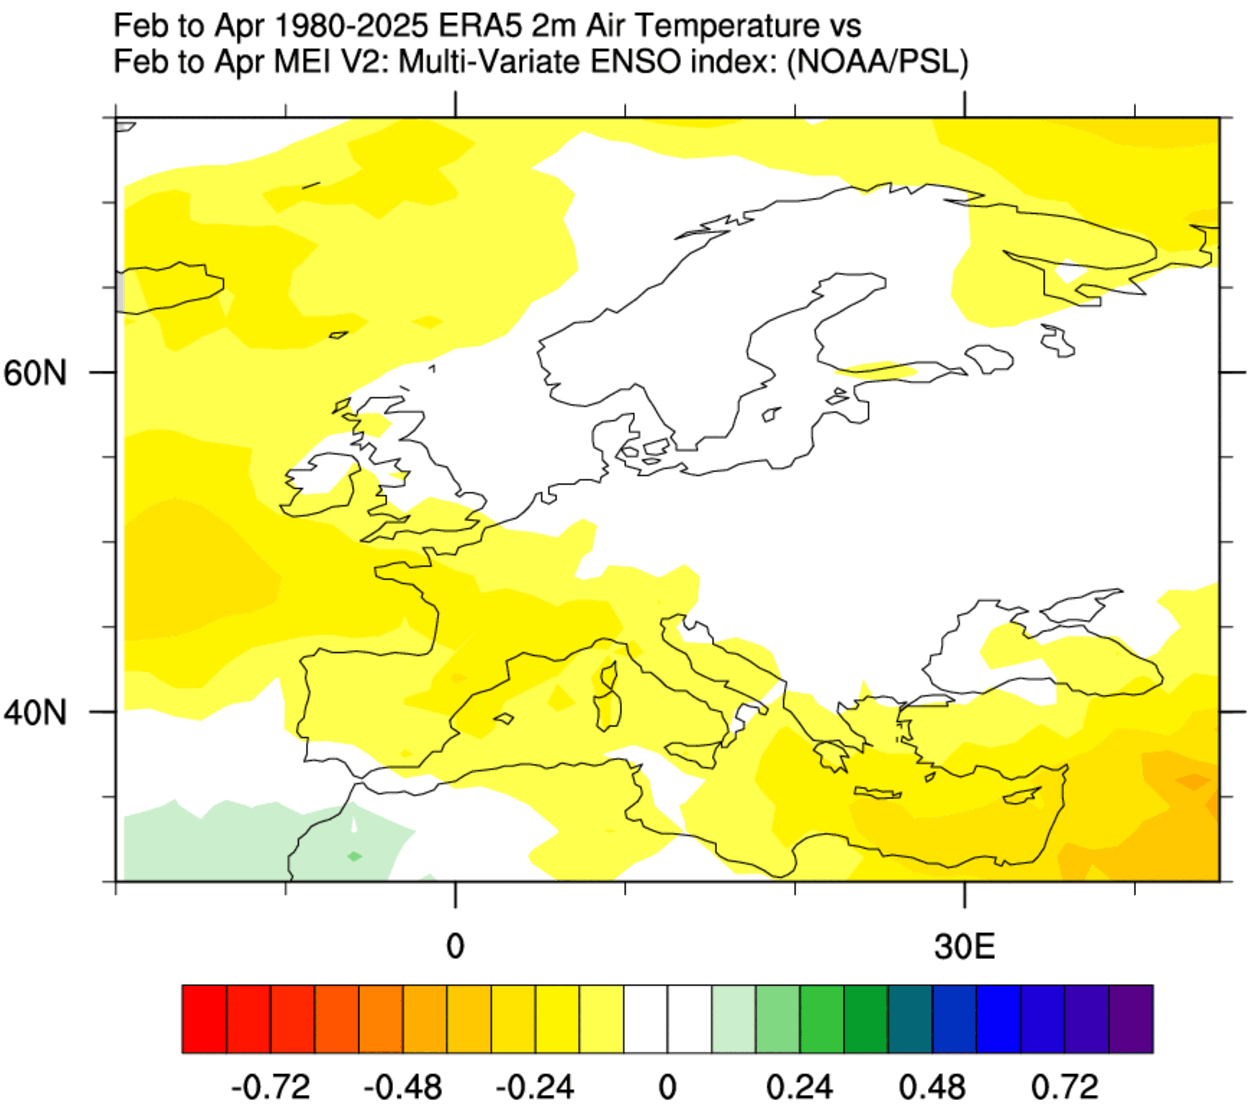
The image below shows an average La Niña temperature anomaly trend for the same season. It is produced from several decades of data by PSL. You can see that a La Niña event supports below-normal temperatures over Canada and the northern half of the United States and above-normal temperatures in the south during the February-April period.
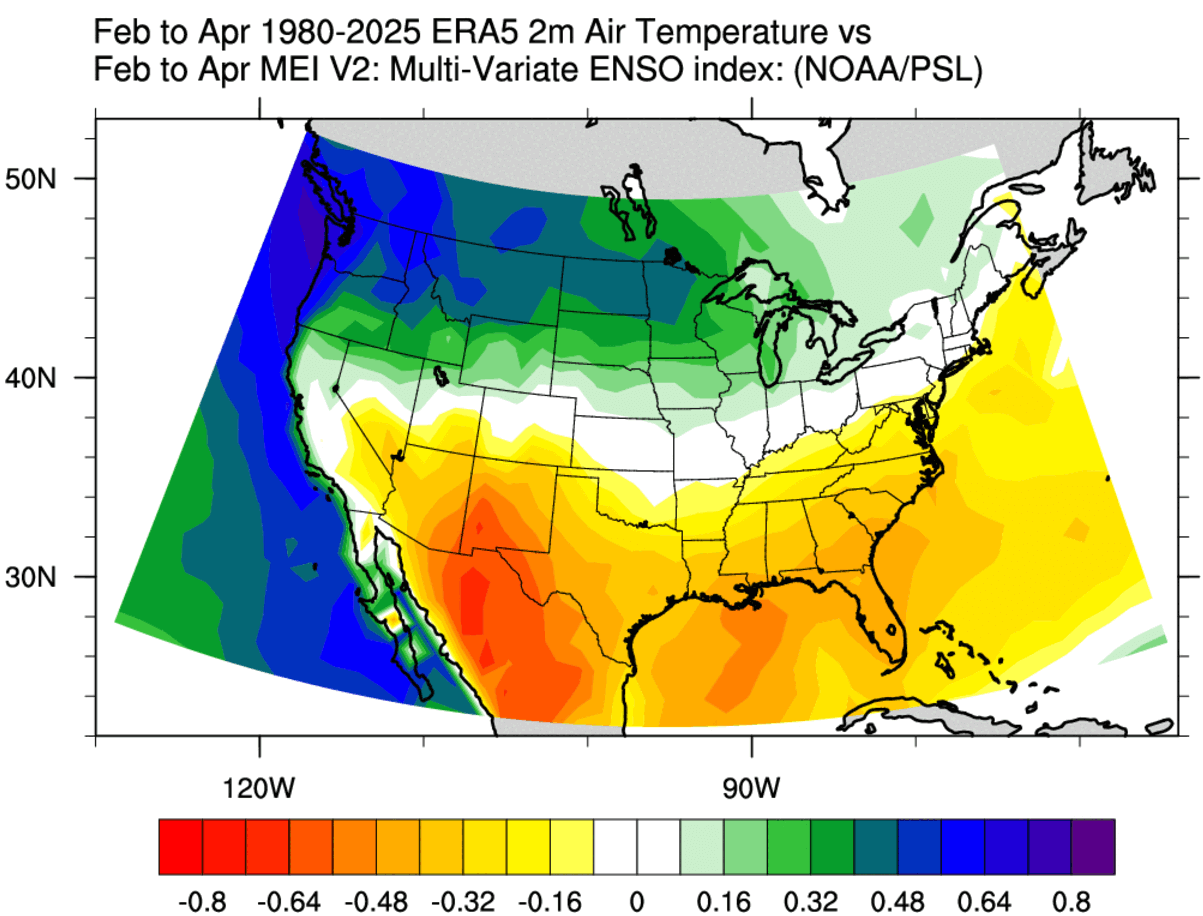
In the same period over Europe, you can see a warmer trend over the western and west-central parts, driven by the low pressure in the Atlantic. That creates a more westerly flow into the continent, which usually brings mild air.
The latest CanSIPS seasonal forecast confirms this exact development, which is typical for a La Niña pattern in the February-April period. You can see the colder temperature trend over southern Canada and the northern United States, the Midwest, and the Northeast. This shows confidence in the past data, that there is visible La Niña interference in the atmosphere.
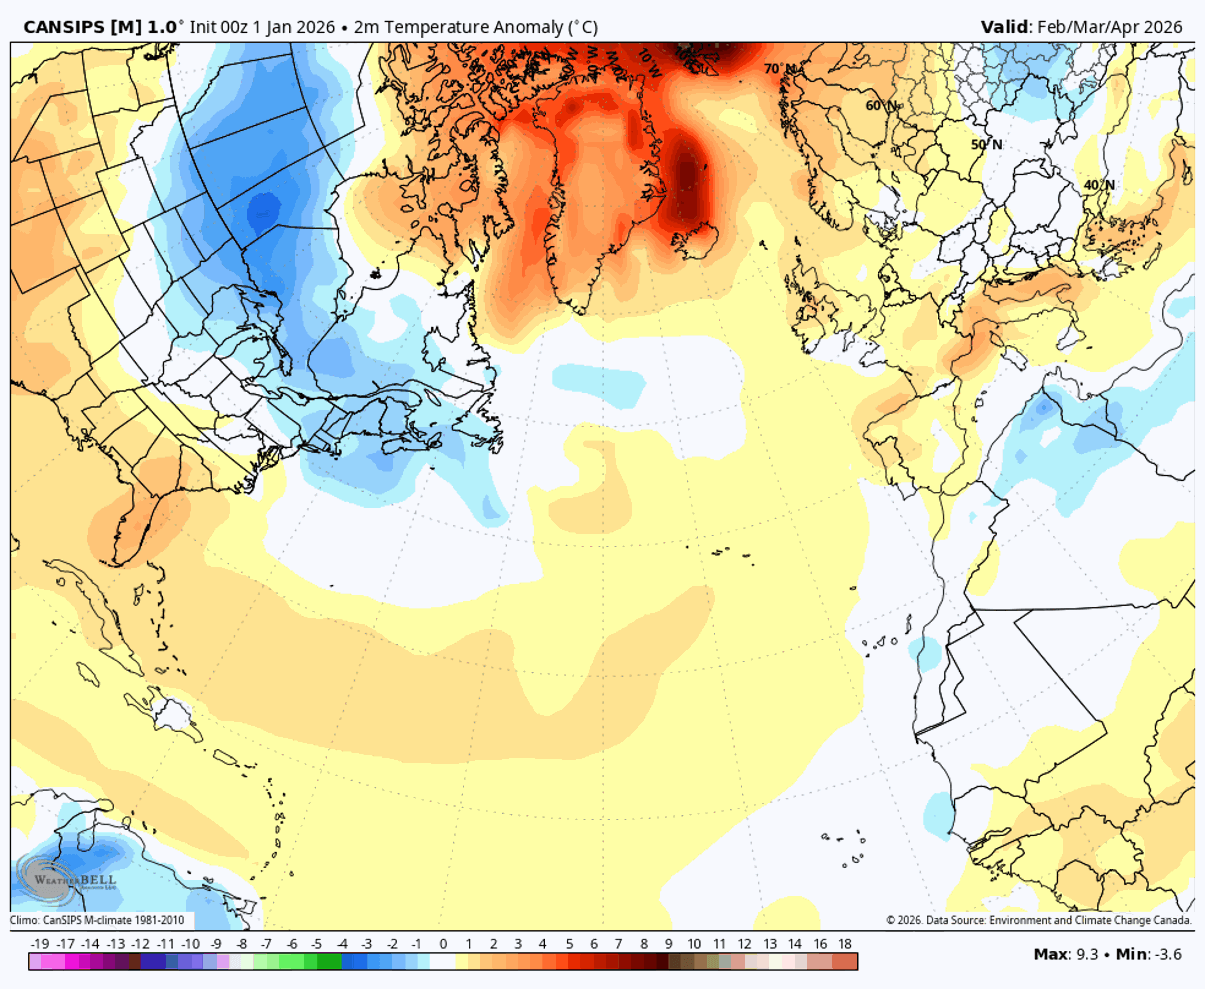
Europe is forecast to have warmer temperatures than normal, as the past data also indicated, driven by the mild westerly flow.
But looking beyond early Spring, we have seen clear indications in the latest conditions above that La Niña is ending sooner rather than later. But what can we expect next from the ENSO influence, and how will that impact our daily weather in the coming seasons?
2026 El Niño: Long-Range Models Signal a Major Flip
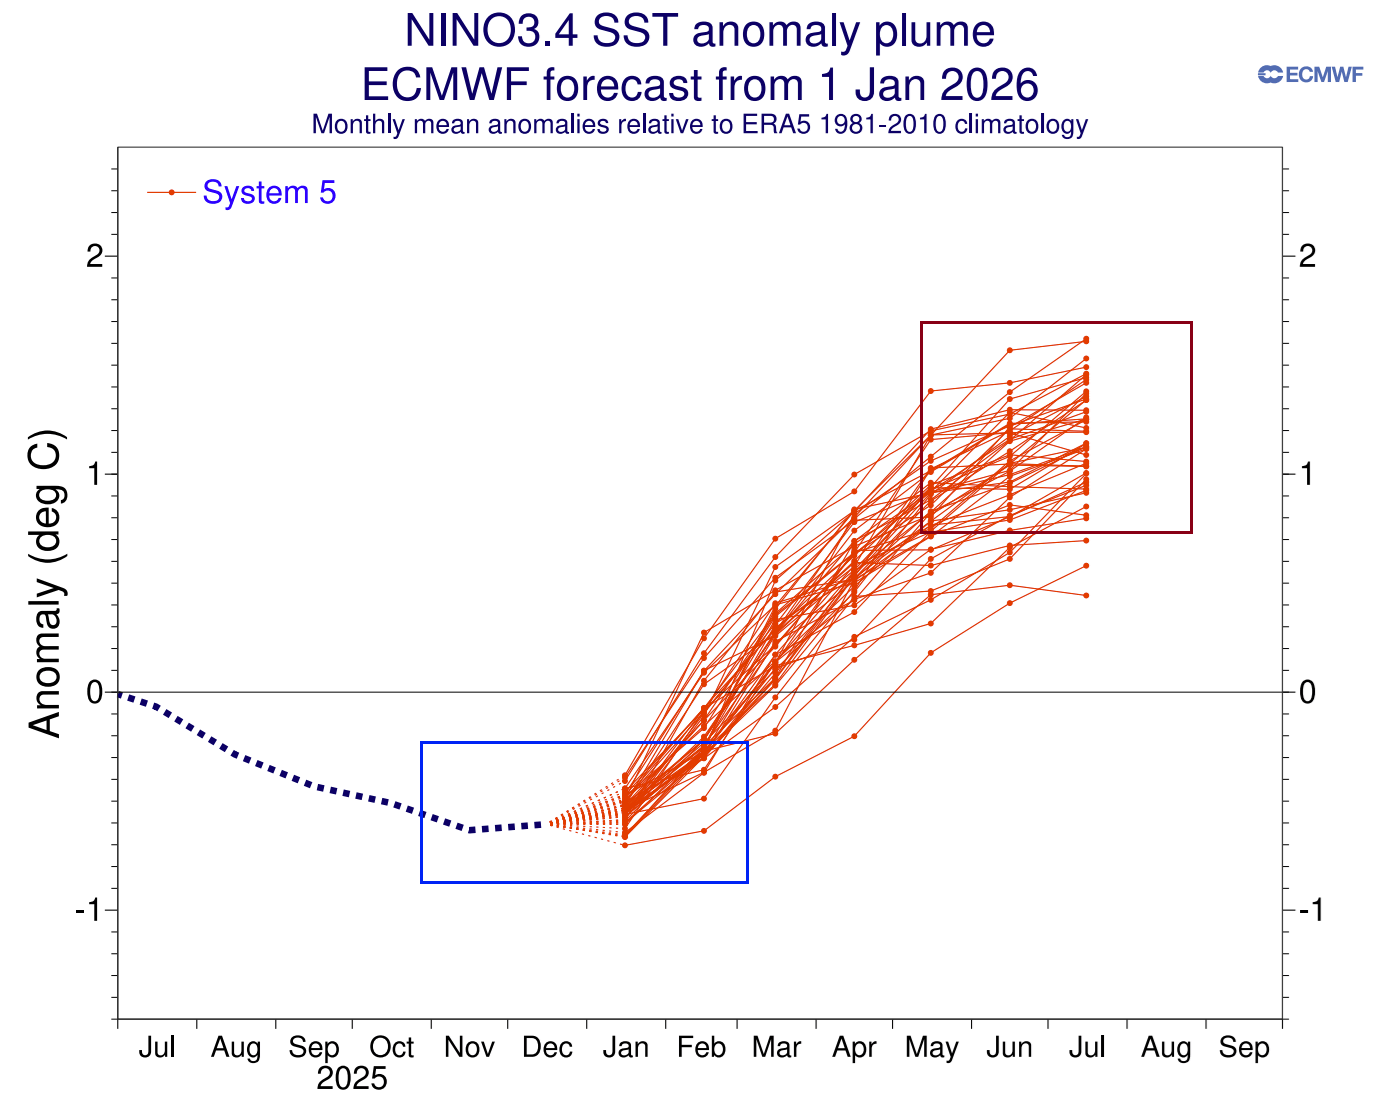
Looking ahead, we can see a clear indication of the end of La Niña and a rapid transition into a new El Niño event. Below is the extended ECMWF long-range forecast, and it shows a proper El Niño developing already during Summer 2026, lasting into next Winter. Currently, this indicates a moderate strength event, but it typically ends up stronger than early forecasts.
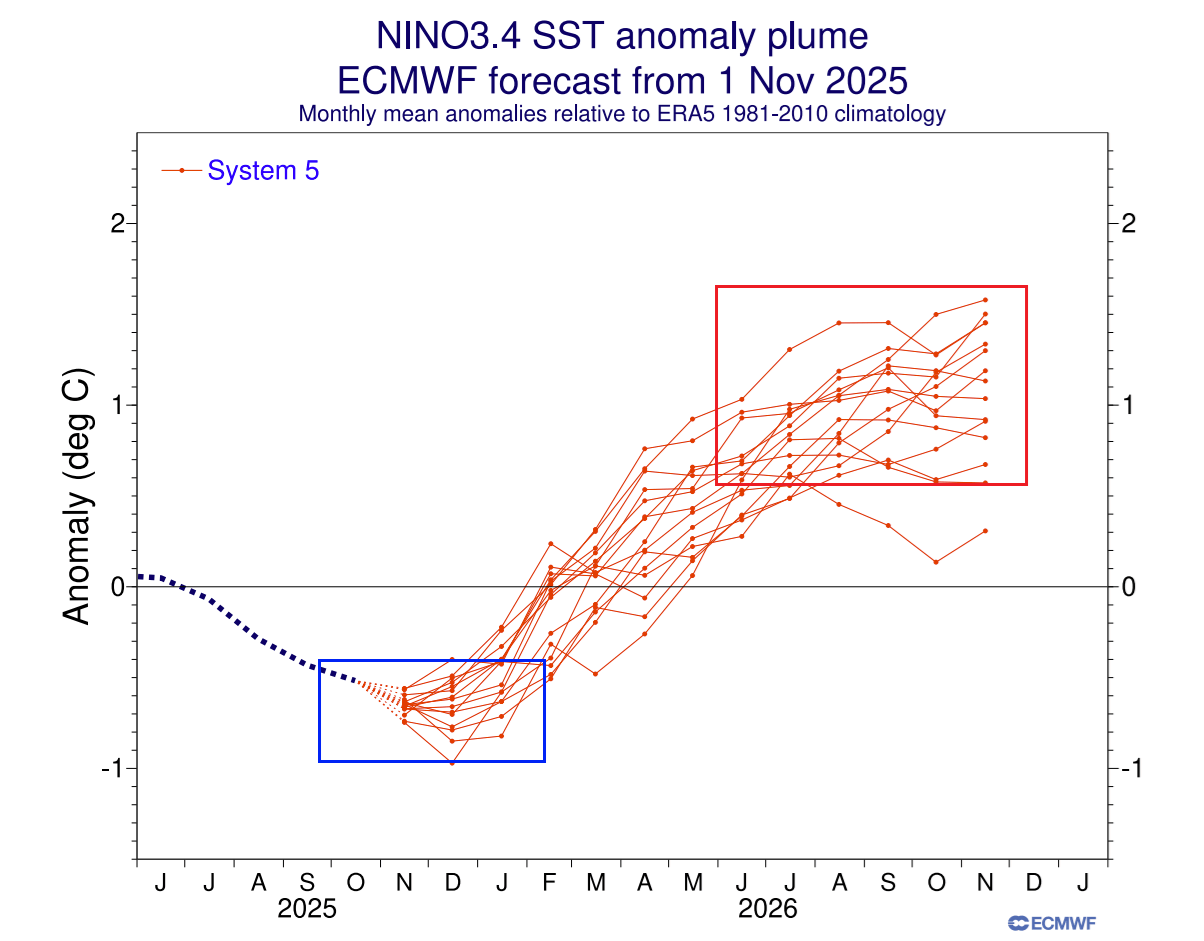
Below is also the latest ENSO forecast for the next few months, and it shows a very rapid end of the La Niña and a rapid transition into an El Niño. This is a high-confidence forecast, as all the individual ensembles in the forecast agree, and the upcoming wind and pressure changes support a rapid end of La Niña.
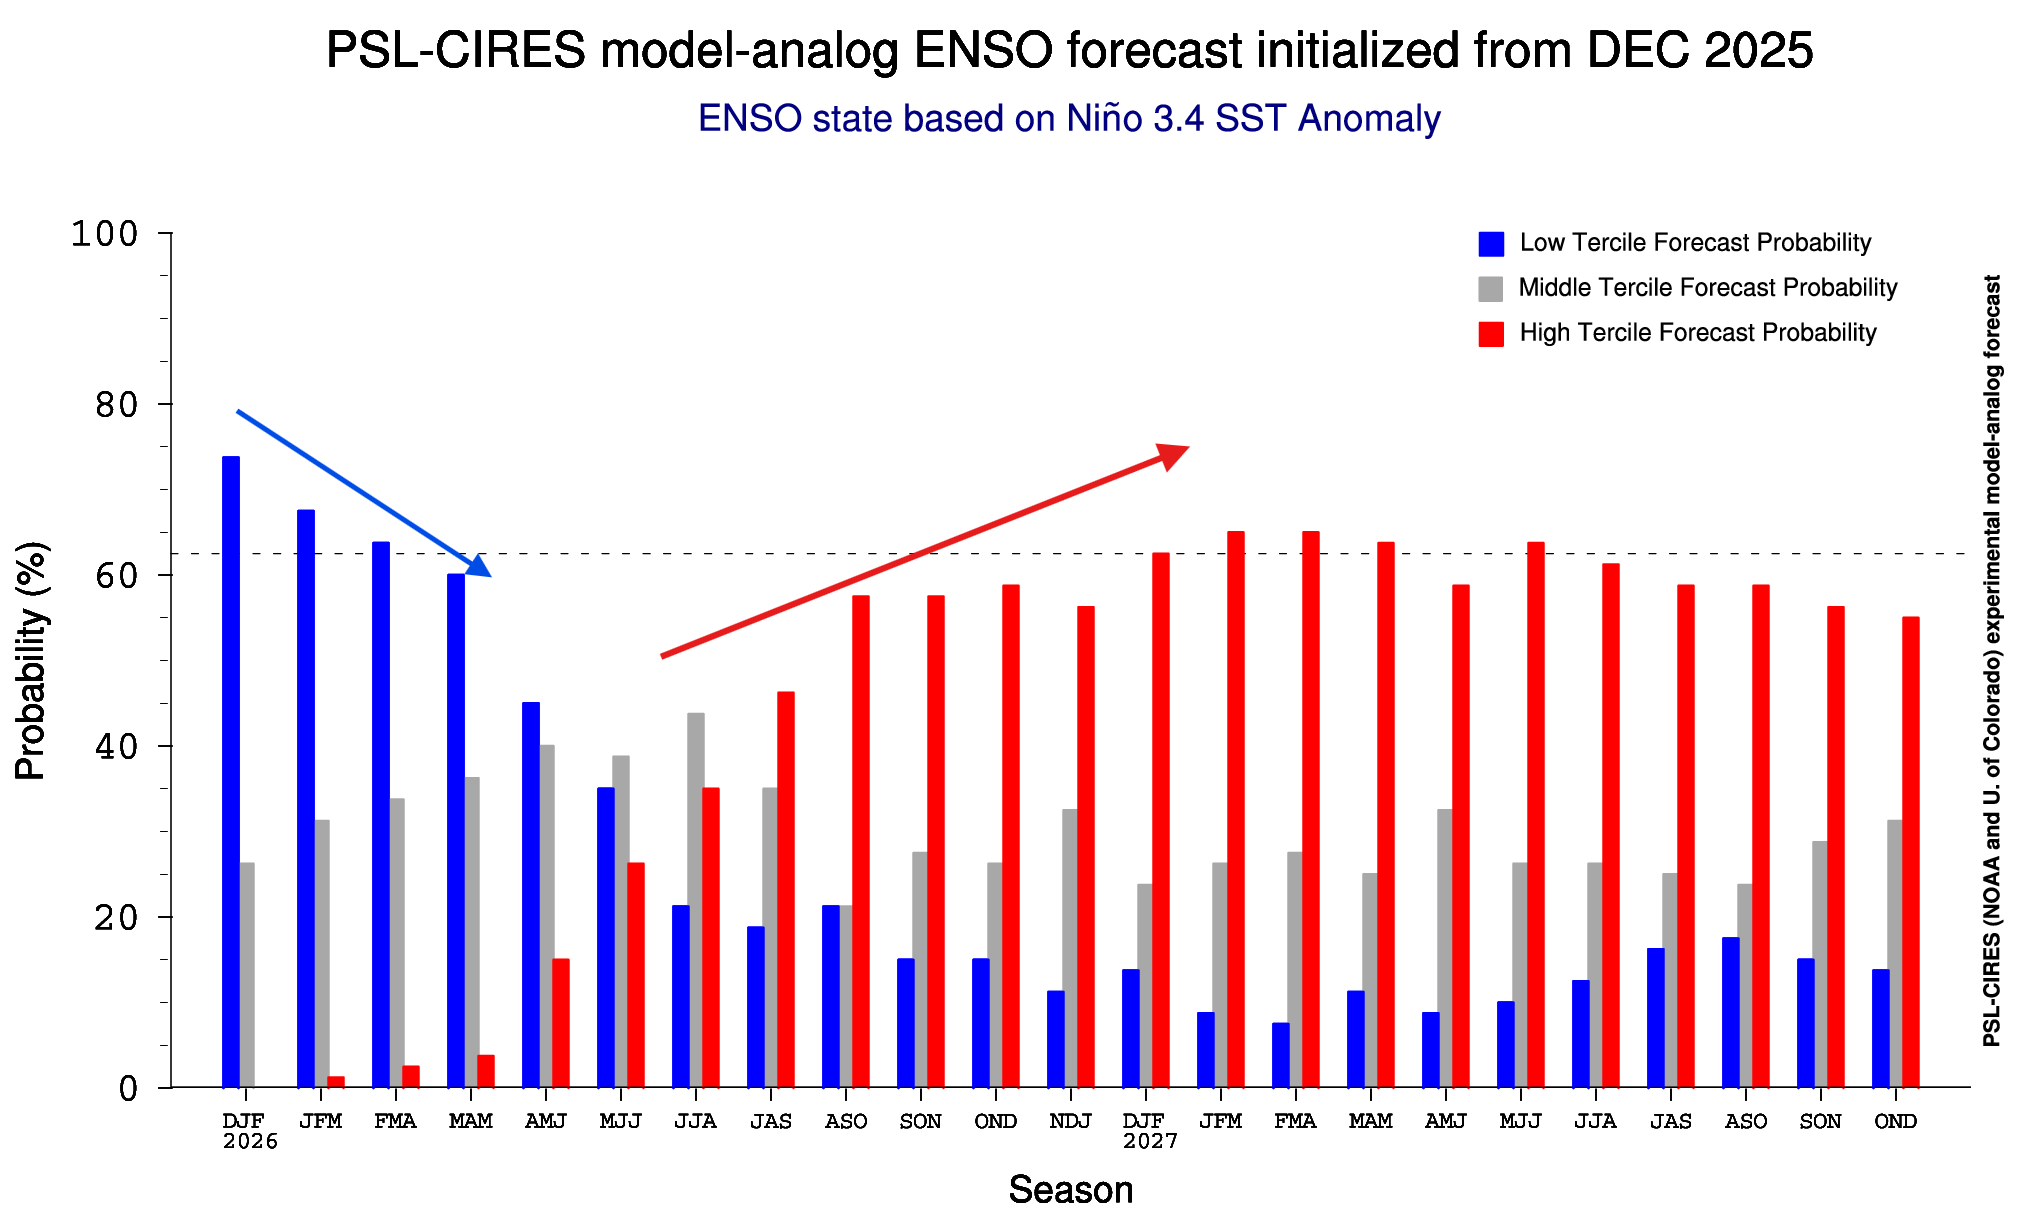
The CPC official probabilistic ENSO forecast shows a clear shift into El Niño mode for 2026/2027, giving a full El Niño state by early Fall 2026. This shows the event peaking during Winter, potentially lasting for a second year. You can also see the rapid decline of the current La Niña event.
Looking at the July ocean forecast by the ECMWF, you can see a clear El Niño warm anomaly expanding across the tropical Pacific in the next few months. This is not the only model that shows this; other forecasting systems also project a warm ENSO phase and an emerging El Niño by mid-2026.
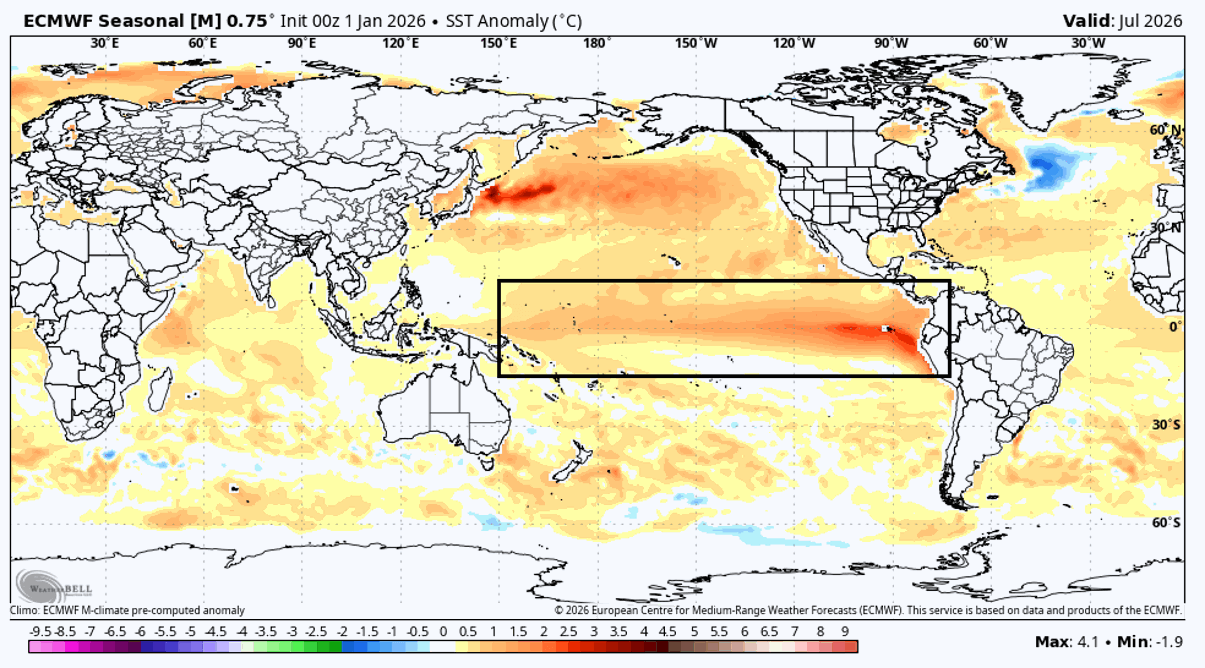
This forecast indicates that the warm El Niño anomaly will already be present in Summer, which would bring a clear atmospheric impact on the 2026 hurricane season. While it is too soon for any proper hurricane forecast, we can look at the past data for the El Niño influence on hurricane season.
Looking at precipitation data, you can see much drier trends across most of the tropical storm regions during an El Niño. The south coastal areas of the United States, the Caribbean, and most of the tropical Atlantic are drier than normal, indicating that El Niño is preventing major tropical development or hurricane landfalls.
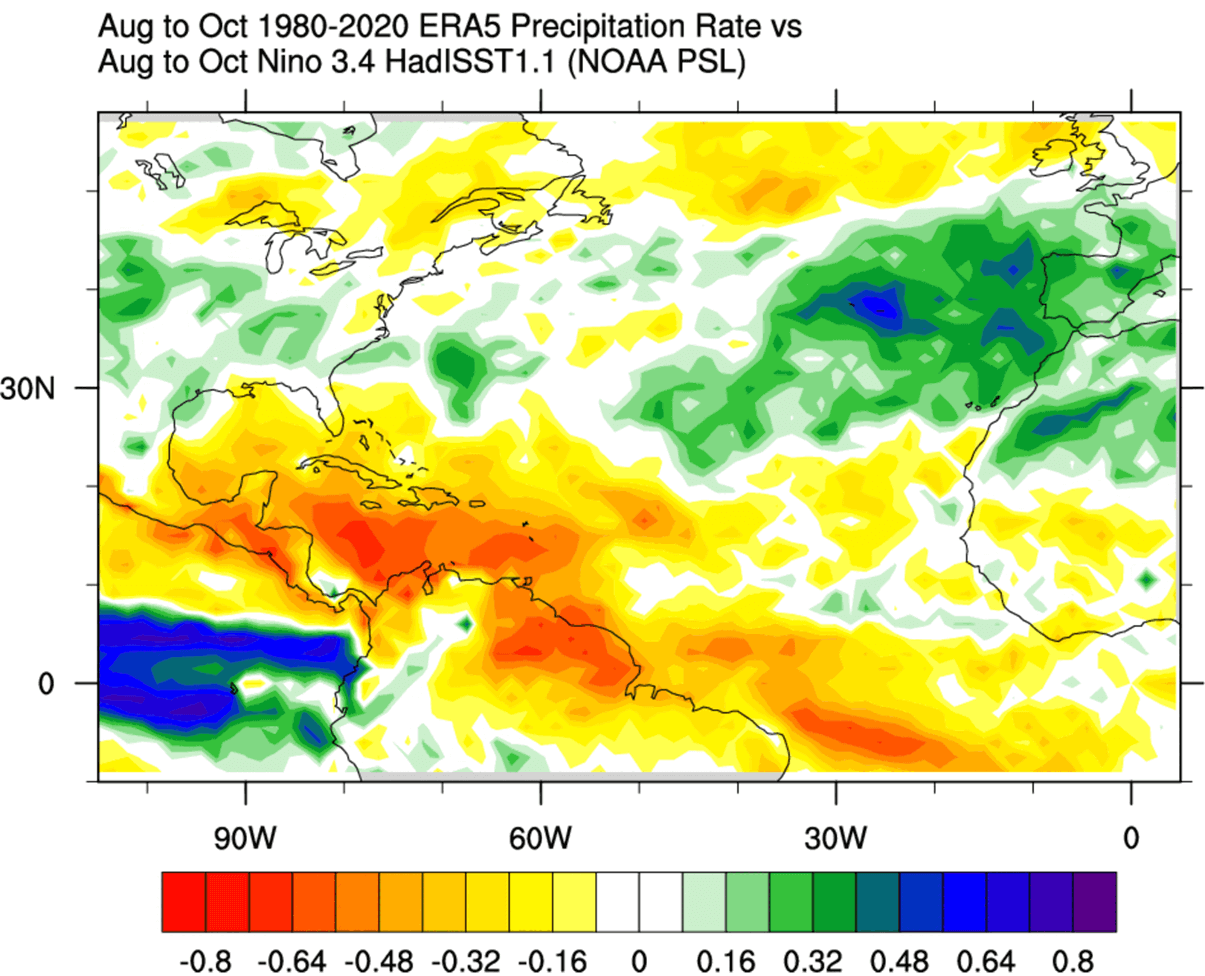
This is mostly a result of higher pressure and more stable conditions across the tropical Atlantic. This means fewer tropical storms and weaker systems. So, an El Niño can greatly reduce the chance of strong hurricanes impacting the United States.
But the biggest weather impact is usually during the Winter season, and here the El Niño has a completely opposite influence to a La Niña.
Winter 2026/2027: What the El Niño Return means for Snow and Cold
During the winter season, an El Niño usually creates a strong and persistent low-pressure area in the North Pacific. That pushes the Polar jet stream further north, bringing warmer-than-normal temperatures to the northern United States and western Canada. You can see that in the image below.
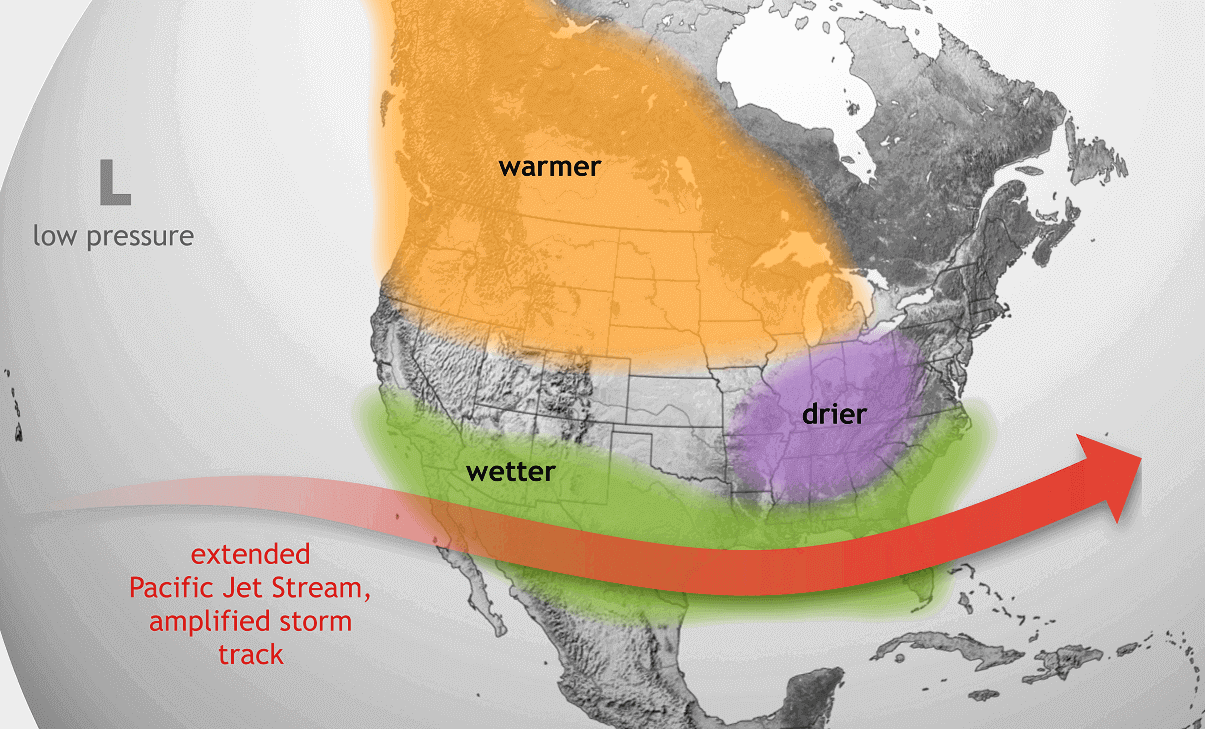
But the southerly Pacific jet stream is amplified during an El Niño, bringing lower pressure with plenty of precipitation and cooler weather to the southern United States and parts of the East.
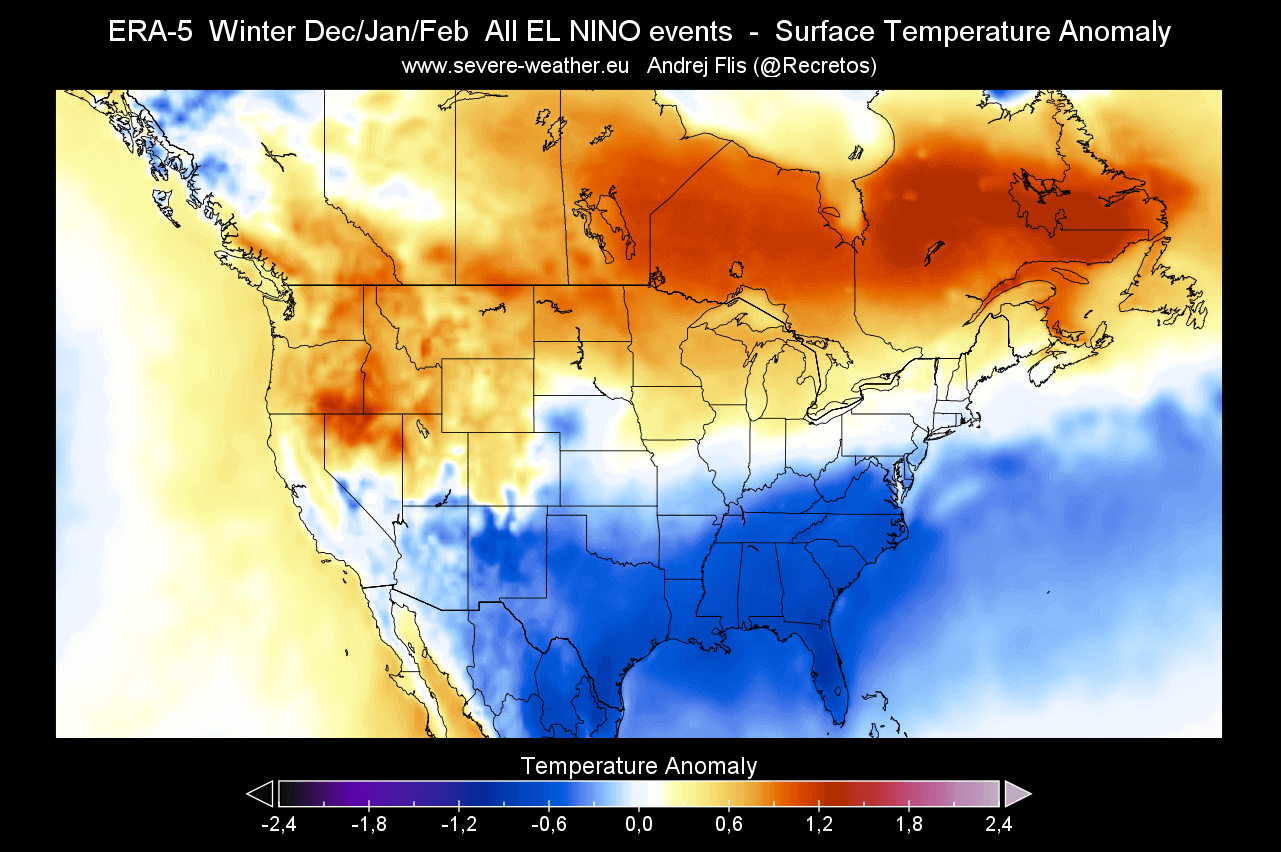
Below, we produced three images that show the usual El Niño winter anomalies. They are made by merging the atmospheric data from all El Niño events since 1950 from the ECMWF ERA-5 dataset.
The average El Niño winter usually brings colder temperatures to the southern and eastern United States and across the central Plains. The northern half of the United States is warmer than usual, with the warm anomalies spreading into southern and eastern Canada.
An El Niño event also changes the snowfall patterns, as shown in the image below. You can see less snowfall in the northern United States and the Midwest during the El Niño winter. But more snowfall is seen over eastern Canada, in the central and southern United States, across the Plains, and also over the eastern United States and into the Northeast.
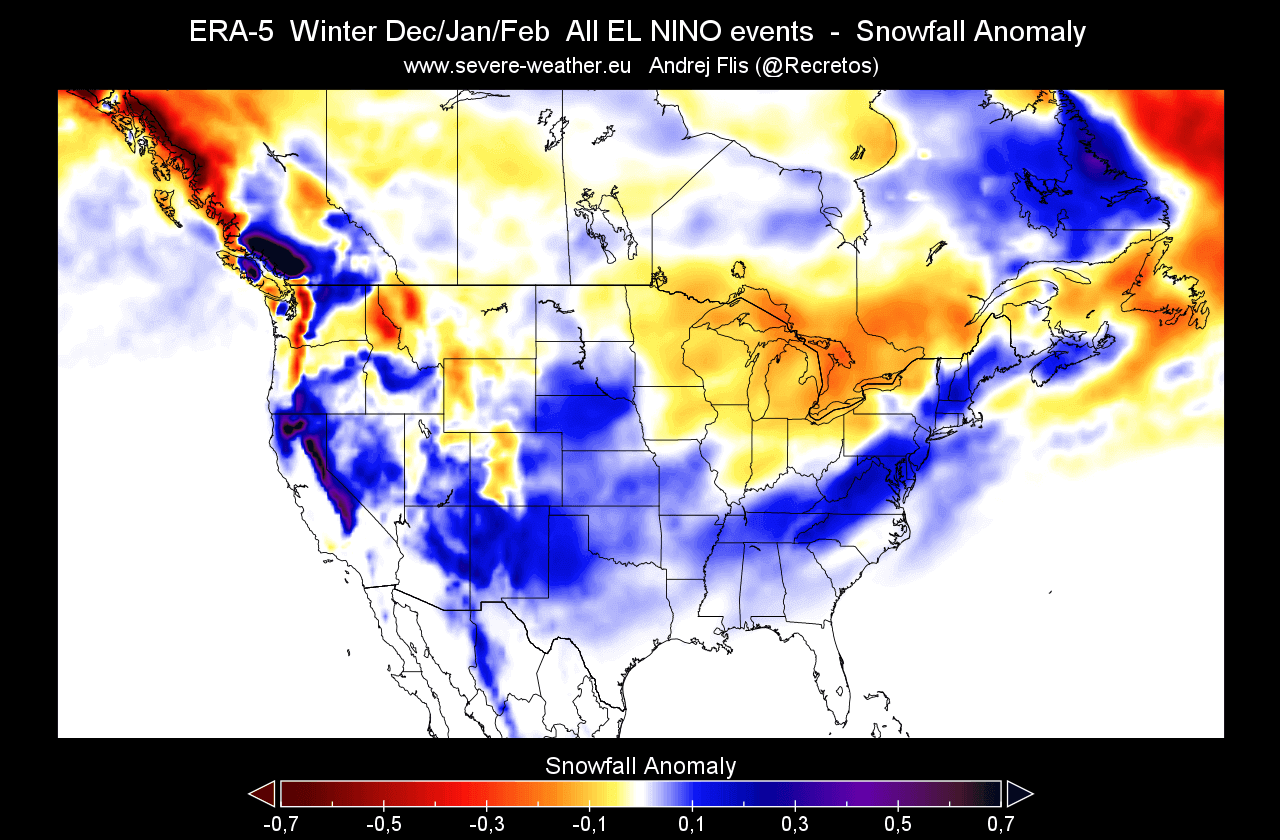
This is mainly due to low-pressure systems trailing across the southern United States. With cooler air and moisture (if available), the chances of snowfall increase in the southern half of the country and towards the east. But a lot depends on the availability of the cold air from the north.
Less snowfall is seen over the Midwest, but that is likely associated with a lack of precipitation overall, very typical for an El Niño winter.
After passing over Canada and the United States, the jet stream enters the North Atlantic, where it can take various paths toward Europe. But the ENSO effects are much less direct in Europe than in North America.
But looking at the El Niño snowfall anomalies, you can really see the path of the colder air, creating more snowfall potential from the southern UK, across central Europe, and into the southeast. This shows the potential cold air corridor, with more snowfall also across the central parts.
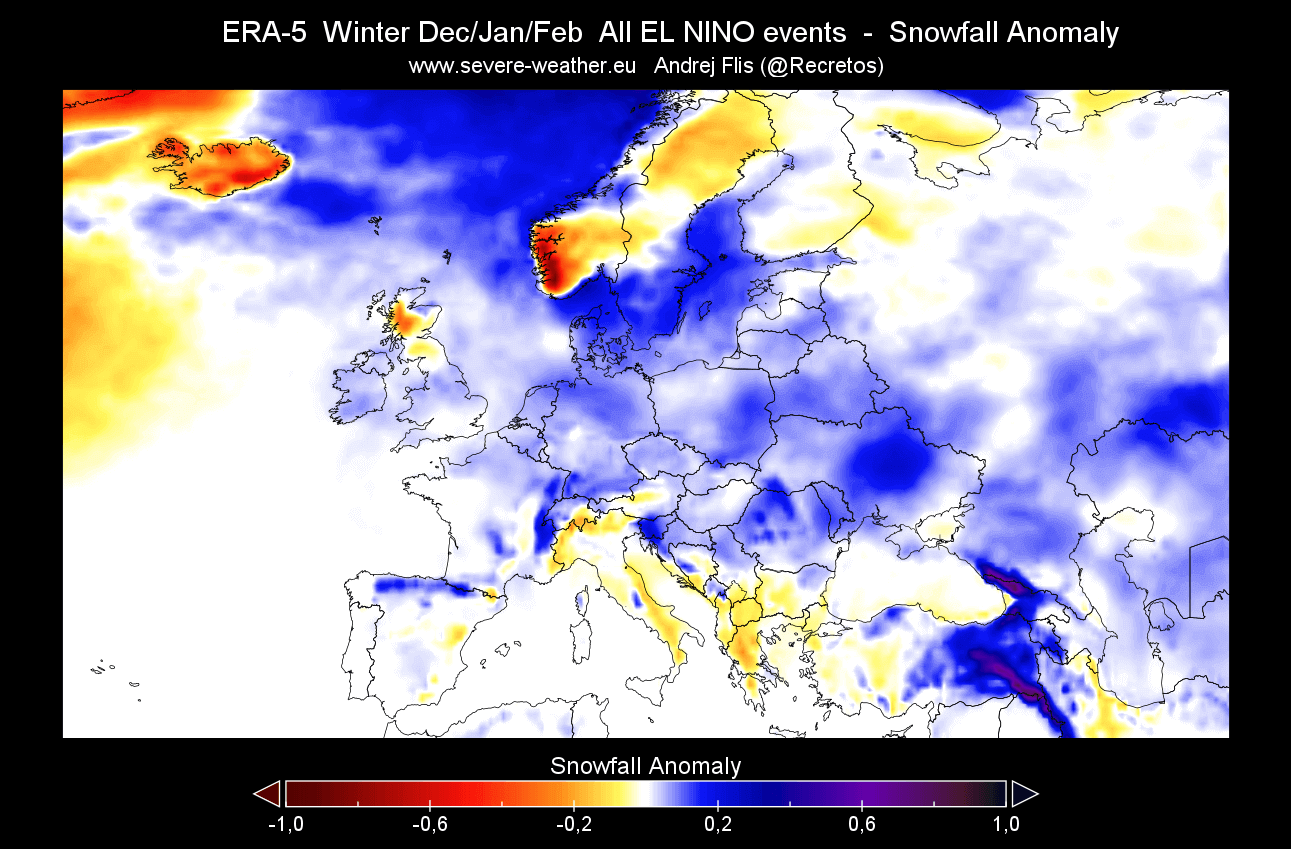
We have to keep in mind that these images show an average of many El Niño winters in the past decades. So some of the older and colder winters can shift this average image, looking a bit more snowy and colder when compared to more recent trends.
Forecast images in this article are from cyclonicwx.com and WeatherBell.
We will keep you updated on global weather development and long-range outlooks, so bookmark our page. Also, if you have seen this article in the Google App (Discover) feed, click the like (♥) button to see more of our forecasts and our latest articles on weather and nature in general.
Don’t miss:
Polar Vortex 2026 Update: New Stratospheric Warming Detected, Winter Shift Likely in January