The latest forecast update has been released by the ECMWF, and it shows a strong Winter weather pattern developing for the eastern United States in January and February. With the high pressure over the Polar regions and the El Nino event in the Pacific, there is likely an interesting season ahead.
A low-pressure area is forecast to develop over the eastern United States and northern Europe in January and last into February. This is something that the earlier winter forecasts were calling for.
The image below shows one of the variations of such a large-scale pattern, with a strong low-pressure area over the eastern United States, bringing cold weather and snow across the part of the country.
FIRST WINTER MONTH
Meteorological winter began on December 1st. But the winter solstice is on December 22nd and marks the start of the astronomical winter. Most people use the winter solstice as the start of the season, while the meteorological season is mostly used for statistical purposes and record-keeping.
So, looking at the pattern for mid-December, we can see the weather pattern that will open the astronomical winter season. You can see warmer than normal weather across much of the central and northern United States and southern Canada.
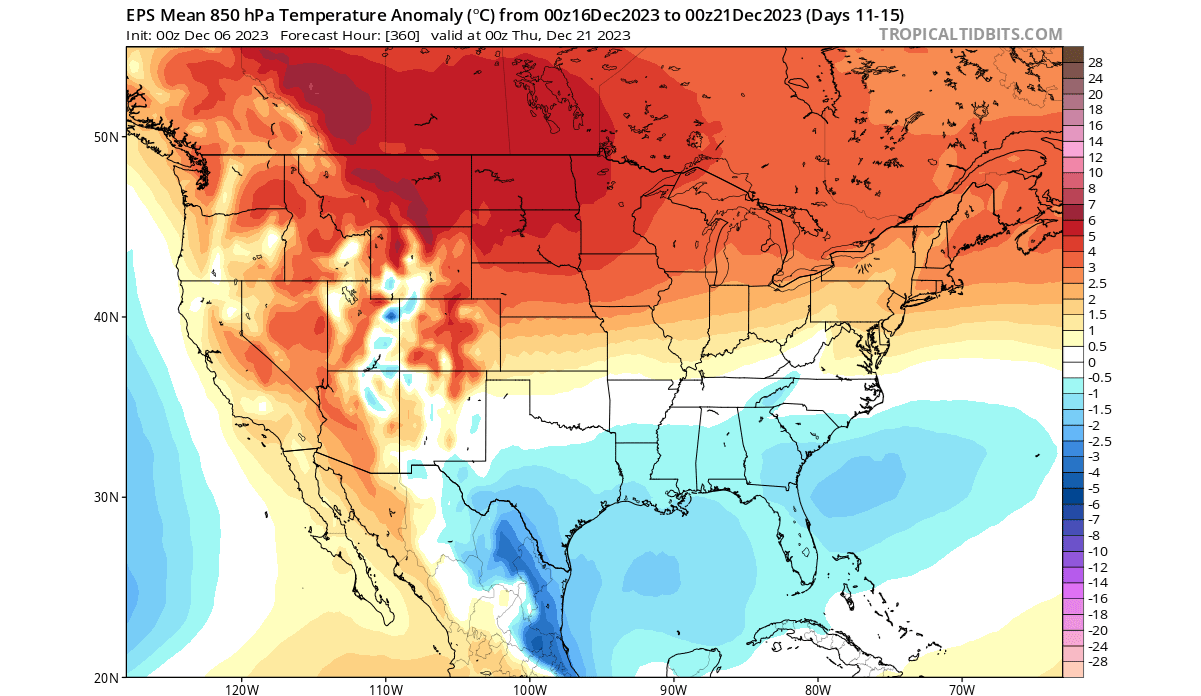
But cooler temperatures will prevail over the southern and southeastern United States, thanks to the presence of a low-pressure system over the southeast.
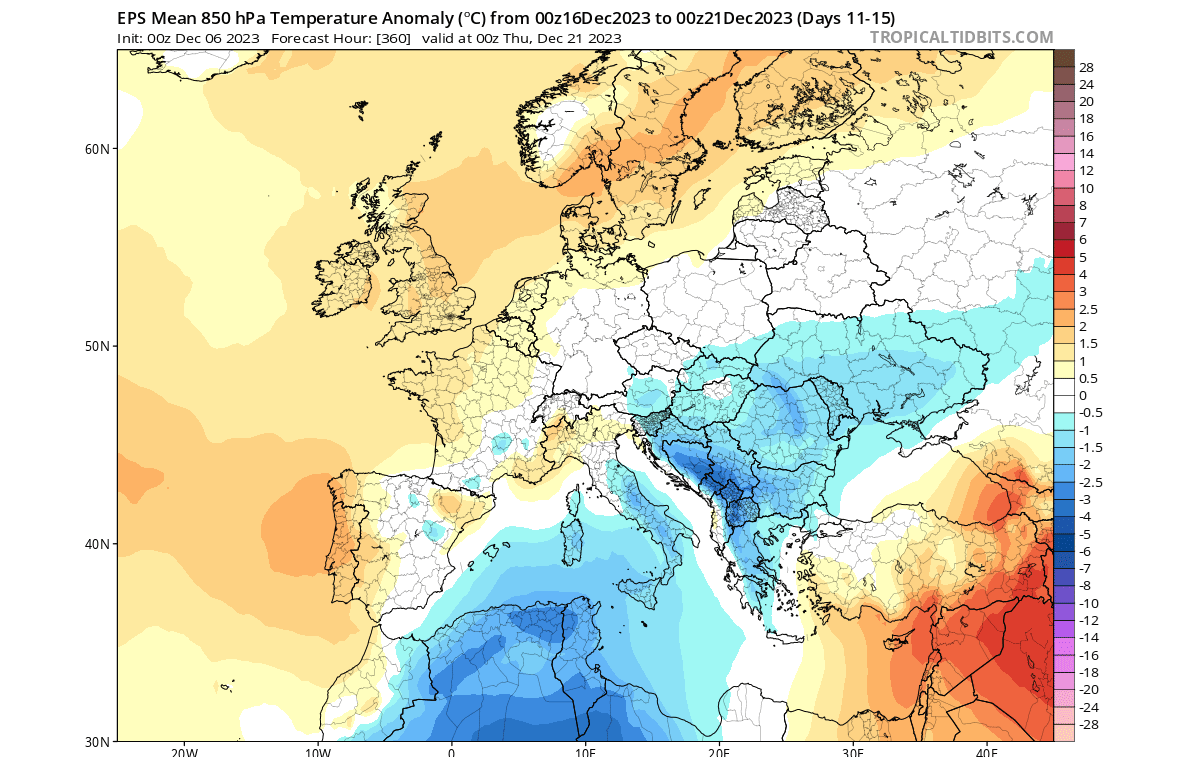
A similar pattern is forecast over Europe, with warmer anomalies over the north and colder-than-normal weather over the central and the south.
The driving pressure pattern in the mid-month will be a high-pressure zone over the North Atlantic and a ridge over the northern United States and northern Europe. A low-pressure anomaly can be seen over the southeastern United States, bringing cooler weather to the south and southeast parts of the country in this period.
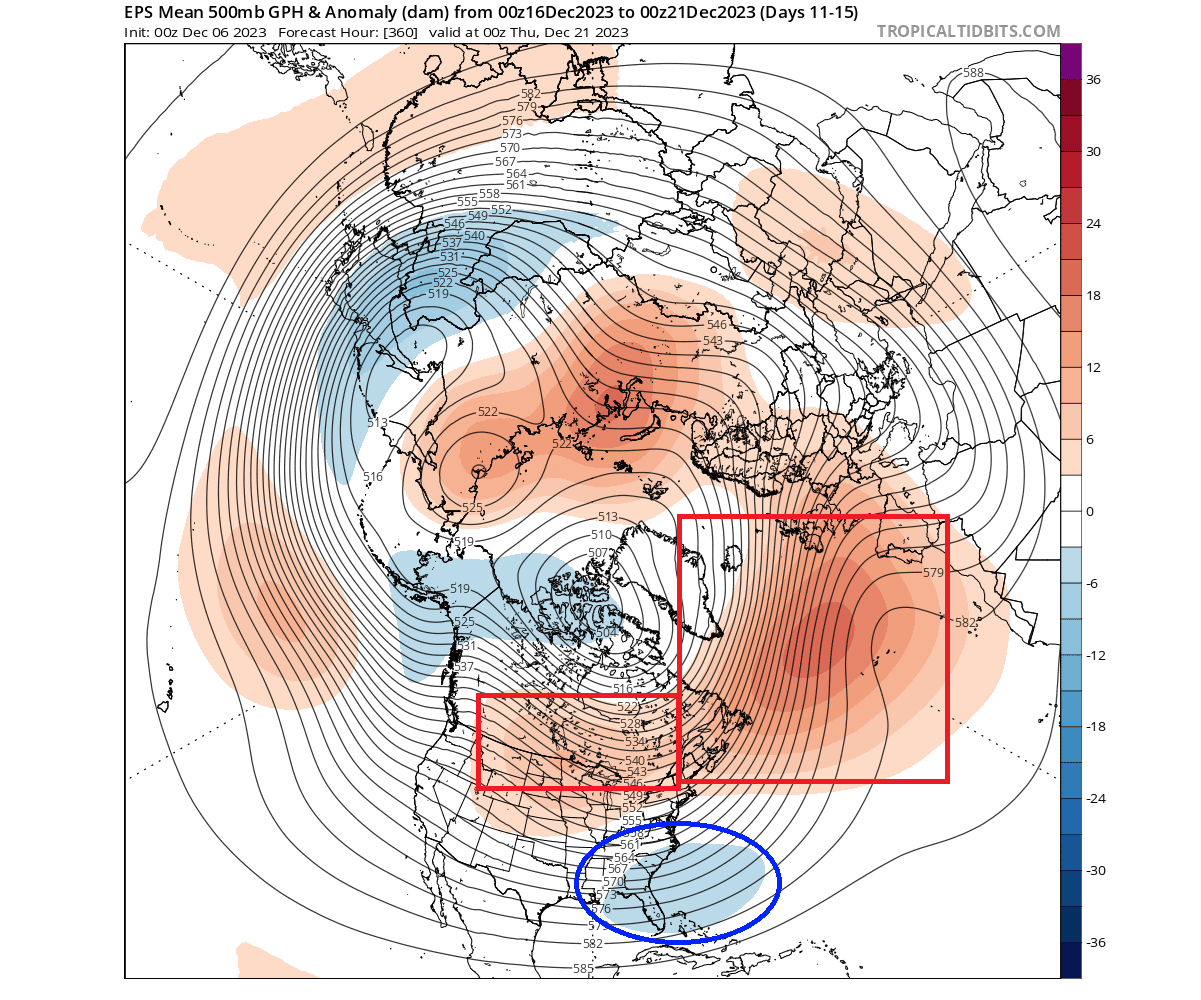
This pattern fits nicely in the overall progression of the first winter month, and was forecast in such a way by the previous long-range predictions. So, we can look at this pattern as a signal of confirmation that the long-range predictions were on the right path for the winter start.
But as you will see, the same long-range predictions now show an interesting evolution of the pressure anomalies in the middle and later parts of winter.
NEW MONTH, MORE WINTER?
January is usually regarded as the second winter month. And in many historical examples, it is when winter really starts going. But for that to happen, certain atmospheric conditions are required.
One such condition is the El Niño event, currently active in the tropical Pacific Ocean. It has a known past of strong weather effects across the United States. We will talk more about this event further down below. But first, let’s look at what the latest forecast data shows for January and February.
The graphics below show the long-range forecast from the ECMWF data, openly available by the Copernicus data hub. Images are provided by weathermodels.com, using a commercial license.
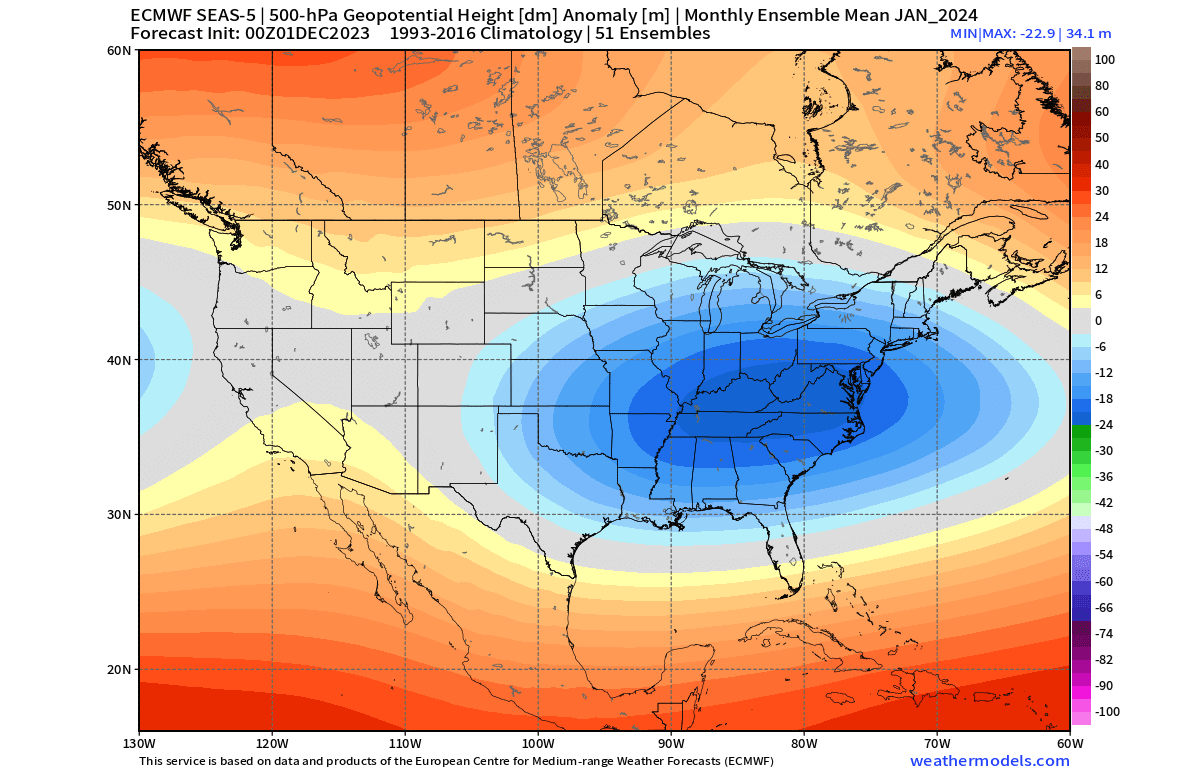
The January upper-pressure anomaly forecast is quite remarkable across the United States. You can see a broad low-pressure system across the eastern and central United States. This is in pairing with a high-pressure zone over southern Canada and a ridge over the western United States.
Looking at the surface temperature forecast for January, you can see the cold air anomaly over the central Plains, upper Midwest and over much of the eastern United States. Southern Canada and the western United States are warmer than normal due to the high-pressure influence.
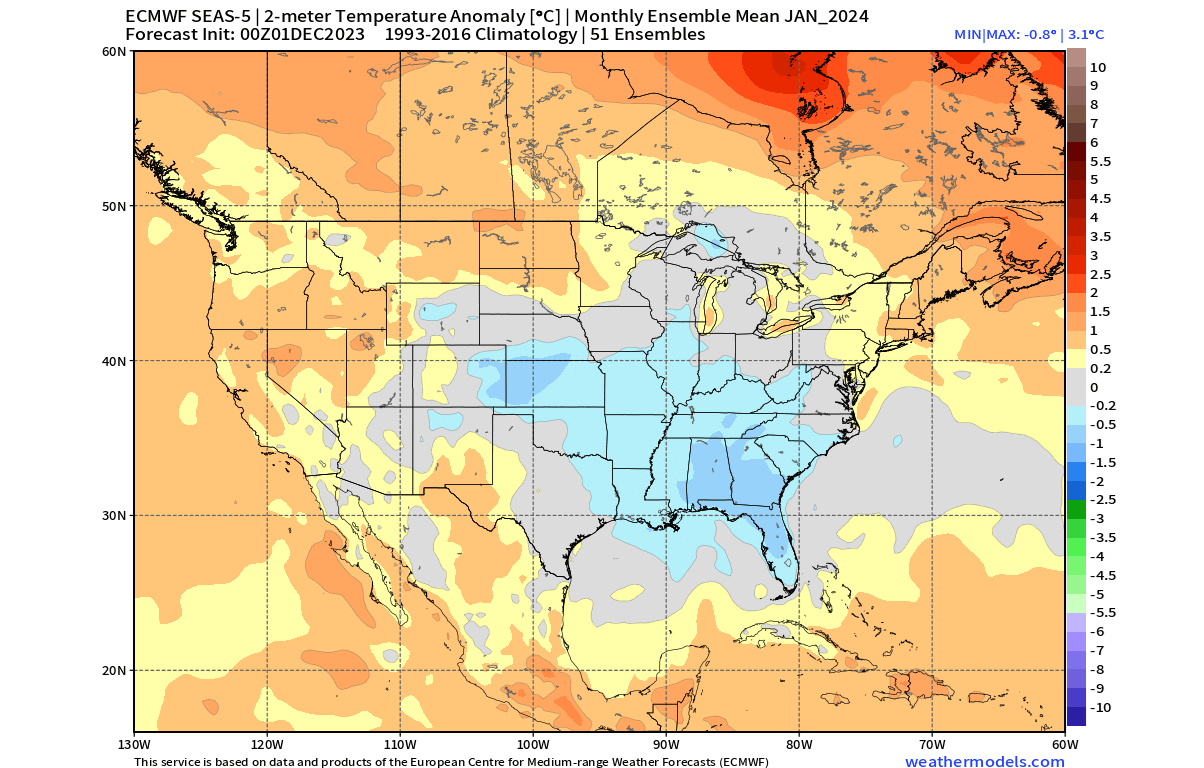
You can also see a warmer anomaly for the northeastern United States. That has to do with the fact that the rotation of a low-pressure system is counter-clockwise in the northern hemisphere. With the low-pressure area over the eastern United States, that can mean a southerly airflow into the northeast.
But, this forecast is a monthly average, and it does not mean that a low-pressure system will be stationary for an entire month over the eastern United States. It is likely that we will see a progression of a low-pressure system once or twice over the eastern United States.
And that progression does mean an eventual turn to a more northerly airflow. You can kinda see that in the image below, which shows the sea-level-pressure anomaly for January. The main surface low-pressure center is always a bit offset from the upper pattern.
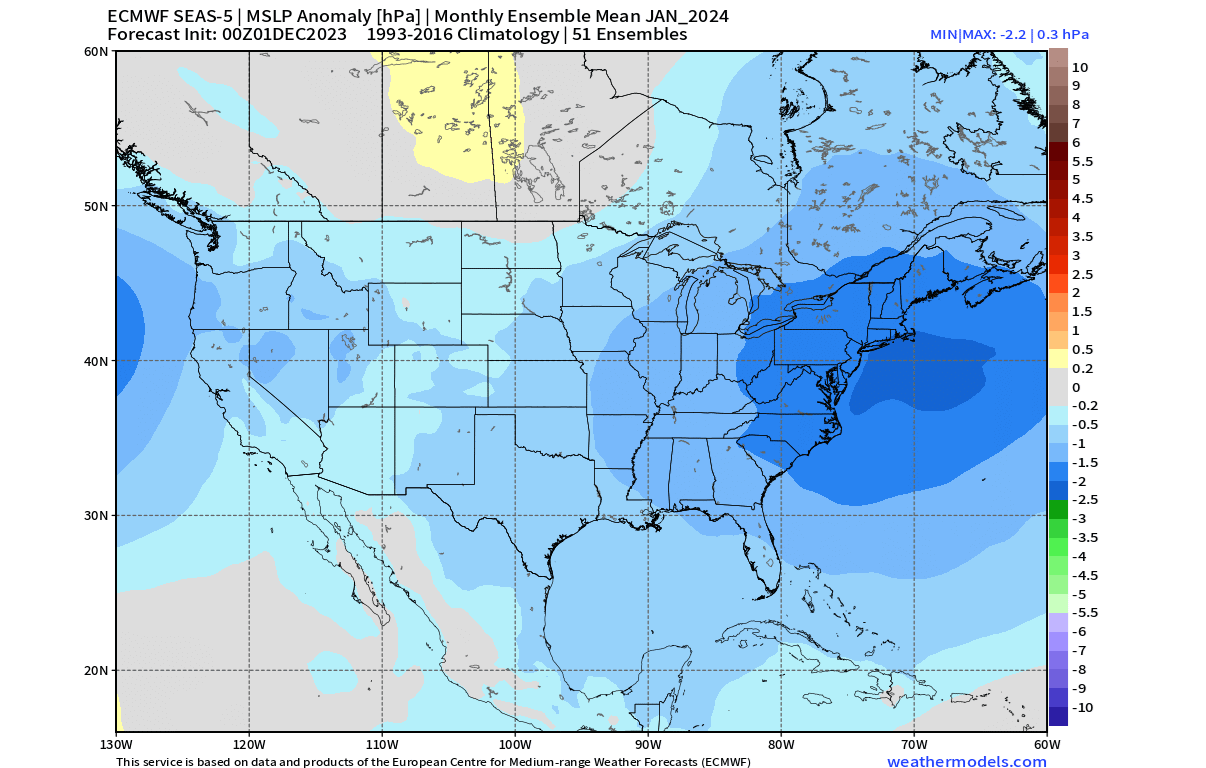
And in this case, this can indicate the potential for a “Nor’easter” event, with a low-pressure center off the coast and over the ocean. Due to the rotation of a low-pressure system, this means a northerly to a northeasterly wind over the eastern and northeastern United States.
A Nor’easter is a storm along the East Coast of North America. It got its name because the winds over the coastal areas are typically from the northeast. Nor’easters usually develop in the latitudes between Georgia and New Jersey, within 100 miles east or west of the East Coast.
These storms generally move towards the northeast, and are usually strongest around near New England and the Maritime Provinces of Canada. They bring heavy rain or snow, with gale-force winds, rough seas, and, in many cases, coastal flooding.
You can see a hint that this, as more precipitation is expected across the southeastern United States and up along the east coast, consistent with a low-pressure zone. More precipitation is also seen over the West Coast of the United States, with the enhanced subtropical jet stream.
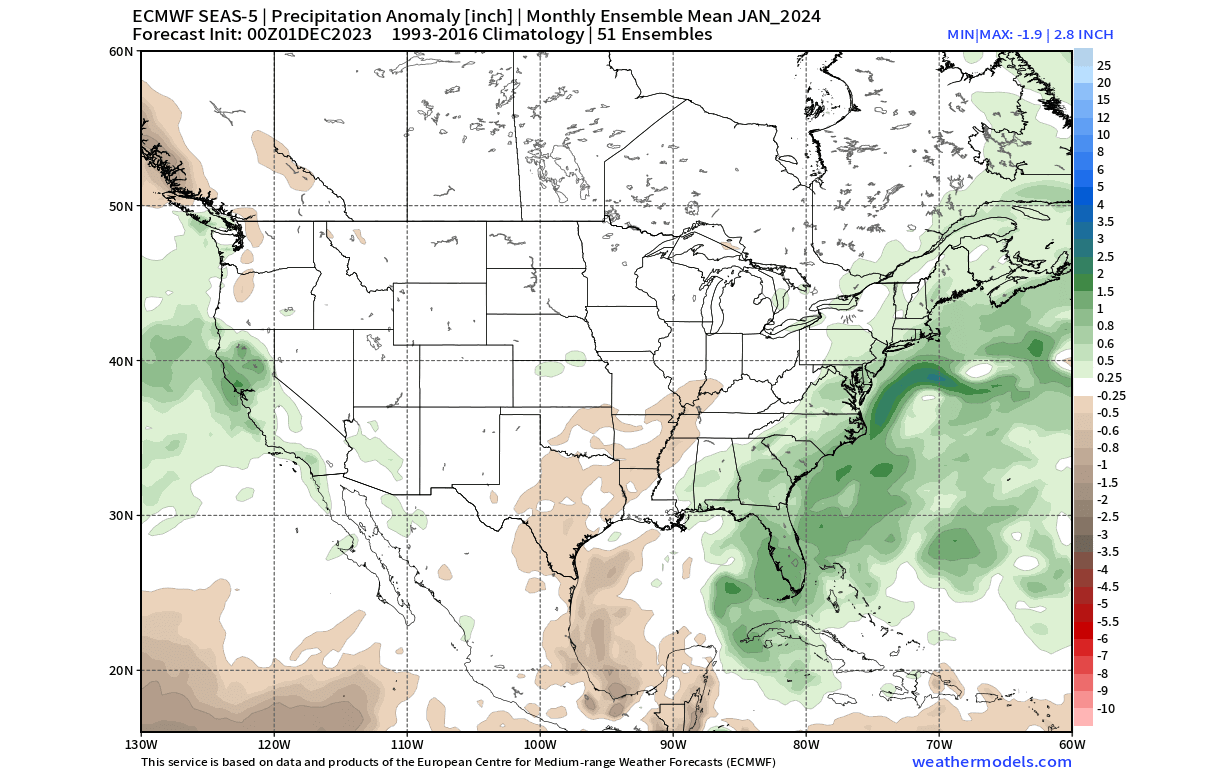
The main snowfall potential in this setup is over the eastern United States, like the Appalachians, around the Great Lakes, upper Midwest, central Plains, and the Northeast.
Looking quickly at the January pressure pattern over Europe, we can see a strong low-pressure zone over the northern and central parts. This is likely to bring a more westerly flow into the mainland and a more northerly flow over the northwest and north.
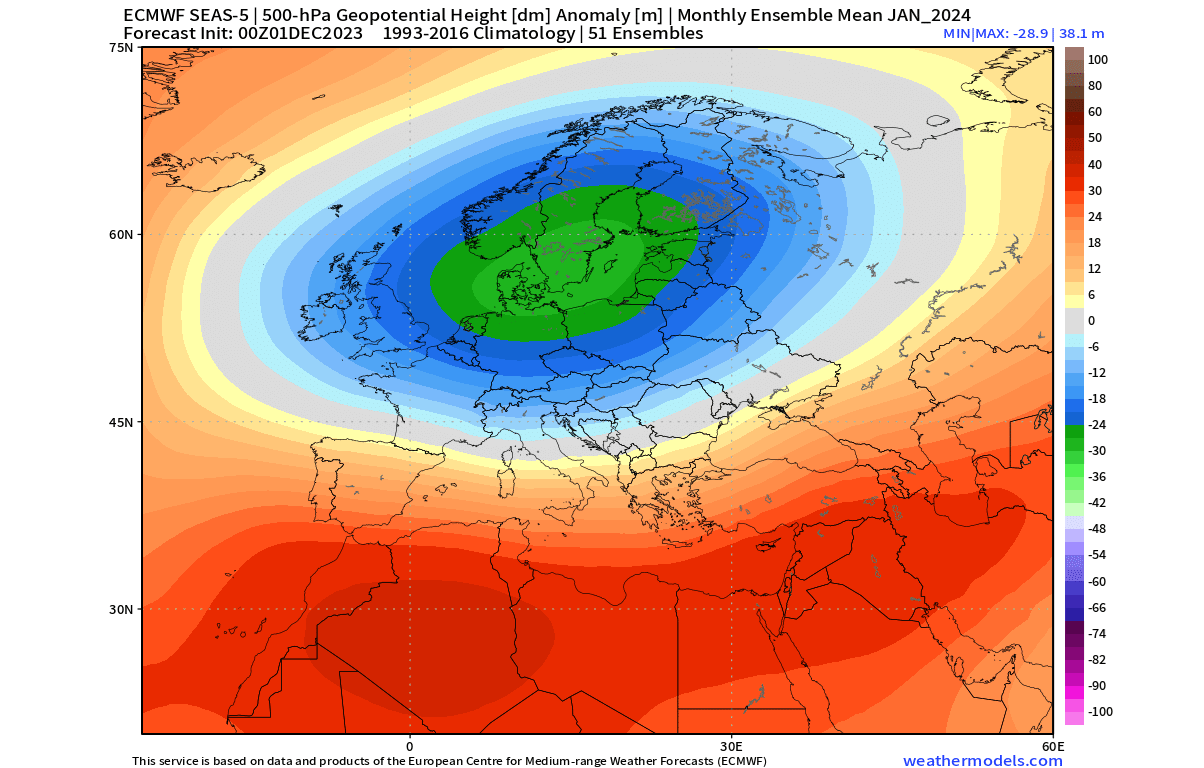
Looking at the temperature anomaly for January, there is a cold anomaly over northern Europe. Warmer anomalies are over the central and western regions due to the more westerly flow. But just like over the United States, such a broad low-pressure zone is not stationary over the entire month.
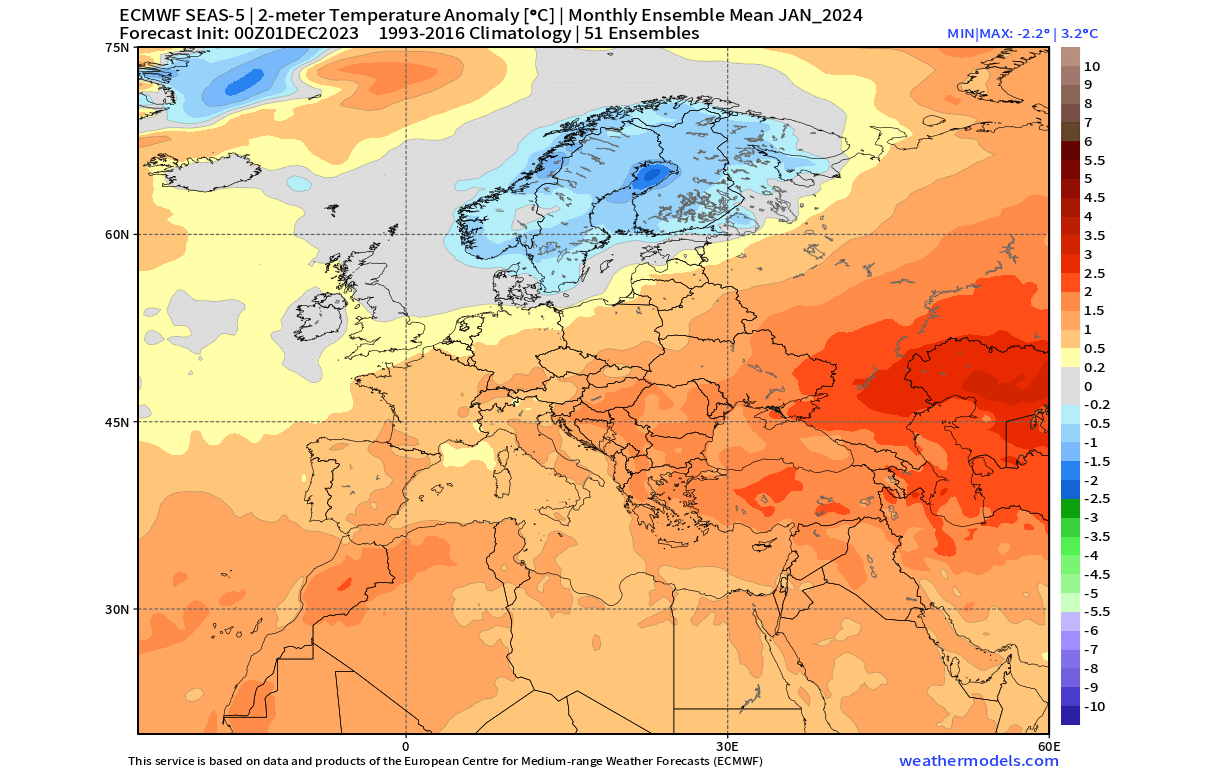
There is still a chance of a cold air outbreak across the continent as the low-pressure system drops lower down or moves further to the east.
With a low-pressure system over the north, the forecast shows above-normal precipitation over much of continental Europe in January.

But can we get an even better pattern as we head into the last Winter month?
FEBRUARY WEATHER PATTERNS
The February upper-pressure anomaly forecast shows a similar pattern to January, but it is shifted slightly to the east. And that is actually a good thing for winter weather in the eastern United States, but slightly less for the west.
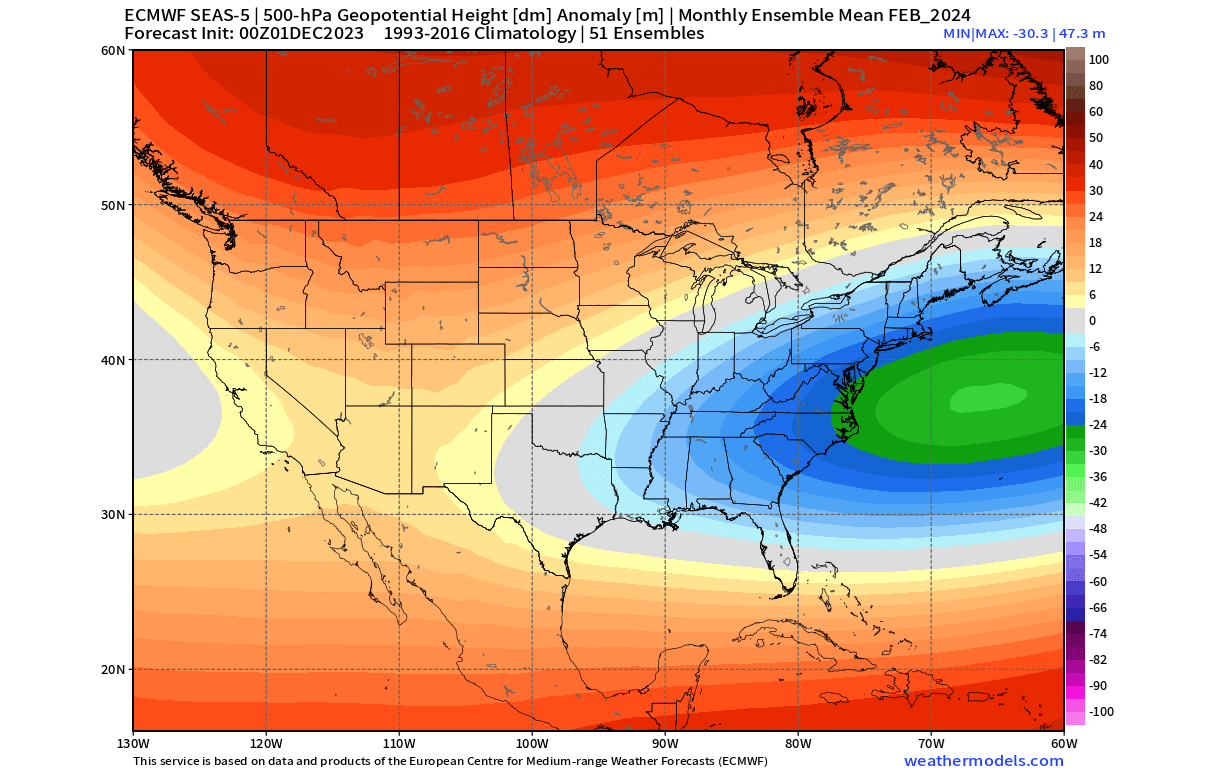
As the low-pressure system moves further to the east and over the ocean, that gives room for the ridge to strengthen over the western United States and southern Canada. In reality, the systems are connected, and they do work/move in tandem.
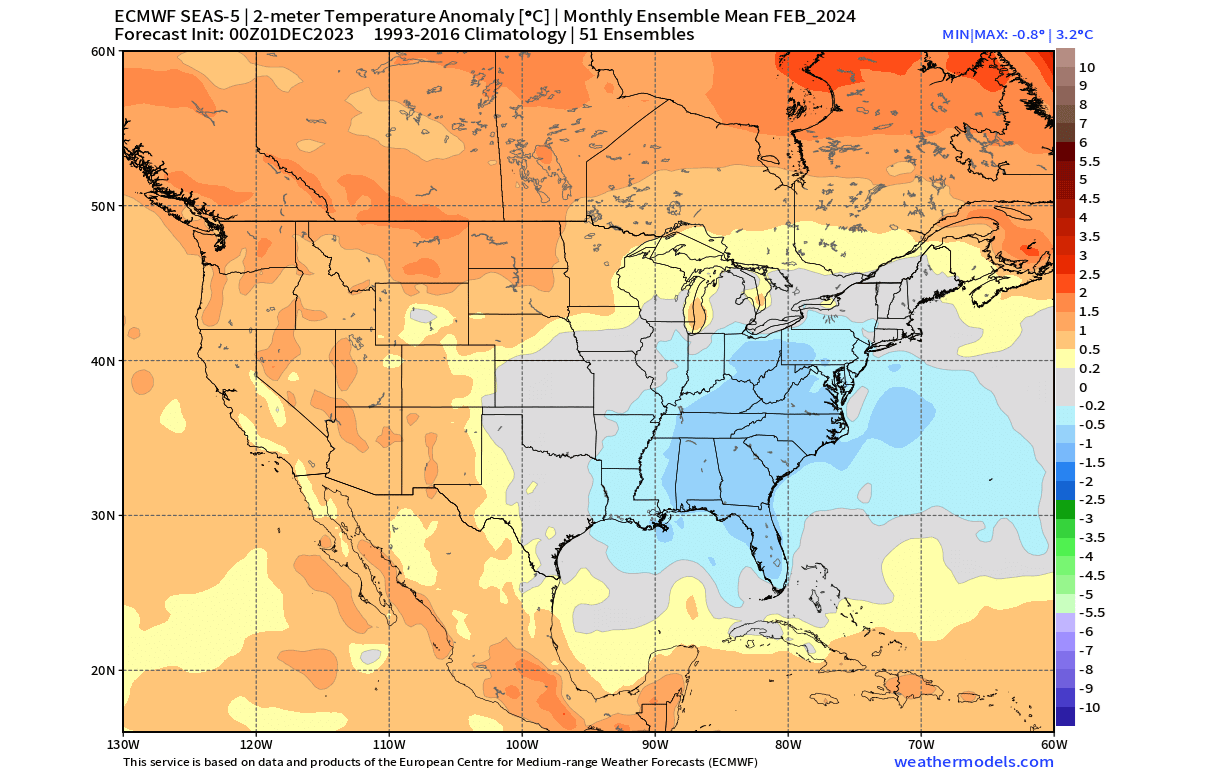
You can see that on the temperature forecast for February. There is a broad cold anomaly over the eastern United States. But as the low-pressure zone is shifted to the east, the cold anomalies now reach into the northeast, but there is less cold potential for the central United States and the northern United States.
The sea-level-pressure forecast reveals an interesting pattern in February, and that is the increased potential for Nor’easters, even more so than in January. You can see that with the low-pressure core over the ocean, meaning a northeasterly wind is prevalent over much of the eastern United States.
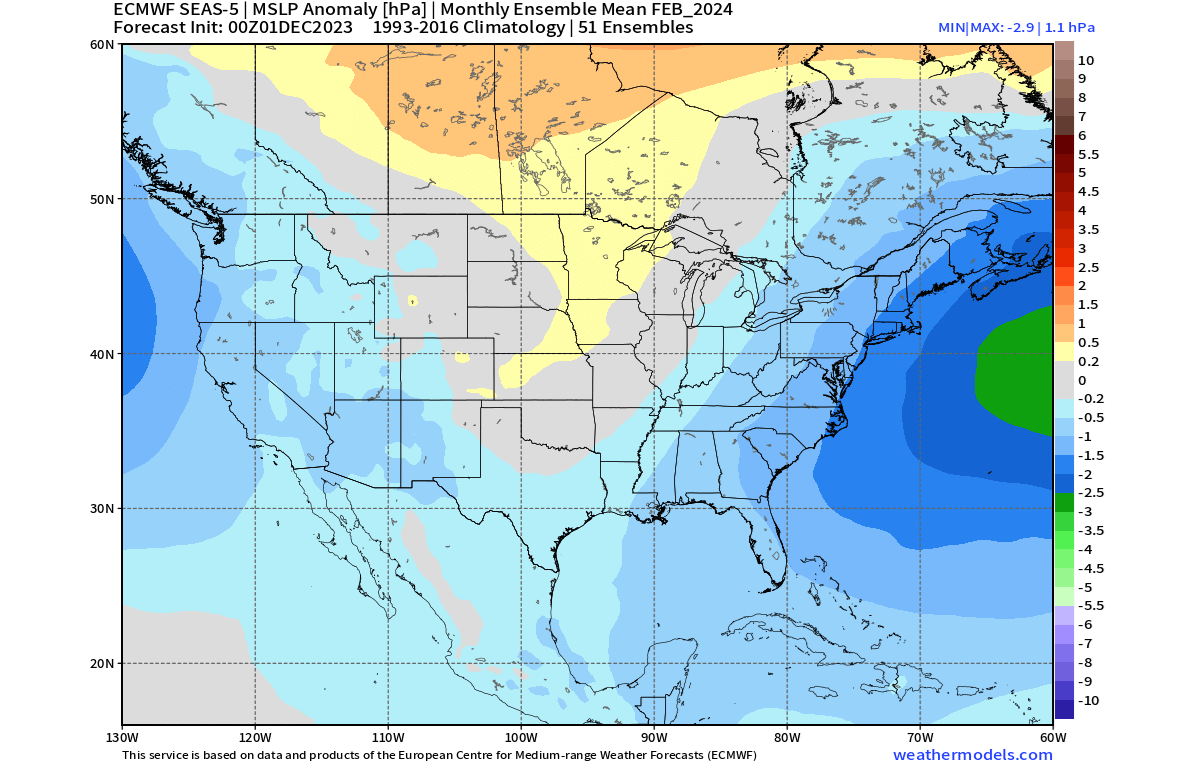
Over the western United States, warmer southerly winds will be prevalent, with a low-pressure zone just off the west coast.
More precipitation is again forecast over California under the influence of atmospheric rivers. And, of course, over the southeastern United States, under the second area of low pressure. Less precipitation is forecast over the Midwest and the Pacific Northwest.
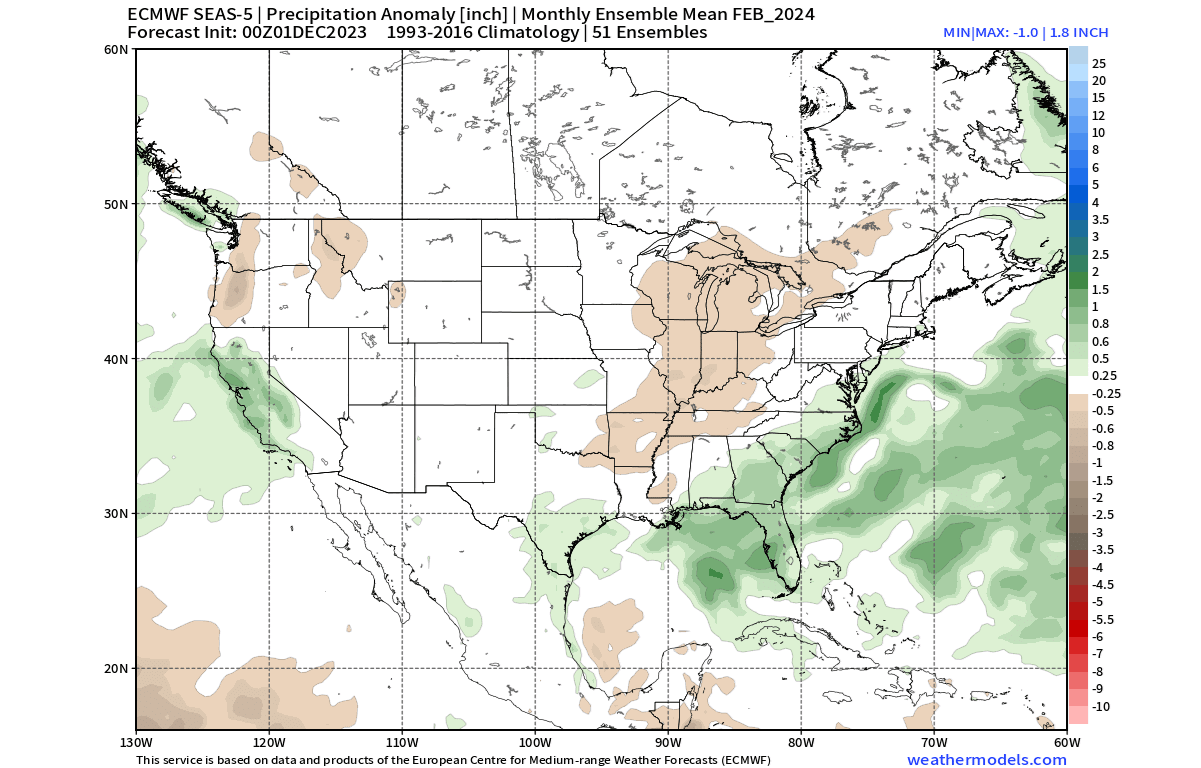
The main snowfall potential is likely to remain over the eastern and northeastern United States and the higher elevations over the west.
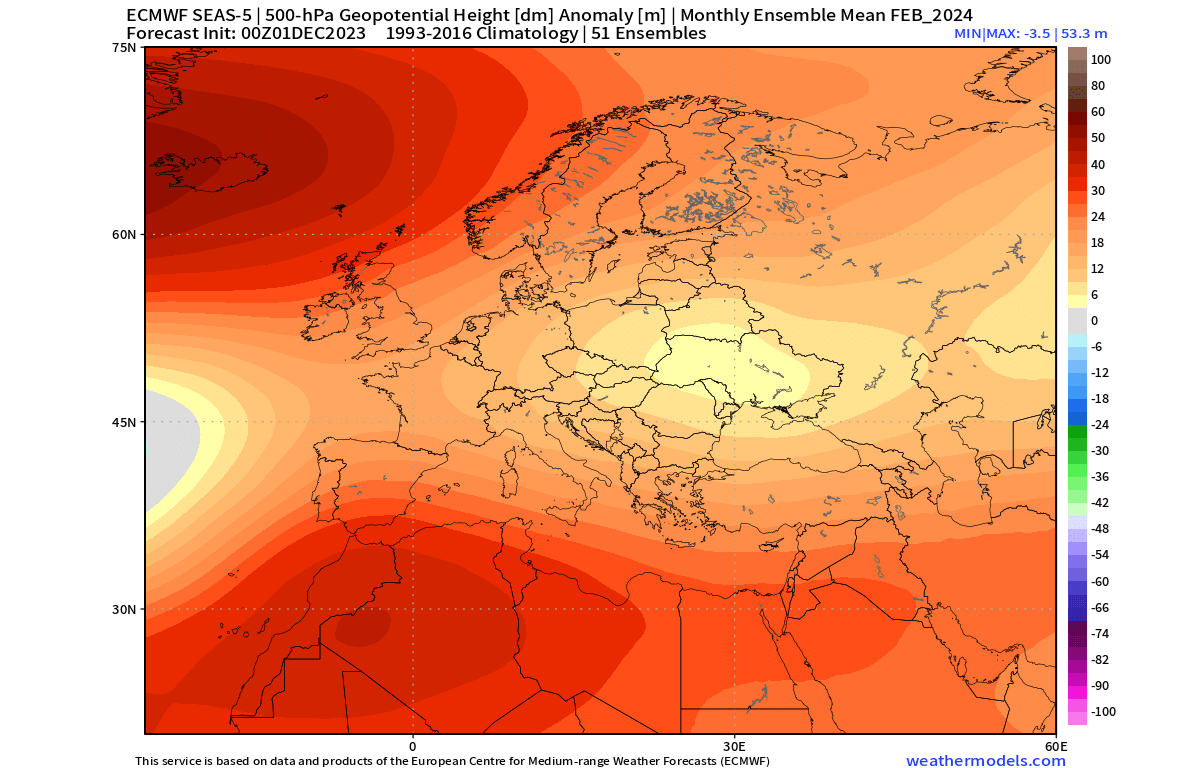
Taking a glance at the pressure pattern over Europe, we can now see a high-pressure anomaly over the far North Atlantic and northern Europe. That means a pressure drop over the mainland, but the anomalies are not strong, indicating a larger spread within the forecast, expected at this range.
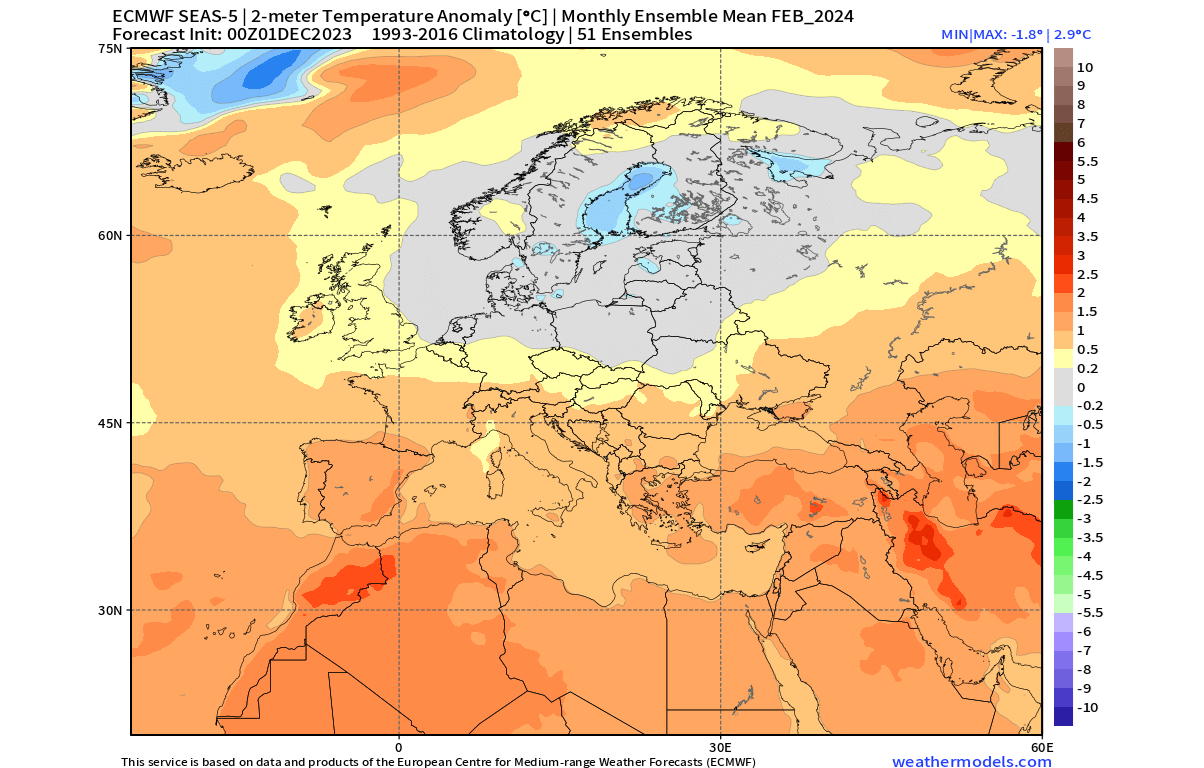
The temperature anomaly for February does not show much improvement for central and western Europe, which is rather surprising given the pressure forecast. But the border between the colder and warmer anomalies is pushed further down, indicating more northerly flow than in January.
Overall, January and February seem to reflect an atmospheric presence from the El Niño event that we mentioned before. So it’s time we take a look at this event, and why is it such a big deal.
WINTER WEATHER FROM THE OCEAN
El Niño Southern Oscillation (or ENSO) is a region of the equatorial Pacific Ocean that changes between warm and cold phases. Typically, there is a change around every 1-3 years from one phase to another.
We are currently in a warm phase called El Niño, which is expected to last into Spring 2024.
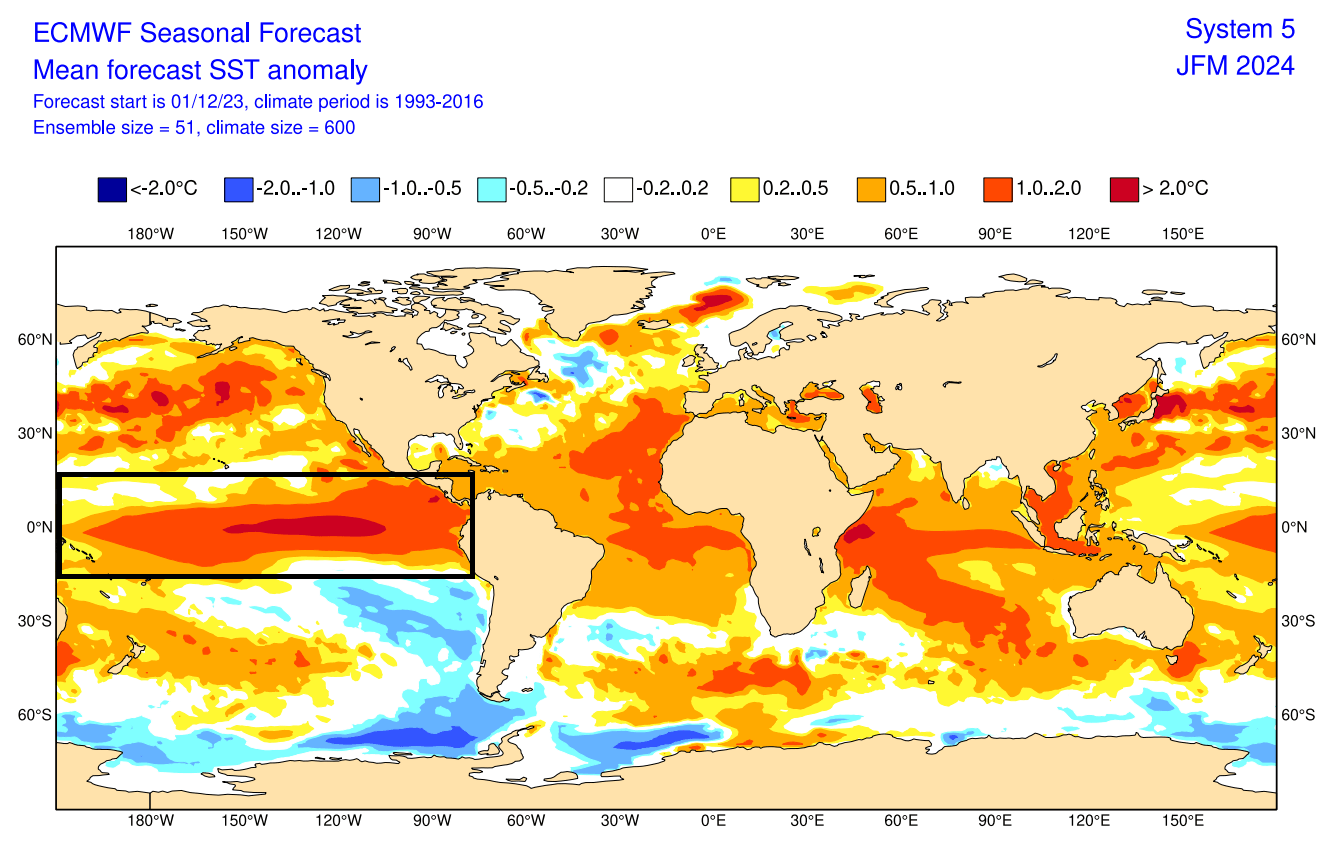
Below is also an ocean surface anomaly forecast for the January-March period. You can see the El Niño anomaly in the Pacific Ocean. The forecast shows a central/basin-wide event strong enough to have a very noticeable atmospheric response.
We produced a video showing the ocean anomalies from late Winter to Summer to better understand the ENSO development.
The cold ocean anomalies quickly broke down at the beginning of the year, with warm anomalies emerging in early Spring. This is how the El Niño event was born, as a result of large-scale atmospheric changes.
During the El Niño winter season, there is typically a strong and persistent low-pressure area in the North Pacific. That pushes the polar jet stream further north, bringing warmer-than-normal temperatures to the northern United States and western Canada.
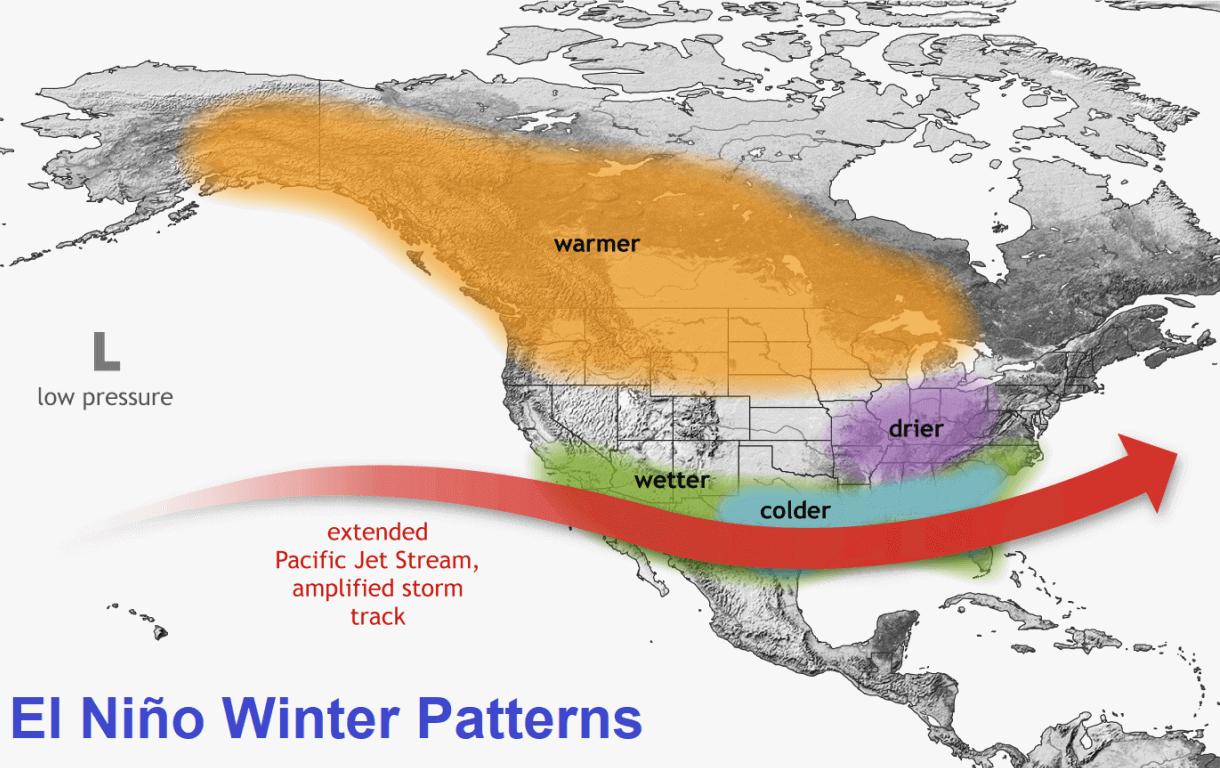
But the southerly Pacific jet stream is extended and amplified during an El Niño, bringing low pressure and storms with lots of precipitation and cooler weather to the southern and southeastern United States.
Such a pattern is similar to what we saw above in the January and February forecasts by the ECMWF. So, it is safe to say that there is a noticeable oceanic influence in the winter weather patterns in the coming weeks/months.
Below is a temperature analysis by NOAA, which shows the number of past El Niño events that were more often warmer or colder. A pattern is seen that during these events, the winters are mainly colder than average across the southern half of the United States and up into the northeast.
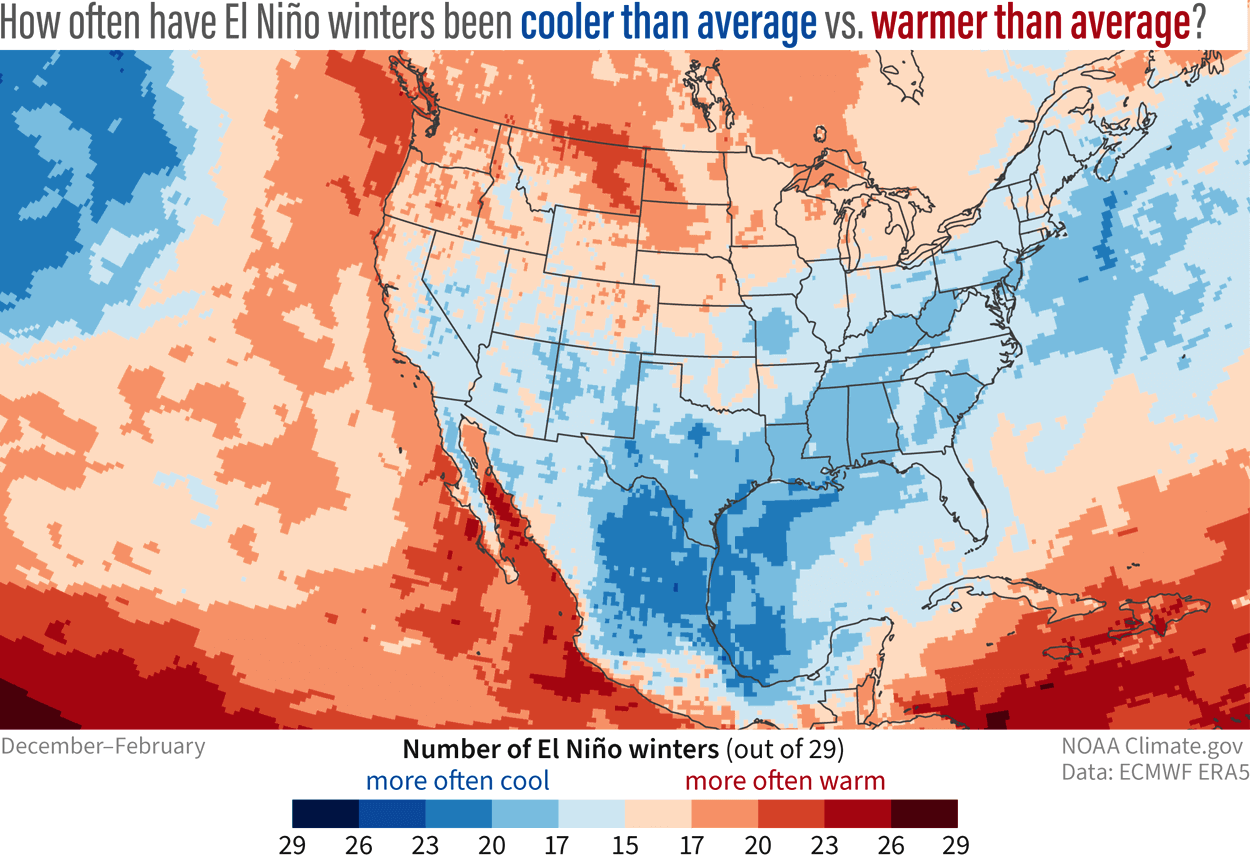
Warmer than average winters are usually over the northern Plains, upper Midwest, and the Pacific Northwest.
El Niño also changes the snowfall patterns, as seen in the image below. Some of the areas with more snowfall during an El Niño include New England, parts of the mid-Atlantic, parts of the mid-south, the southeastern United States, as well as the plains, four corners, and southwest. Image by meteorologist Ben Noll.
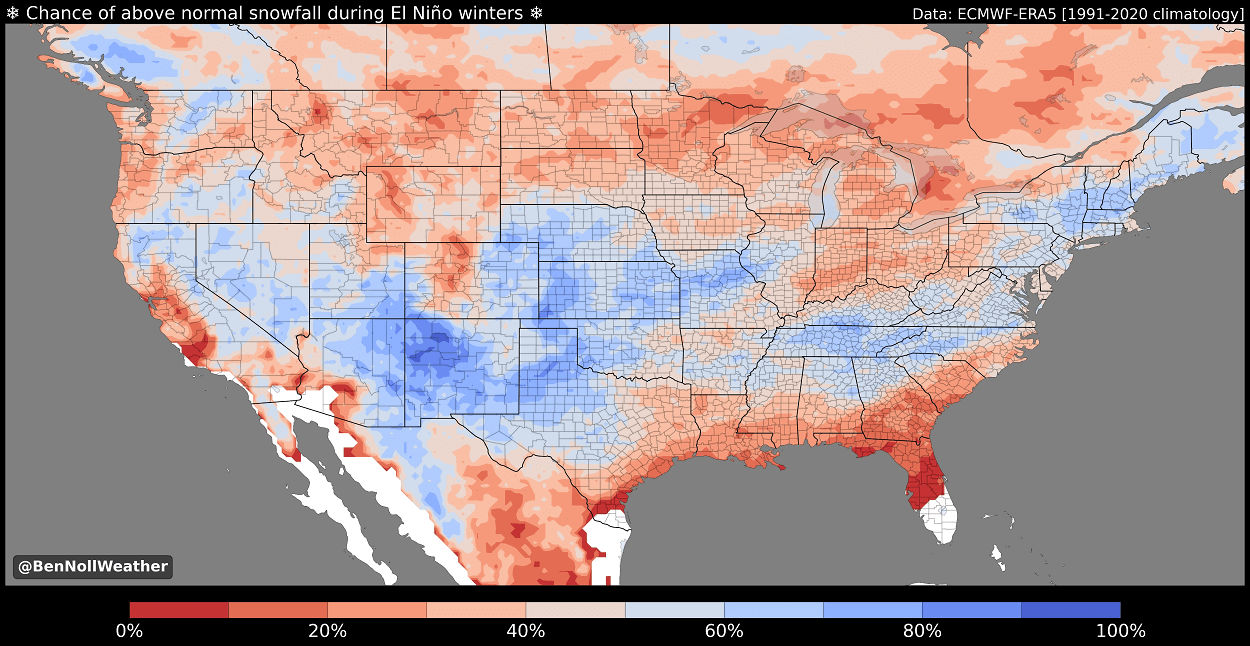
The main drivers behind this pattern are low-pressure systems trailing across the southern United States. More moisture increases the chances of snowfall in the southern half if enough cold air is available, especially towards the east and northeast, where temperatures are usually lower.
Less snowfall is usually seen across the deep southern United States, Ohio Valley, Midwest, northern Plains, northern Rockies, and Pacific Northwest.
We will keep you updated on the developing weather trends in the coming weeks, so make sure to bookmark our page. Also, if you have seen this article in the Google App (Discover) feed, click the like button (♥) there to see more of our forecasts and our latest articles on weather and nature in general.
Don’t miss: