A massive global weather shift is now underway as the multi-year La Niña officially dissolves, making way for a rapidly developing El Niño. Latest oceanic analysis confirms a significant subsurface warming in the tropical Pacific, with data suggesting this event could reach Super El Niño status in the second half of 2026. This shift represents a total atmospheric reset as we head into the new season.
This emerging warm phase is powered by a massive oceanic Kelvin wave currently surfacing in the eastern Pacific, driven by powerful westerly trade winds. Such intense warming in the tropics will greatly alter the global jet stream, impacting temperatures and precipitation across North America, Europe, and the rest of the Northern Hemisphere this summer.
In this first Summer 2026 forecast, we analyze the latest oceanic and atmospheric data to reveal how this new warm phase will shape the months ahead. We will then look at the first summer impacts, the potential “natural shield” for the United States during the Atlantic Hurricane season, and why the subsurface heat content signals a potential super event building for the 2026/2027 season.
The ENSO Cycle: How the Pacific Anomaly Drives the Global Weather System
Besides analyzing weather anomalies and forecast data, our main objective is also to share knowledge and explain complex weather phenomena in a simple way. For this reason, we often include a short paragraph of basic information at the start of an article, so even a new reader can get all the information needed to understand the global weather development.
A strong driver for this Summer looks to be ENSO, which is short for “El Niño Southern Oscillation”. This is a region of the equatorial Pacific Ocean that changes between warm and cold phases in about every 1-3 years.
These ocean phases don’t just bring the main “impact” for global weather. They also act as the “indicator light”, indicating the changes in the global weather system as this ocean area changes from a cold to a warm phase, for example.
The image below shows the ENSO regions across the tropical Pacific. The main area covers the central part, shown in the image as the Niño 3.4 region. In this region, we determine the ENSO phases by looking at the sea-surface temperature anomalies (warmer/colder).
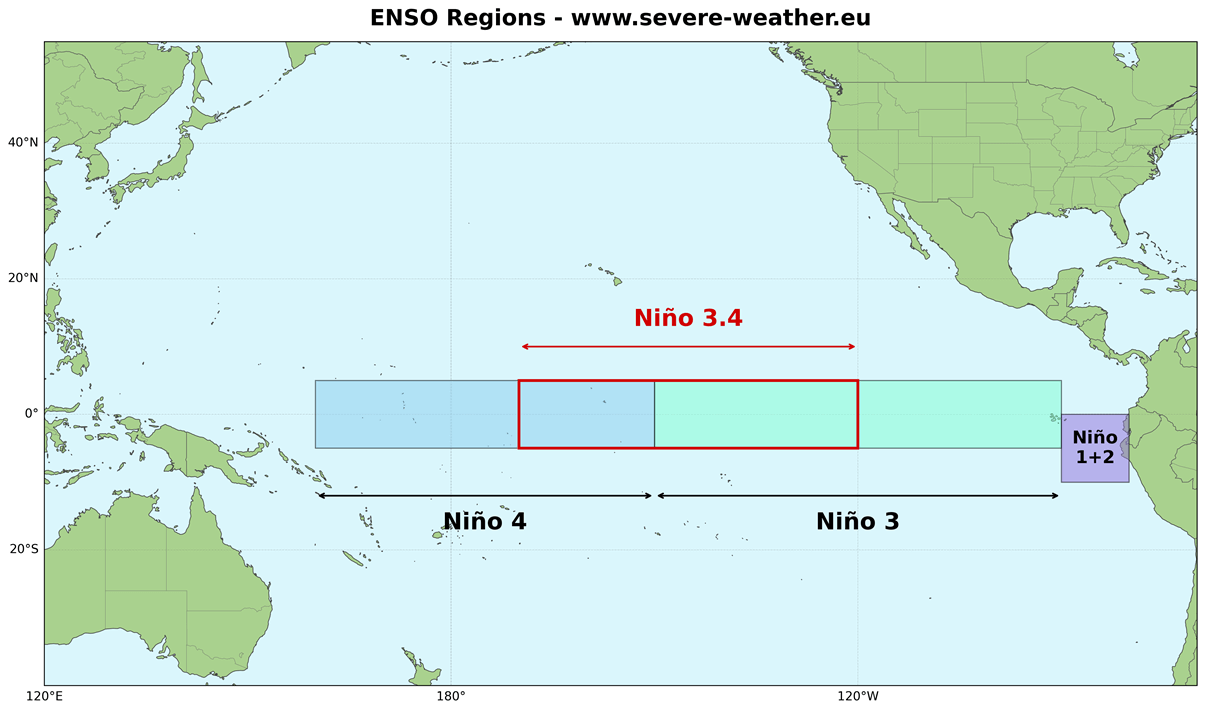
The cold ENSO phase is called La Niña, and the warm phase is called El Niño. Each ENSO phase has a major influence on the complex ocean-atmosphere feedback system. These changes gradually affect global circulation, altering weather patterns worldwide.
A specific phase usually develops between late summer and early fall and typically lasts until next summer. But some events can start sooner, and can last even up to two years, called “double”, or can be really strong, like a “Super El Niño”.
In the image below, you can see a direct comparison between ocean temperature anomalies for each of the two ENSO phases. Both phases show real data from their 10 strongest events, revealing the clear ocean signature of each phase.
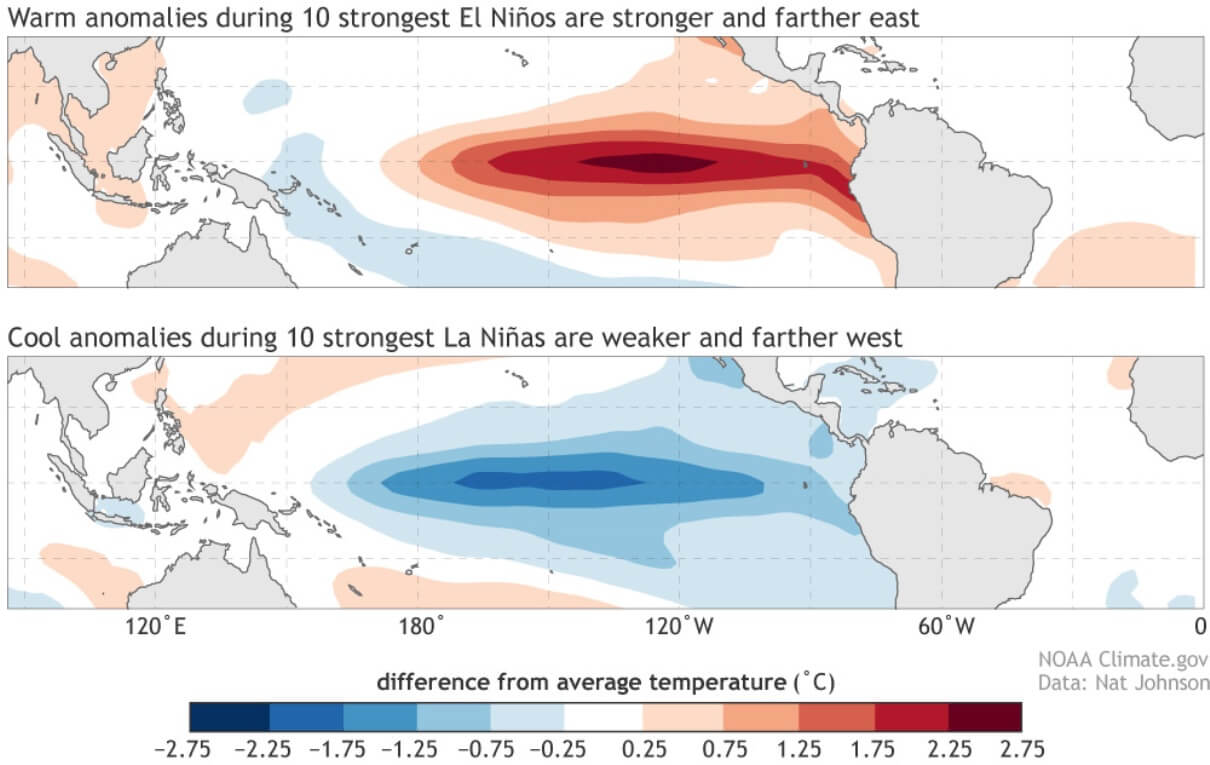
Besides ocean temperature, each phase also brings a much different pressure and rainfall impact on the tropics, which, down the line, results in a very different impact on the global weather circulation.
The tropical trade winds can start or stop a certain phase by mixing the ocean surface layers and altering the ocean currents, and thus the ocean temperature. When these easterly winds get stronger, they start pushing the water from east to west across the tropical Pacific.
This moves warm surface water towards the west, bringing up deeper (colder) water closer to the surface to replace it, starting a La Niña. This event is called upwelling. When trade winds weaken, mixing decreases, and water warms, allowing a warm phase to build.
This is much better seen in the video below, which shows the last 90 days of ocean temperature changes in the ENSO region. You can see a healthy La Niña event and how rapidly it started to dissolve in recent weeks, with a warm anomaly taking over.
This process is already clear on all analysis graphics, and even the forecasts show a clear tale of a strong El Niño emerging in the coming weeks and months.
The Great Shift: La Niña Dissolves, a New El Niño Starts Emerging
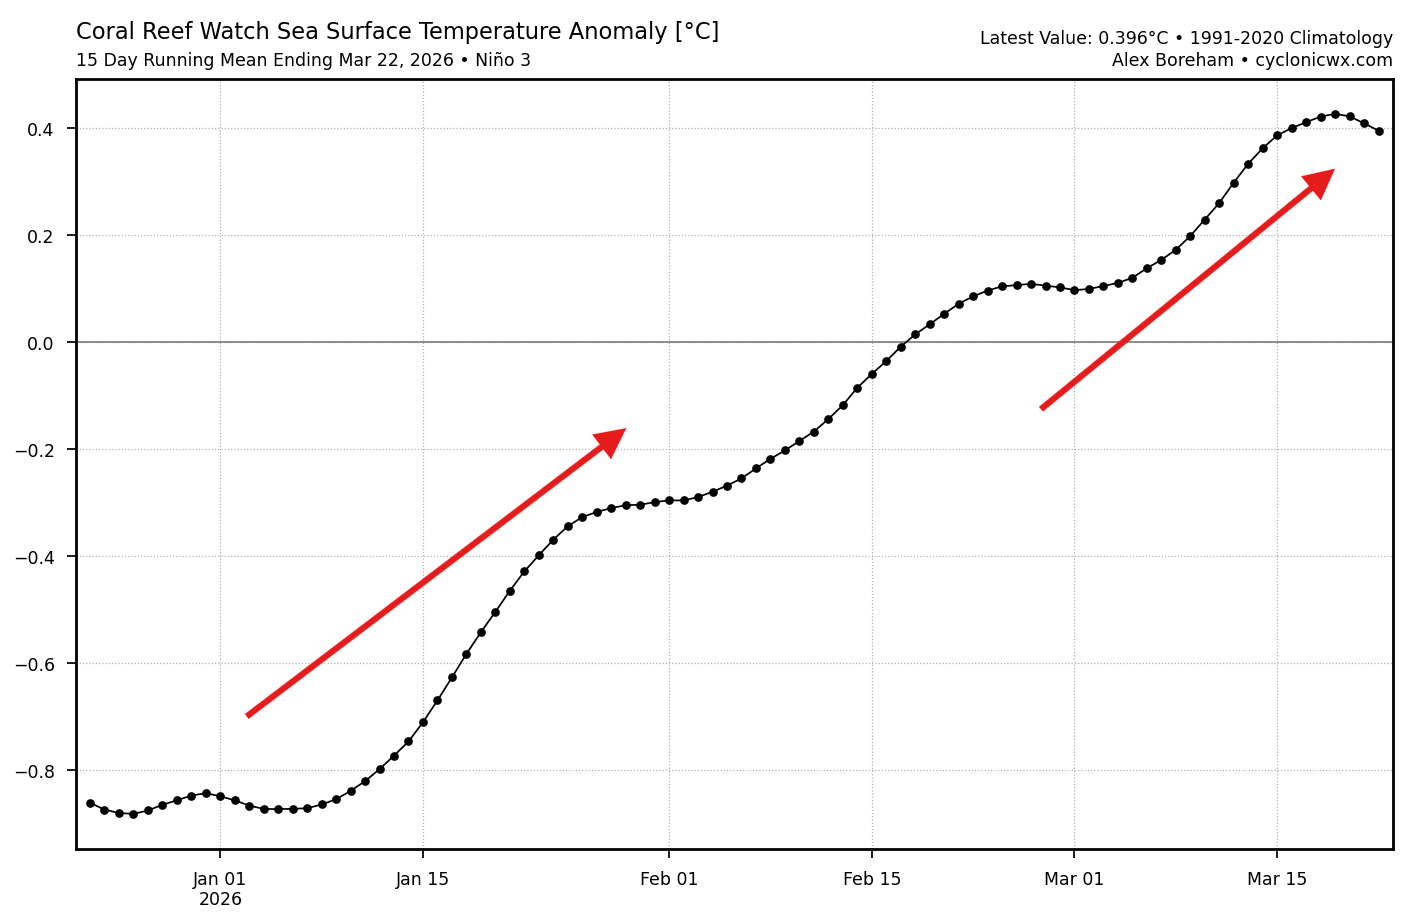
The rapid shift in the Pacific is evident when looking at the analysis graphs below, which show the anomaly data for the past 3 months in the eastern ENSO region. You can see a rapid temperature anomaly rise since late-December, now already well into positive values, completely removing the La Nina cold in the east over just a few weeks.
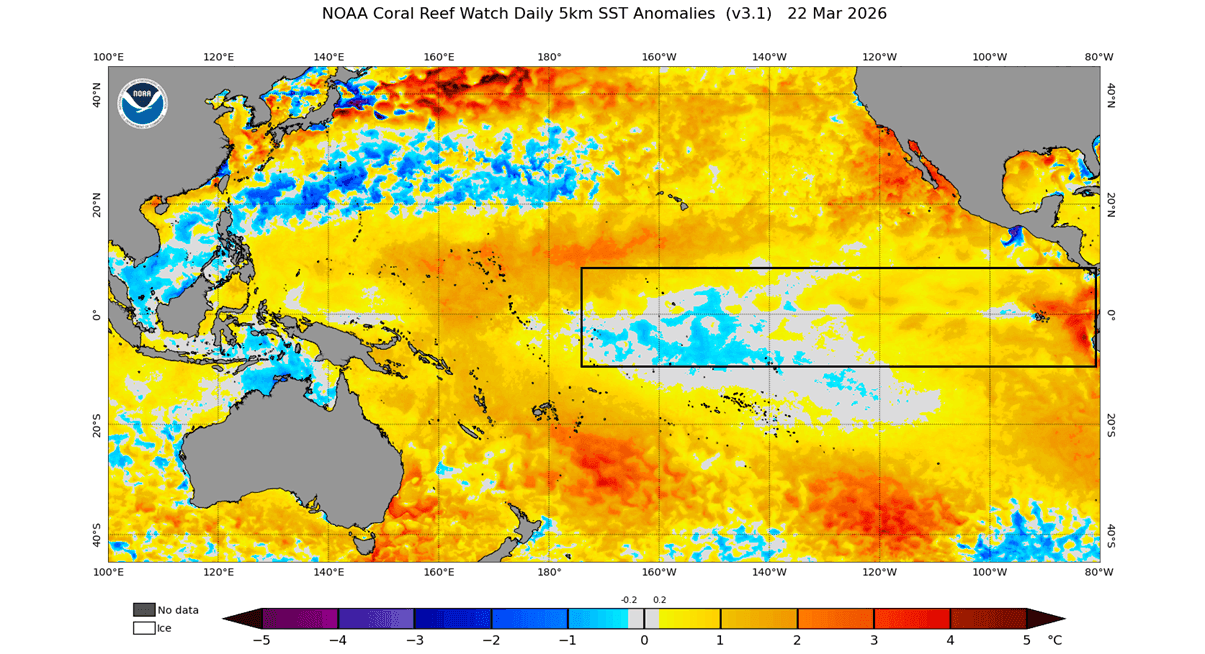
The latest ocean analysis below shows the main ENSO region with some leftover cool patches in the central ENSO area, but the average anomaly for the whole region is already positive. The largest expansion of warm anomalies is in the eastern region and shows a continued westward trend, eroding the remaining cold patches.
All this is driven also by strong temperature changes deep beneath the ocean surface. The image below shows the latest subsurface ocean temperature anomalies across the tropical Pacific. A massive subsurface warm pool sits in the west, at around 100-250m (300-800ft) depth. This is called an oceanic Kelvin wave, and has expanded east, fully eroding the subsurface cold and emerging on the surface as a visible warm anomaly.
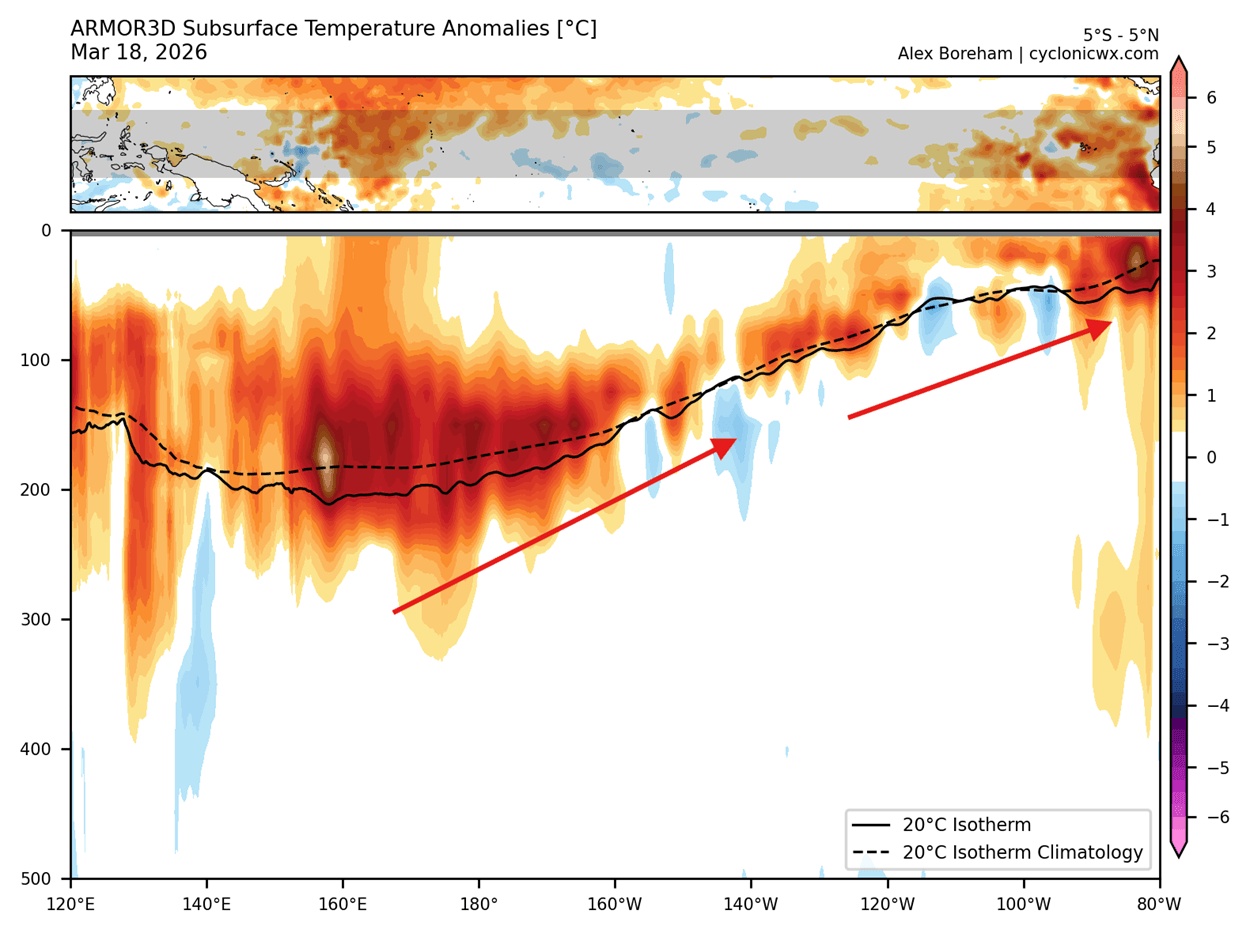
These subsurface Kelvin waves are driven by the westerly wind bursts or weaker trade winds, as mentioned above, which shows how connected this ocean-atmosphere system is.
The forecast data also reflects these massive oceanic and atmospheric changes, showing a clear indication of a rapid rise of the new El Niño event. While all the available forecasts agree on the El Niño emerging, its strength still varies, showing everything from a weak event to a Super El Niño. This is normal for this time of year.
Below is the latest ENSO multi-model forecast for the next few months from North American (NMME) and international forecasting systems (IMME). Both graphs are for the main ENSO region, showing multiple long-range models and all confirming a shift into an El Niño as early as Summer 2026.
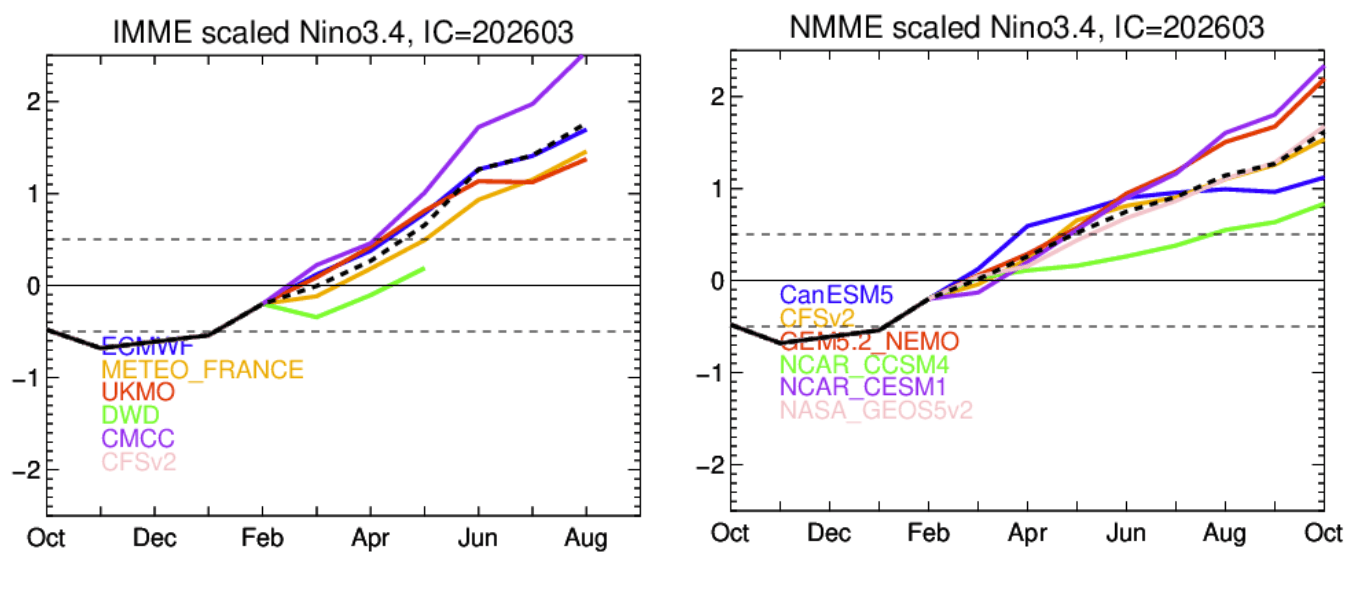
The average-to-upper value of the forecast shows an increasing likelihood for a Super El Niño to develop. Given the usual later peak of this event and the strong anomalies building, as we saw in the latest analysis above, it’s becoming increasingly likely that the 2026 El Niño will be the next “Super” event.
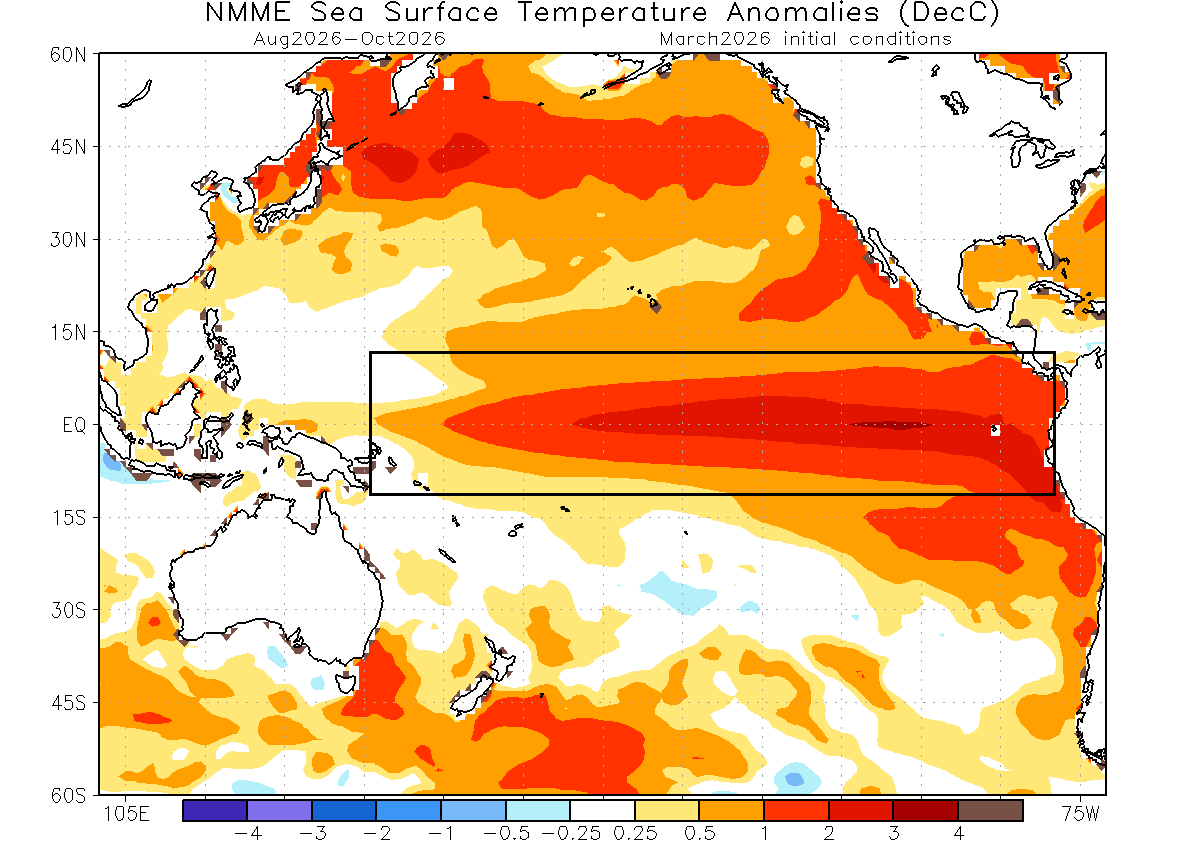
Looking also at the latest NMME ocean surface forecast for late Summer and Fall, you can already see a clear El Niño warm anomaly in the Pacific. This also shows the strength of the peak anomalies, which here reach or exceed the threshold for a Super El Niño event in 2026/2027.
A Super El Niño differs from a normal event because the warming in the Pacific becomes more intense, resulting in a stronger impact on global weather. This can lead to more extreme weather shifts, turning typical seasonal changes into high-impact events like massive flooding, severe droughts, and significantly altered storm tracks that can affect the entire planet.
Since the Summer of 2026 is already expected to feel the impacts of the emerging El Niño, we decided to look at some past data to find years with a similar shift from a weak cold ENSO phase into an El Niño. This will show us how the weather in past summers has developed in this global shift scenario.
Summer 2026: The First Impacts of the Emerging Super El Niño
We now know that the El Niño is likely to start emerging by Summer. Its impact is usually not immediate, but given the rapid nature of the upcoming event, the atmosphere is already expected to show El Niño-powered patterns.
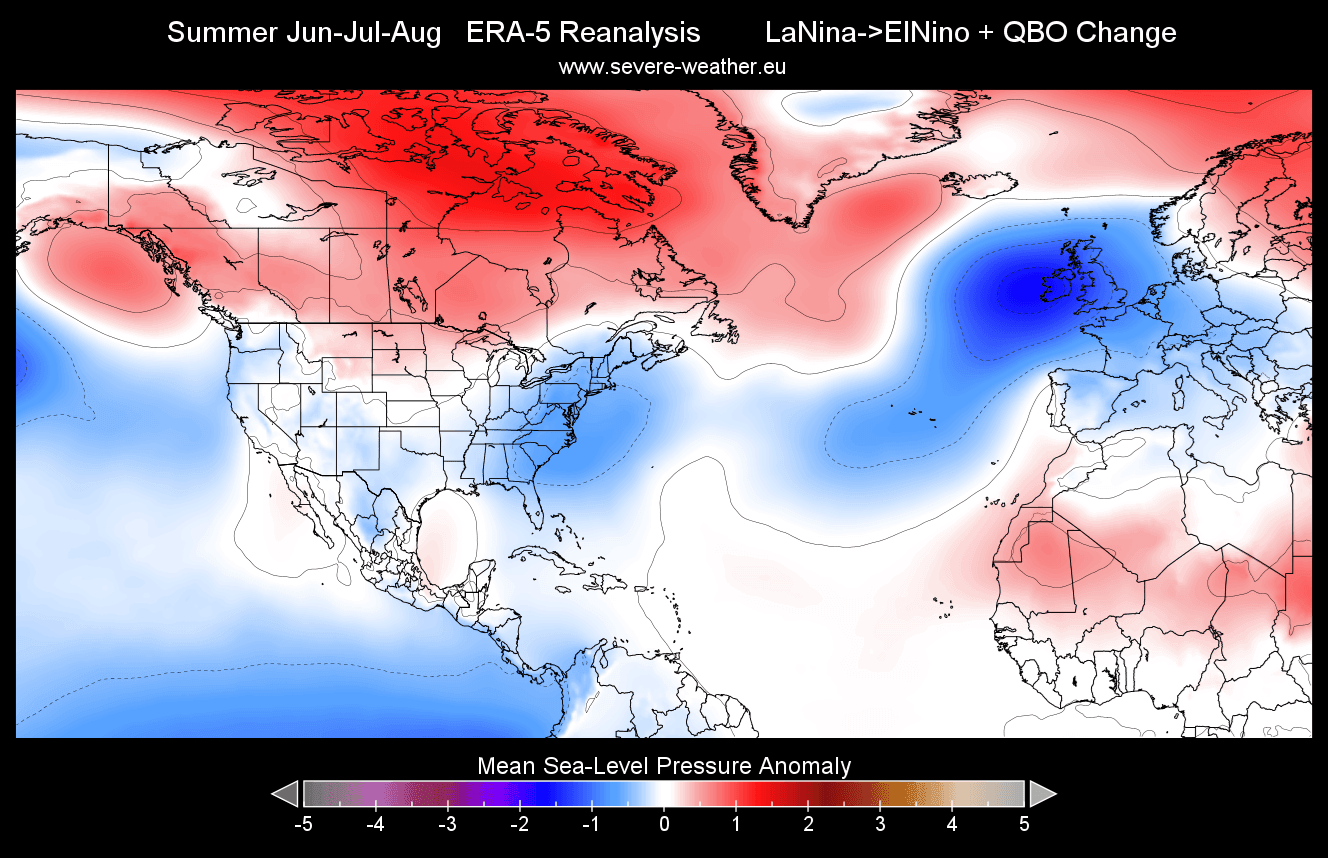
Below is the meteorological Summer reanalysis for the years with a rapid transition from La Niña to El Niño, plus a stratospheric wind change (QBO index), equal to the shift we are currently observing. The reanalysis of past such years shows a tendency for a low-pressure area somewhere over the eastern United States or eastern Canada, and over northwestern Europe or the eastern North Atlantic.
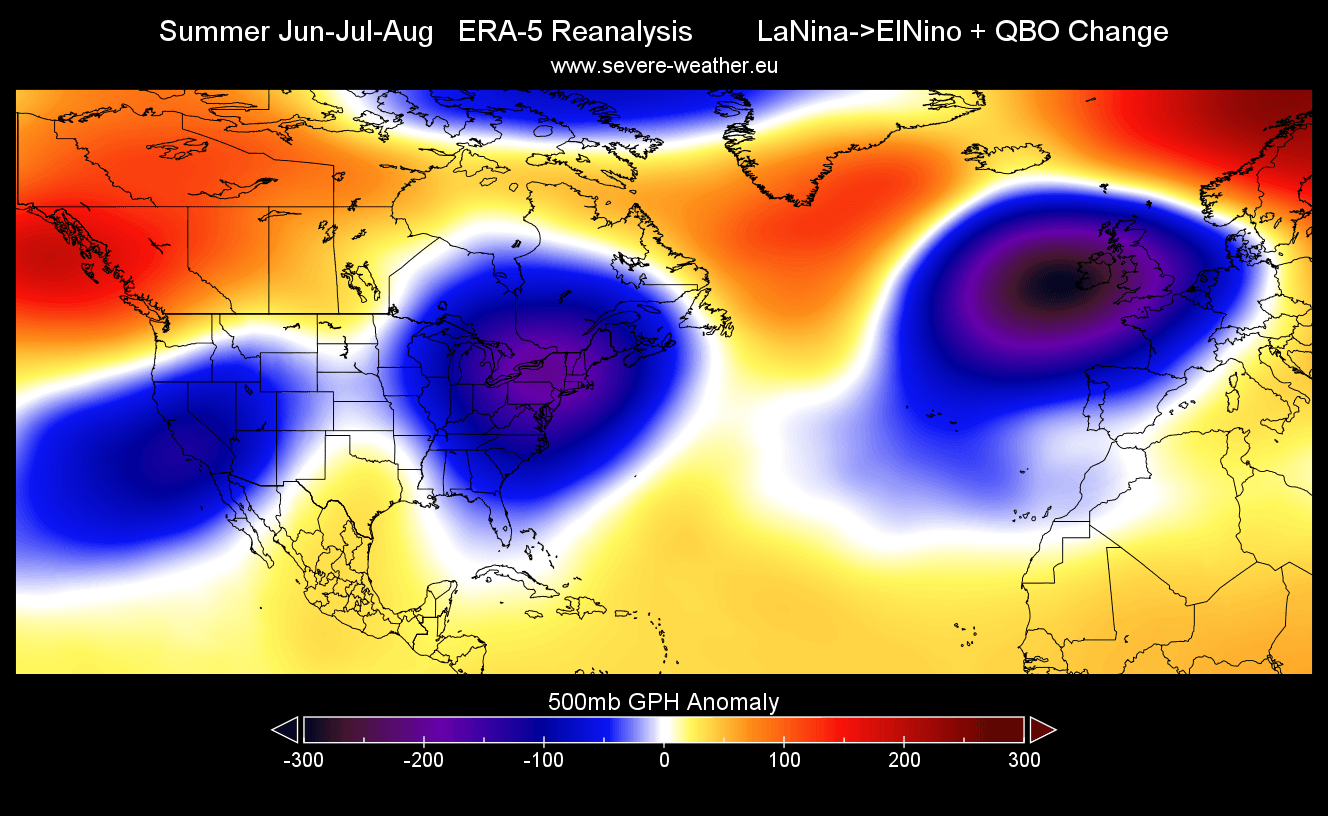
A low-pressure area over the eastern U.S. or eastern Canada supports a more northerly flow, keeping summer temperatures normal to below-normal over the northern and eastern United States. Another low-pressure zone is over the southwestern United States.
At the same time, the low-pressure position over the eastern North Atlantic can bring normal to below-normal summer temperatures to parts of western Europe, but higher temperatures towards the central and eastern parts.
Looking at temperatures from the reanalysis years, you can see a below-normal trend over the northern and eastern United States and eastern Canada. Warmer temperatures are found over the northwestern and southern United States, and over western Canada. But this is a composite from a selection of years, some from the past decades, with a slightly different climate system.
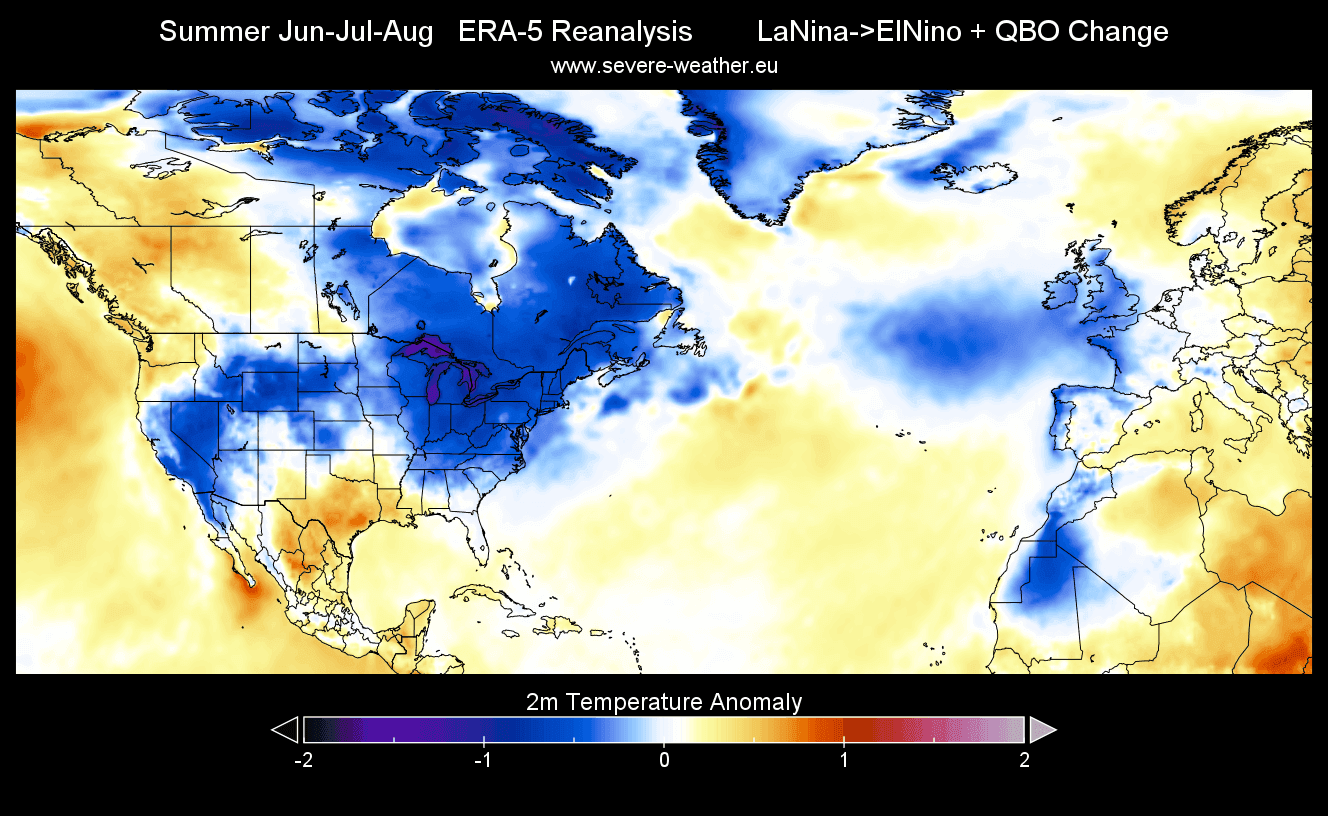
You can also see a below-normal trend in the western half of Europe, but warmer conditions in the central and eastern parts, powered by the low-pressure system in the eastern Atlantic and NW Europe.
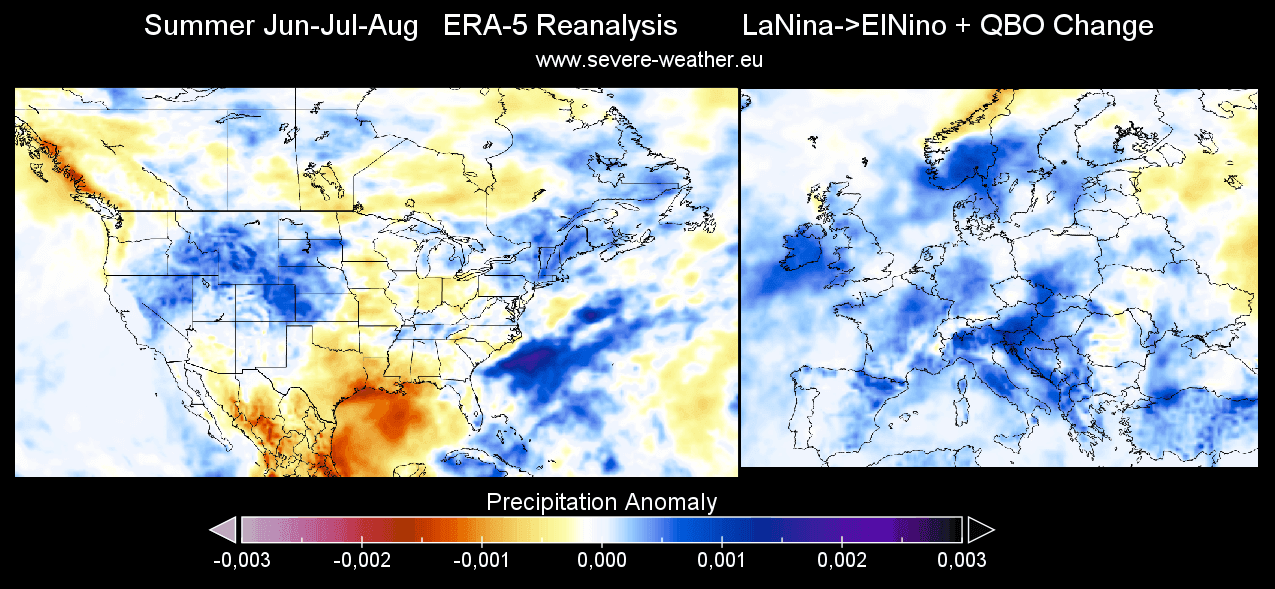
The rainfall pattern in such years is also interesting, and shows more rainfall over the northeastern and western United States and less rainfall over the Pacific Northwest and southern and east-central United States. Across Europe, we see more rainfall driven by a more moist southerly flow from the low-pressure area to the west.
We never see the exact same weather patterns in 2 different years, despite similar global events like the La Niña or El Niño. But the data does show what these events can create on average, as they initiate a specific state of the global weather system.
This will be a great baseline to compare to the actual latest long-range forecast data, where we will see if the atmosphere will respond again as it has in the past.
Long-Range Outlook: The ECMWF Summer 2026 Temperature and Pressure Forecast
The official meteorological summer period covers the months of June-July-August, which is also the hottest quarter of the year in the Northern Hemisphere. We will use two forecasting systems: the ECMWF SEAS5 long-range model and the Copernicus multi-model forecast.
Below is the latest ECMWF long-range pressure forecast for Summer, and it actually shows a very similar pressure pattern to that in the past years above. A low-pressure area is forecast over eastern Canada, the southwestern U.S., and the Azores, and a high-pressure region is found over western Canada.
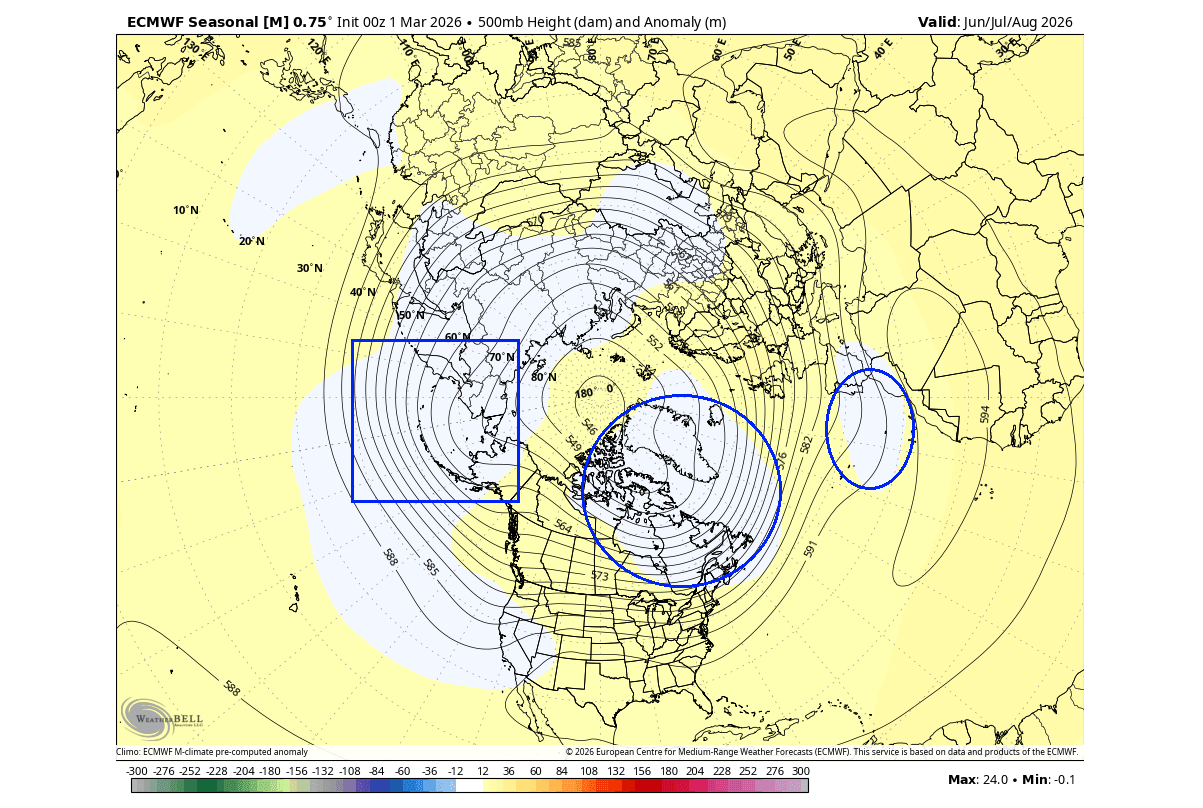
This indicates that the atmosphere is likely to undergo a similar development to that in past years. But, of course, each year has its own specific development, so we are just looking at large-scale trends, which are currently heading in the same direction.
We can also see this if we compare the sea-level pressure (MSLP) anomaly forecast with the past analysis. First, we have the MSLP analysis for the same years as above, which had the same global weather transition phase. You can see high-pressure over Canada and the north, and a belt of lower-pressure anomalies from the United States over to northwestern and western Europe.
The actual latest MSLP forecast below shows a very similar pattern. A high-pressure area over Canada and the northern regions. At the same time, an area of lower pressure is indicated from the United States towards western Europe. We can also see the emerging El Niño low-pressure zone over the tropics in both images.
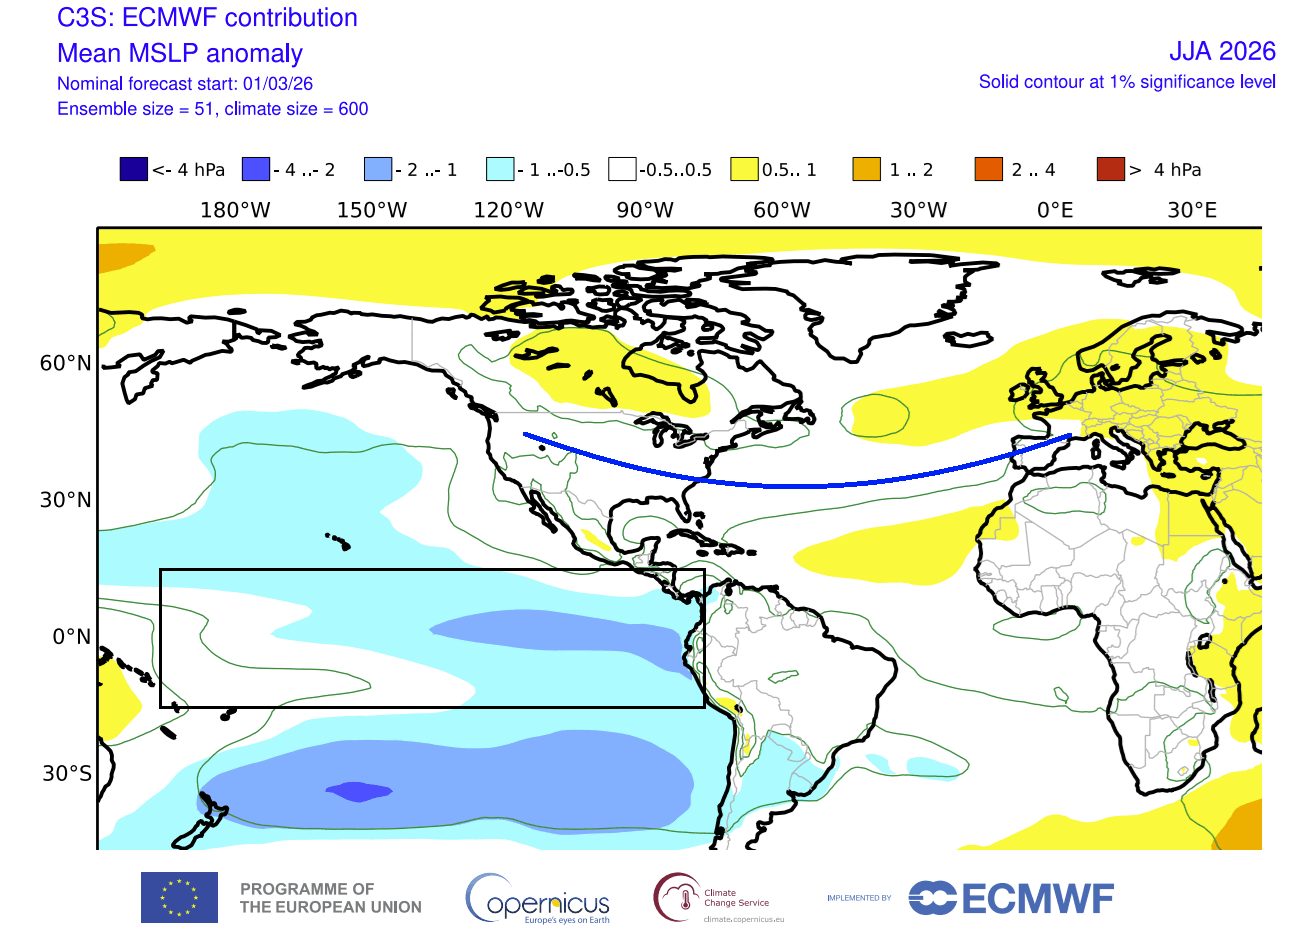
This combined shows a very telling story of an atmospheric development that was seen before in similar global shifts. It also shows how certain global anomalies can bring a more predictable weather pattern, at least on a more global scale, rather than for each individual town or city.
This means that once we see an El Niño developing, we can kinda expect how the weather patterns will behave in the months ahead. We usually call this analog forecasting.
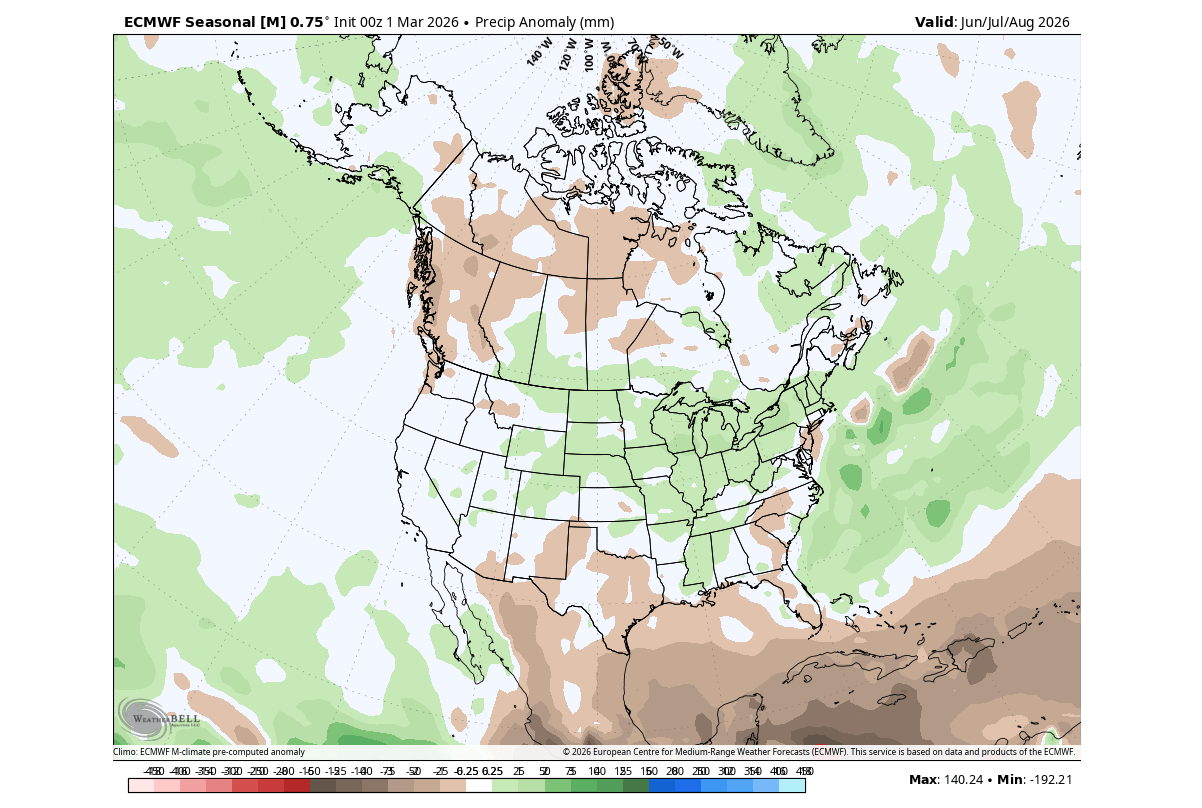
If we look at the long-range Summer temperature forecast for North America, we can see the normal temperature area over the northern and eastern United States and much of central and eastern Canada. This coincides with the trends of the past data, indicating the presence of the background El Niño forcing, limiting temperatures with the low-pressure area over the region.
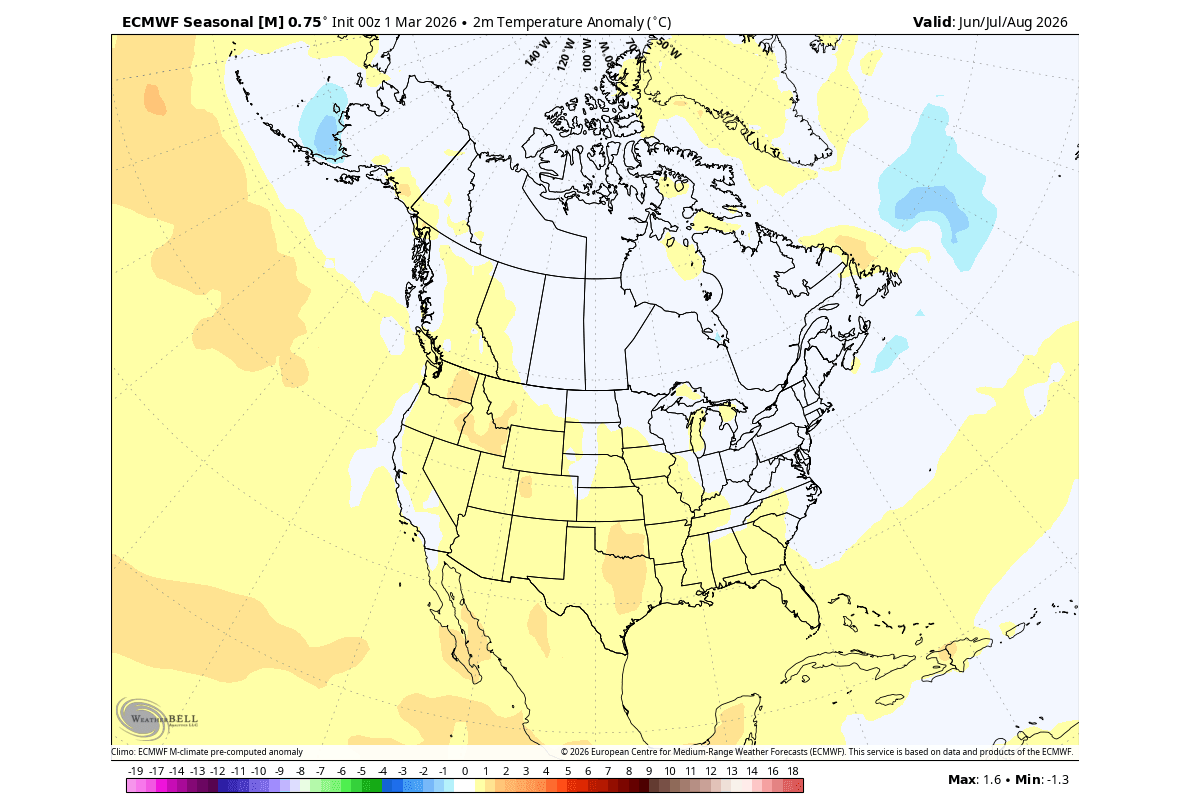
Above-normal temperatures are forecast for Summer 2026 over the northwestern, western, and southern United States and far western Canada, very similar to the past reanalysis data.
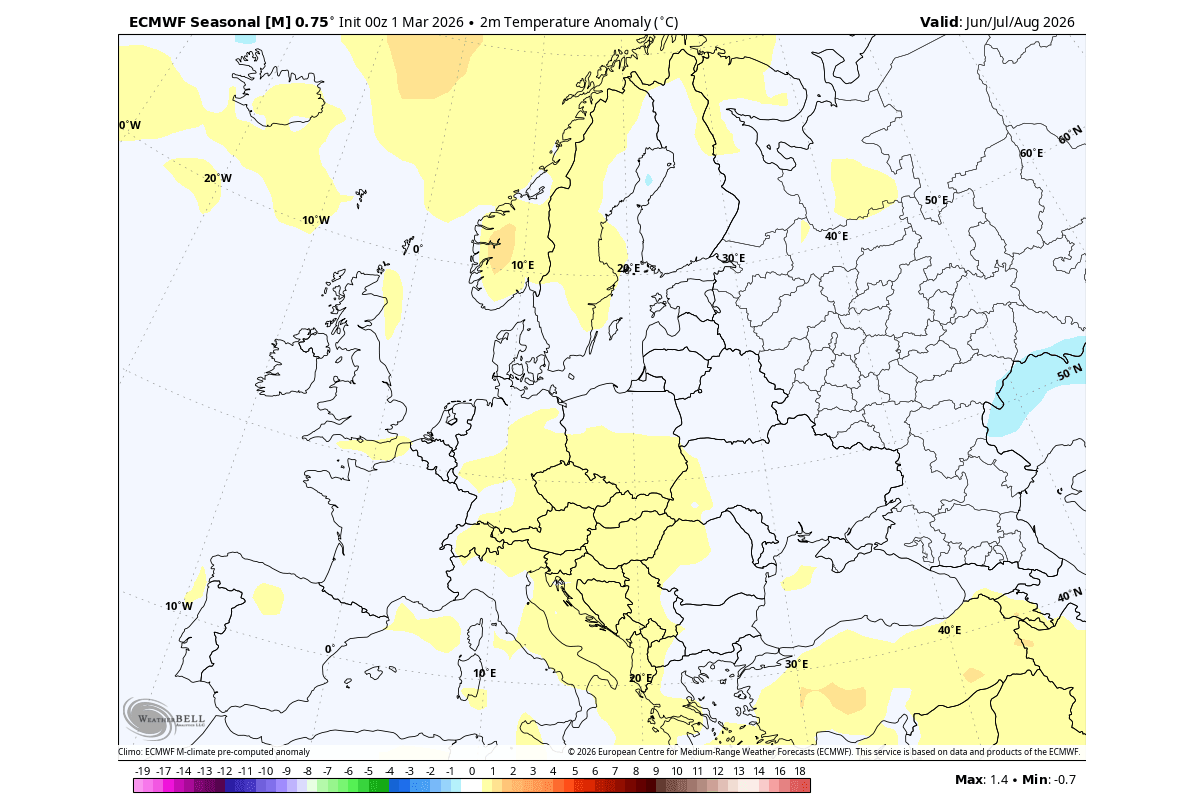
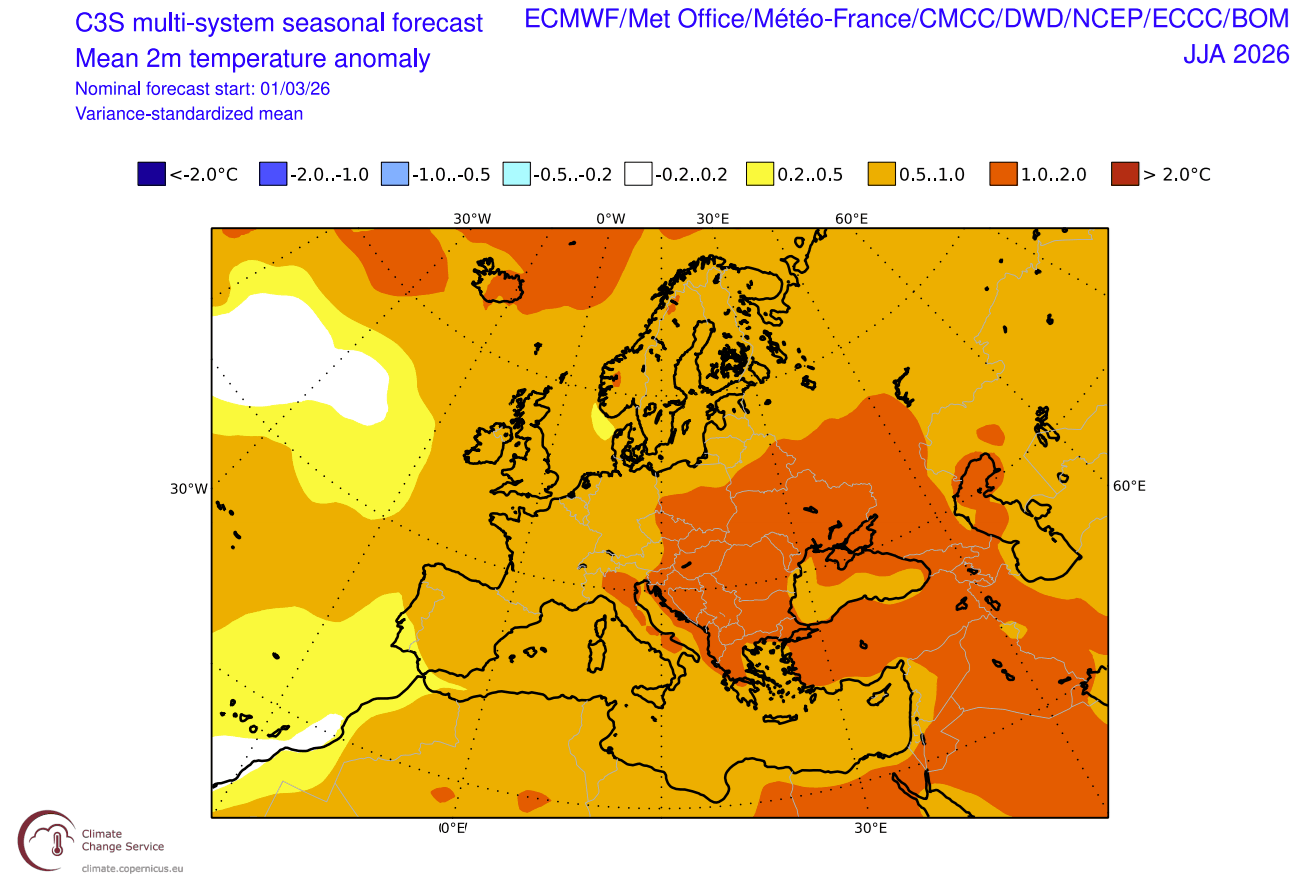
Over Europe, we are also observing a similar trend in the forecast as in the past reanalysis data. The main area of above-normal temperatures is over central Europe and towards the north. But a normal-temperature area covers the entire western half of the continent, similar to past data, indicating a milder airmass coming from the Atlantic.
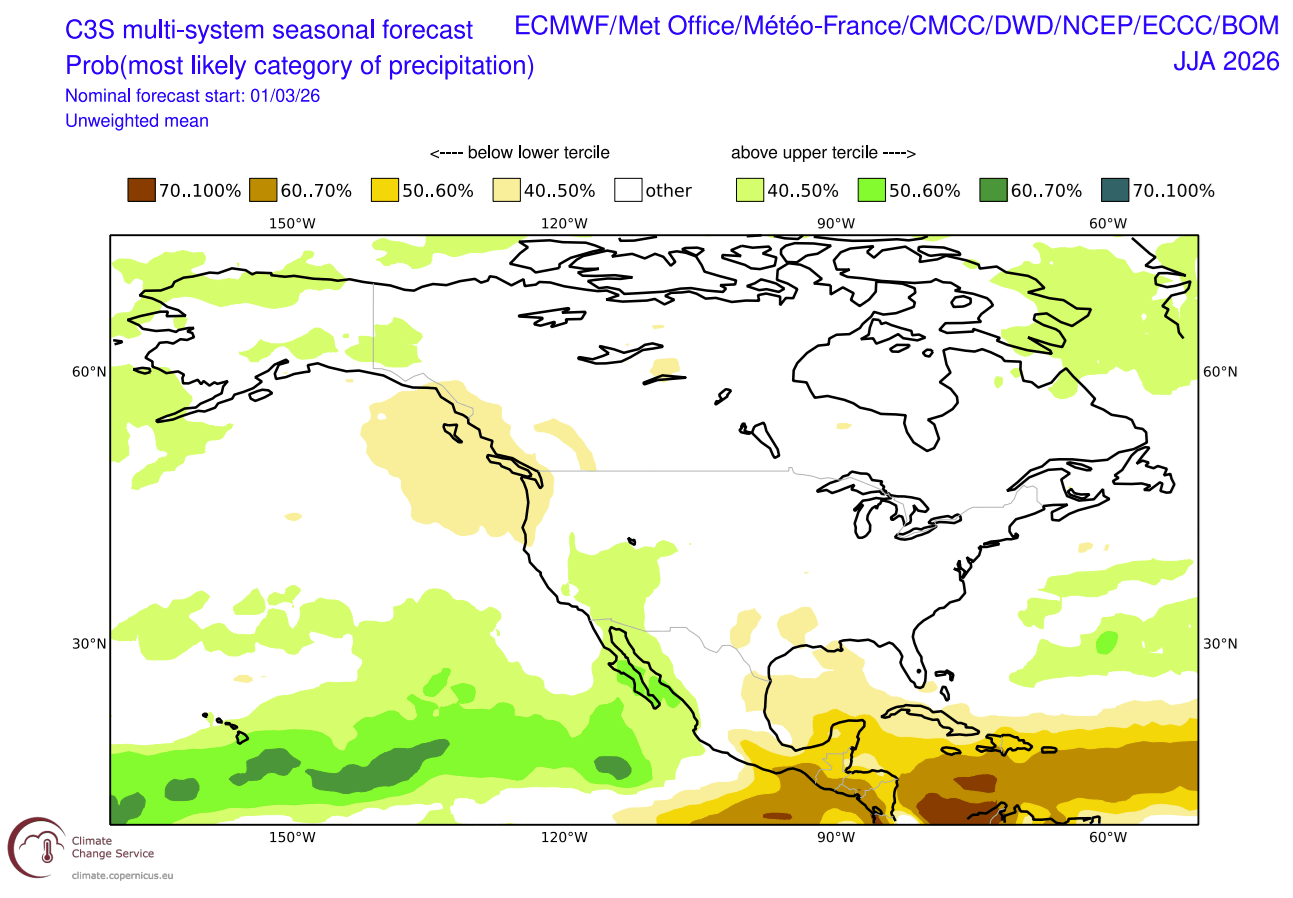
Looking at the precipitation forecast, you can see the impact of the low-pressure area over the northern and eastern United States, bringing more rainfall. Less rainfall than normal is forecast this summer over western Canada, and over the southern United States and Florida. Apart from some Midwest regions, this is close to the reanalysis rainfall pattern above.
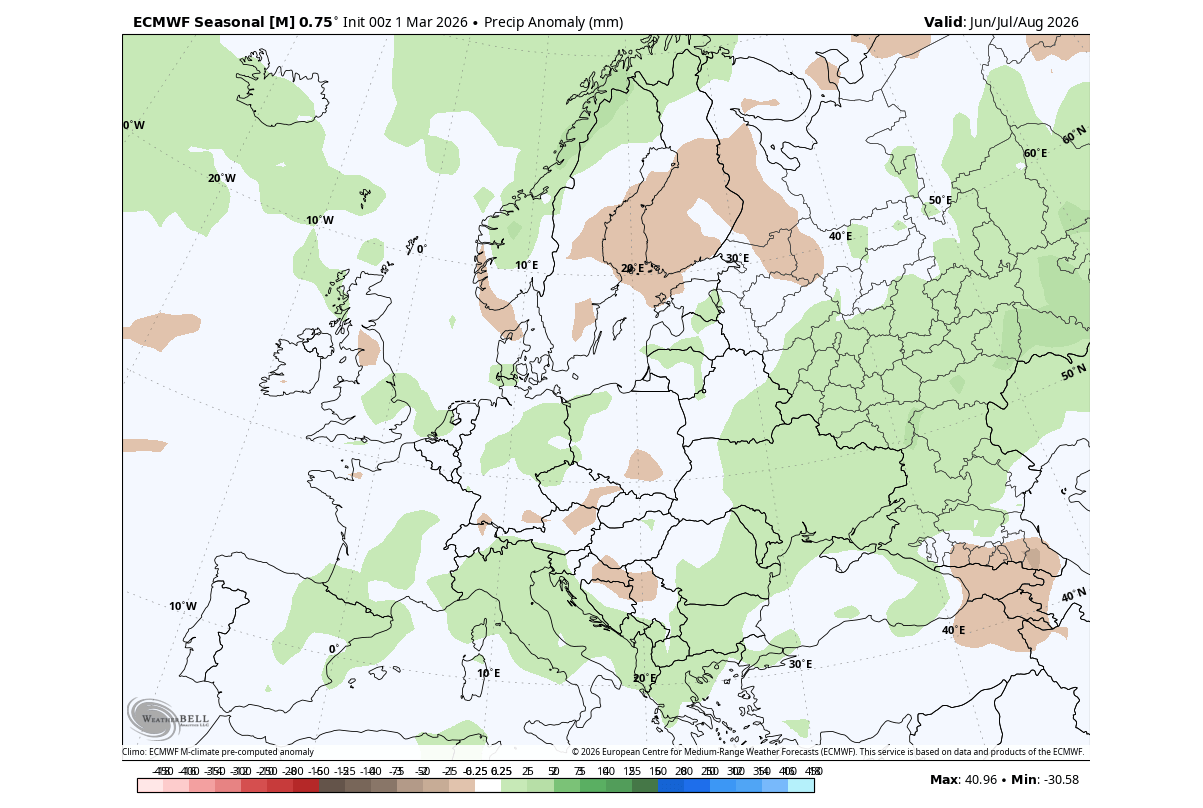
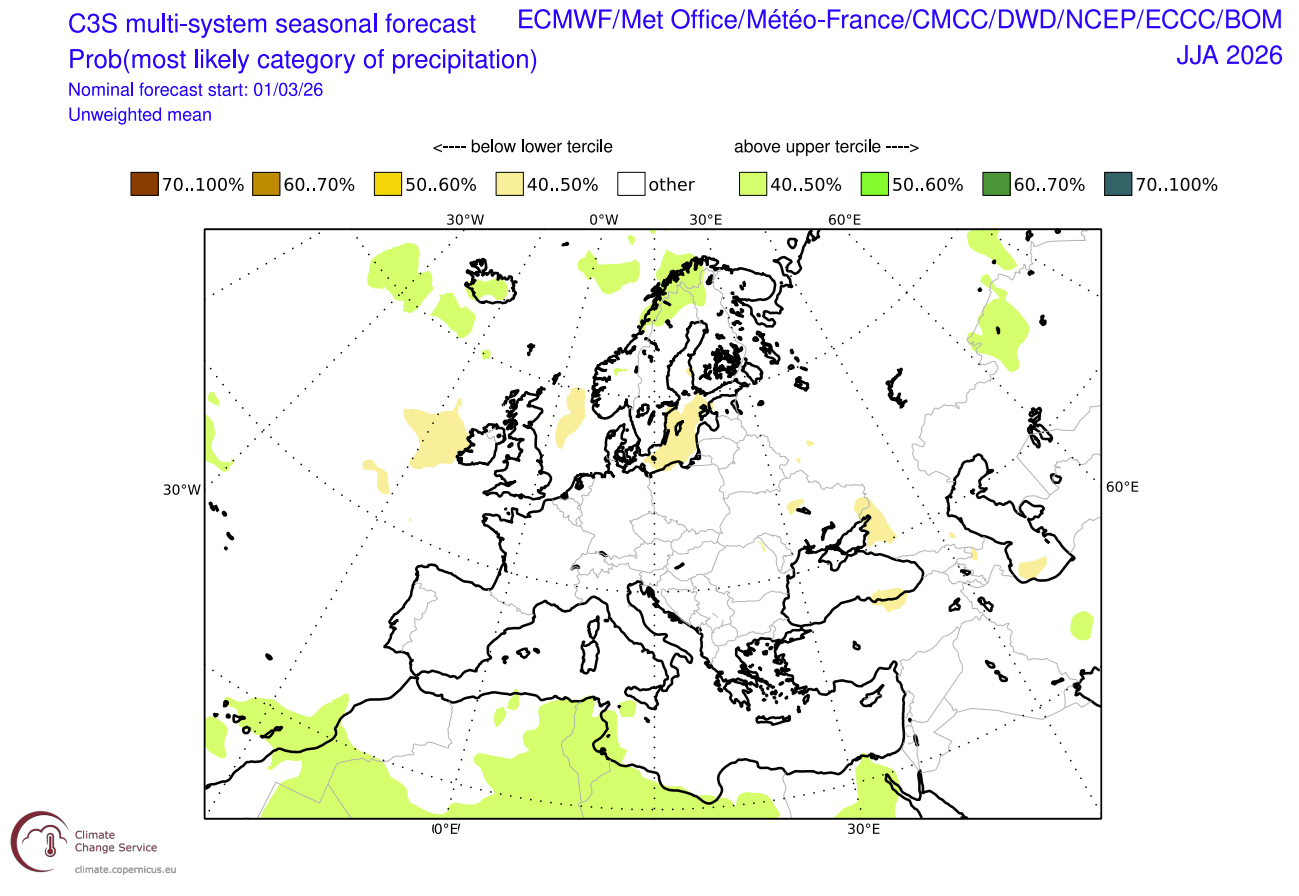
Over Europe, the forecast also shows a similar signal to the reanalysis data, with most of the continent under more rainfall than normal, apart from a small area in central Europe. This is likely from the influence of a low-pressure system over southwestern Europe or the eastern North Atlantic.
This model forecast overall shows an interestingly similar signal to the past analysis of a similar global setup. It confirms the expected El Niño influence already visible in the Summer weather patterns over the United States, Canada, and Europe. But does a multi-model forecast see the same pattern?
Atmospheric Patterns: The Multi-Model Forecast for the 2026 Summer Season
Our second model of choice is actually a multi-model forecast, which is made out of several different model forecasts, as the name suggests. This makes the forecast more robust, but can also be slow to respond to any changes or hide important nuance. It’s still good for a general trend analysis.
Below is the latest multi-model long-range pressure forecast for Summer, and like the EMCWF, it also shows a very similar pressure pattern to that in the “analog” years. A low-pressure area is indicated in the eastern Canada area or northern U.S., based on the location of the main high-pressure zone over the Pacific Northwest.
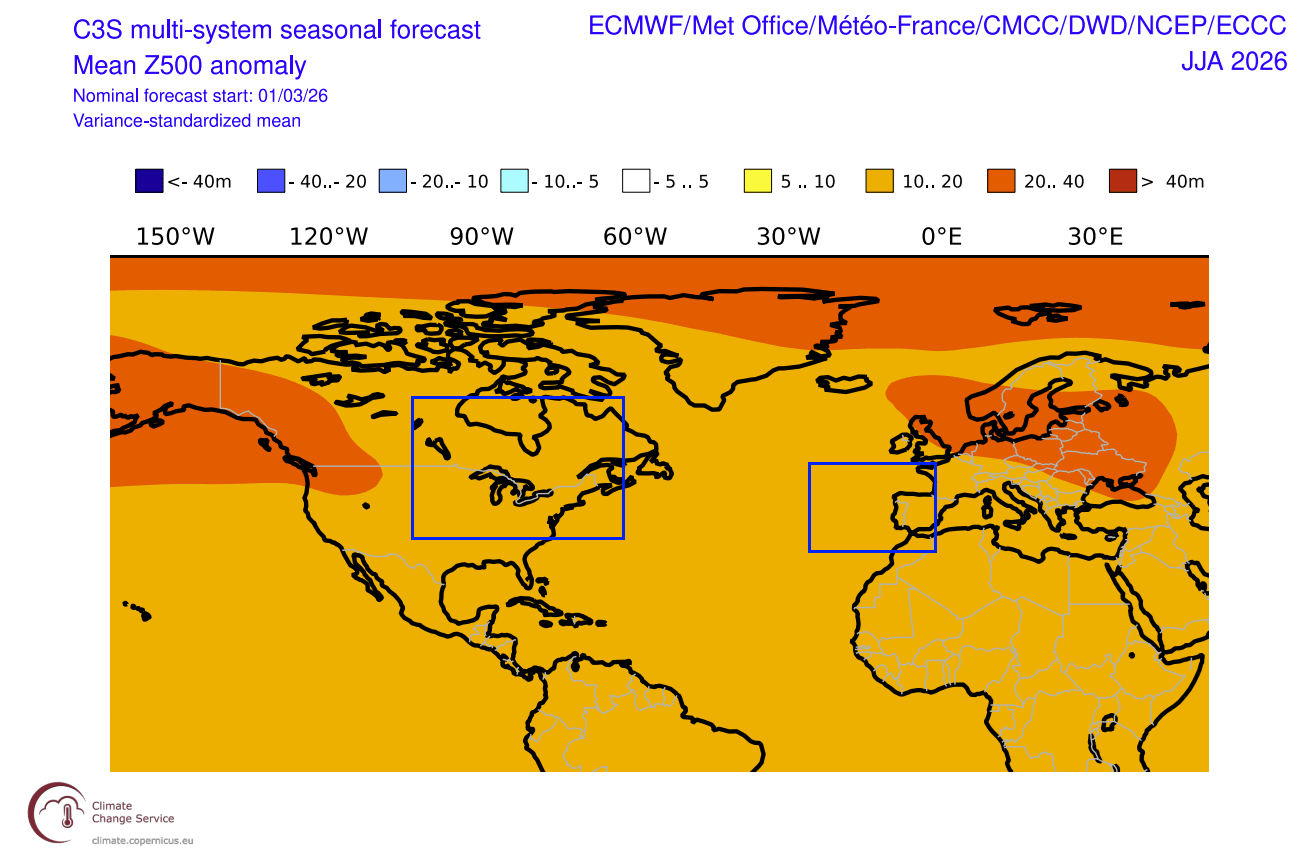
Another potential low-pressure area is over western and southwestern Europe. This is due to the location of the main high-pressure area over the northern and north-central parts. This is also similar to the past El Niño development years.
The Summer temperature for North America from this forecast shows an above-normal area over much of the western and central United States. But a potential corridor of near-normal temperatures is likely from Canada down into the eastern United States. This is now only usable as a potential pattern/trend, while the actual temperatures would be lower in an actual such scenario over the northern and parts of the eastern United States.
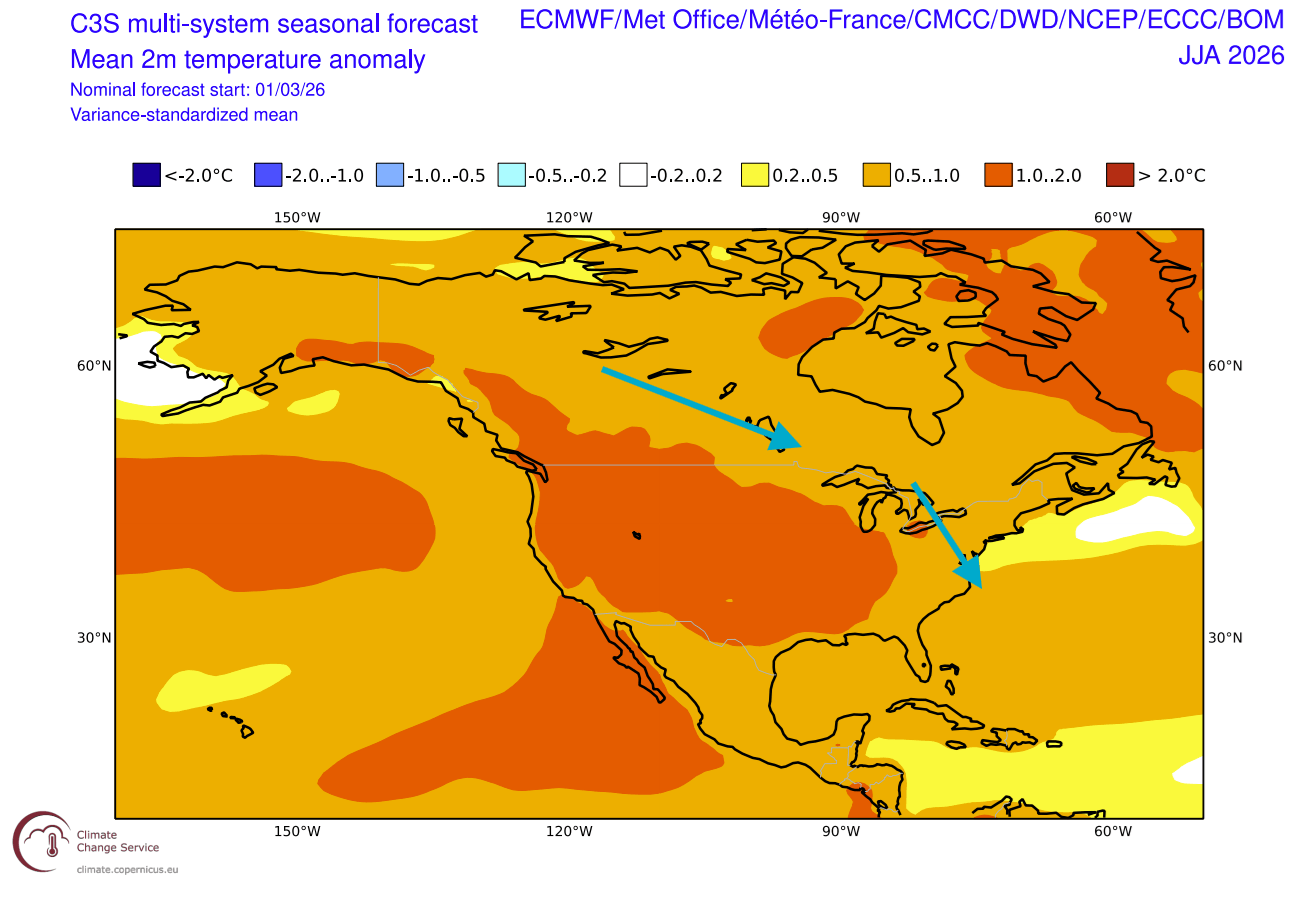
At the same time, above normal temperatures reach into southwestern Canada, while the corridor of normal to below-normal temperatures would reach into the southern and southeastern parts of Canada.
Over Europe, the multi-model forecast shows a similar trend to the ECMWF and the past reanalysis data. The main “hot” area is over central Europe and towards the east. But a normal-temperature area (or slightly above normal) is more likely towards the west, under the influence of the western low-pressure area, similar to what we have seen in the past data.
When we get to the precipitation forecast, we can start to see the downside to the multi-model forecast. The rainfall predictions are more sensitive to patterns, so different models can yield very different predictions, which combine to “normal” in the average.
The rainfall trend for North America shows more precipitation than usual over the southwestern United States, and less over the Pacific Northwest and over the southern United States. All these areas nicely match the rainfall pattern seen in the reanalysis data.
Over Europe, we have the same issue with the signal strength, and while there is a “normal” rainfall forecast for the continent, we do see a trend for less rainfall over the northwestern and northern parts.
Overall, these images and data show a very interesting story, how similar weather patterns can develop across the past, present, and future, when the ocean and the atmosphere connect in a similar way again.
Another more clear impact of the El Niño is also expected for the upcoming 2026 Atlantic Hurricane season, which usually starts around late Summer.
El Niño Effect on the 2026 Hurricane Season for the U.S.
Based on extensive research, it is well known that an El Niño event reduces the number of Hurricanes and tropical systems overall in the Atlantic. The reason is that El Niño brings higher pressure to the Atlantic, stronger wind shear, and a more stable atmosphere, preventing the storms from organizing and powering up into large systems.
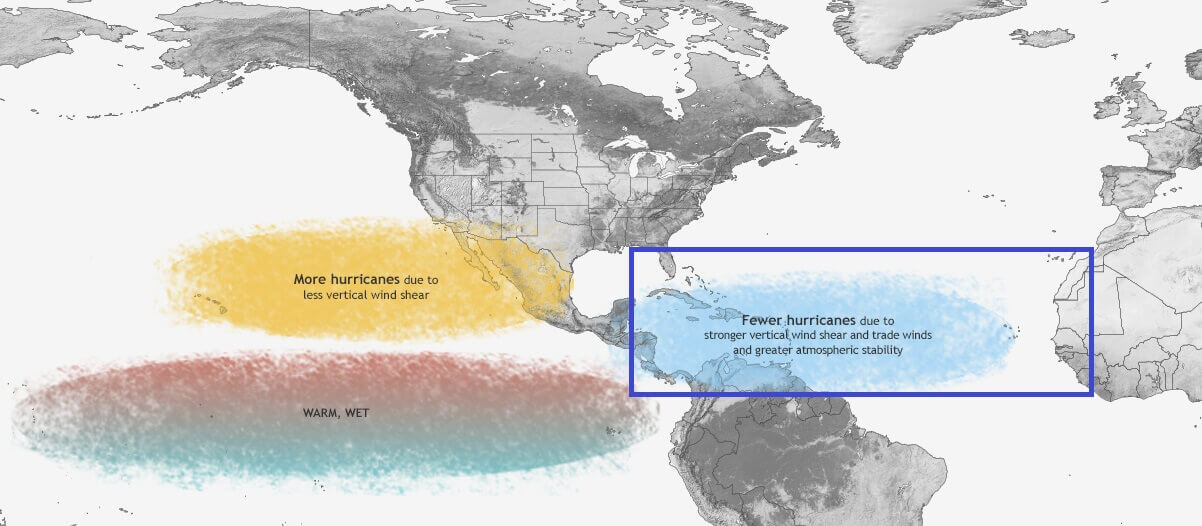
In the hurricane season reanalysis, you can see much less precipitation in the main development zone during an El Niño. The south coastal areas of the United States, the Caribbean, and most of the tropical Atlantic are drier than normal, indicating that El Niño is preventing major tropical development or hurricane landfalls.
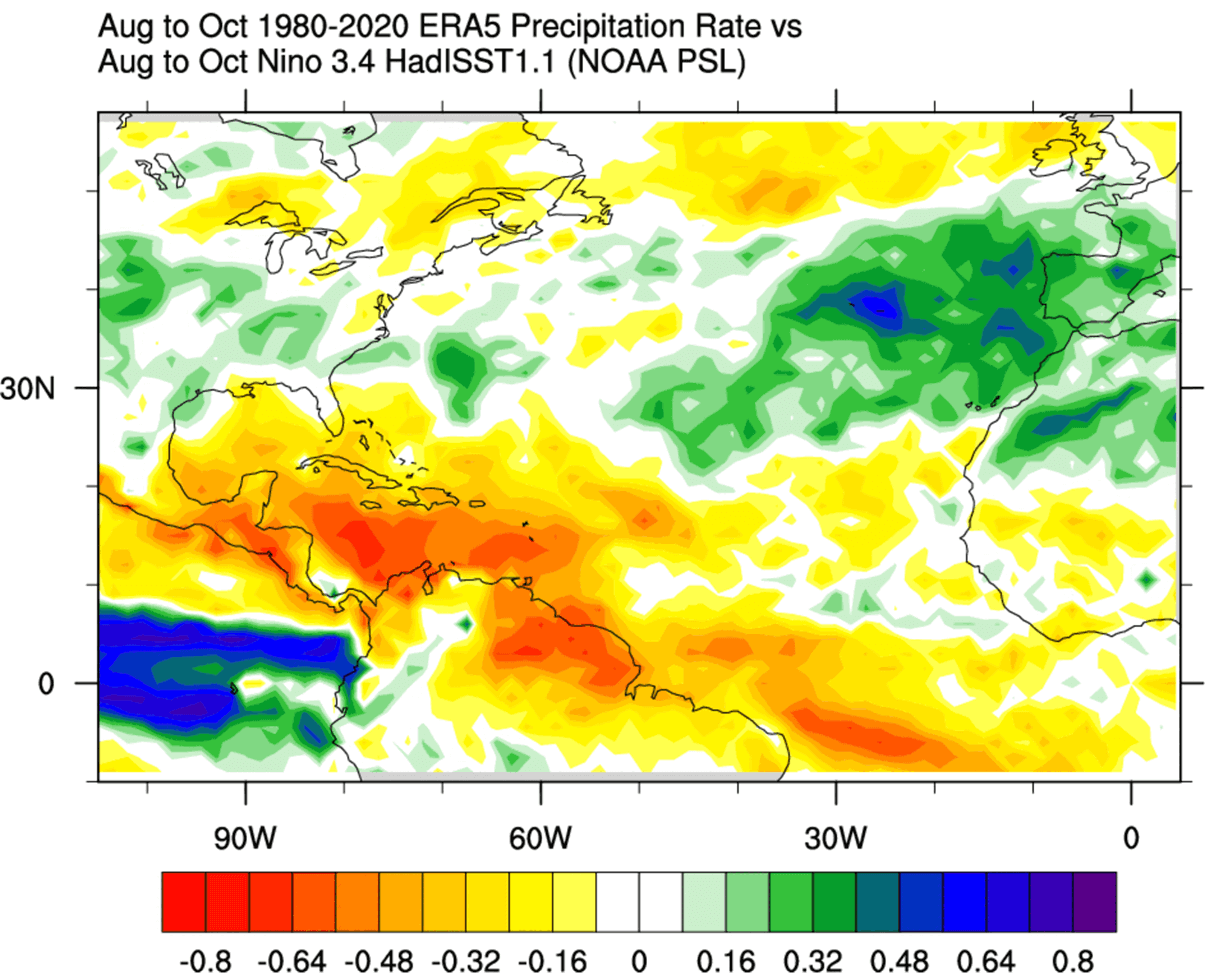
This is mostly due to higher pressure and more stable conditions across the tropical Atlantic. The final result is fewer tropical storms and/or weaker systems. So, an El Niño can greatly reduce the chance of strong hurricanes impacting the United States.
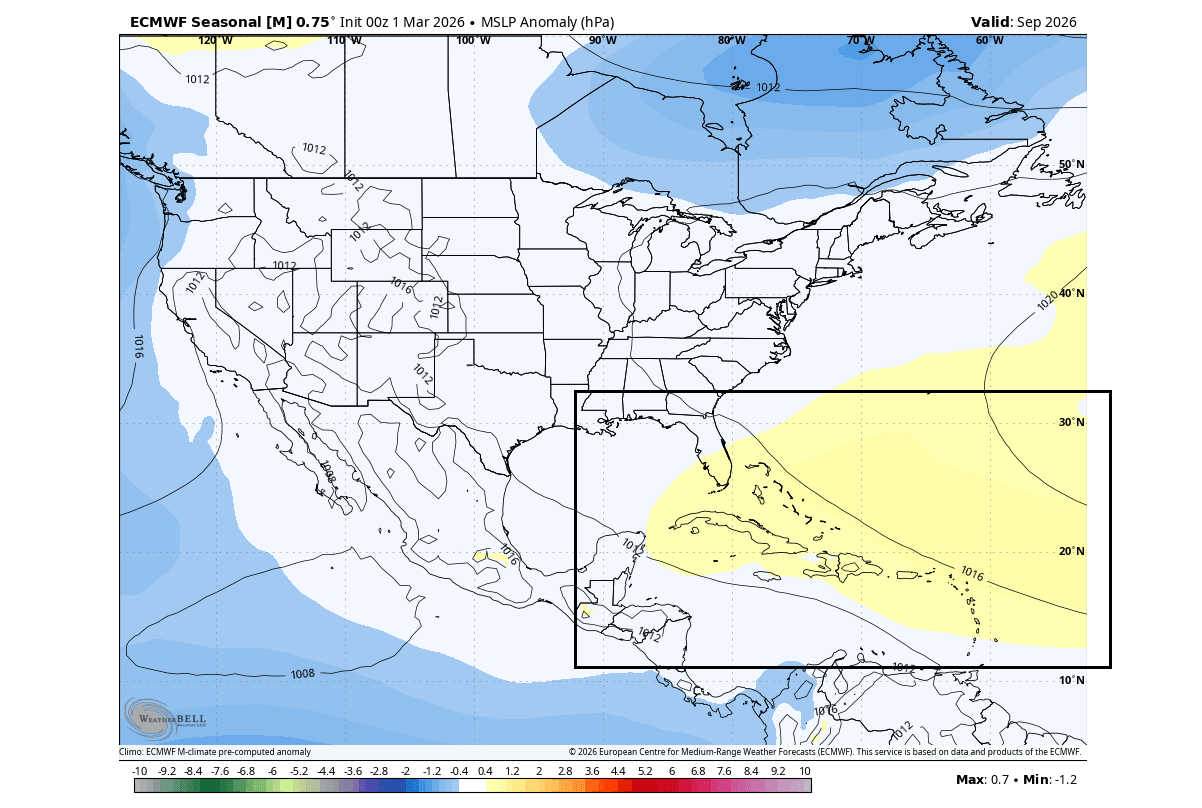
Below is the latest long-range pressure forecast for September, and you can see above-normal pressure in the main development region (MDR). This is the region that spawns the most tropical systems, and the latest forecast does indicate a higher-pressure area, very likely the culprit of the emerging El Niño.
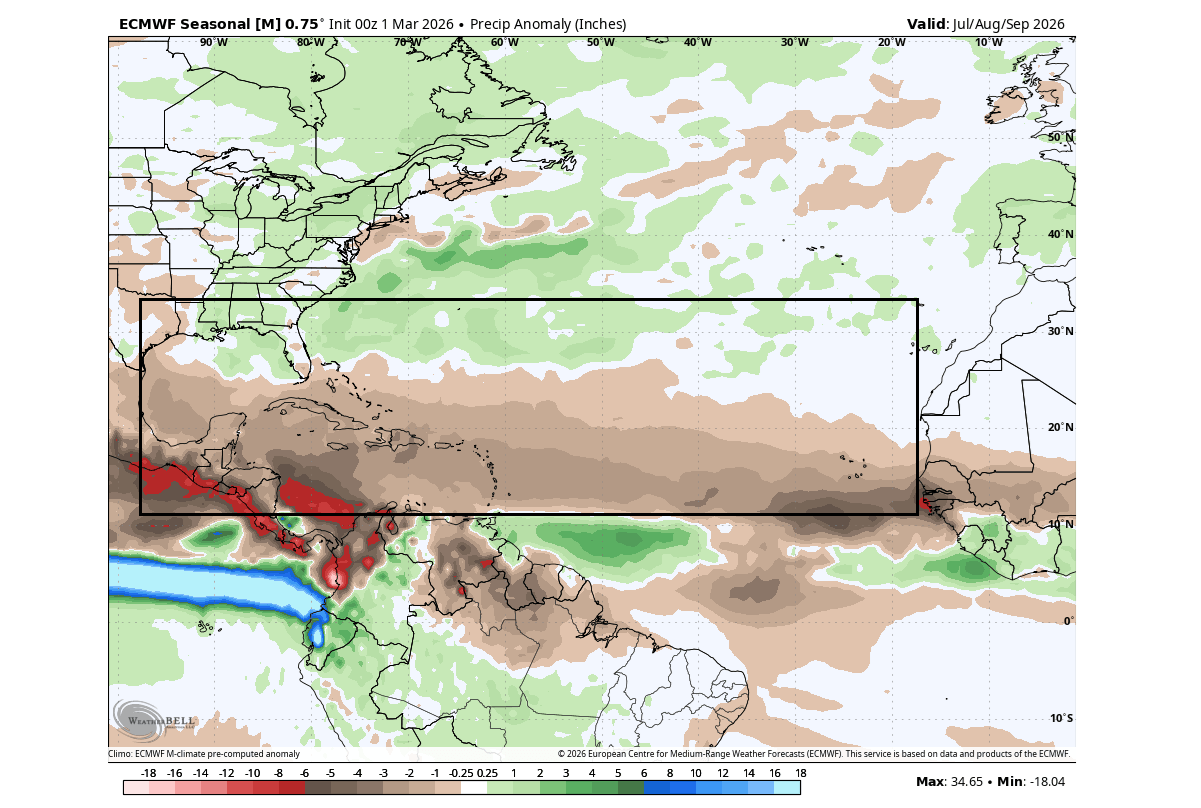
If we also look at the latest long-range precipitation forecast for a part of the 2026 Hurricane season, it shows well below-normal rainfall in the main development region. This indicates suppressed activity and a lower chance of a large number of storms affecting the mainland United States or the Caribbean.
Here, we have to add that a lower chance is still not a zero chance for a hurricane to form. El Niño just makes it harder for storms to organize properly and grow into large systems.
Every year still sees at least some tropical storm activity, even during the strongest El Niños, and a single system can still sometimes manage to get through the atmospheric “cracks”. The El Niño just acts as a natural “shield” for the U.S. coasts.
Forecast images in this article are from cyclonicwx.com, CopernicusEU, and WeatherBell, using a commercial license.
We will keep you updated on global weather development and long-range outlooks, so bookmark our page. Also, if you have seen this article in the Google App (Discover) feed, click the like (♥) button to see more of our forecasts and our latest articles on weather and nature in general.
Don’t miss: