A cold anomaly is starting to return to the far North Atlantic after a decade. The early forecast shows that this cold anomaly is expected to persist into Winter. For that reason, we can use it as an indicator of potential Weather patterns in the Winter 2025/2026 over North America, based on the previous such events.
While the oceans play a role in overall weather development and climate, we must also consider that these events can be seen as an indication of larger-scale changes, rather than having an impact themselves.
We will first look at where this cold anomaly has appeared and how it’s developing. Also, we will look at the last time large-scale cooling occurred in this area, the cold Winter over the United States and Canada that followed in that period, and the long-range forecast that shows a potential repeat of these events.
NORTH ATLANTIC OCEAN AND WEATHER
The North Atlantic Ocean currents are a part of a large system called AMOC. This powerful ocean system brings warmer waters up from the tropics into the North Atlantic Ocean and is also known as the Gulf Stream in its middle part. It extends all the way up along the eastern coast of the United States, where it starts to turn towards the northeast.
The image below shows a general outline of the Atlantic Ocean current and where it flows across the North Atlantic. The cold anomaly that we are currently observing, and those in the past, all form in the northern parts, inside or around the subpolar gyre area.

This strong current of warm water has a direct influence on the climate in the eastern United States. For example, it keeps temperatures warmer in the winter and cooler in the summer across the entire East Coast, more notable in the state of Florida.
This ocean current system is an integral part of the weather and climate in the North Hemisphere. It transports a lot of warm water and energy towards the north. But for a while now, we have been observing some changes, indicating the weakening of this entire transport system.
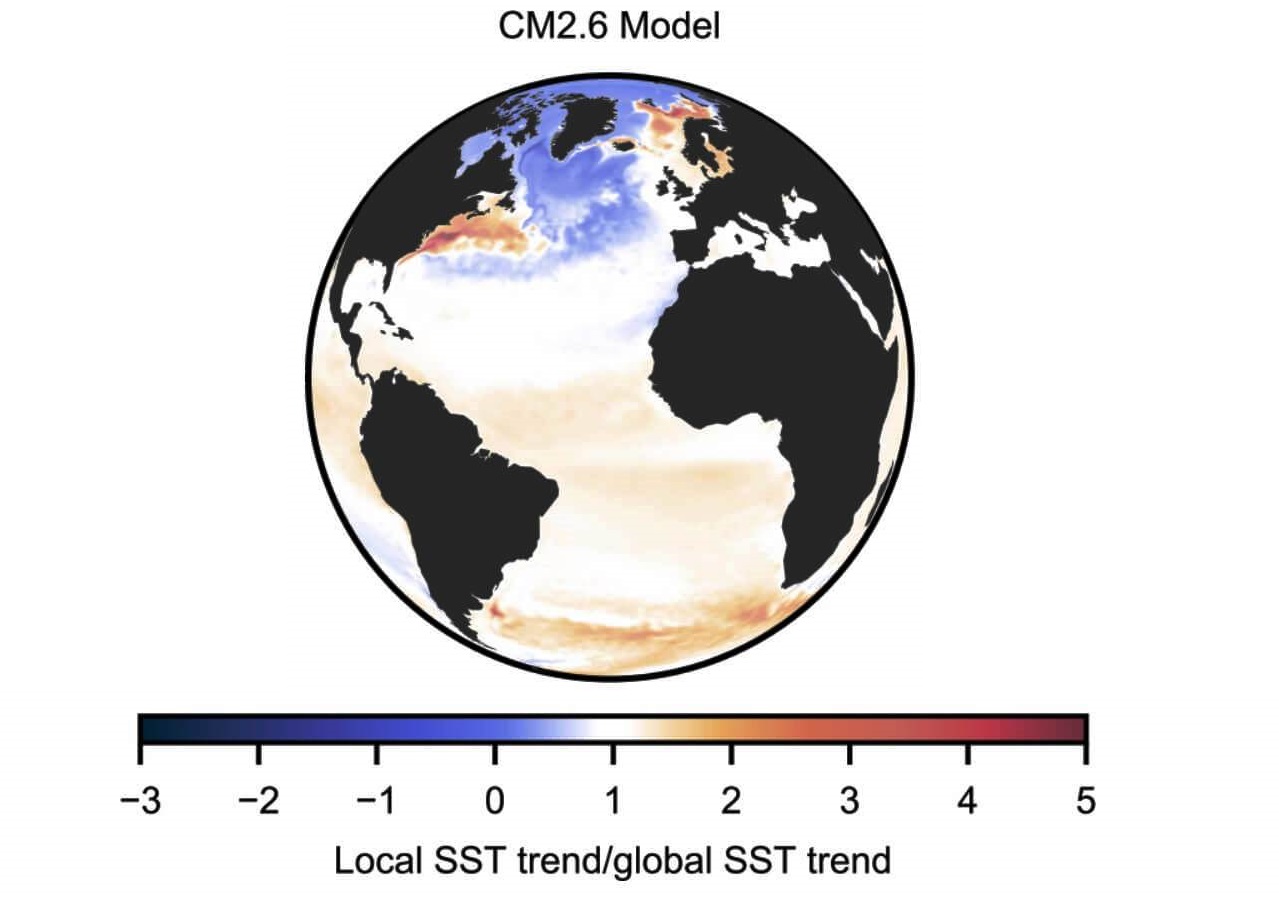
The image below is a computer model simulation. It shows what would happen if the AMOC were to weaken. We can see the warming of the ocean region along the east coast of the United States and cooling in the North Atlantic.
The second image below shows the actual ocean temperature trends over time. It looks nearly identical to the model simulation of a weakening AMOC. This supports the fact that the AMOC is indeed weakening, perhaps even faster than first anticipated.
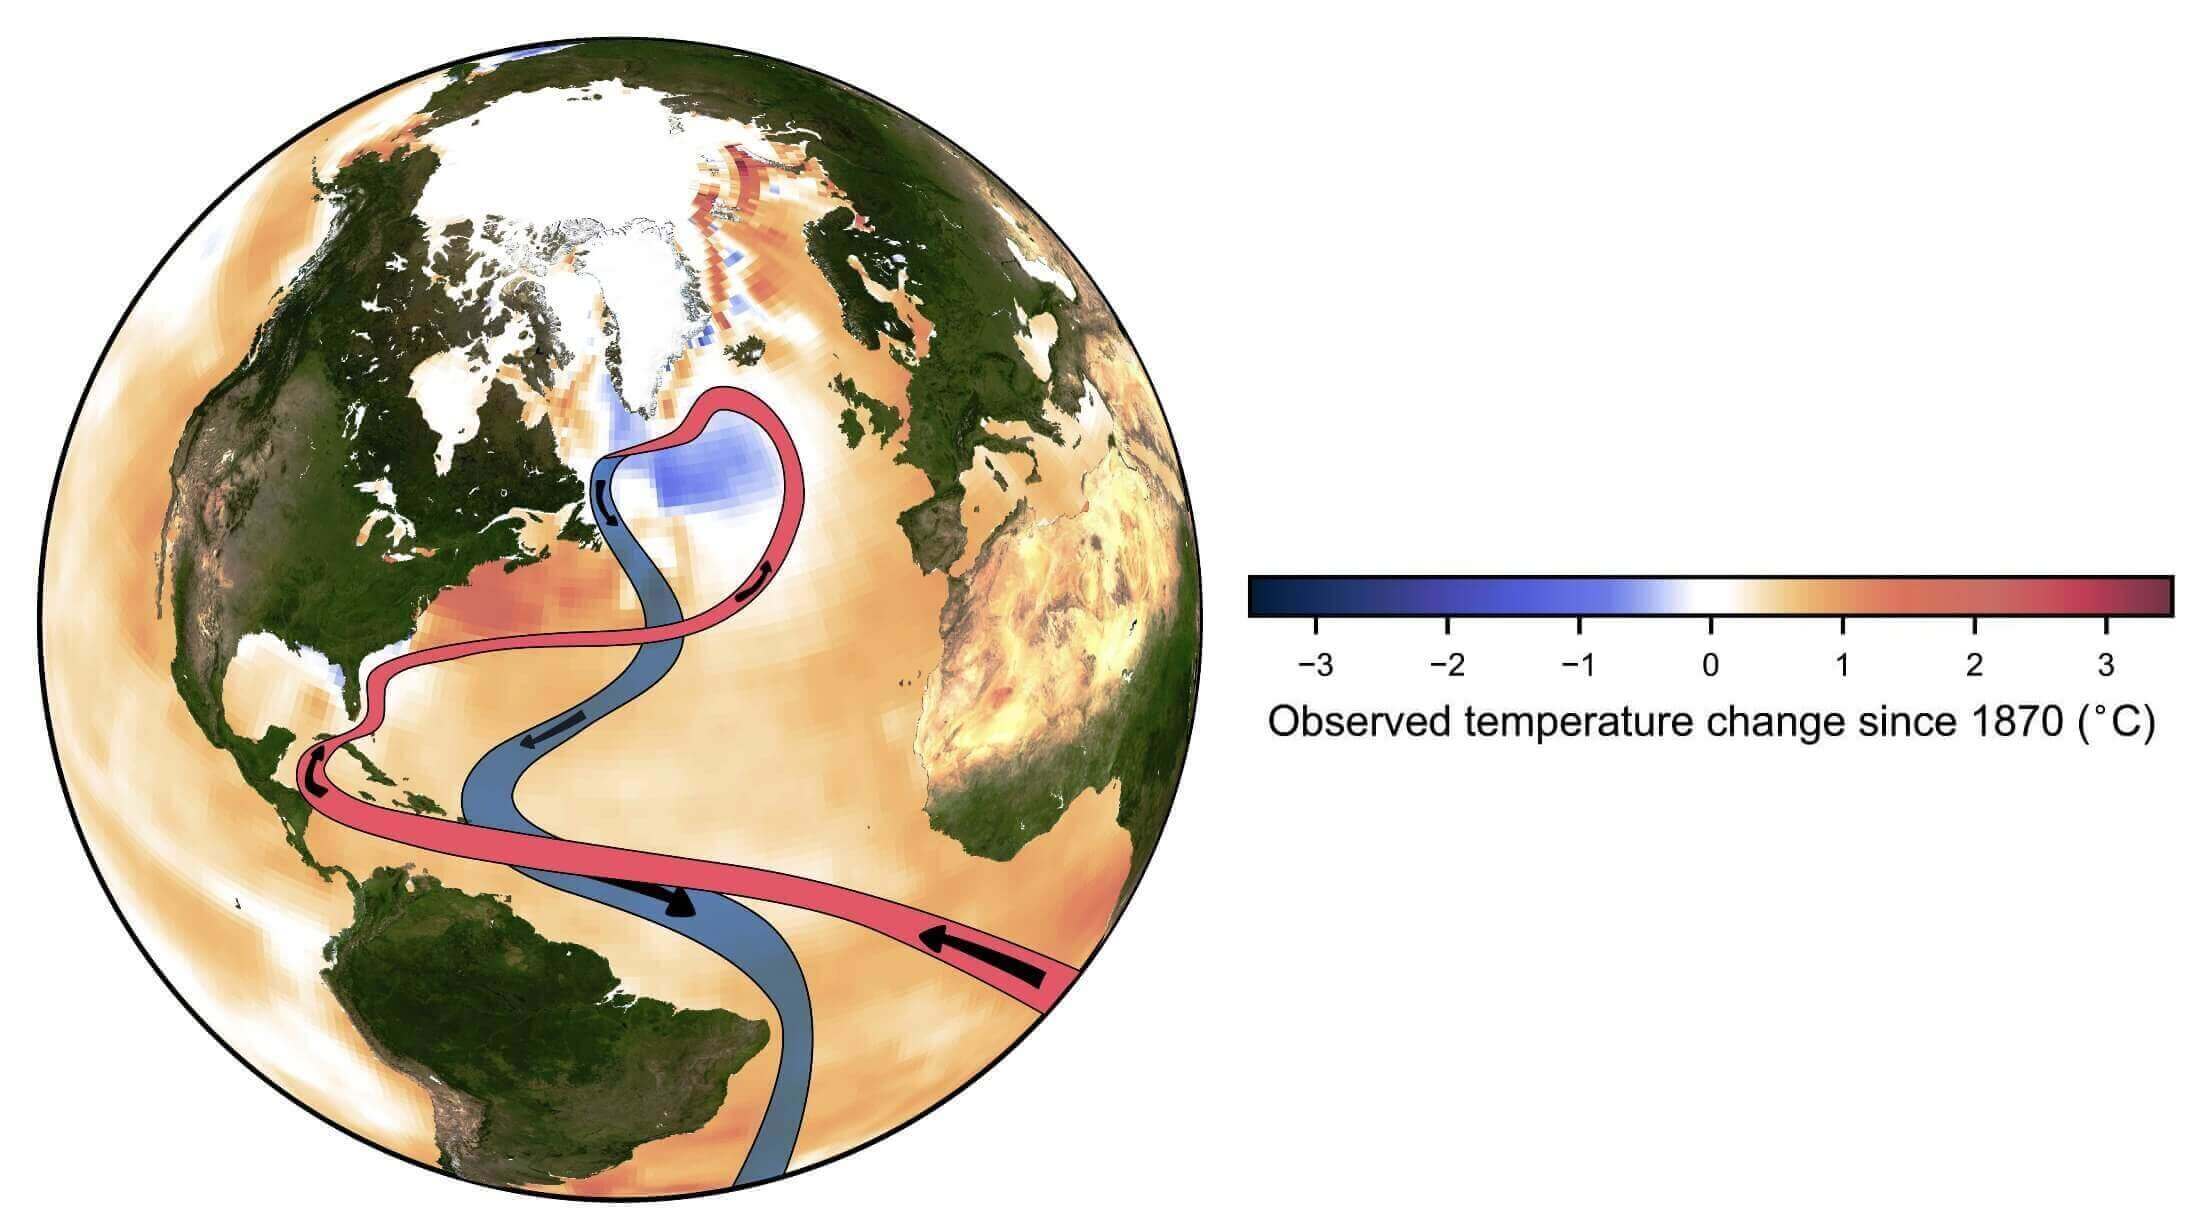
This temperature signature of the warm Gulf Stream area and cold North Atlantic is one of the strongest indicators of the AMOC weakening. Instrumental direct observations have also objectively confirmed that the North Atlantic circulation is indeed on the decline.
This brings us to the current situation, where we are now observing the continuation of a cooling trend in the northern Atlantic.
A NEW COOLING PHASE BEGINS
As seen above, the cooling most often occurs in the far northern parts of the Atlantic, in the area where the ocean currents start to sink. But as the cold anomalies are closer to the surface, the cooling is also related to persistent weather patterns.
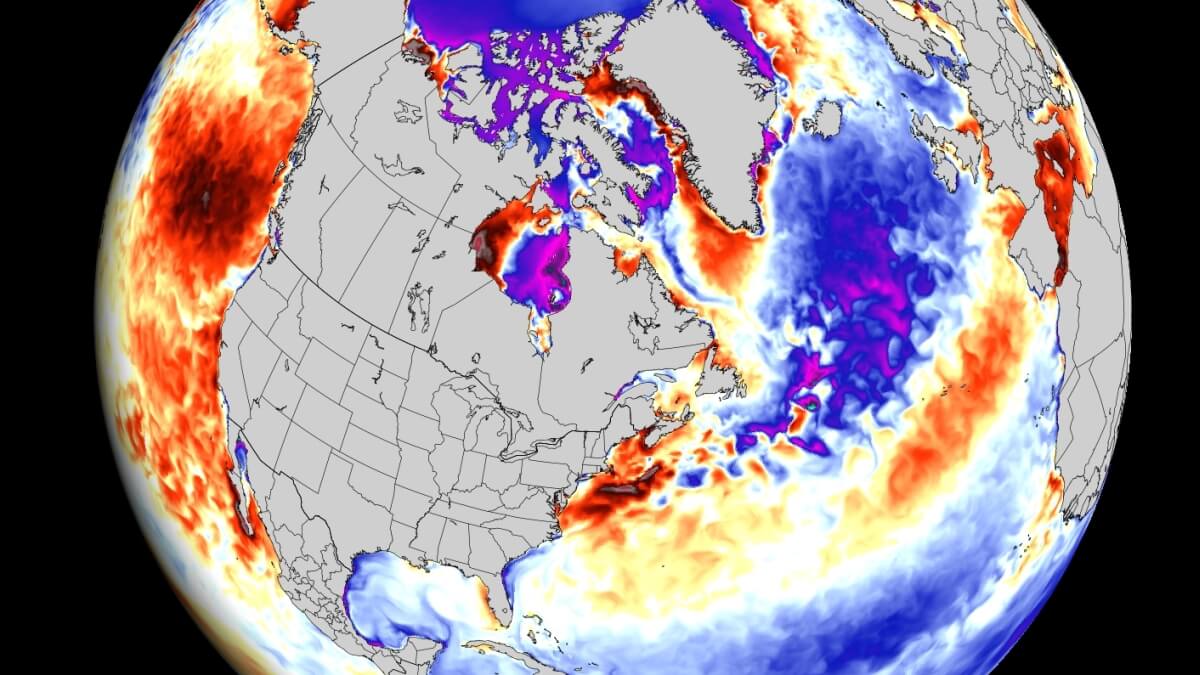
Below is the latest surface temperature anomaly of the far North Atlantic. You can see the marked area where the cooling is starting to occur, with cold anomalies already visible in the area. This area really stands out from the otherwise warmer oceans around it.

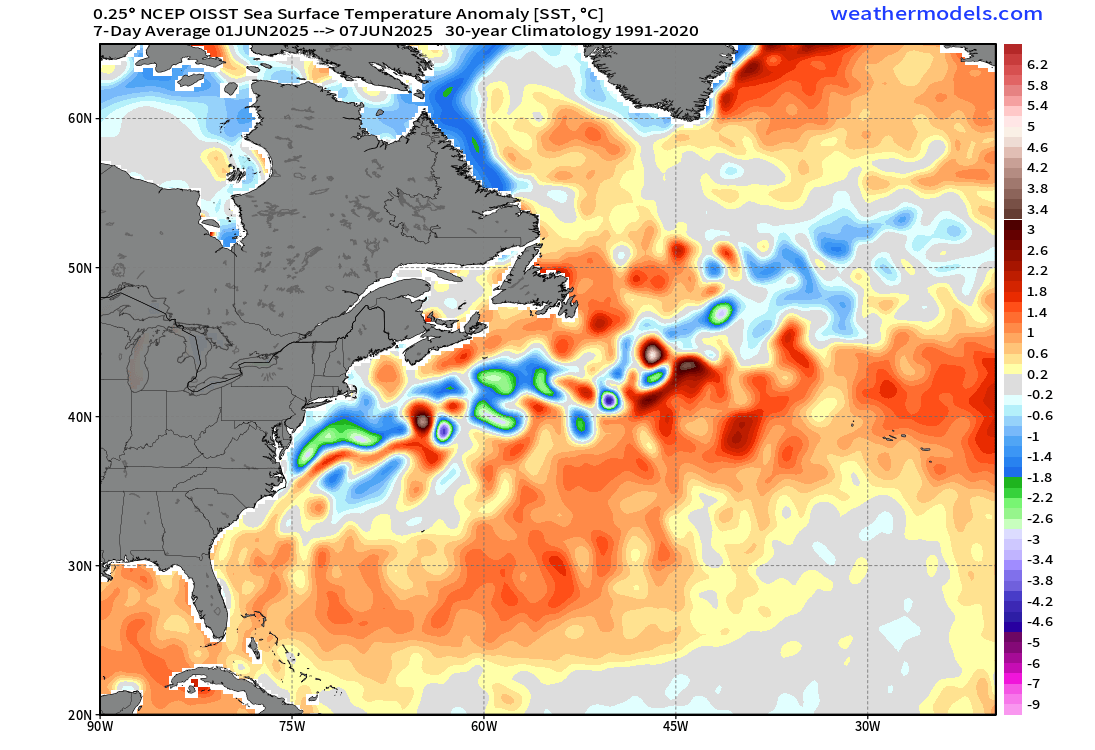
Looking below, we have another surface temperature analysis, but it is a 7-day average for the first week of June. You can see a wider area of where the cold anomaly is, relative to North America, and the connected anomalies. The area between the eastern United States and the cold anomaly is also impacted by the pressure systems.
Looking at the 15-day temperature change, you can see the area of cooling in the far northern Atlantic. But what is also interesting is how the warm anomalies of the Gulf Stream stand out back towards the United States, and the cooling just off the east coast. Image by cyclonicwx

Below is the ocean analysis during Winter, around mid-January. At that time, the same area of the northern Atlantic was much warmer than normal. This shows that the changes to a cold anomaly were more recent and also occurred with changing seasonal weather patterns.

Below is an even more dramatic analysis image. It shows the 1-year difference in surface temperature for the first week of June. As you can see, in 2025 the North Atlantic is much colder than it was this time last year. What stands out most is the northern area, which shows several degrees lower temperatures compared to last year.

The entire Gulf Stream area, extending back to the tropics, is also colder than normal. The lower temperatures are also seen in the main development region (MDR) of tropical storms and hurricanes in the tropical parts of the North Atlantic, as seen in the image.
COLD ANOMALY LONG-RANGE FORECAST
Using the latest long-range predictions, we can look at how this cold anomaly is forecast to develop as we approach Winter 2025/2026. First, we have the June forecast below. It shows the cold anomalies in the far northern Atlantic. It is perhaps a smaller area than we are currently observing, indicating that the model might be underestimating it.

Looking at the December forecast, you can see that the cold anomaly is still present, larger and also stronger than currently. This means that the cold anomaly is not just a rapid passing event, but a long-term feature that can be used as an indicator in long-range weather trends.

To show the whole forecast period, we produced a video from the WeatherBell graphics. The video shows the whole forecast period from June to December 2025. You can see how the cold anomalies are sustained and even get stronger as we enter the Winter 2025/2026 period.
Below is another ocean forecast from the JAMSTEC agency. It also shows the cold anomalies in the northern parts of the Atlantic, sustained over the Summer. It also shows the warm ocean anomalies along the west coast of the United States and Canada.

Those warm anomalies over western North America also have an importance in the big picture, as we will now look at the Winter weather connections between North America and these ocean anomalies.
NORTH AMERICA WEATHER PATTERNS
To find a connection between these ocean anomalies and the Atmosphere, we need to look at some analysis images. Most notably, we look for the connection between the ocean temperature anomaly and an atmospheric pattern.
Below is the most obvious connection that we have found, which highlights the proper ocean anomalies, such as the cold northern Atlantic and the warmer anomalies off the west coast of the United States. The atmospheric pattern we found the connection to is called the Pacific-North American pattern, or PNA.
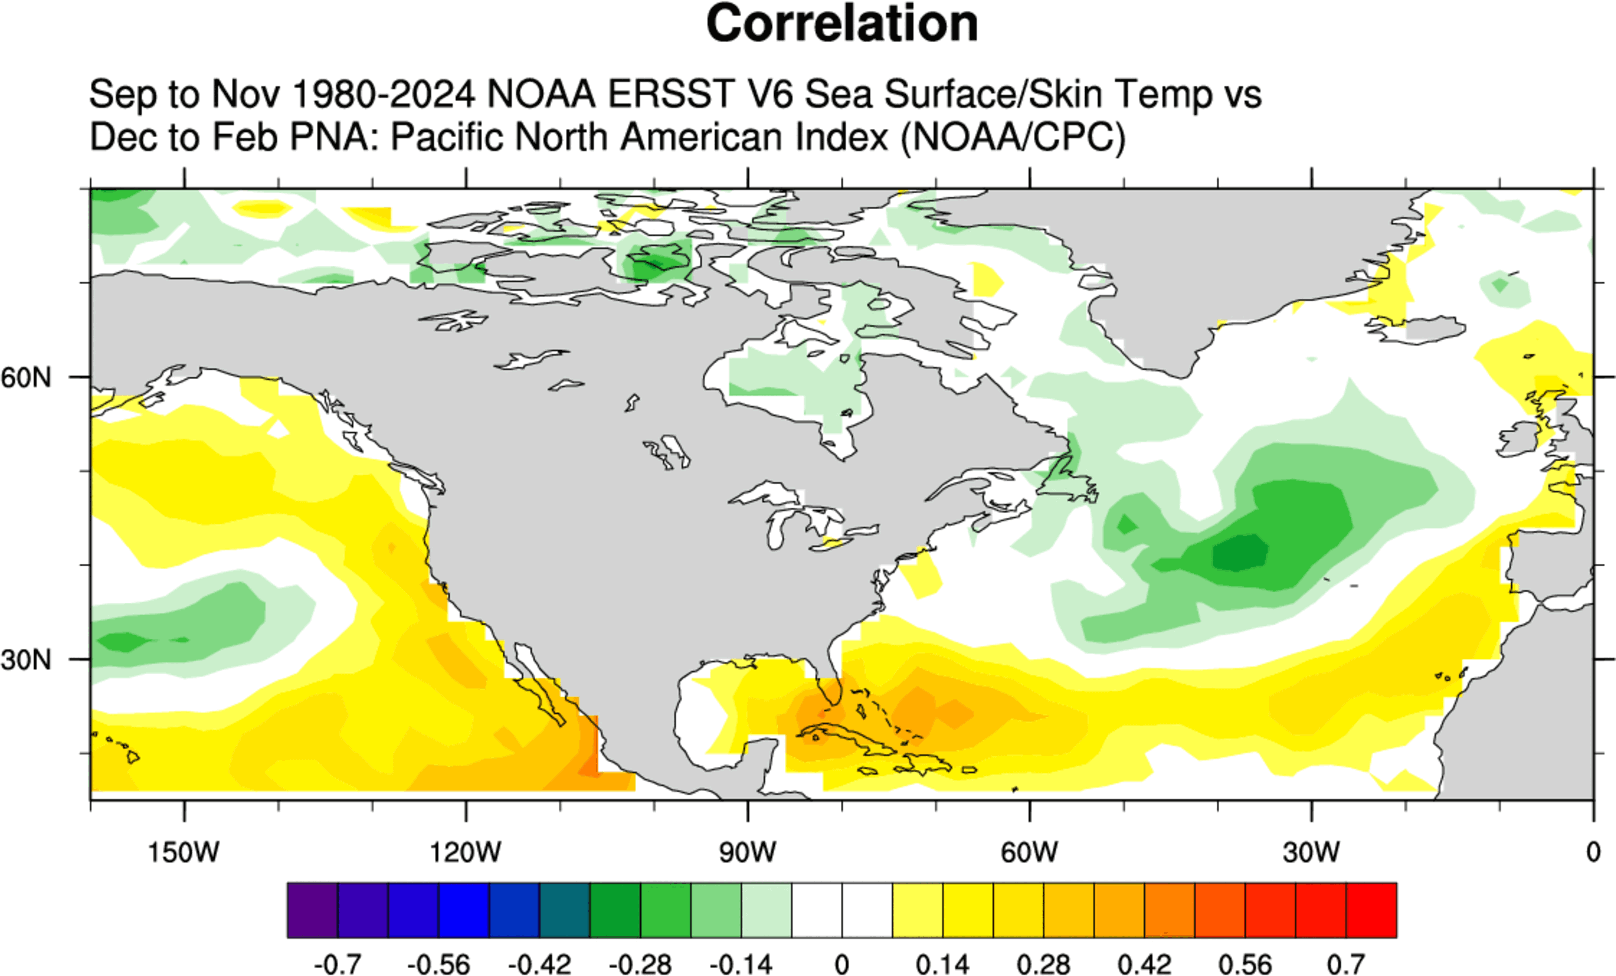
You can see a fairly good connection between the positive PNA and the ocean anomalies. The image above shows the connection between the Fall season ocean temperatures and the positive phase of PNA in Winter.
As mentioned, PNA stands for the Pacific–North American pattern. It has two phases, positive and negative, and it explains the pressure anomalies between the North Pacific and North America. Below is the Winter during a positive PNA phase.
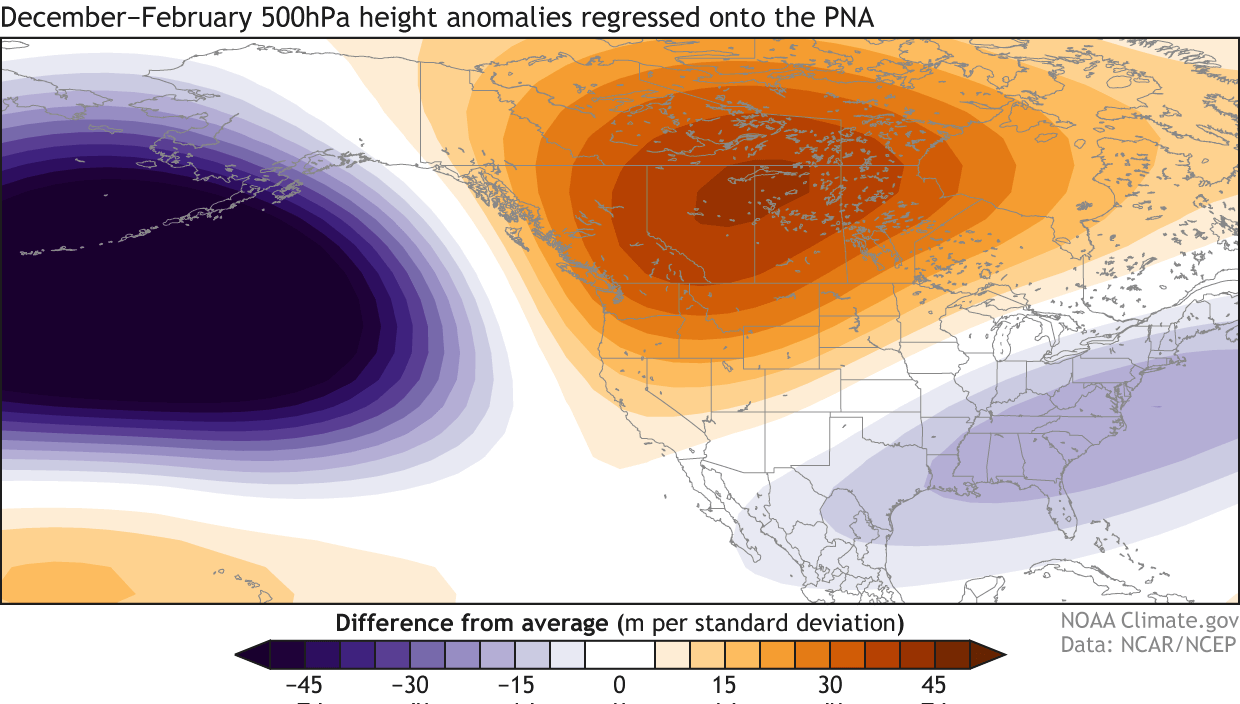
As you can see, a positive PNA pattern indicates a high-pressure system over the northwestern United States and western Canada. That creates a low-pressure area over the central, southern, and eastern United States, which promotes a more northerly flow in these regions.
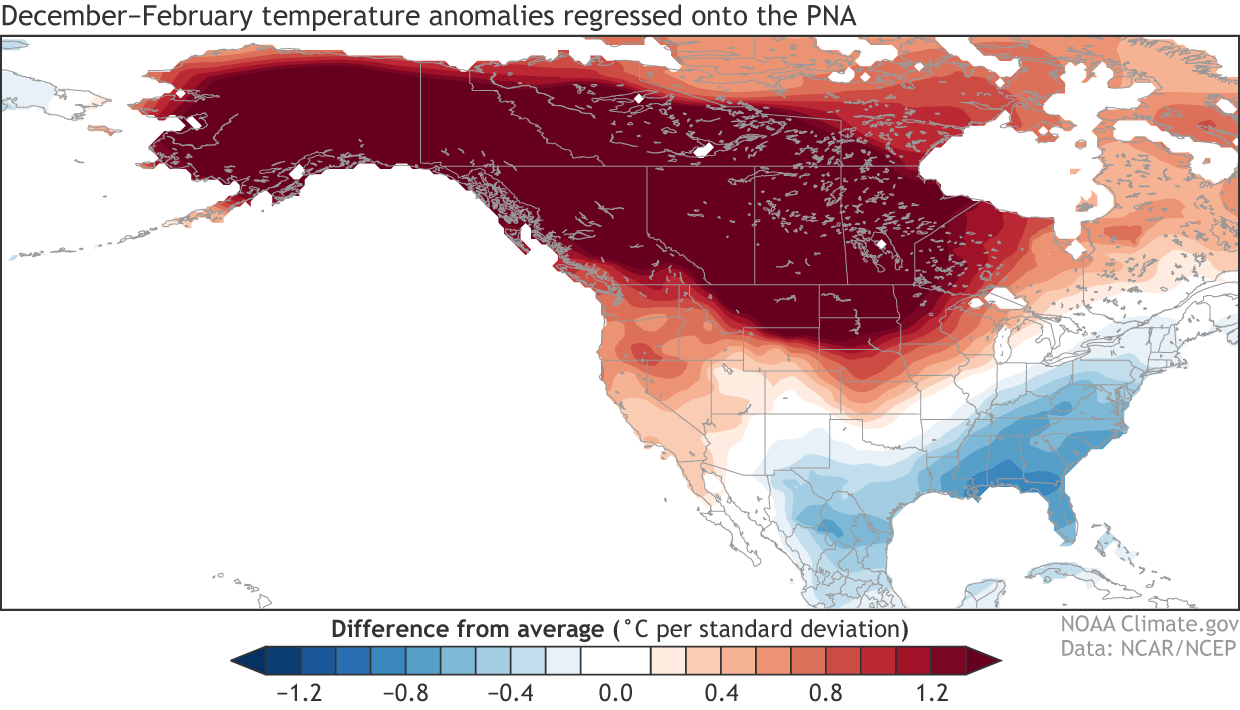
Below is the Winter temperature pattern during a positive PNA phase. As you can see, there are strong warm anomalies under the high-pressure area over the northern United States and western Canada. But as mentioned, you can see colder-than-normal winter temperatures over the southern and eastern parts of the United States.
In simple terms, we have observed that historically, a cold anomaly in the far North Atlantic has often been followed by a positive PNA pattern during Winter over the United States and Canada. This does not mean that the cold anomaly itself is responsible for a colder winter over the eastern United States, for example.
As we mentioned already in the intro, ocean anomalies can sometimes be more of an indicator of large-scale changes in the atmosphere. So, for example, having a cold anomaly in the North Atlantic corresponds to some atmospheric conditions that also favor a positive PNA pattern over North America in the following Winter.
A COLD WINTER 2025/2026 BREWING?
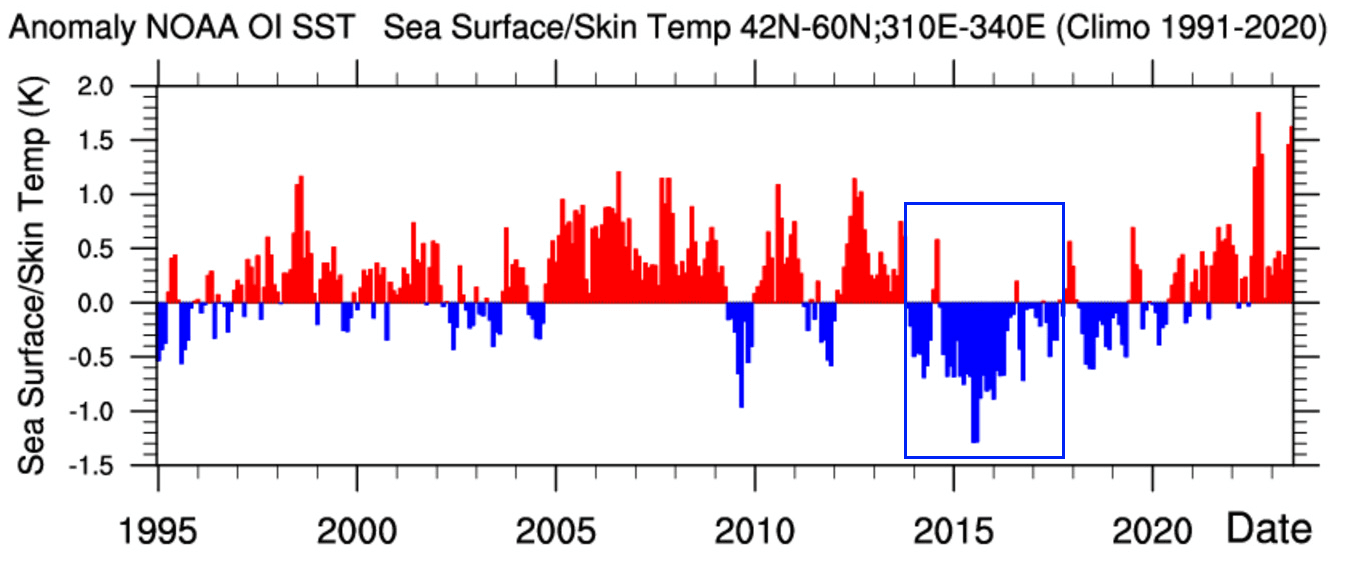
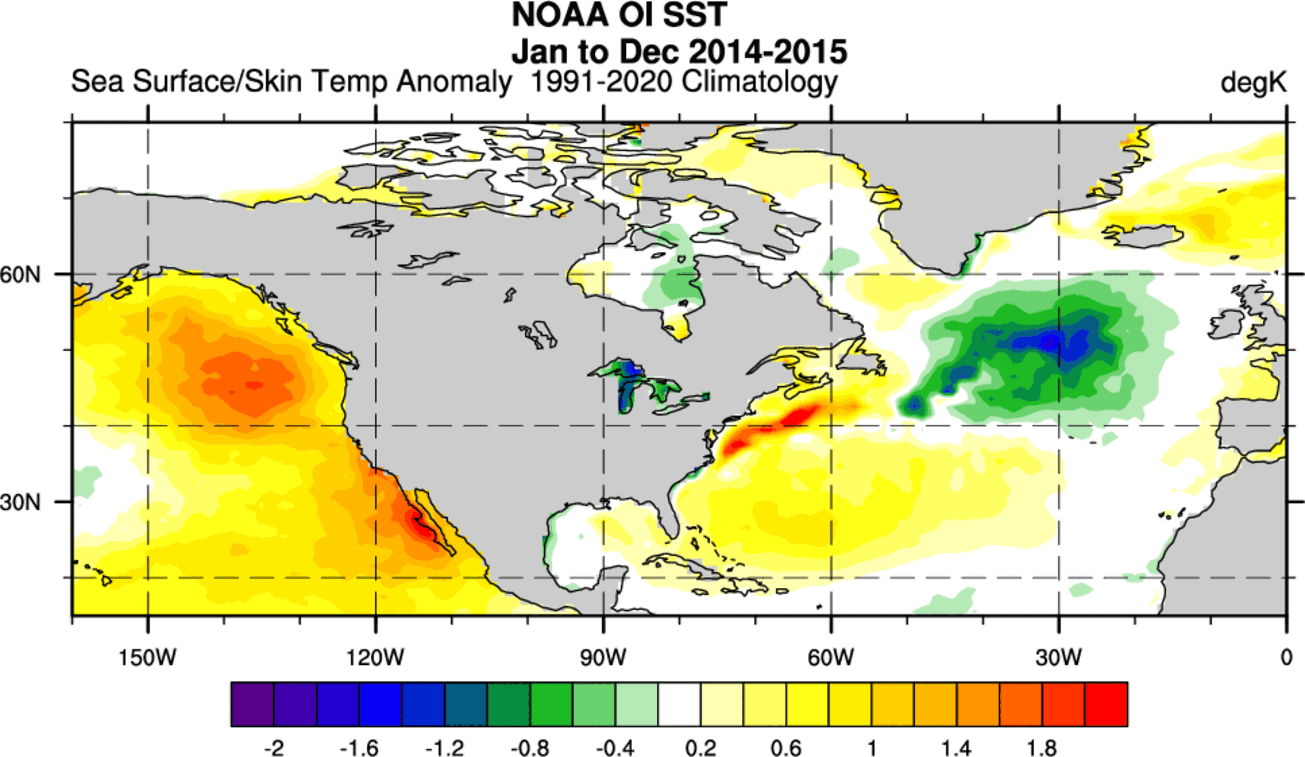
We can look back at the data to find the last large cold anomaly in the northern Atlantic. The graph below shows the temperature anomaly in this area for the past 30 years, and you can see a large cold anomaly in the 2014-2016 period.
The image below shows ocean temperatures in that period, and you can see a very familiar pattern. A cold anomaly is present in the far North Atlantic, with warmer waters off the west coast of the United States and Canada. This is the exact pattern that was indicated for a positive PNA pattern.
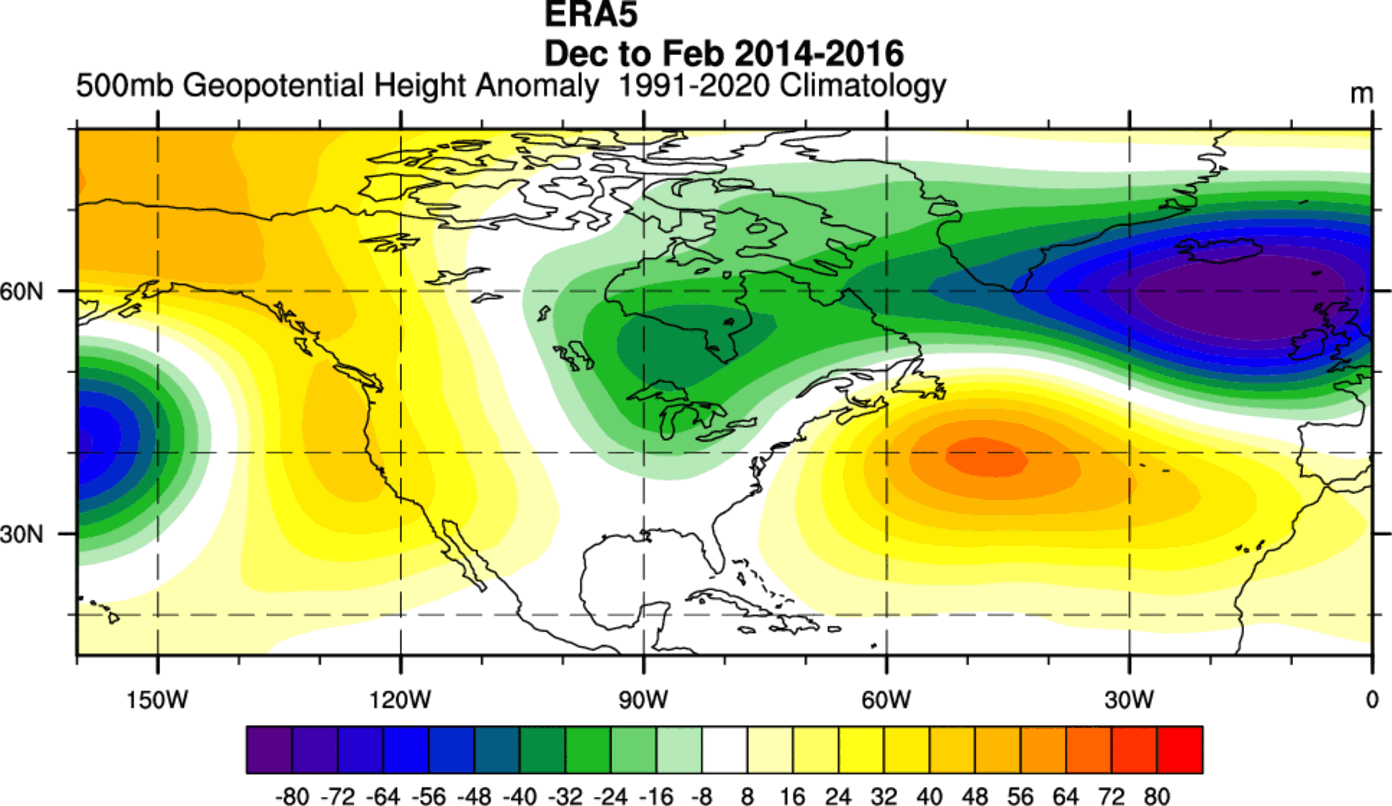
Below is the Winter pressure analysis for those winters. As you can see, it’s an obvious positive PNA pattern, with higher pressure over the western and northwestern United States and western Canada. A low-pressure area was present over the eastern United States, the Midwest, and eastern Canada. This is a multi-year average, so individual winter patterns can vary.
The resulting winter temperature pattern shows colder-than-normal temperatures across the Midwest, the whole of eastern United States, and eastern Canada. This is due to the influence of a low-pressure system over the east, which creates a northerly flow across the eastern half of the United States and Canada.
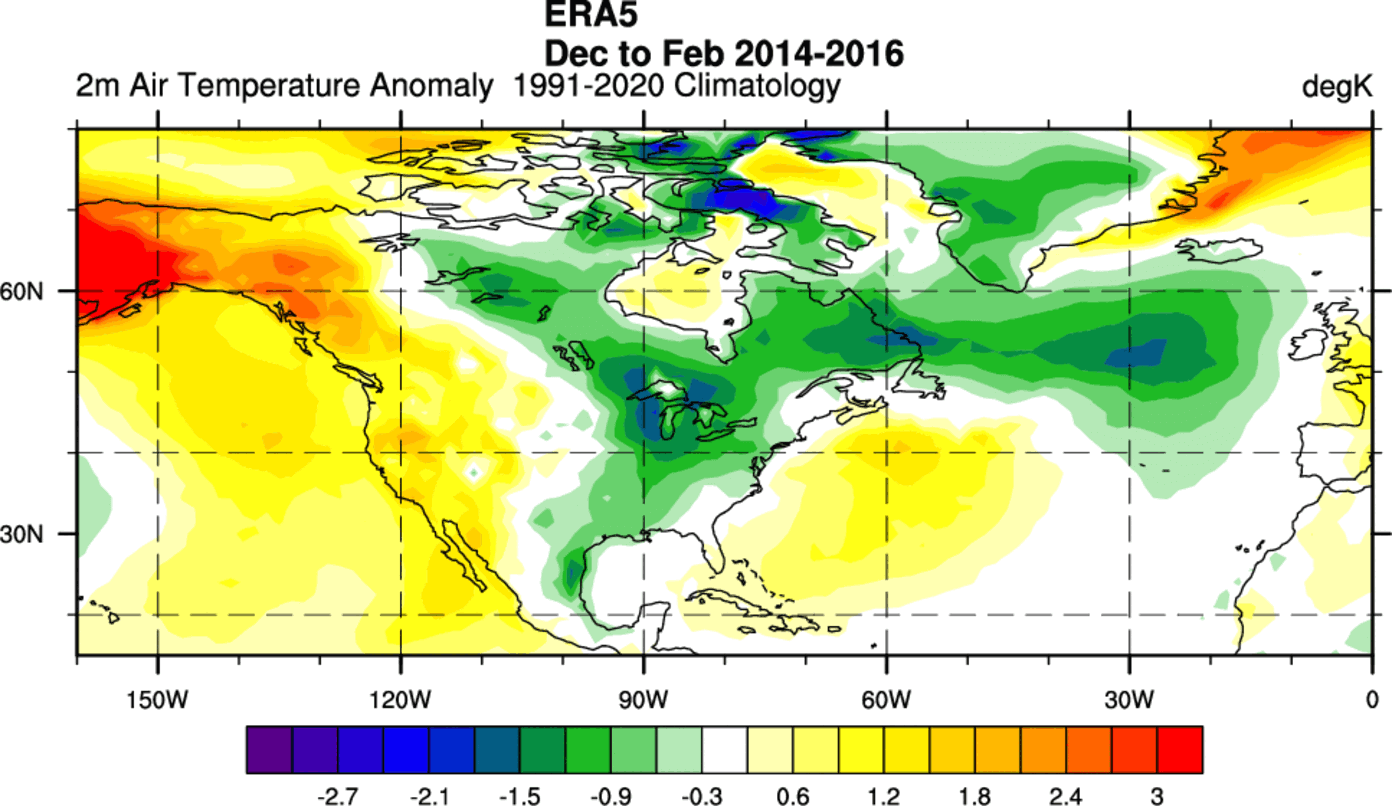
Due to the high-pressure area, there were above-normal temperatures over the western United States and western Canada.
We can look at the far-reaching long-range predictions to see what the same forecast, which also predicts the cold anomaly in the Atlantic, shows for the early Winter weather patterns.
Below is the December 2025 pressure anomaly forecast, from the same model that we showed above for the ocean temperatures. You can see that this model shows the exact positive PNA pattern, with a high-pressure over the western United States and Canada and the low-pressure area over the east.

But keep in mind that these are very far-reaching forecasts and are in no way fixed scenarios. We have added this early Winter forecast to show the connection between the cold forecast of the North Atlantic and the resulting weather patterns in Winter over North America.
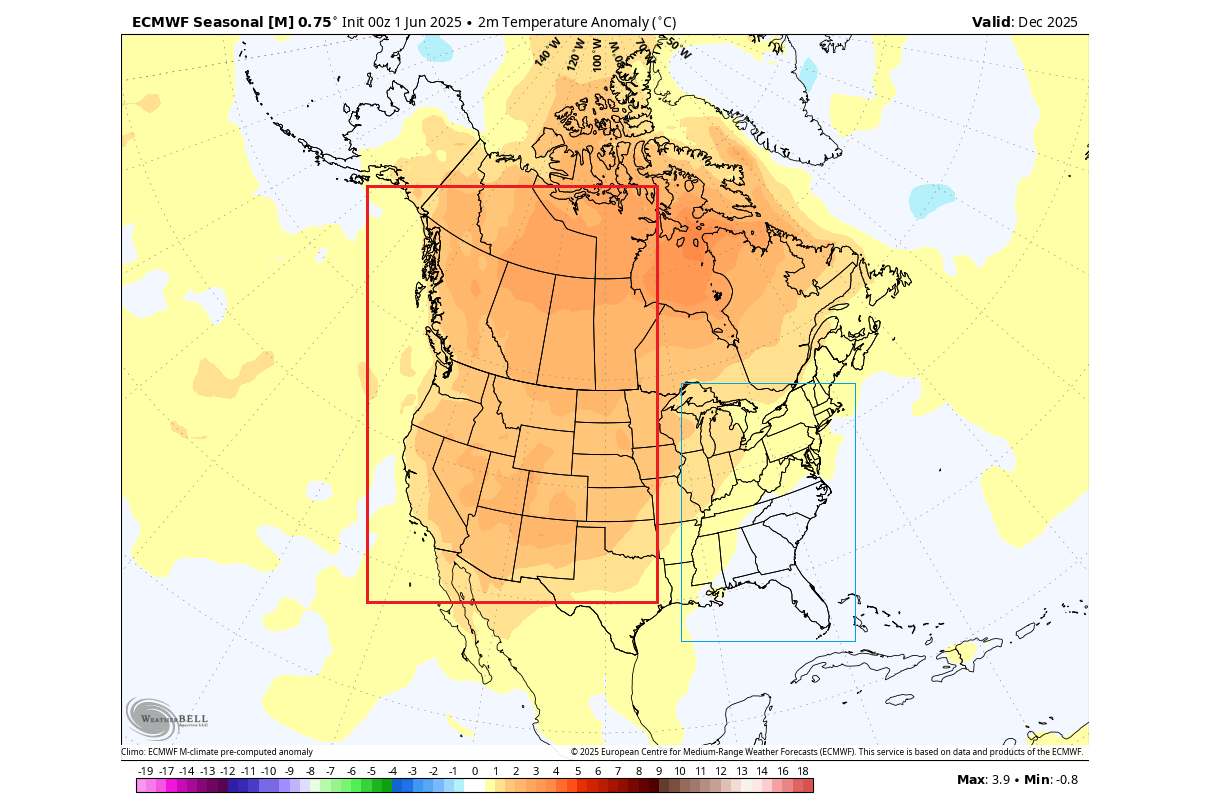
The resulting temperature forecast for the same period shows a large area of above-normal temperatures, covering the western and central parts of the United States and Canada. There is never a clear cold anomaly over land in this model at this range, but it properly shows a hint of colder potential over the eastern United States.
All in all, the prediction of the cold ocean anomalies and the resulting Winter weather patterns over the United States and Canada fits perfectly with past events. This further confirms our research of a connection between those regions and the resulting weather patterns over North America.
But as we mentioned before, we can’t really say that colder temperatures in the North Atlantic can bring a colder winter to the United States on their own. It’s most likely that the same atmospheric conditions that create these cold oceanic anomalies also help to create a specific colder Winter pattern over the United States and Canada.
So in the end, we can look at the ocean anomalies like control lights on the dashboard of your car, where they indicate something is going on. Just like that, we can also look at what nature is trying to tell us, and what has occurred and resulted from past such events.
Make sure to bookmark our page, so you don’t miss any latest weather forecasts and updates. Also, if you have seen this article in the Google App (Discover) feed, click the like button (♥) there to see more of our forecasts and our latest articles on weather and nature in general.
SEE ALSO: