Imagine a vast expanse of ocean, its surface a dynamic tapestry of temperature variations. This is where Sea Surface Temperature (SST) comes into play—an essential indicator that holds the secrets of our planet’s health. As climate change becomes an ever-pressing concern and weather patterns shift unpredictably, the measurement of SST emerges as a critical endeavour.
This article delves into the realm of SST measurement, uncovering the methods scientists use to decipher the ocean’s vital signs and the profound impact this data has on our world. From the traditional techniques that sailors have relied upon for centuries to the cutting-edge satellites orbiting high above, join us on a journey to comprehend the heartbeat of our oceans and their undeniable connection to the global ecosystem.
Oceans: Earth’s Lifeblood and Climate Regulators
Before we dive deeper into the realm of Sea Surface Temperature (SST) measurement, it’s essential to recognize the critical role that oceans play in shaping our planet’s climate, ecosystems, and even the air we breathe. Covering more than 70% of Earth’s surface, the oceans act as a dynamic engine, driving weather patterns, regulating temperatures, and supporting various life forms.
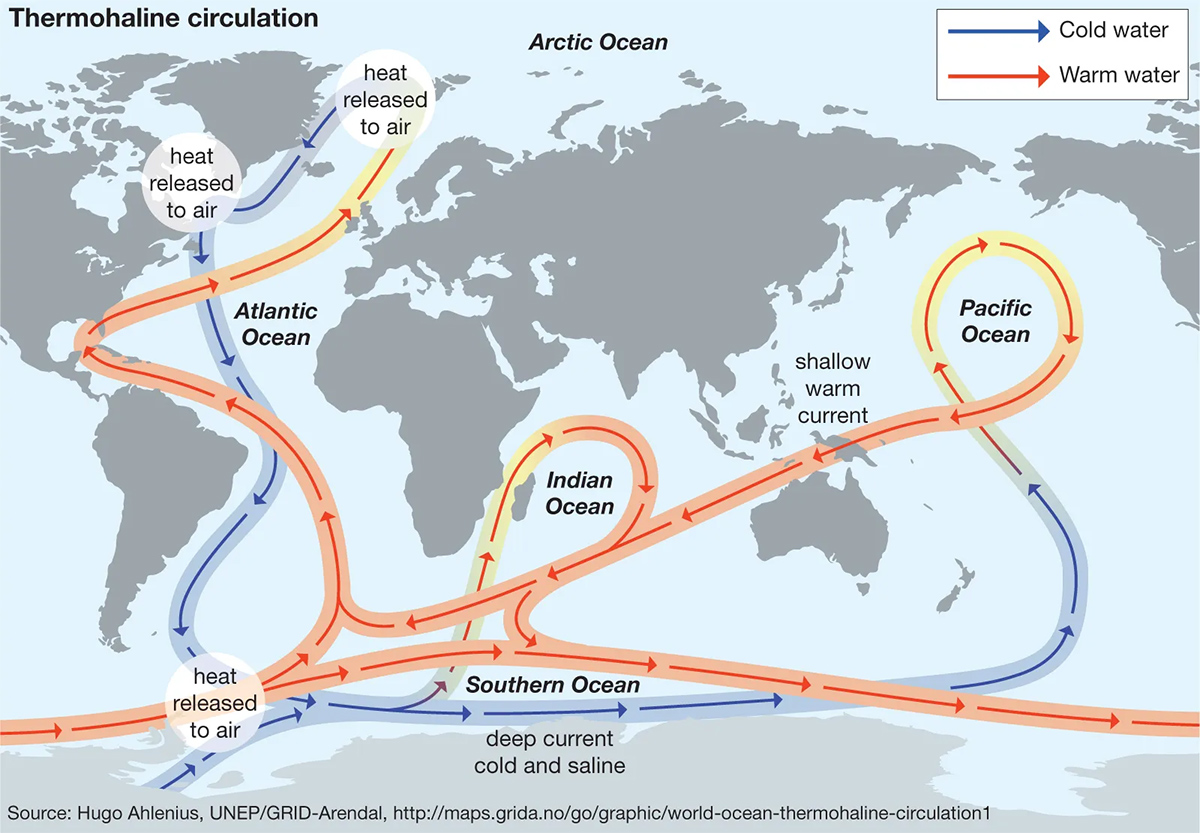
The oceans serve as vast heat reservoirs, absorbing and storing immense solar energy. This heat storage capacity significantly influences climate stability, as oceans release absorbed heat slowly, moderating temperature extremes. In this regard, oceans act as Earth’s natural climate regulators, distributing warmth from the equator to higher latitudes and playing a crucial role in shaping global weather patterns.
Moreover, oceans are intricately connected to atmospheric processes. Evaporation from the ocean’s surface fuels the water cycle, forming clouds and precipitation. These processes replenish freshwater sources and influence regional climates and weather events, including monsoons, hurricanes, and typhoons.
SST as the Pulse of the Oceans
Within this vast aqueous realm, Sea Surface Temperature (SST) emerges as a pivotal indicator, akin to the ocean’s heartbeat. SST captures the temperature of the ocean’s top layer, which is vital for marine life and holds the keys to understanding larger planetary changes. The health of marine ecosystems, the intensity of weather systems, and the ever-present specter of climate change are all intricately linked to variations in SST.
As we embark on a journey to uncover the methods behind measuring SST, it’s crucial to recognize that our exploration is not just about numbers and data points; it’s a voyage to decipher the oceans’ language—the language of temperature fluctuations that impact everything from the behavior of marine species to the intensity of storms that shape our coasts.
Methods of Measuring Sea Surface Temperature (SST)
In the early days of maritime exploration, sailors relied on rudimentary methods to gauge the temperature of the ocean’s surface. Buckets lowered into the water, equipped with thermometers, provided localized measurements. While these efforts were instrumental in understanding the basics of ocean temperature, they presented limitations due to their sporadic nature and inability to cover vast oceanic expanses.

As technology advanced, so did our methods of measuring SST. The emergence of modern tools has enabled scientists to acquire a more comprehensive, accurate, and real-time understanding of this critical parameter. Here, we explore traditional and cutting-edge approaches that have reshaped how we perceive and quantify the temperature of our oceans.
Buoys and Ships
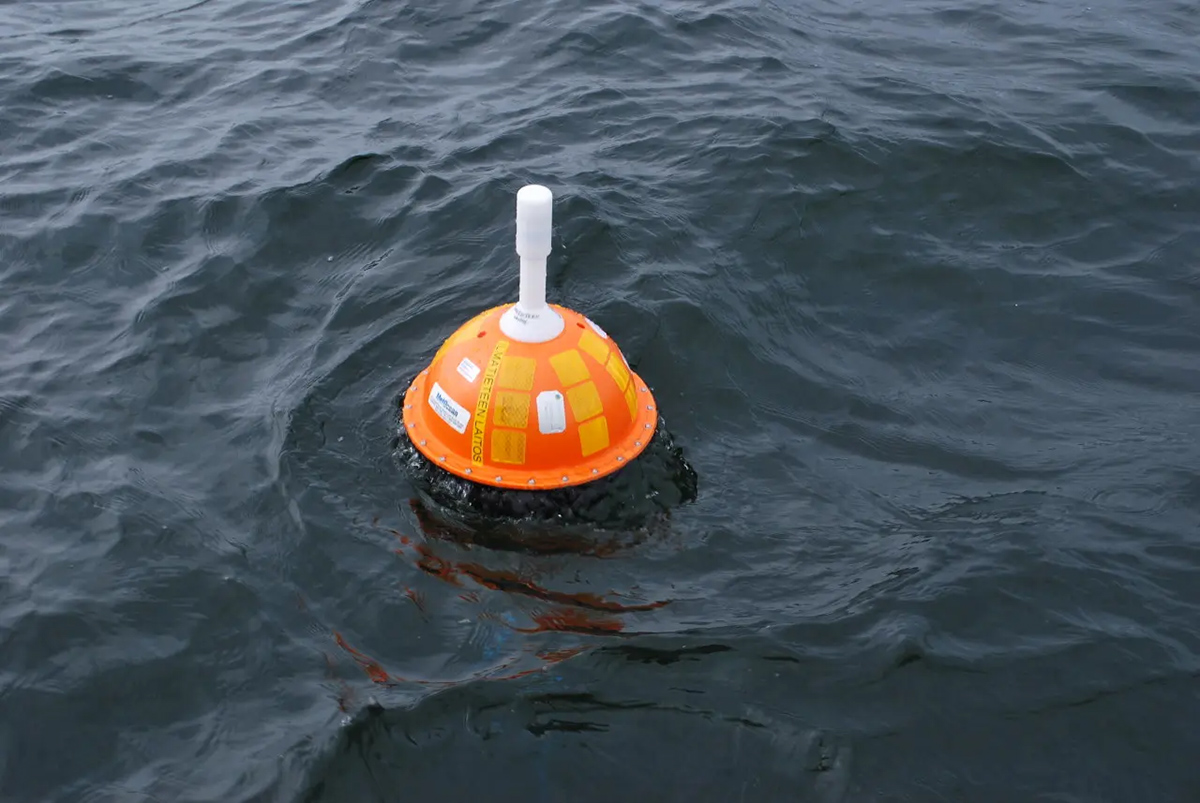
Ocean buoys, which resemble miniature research stations, revolutionized the gathering of SST data. Fitted with temperature sensors, these buoys drift atop the water’s surface, recording and transmitting real-time measurements to satellites orbiting above. This automated approach freed researchers from the constraints of manually collecting data, providing a continuous stream of temperature insights from diverse regions of the world’s oceans.
Ships, too, played a pivotal role in SST measurement. As vessels crisscrossed the oceans, crew members employed thermometers to gauge the temperature of the ocean’s top layer. Although limited in scope and prone to inconsistencies due to ship movements, these measurements contributed to our early understanding of SST patterns. Ship-based measurements often relied on drawing water from engine room intakes, providing a consistent data source that informed maritime operations and research endeavors.
Expendable Bathythermographs (XBTs)
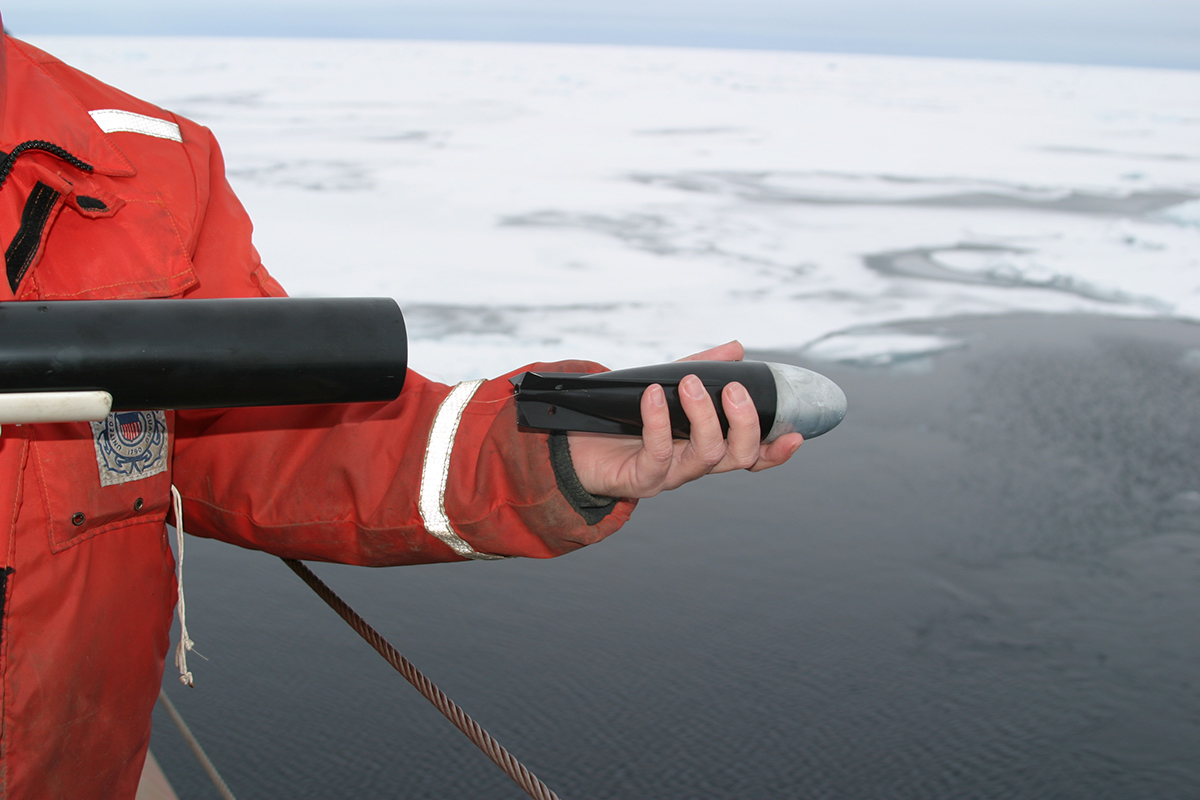
Imagine a small device resembling a missile being dropped from a ship into the ocean’s depths. This Expendable Bathythermograph (XBT) diligently records temperature data at various depths as it descends. This method allows researchers to profile temperature variations below the surface, revealing the ocean’s vertical temperature structure.
While XBTs provide valuable information, they are inherently limited by their vertical nature. These devices offer temperature snapshots at specific depths along their descent, making them ideal for capturing thermal changes within the water column. However, their single-point measurements fall short of capturing the broader horizontal temperature patterns that shape SST dynamics across vast ocean expanses.
Transition to Satellite Technology: Revolutionizing Sea Surface Temperature Measurement
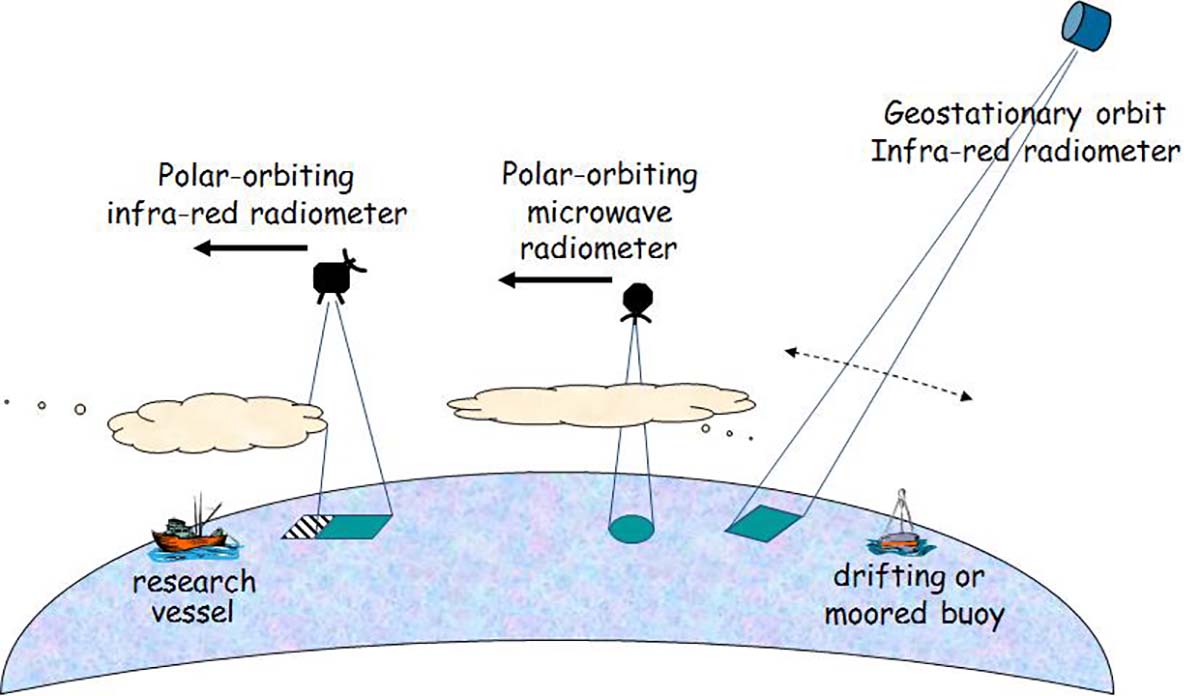
Satellite technology, operating in both Geostationary (GEO) and Low Earth Orbit (LEO), has unfurled a new chapter in understanding oceanic behavior, illuminating the mysteries hidden within SST and elevating the measurement of ocean temperatures to an art form – an art of deciphering the ocean’s thermal signature.
At the heart of this transformation lies the concept of infrared radiation – the natural heat emitted by objects above absolute zero. Satellites equipped with sophisticated infrared sensors assume the role of our cosmic eyes, capturing this radiation and translating it into data that paints a vivid picture of the ocean’s surface temperature. The intensity of this radiation becomes a reflection of the water’s thermal state. Cooler regions emit subtle signals, while warmer areas radiate vibrant energy signatures. In this intricate interplay of emission, we discern the ocean’s thermal symphony.
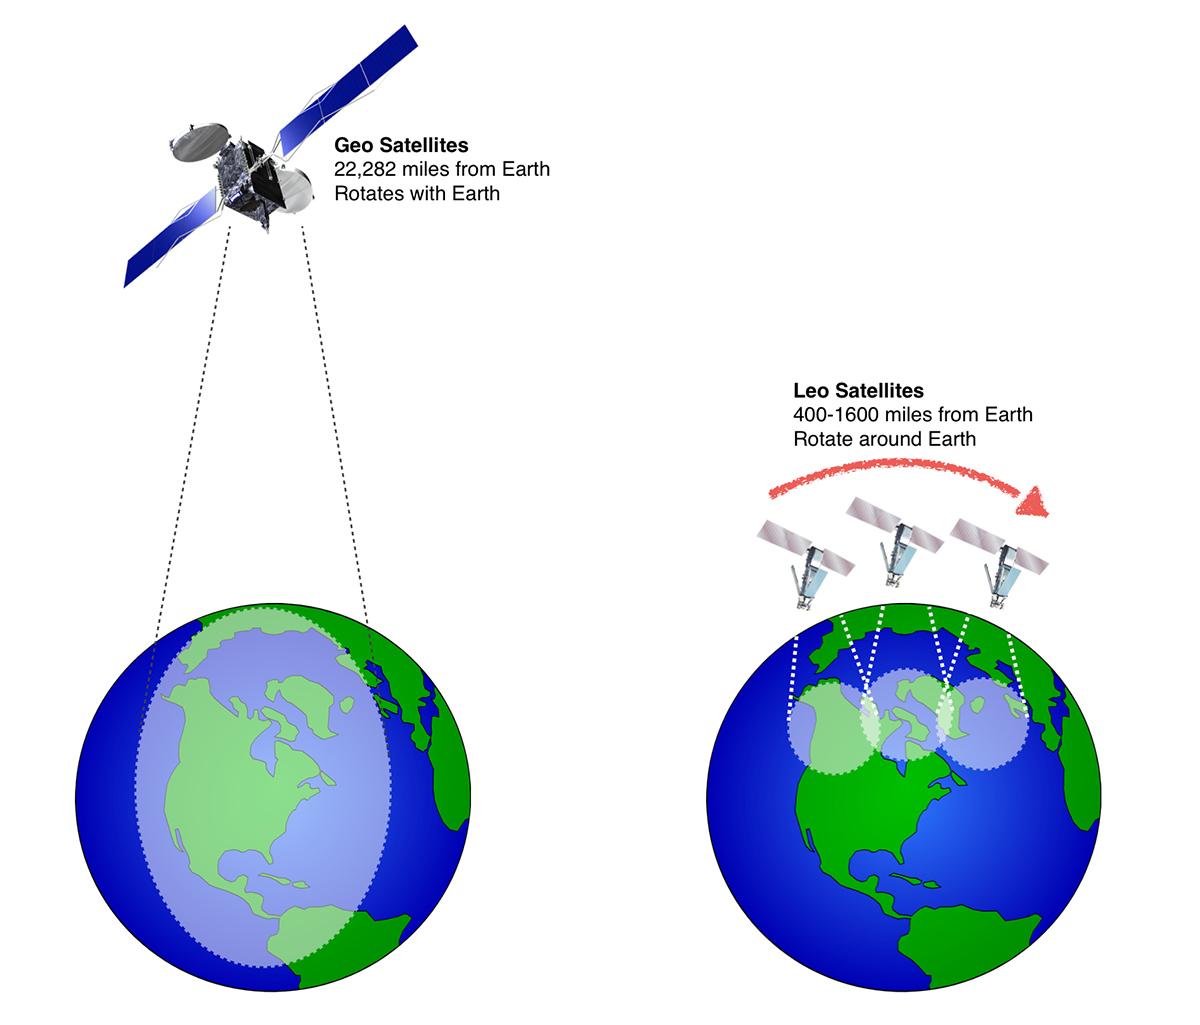
Notably, satellites come in two primary orbital flavors – Geostationary (GEO) and Low Earth Orbit (LEO). GEO satellites, positioned high above Earth, offer a fixed view of a specific region, enabling continuous monitoring but with limited global coverage. On the other hand, LEO satellites orbit closer to Earth, rapidly covering the planet and collecting data from various angles. This dynamic perspective enhances our ability to capture diverse SST patterns, unveiling the ocean’s intricate dance with temperature variations.
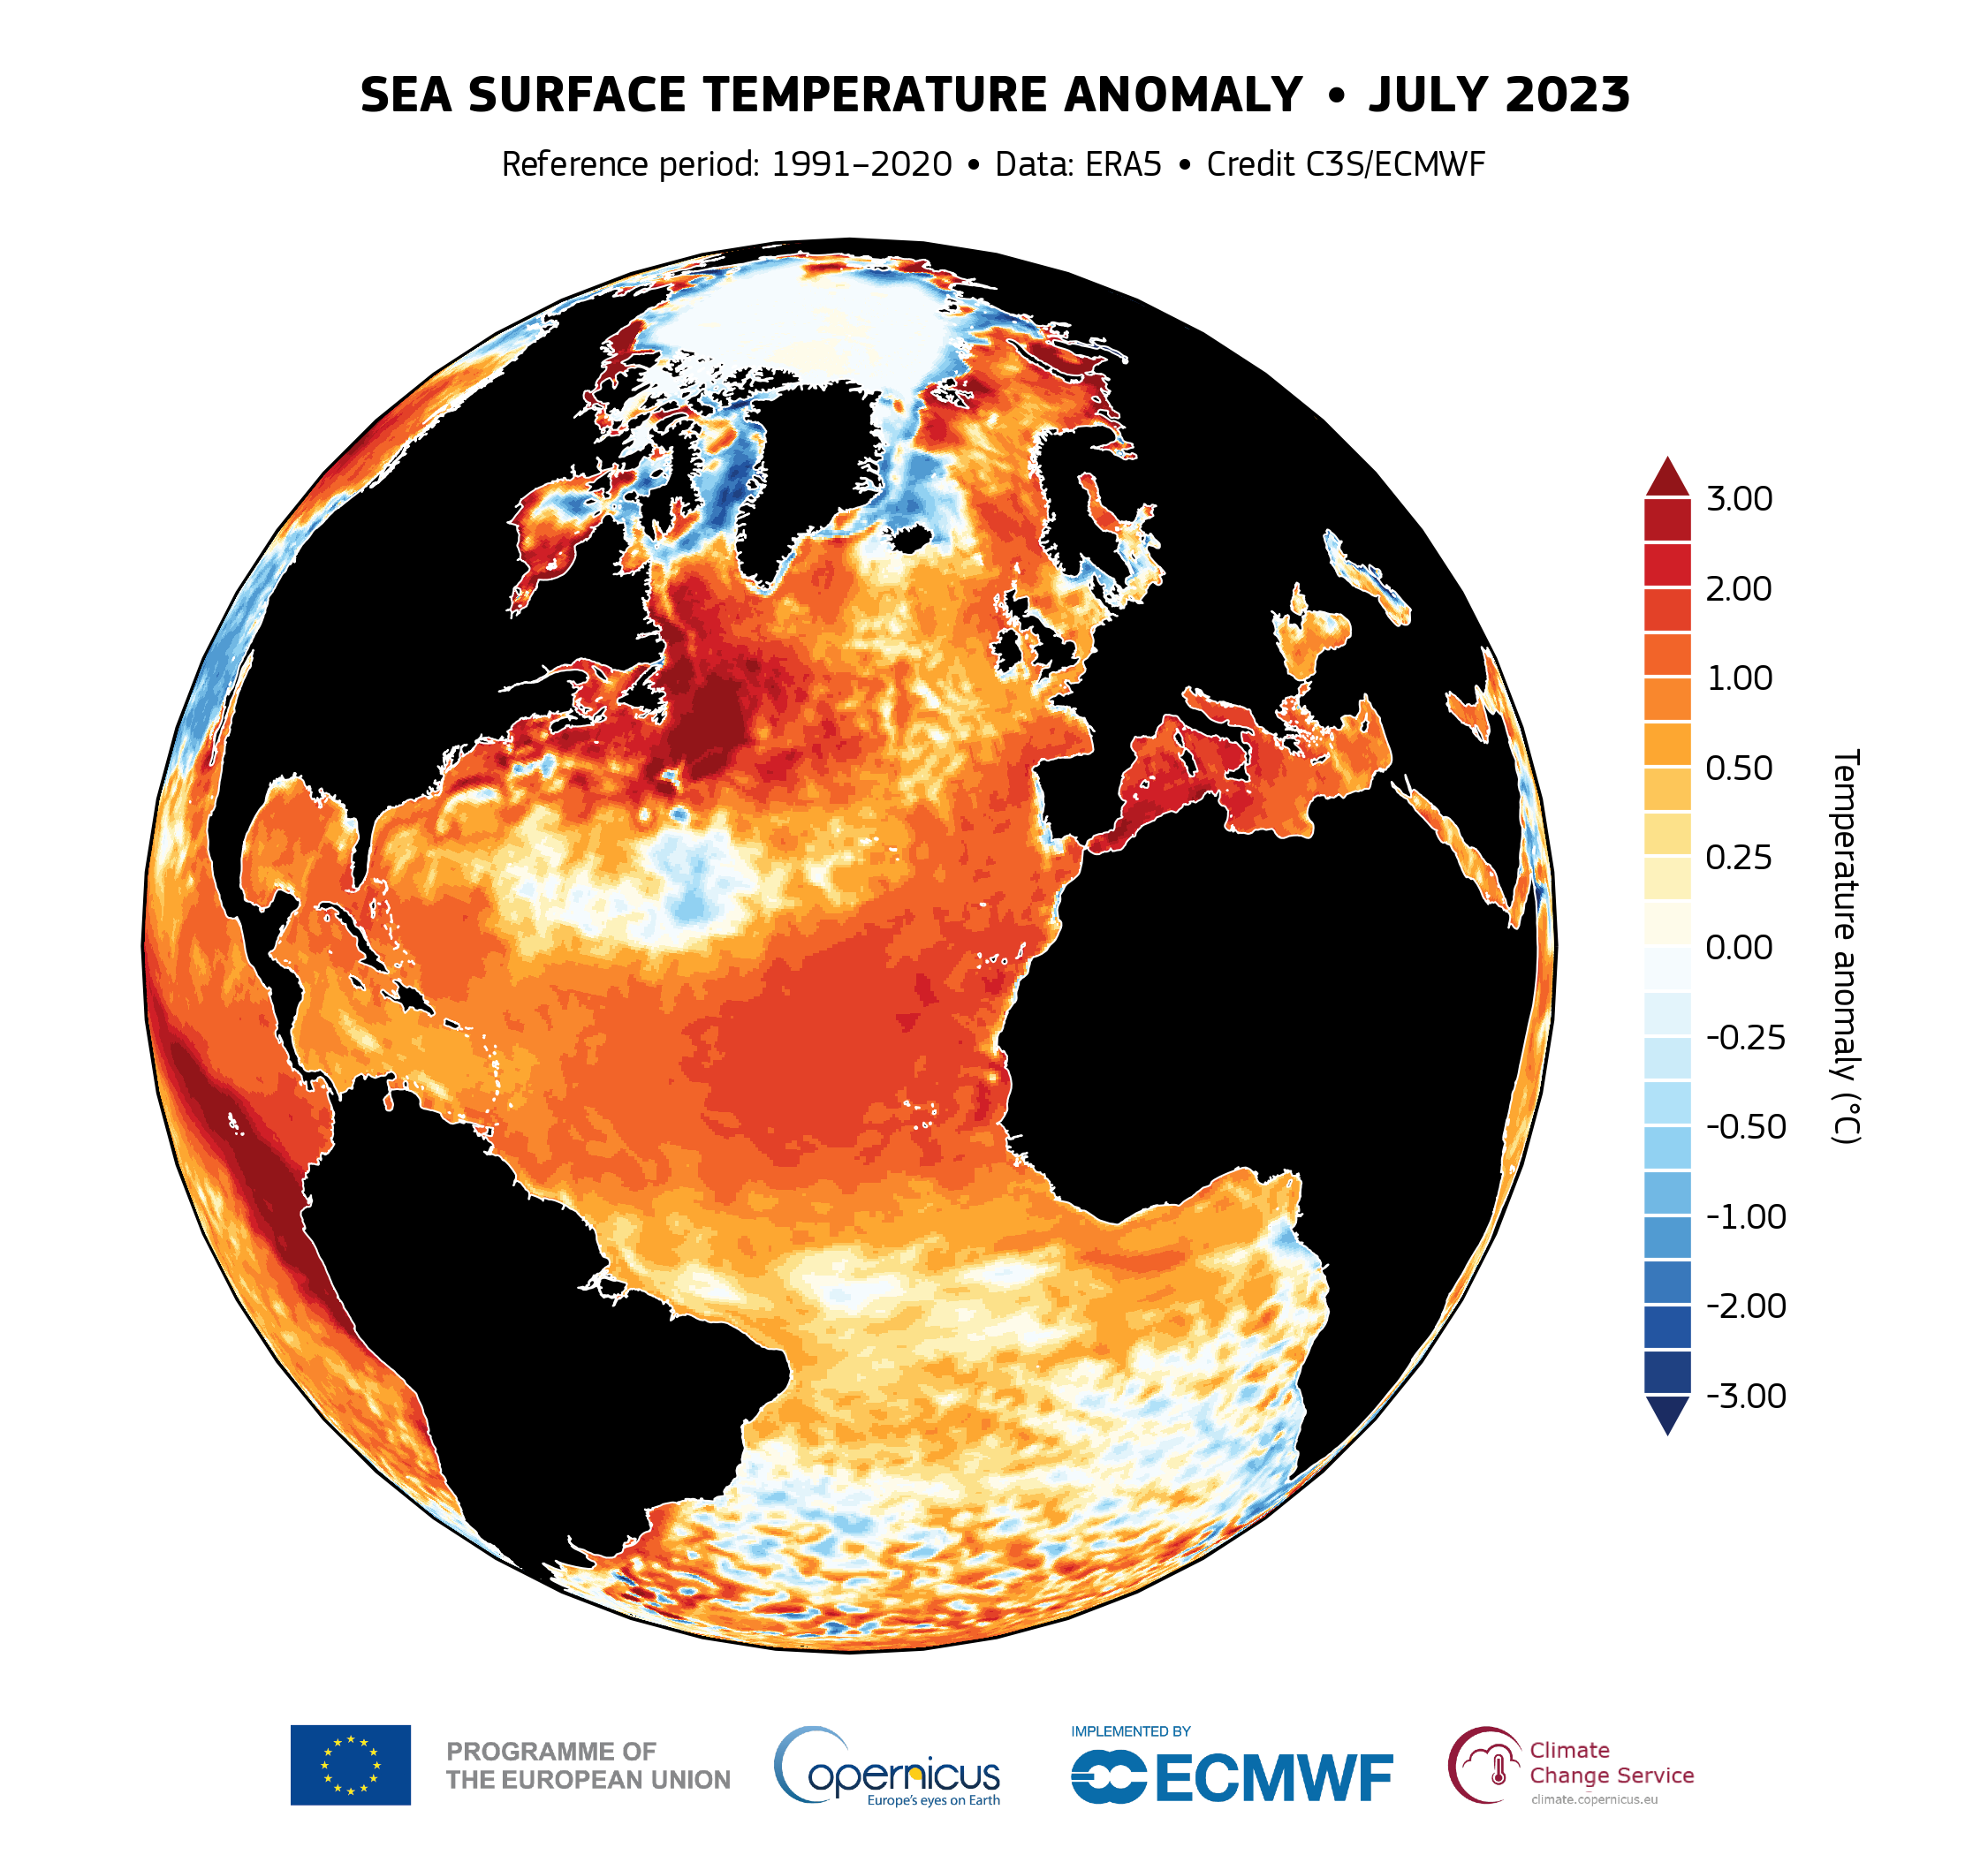
These orbiting observers record the intensity of infrared radiation, pixel by pixel. Sophisticated algorithms work their magic, translating these measurements into comprehensive SST maps. Each pixel paints a story of temperature, representing a distinct value on the canvas of the ocean’s vastness. This visual tapestry captures the rhythm of the sea – its warm currents, its cold depths, and the delicate interplay of heat exchanges.
The beauty of satellite infrared remote sensing lies in its power to reveal anomalies that would otherwise remain shrouded. Anomalously warm patches betray oceanic heatwaves, while the cool wake left by a passing tropical cyclone becomes visible to the observing eye. With precision, we witness the intricate dance of temperature changes during an El Niño event – an unfolding story that satellites capture, frame by frame.
Infrared radiometer
All objects emit electromagnetic radiation as photons at temperatures above absolute zero (-273.15°C or 0 Kelvin). The amount and wavelength of this radiation correlate with the object’s temperature. Higher temperatures lead to more radiation emission, and cooler objects emit longer wavelengths of radiation.
An infrared radiometer incorporates a sensor or detector to perceive these emitted photons. This sensor is finely attuned to infrared wavelengths, typically within the 3 to 14 micrometers range. This range aligns with the thermal emissions range of various surfaces, including the ocean’s surface.
The radiometer’s sensor gauges the intensity of the emitted infrared radiation from the observed object. In measuring Sea Surface Temperature (SST), the sensor is specifically aimed at the sea surface. The sensor’s readings furnish valuable insights into the surface’s temperature, as objects with higher temperatures emit infrared radiation of greater intensity.
For accuracy, radiometers undergo meticulous calibration procedures. Furthermore, they factor in atmospheric influences that absorb and emit infrared radiation. Advanced radiometers are equipped to measure atmospheric conditions, enabling scientists to correct for these effects. This correction ensures the attainment of precise SST readings.
Subsequently, the sensor readings are transformed into digital data, which undergoes processing to derive the Sea Surface Temperature. This process involves intricate calculations that consider factors such as the radiation’s intensity, the sensor’s calibration, and the adjustments for atmospheric impacts. The radiometer translates invisible thermal radiation into tangible insights about the ocean’s temperature through these steps.
Satellite infrared remote sensing is not confined to the present – it builds a living archive of temperature data that spans decades. Over time, these orbiting guardians amass a record of temperature patterns. This historical vault of information is more than data; it’s a window into the past, guiding us in identifying climate change signals and helping us navigate the complex influences on our planet’s equilibrium.
Microwave Sensors
Microwave sensors function based on microwave radiation – a form of electromagnetic energy. When emitted, microwaves interact with surfaces by being reflected, absorbed, or transmitted, depending on the surface’s characteristics. These sensors are often designed to work at specific microwave frequencies, each offering unique interactions with the observed surfaces.
The key to microwave remote sensing lies in the dielectric properties of materials. These properties determine how well a material can store and transmit electric energy when subjected to an electromagnetic field. Water, especially in its various forms, possesses distinct dielectric properties. This property becomes particularly significant when it comes to SST measurement.
Microwave sensors measure what’s known as “brightness temperature.” This temperature signifies the hypothetical temperature a surface would need to be at to emit the same amount of microwave radiation as the observed surface. In the context of SST measurement, brightness temperature is a surrogate for the intensity of microwave radiation emitted by the sea surface.
Complex mathematical models have been developed to connect observed brightness temperatures to actual surface parameters. These models account for factors like water’s dielectric properties, surface roughness, atmospheric interferences, and the specific characteristics of the sensor. Researchers can deduce accurate SST values by analyzing observed brightness temperature and applying these intricate models.
As with any precision instrument, calibration is essential to ensure reliability. Microwave sensors undergo calibration, which involves comparing the sensor’s readings to known reference values. This step guarantees accuracy in translating brightness temperatures into meaningful SST measurements. Additionally, the data collected by these sensors undergo validation by comparing them with ground-based measurements and other reliable sources of SST information.
Satellites are often equipped with microwave sensors placed in Low Earth Orbit (LEO) or polar orbits. These satellites sweep the Earth’s surface, capturing microwave emissions from various angles.
In summary, microwave sensors operate by emitting microwave radiation toward the Earth’s surface and measuring the radiation reflected or emitted by the surface. The interaction between microwaves and the surface and materials’ dielectric properties provides valuable insights into parameters like Sea Surface Temperature.
A Century of Rising Seas: Sea Surface Temperature Trends and Future Projections
Over the past century, the Sea Surface Temperature (SST) of our oceans has been on a trajectory of change that holds critical implications for Earth’s climate, ecosystems, and the delicate balance of life beneath the waves. Let’s journey through time to explore the evolution of SST temperatures and the projections that offer insights into the future.
The 20th century saw significant shifts in SST temperatures, largely influenced by human activities and the increasing concentration of greenhouse gases in the atmosphere. From the late 19th century until the mid-20th century, the oceans experienced a period of relative stability. However, as industrialization accelerated and carbon emissions surged, the oceans absorbed excess heat, leading to noticeable warming.
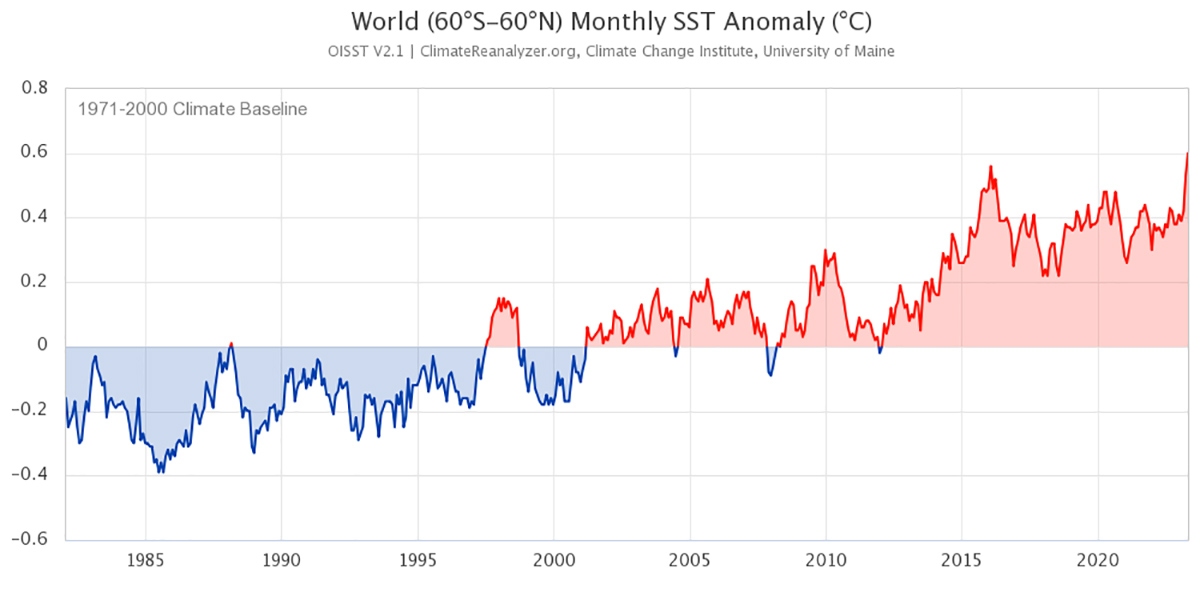
A distinct warming trend emerged in SST data in the latter half of the 20th century and into the 21st century. According to research, the average global SST has increased by about 0.13°C (0.23°F) per decade from 1971 to 2018. This small increase has significant implications for marine ecosystems, oceanic circulation, and weather patterns.
The fingerprints of human activity are evident in this warming trend. Burning fossil fuels, deforestation, and other anthropogenic activities release greenhouse gases, trapping heat in the atmosphere. As the Earth’s surface warms, so do the oceans, absorbing more than 90% of the excess heat generated by these activities.
The future of SST temperatures is a tapestry woven with possibilities—each thread is influenced by our actions, policies, and global efforts to address climate change. Climate models provide projections based on different scenarios of greenhouse gas emissions.
If emissions continue at current rates, SST temperatures are projected to rise between 1.5°C and 2.5°C (2.7°F to 4.5°F) by the end of the century. This trajectory presents challenges, including more frequent and severe heatwaves, coral bleaching events, altered marine habitats, and intensified weather events. Efforts to reduce emissions and transition to renewable energy sources can alter this trajectory. A more ambitious goal of limiting global warming to 1.5°C above pre-industrial levels, as set out in the Paris Agreement, would require rapid and substantial emissions reductions. Even with such efforts, some level of SST increase is expected due to the climate system’s inertia.
As SST temperatures rise, the oceans face both stress and opportunity. Marine organisms must adapt to changing conditions; some ecosystems may shift or transform. Conservation efforts, protecting marine areas, and sustainable fishing practices can enhance the oceans’ resilience and safeguard marine biodiversity.

The story of SST temperatures is an intricate chapter in the unfolding climate change narrative. It serves as a call to action – a reminder that our choices today shape the oceanic world of tomorrow. By committing to sustainable practices, embracing innovation, and working collaboratively globally, we can ensure that the next century’s story is one of balance, harmony, and preserving the oceans’ vital role in our planet’s well-being.
NASA, Finnish Meteorological Institute, ClimateReanalyzer, Climate Copernicus, EUMeTrain, and Energy Matters provided images used in this article.