Strong temperature anomalies appeared in the Gulf Stream area in the North Atlantic. Weather in the United States and Europe depends strongly on this ocean current, so it is important that we understand these changes and what they can tell us for the upcoming Winter 2022/2023.
Not every change in the ocean can be an influence by itself. Changes in the ocean can also result from something much bigger at work, acting like an indicator of what is to come.
We will look at the latest data on the Gulf Stream and the growing ocean anomalies in the past weeks. Also, we will search the historical data for such anomalies in the past and what they can reveal to us for the upcoming Winter 2022/2023.

ATLANTIC OCEAN CIRCULATION
The larger circulation system that homes the Gulf Stream is called the Atlantic Meridional Overturning Circulation (AMOC). The AMOC is a large system of ocean currents in the Atlantic Ocean, driven by differences in temperature and salt content, which affects its density.
The Gulf Stream is the strongest ocean current within the Atlantic Ocean system. It brings warmer waters up from the Gulf of Mexico into the far North Atlantic. It extends up along the eastern coast of the United States, where it starts to turn towards northern Europe.
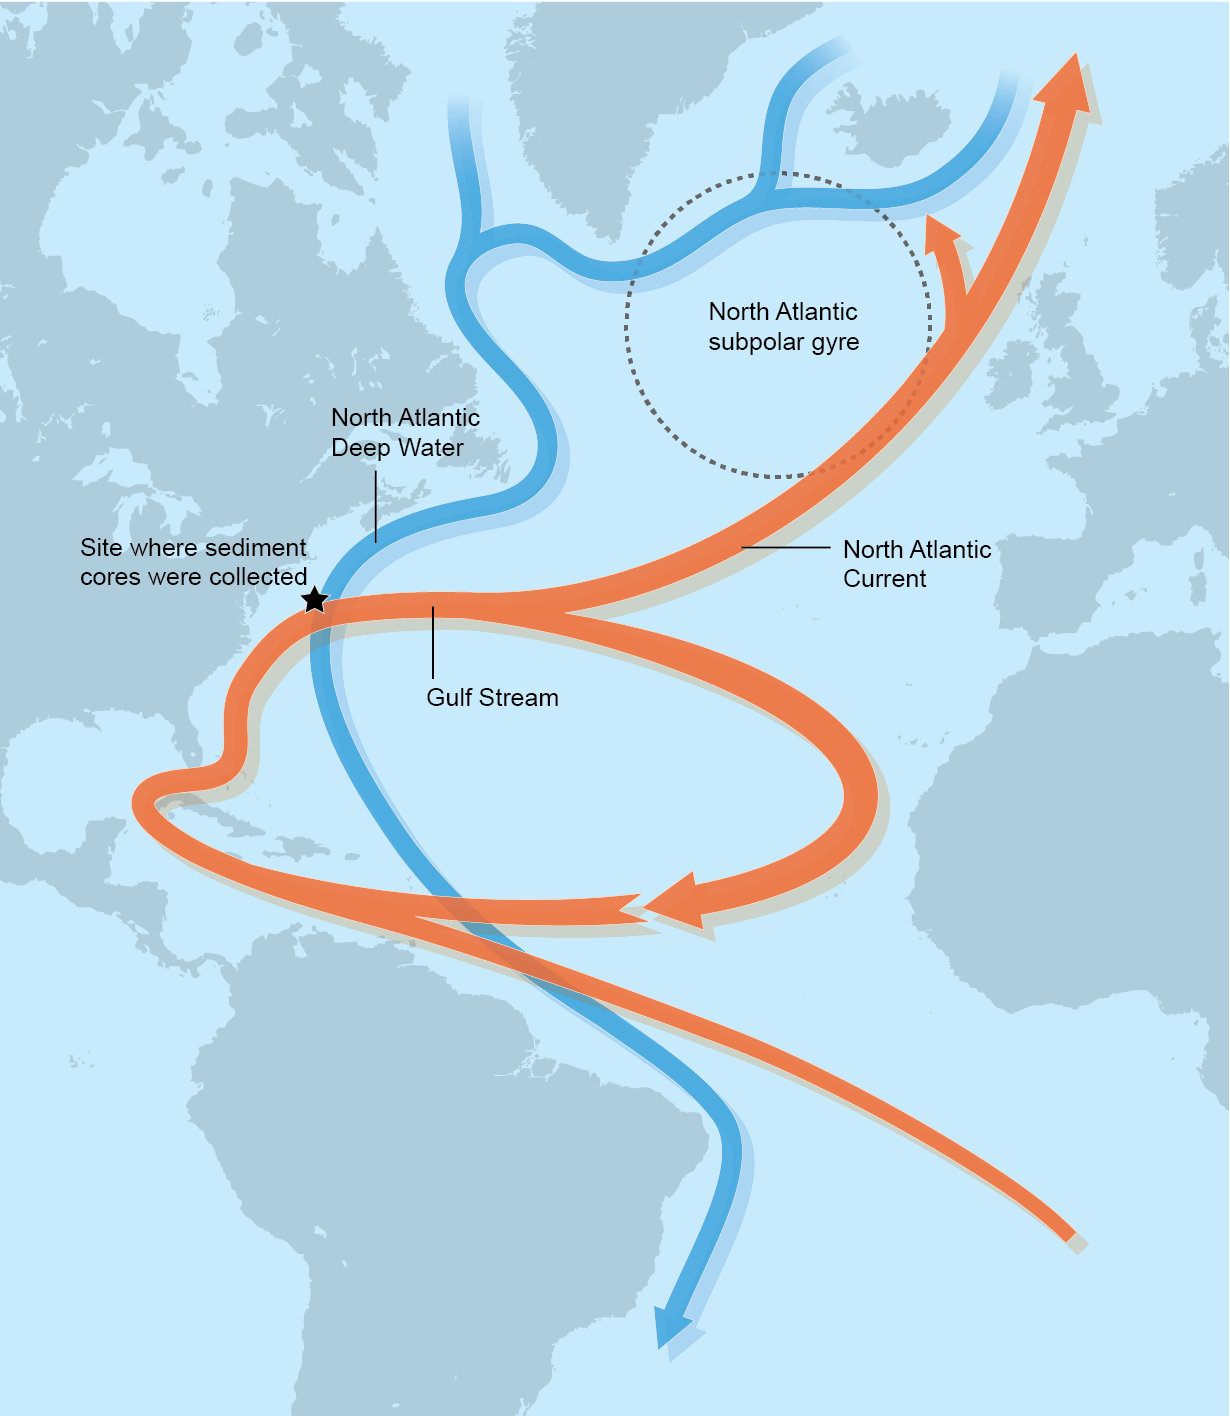
The image below shows a rough schematic of the Gulf stream and where it flows across the North Atlantic. It does not flow in such a straight line, but as you will see, it is very complex and dynamic.

This strong current of warm water directly influences the climate of Florida first. Compared to other southeastern states, it keeps temperatures in Florida warmer during Winter and cooler in the summer.
Since the Gulf Stream also extends towards Europe, it helps to warm the western European countries, having a major impact on the regional climate.
The stream itself is best seen if we look at the ocean temperatures and the surface current speed.
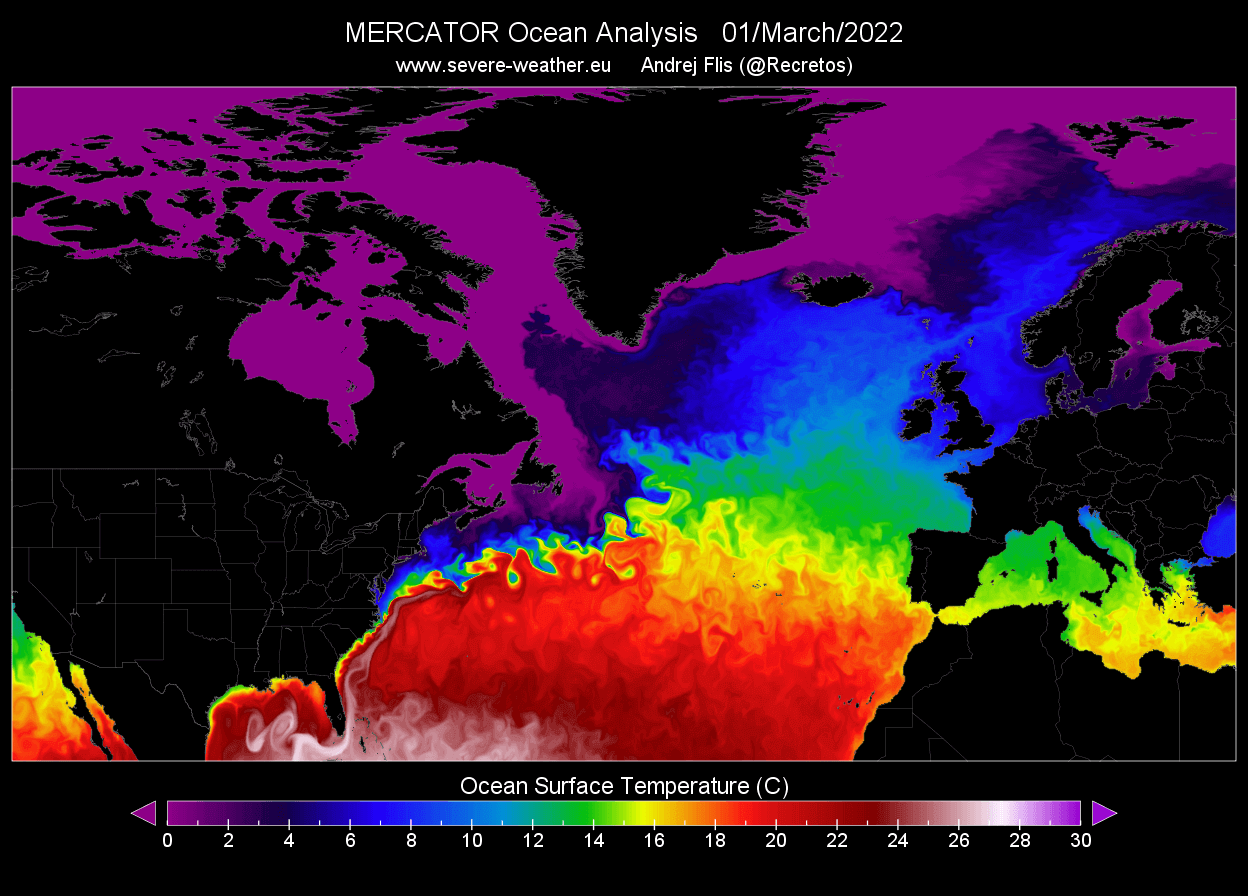
In the image below, you can see the latest ocean surface temperature. Notice the warm stream of water moving up along the eastern coast of the United States, extending far into the North Atlantic.
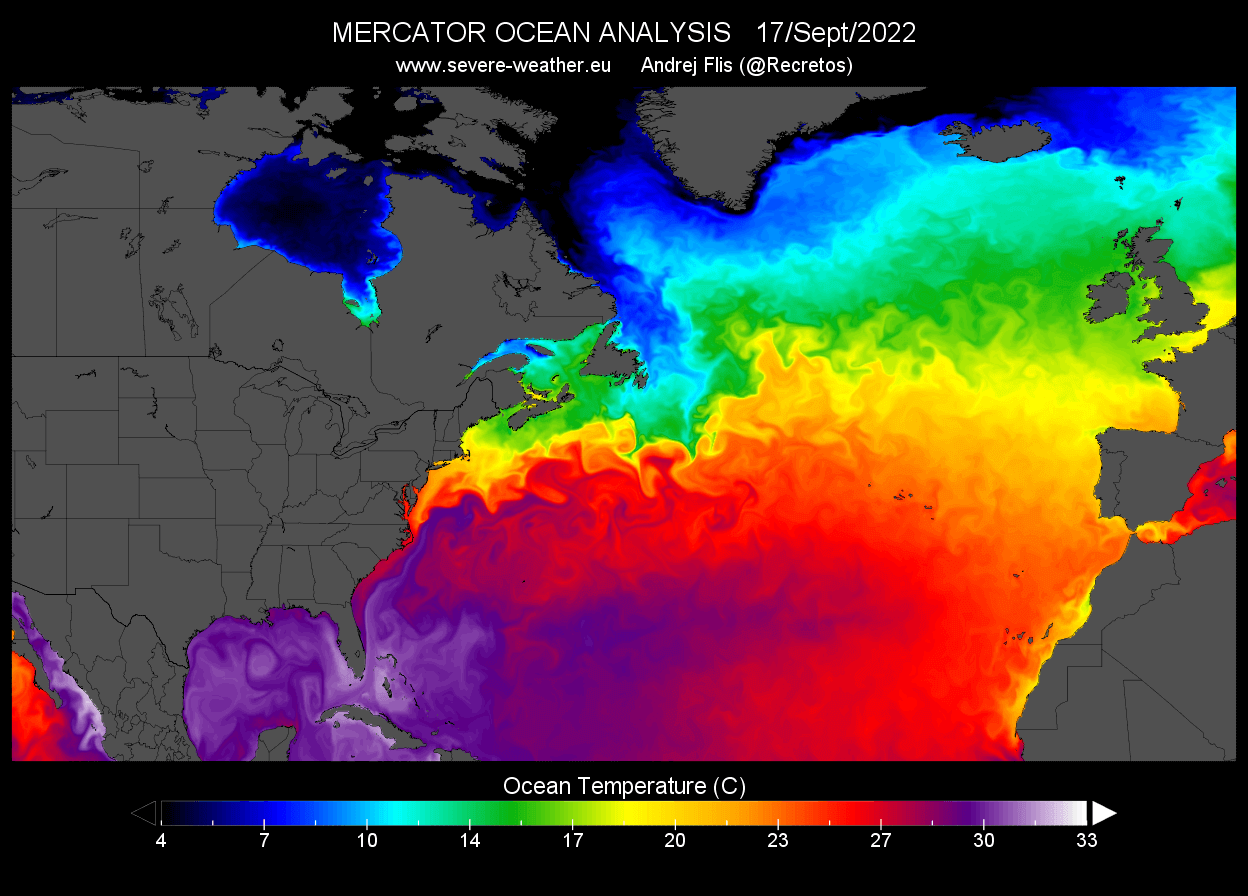
The Gulf Stream is doing what it does best, transporting essential warm waters further up towards the North. In contrast, the cold Labrador Current flows down along the east Canadian coast.
The Gulf Stream is perhaps seen even better if we look at the movement and speed of the ocean surface. In the image below, you can see the latest ocean surface current analysis, where the Gulf Stream stands out and can be seen in its most raw shape and form.

You can see that it does not flow in a straight line, as seen in most graphics. It is very complex, swirling across the North Atlantic. It has a lot of smaller swirls of water, both warm and cold. This is very similar to the atmospheric jet stream.
We produced a high-resolution video animation showing the Gulf Stream in motion. The video shows the Gulf Stream in Winter, as it is best seen when the temperature contrast is the highest.
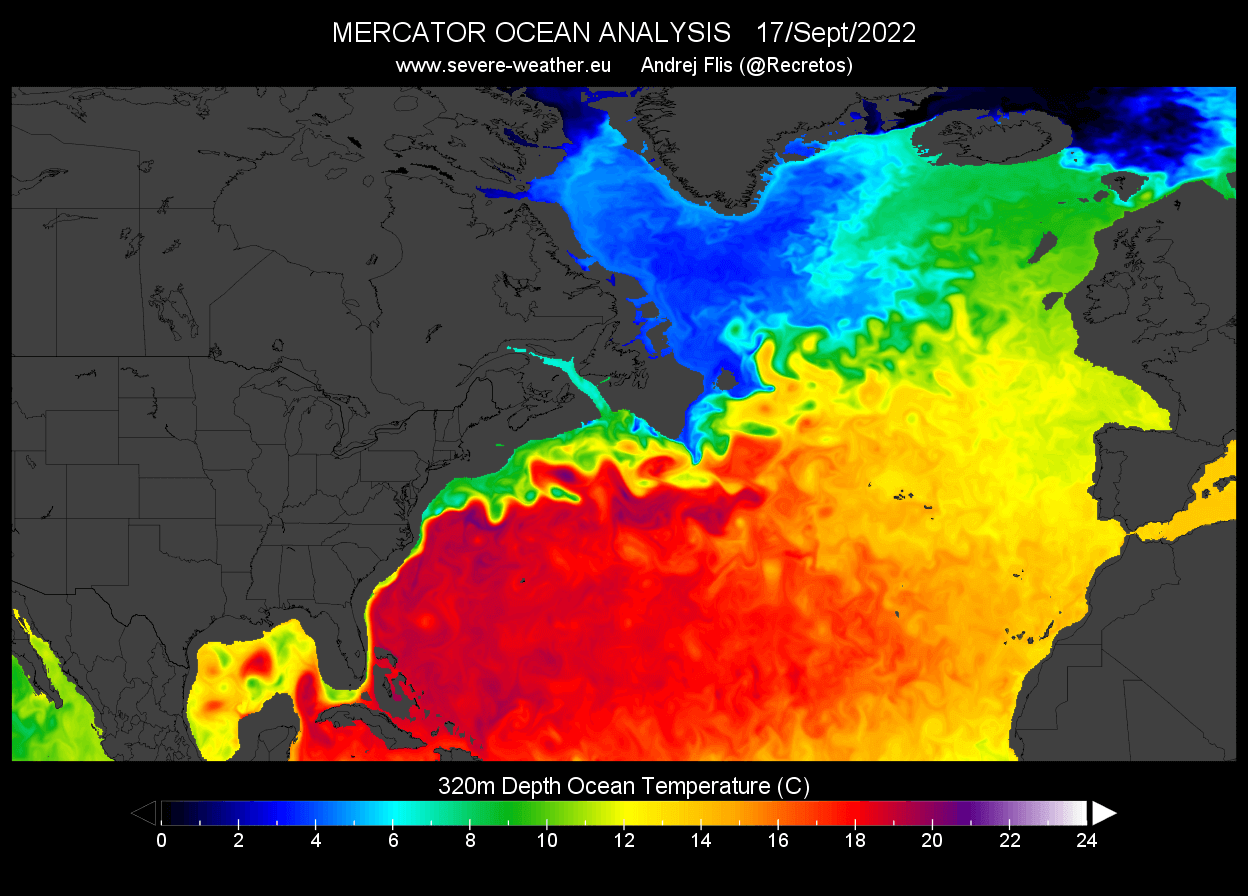
If we look deeper down below the surface, at around 380 meters (1240ft), the Gulf Stream is still nicely seen. But you can also better see the colder waters south of Greenland, where the ocean current sinks down as it gets denser.
The reason why all this is important is that the Atlantic Ocean circulation is an integral part of the weather and climate in the Northern Hemisphere. It transports a lot of warmer waters and energy toward the northern regions. The image below shows the outline of the North Atlantic part of the AMOC.
But how does the Gulf Stream actually impact weather on a larger scale?
GULF STREAM AND WINTER WEATHER
We produced special graphics that show why the Gulf Stream and the AMOC generally are so important. The first image below shows the average January surface temperature for the past four decades. You can see the large temperature difference between the far North Atlantic and Canada.

Looking at the polar circle latitude line, for example, along the tip of Greenland. You can see that there is a temperature difference of almost 30 degrees celsius between the North Atlantic and southern Canada.
There is also over 15 degrees of difference between the North Atlantic and the same latitude in the northern United States.
For example, the difference in winter climate between the United Kingdom and southern Canada is really big. This is in large part because of the warm Gulf Stream. It brings warmer waters towards the North, keeping the climate milder in western Europe.
If you are more familiar with the Fahrenheit temperature scale, we produced the same graphic, but in Fahrenheit degrees. For example, you can see the large difference of 50-60 degrees F between the far North Atlantic and southern Canada.

You can also see the warmer climate along the east coast of the United States. This is also a partial effect of the warm ocean current. But as you will see further down in the article, the Gulf Stream can also have a negative impact on weather in the United States.
But first, focusing on the far North Atlantic part of the AMOC, we can see how complex it really is in the image below. Warmer waters are being transported far beyond the British Isles and Iceland, reaching deep into the Arctic Ocean.
If you look at the actual ocean temperatures from late Winter, you can see positive (ice-melting) temperatures reaching into the Polar Circle. Violet colors are indicating sea ice or very cold waters, near freezing.
This active water transport system is one of the main reasons that the North polar circle is mainly ice-free in this region.
That is nicely seen in the sea-ice concentration analysis below during peak sea-ice conditions in March. Notice how the region connecting to the North Atlantic is ice-free. Image by PolarWx.
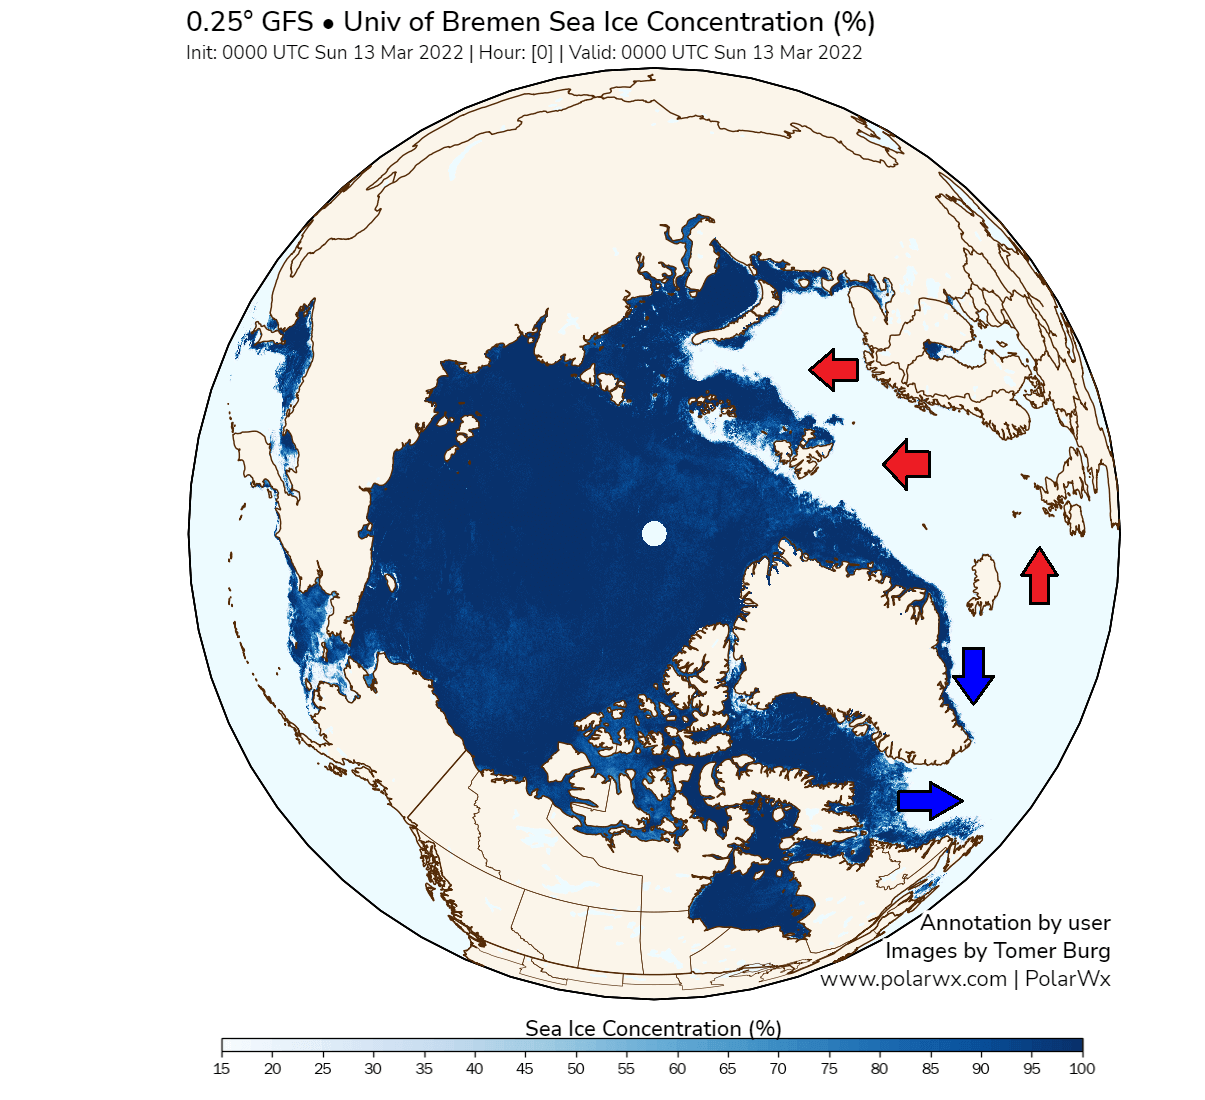
That is because the ocean temperatures are too warm to allow persistent freezing. The active ocean currents constantly deliver relatively warmer waters into this region, preventing thick sea ice from forming.
NORTH ATLANTIC OCEAN ANOMALY
In the past months, there were observed changes in the warm part of the Gulf Stream. Pressure changes in the North Atlantic have enabled substantial ocean surface warming.
Starting in July, a strong high-pressure system was dominant over the northeastern Atlantic ocean. A low-pressure area was present over the northeastern United States.
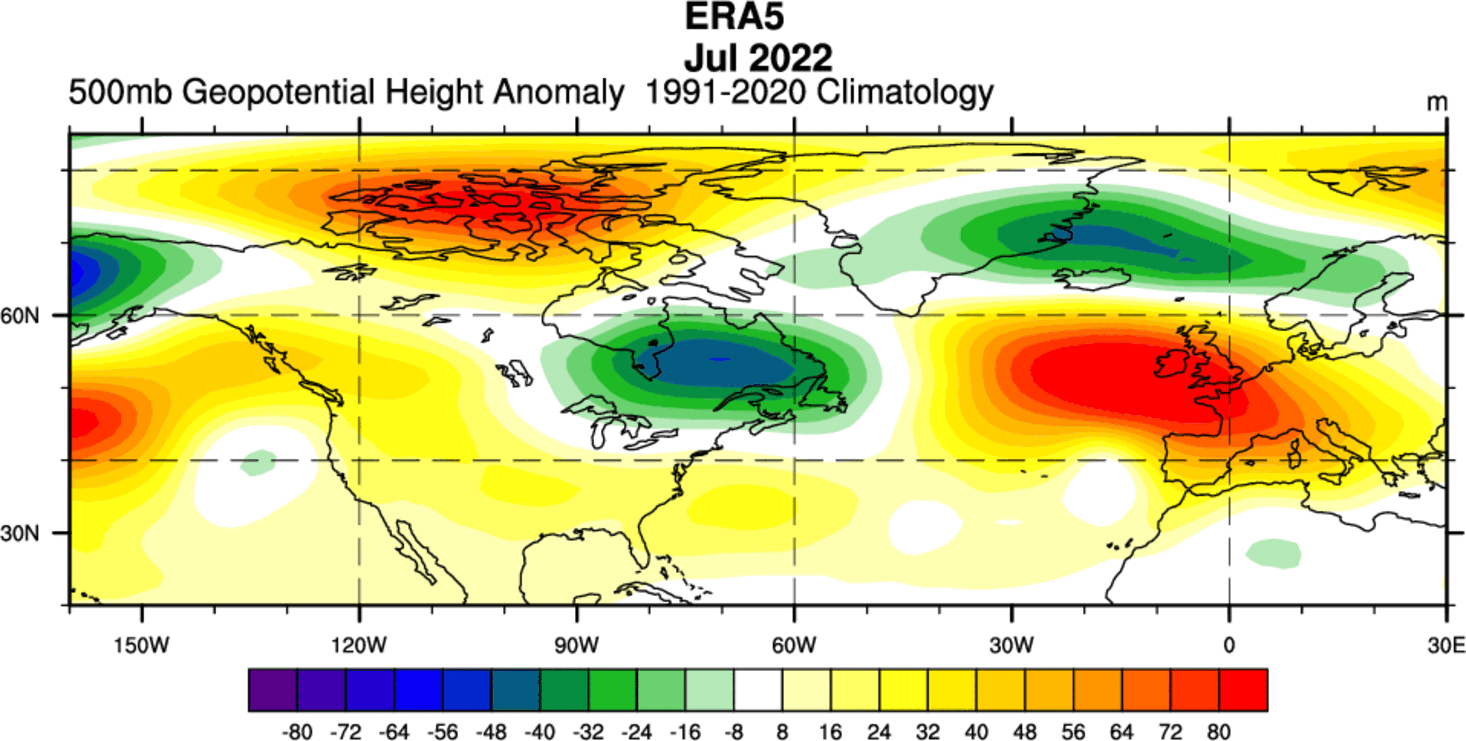
That enabled a southerly flow across the Gulf Stream area. In the image below, you can see the warm Gulf Stream along the east coast of the United States, flowing up to the north and northeast.

The pattern amplified in August, with the high-pressure area expanding over most of the far North Atlantic. This enabled calmer conditions over the gulf stream area, further warming the ocean surface.

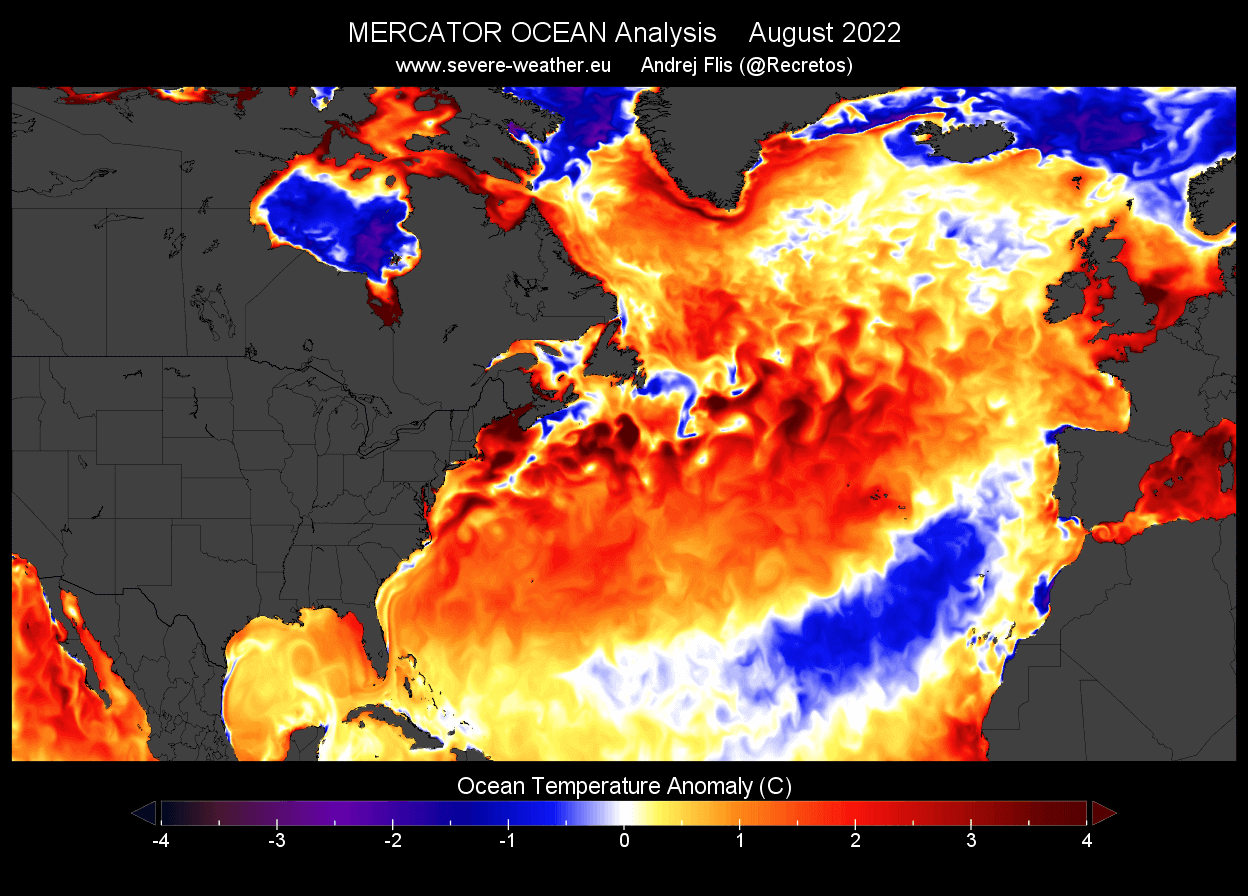
You can see that below on the August monthly average ocean temperature anomaly. Again, a large part of the North Atlantic was warmer than normal, aided by the gulf stream transport of the warmer waters to the north.
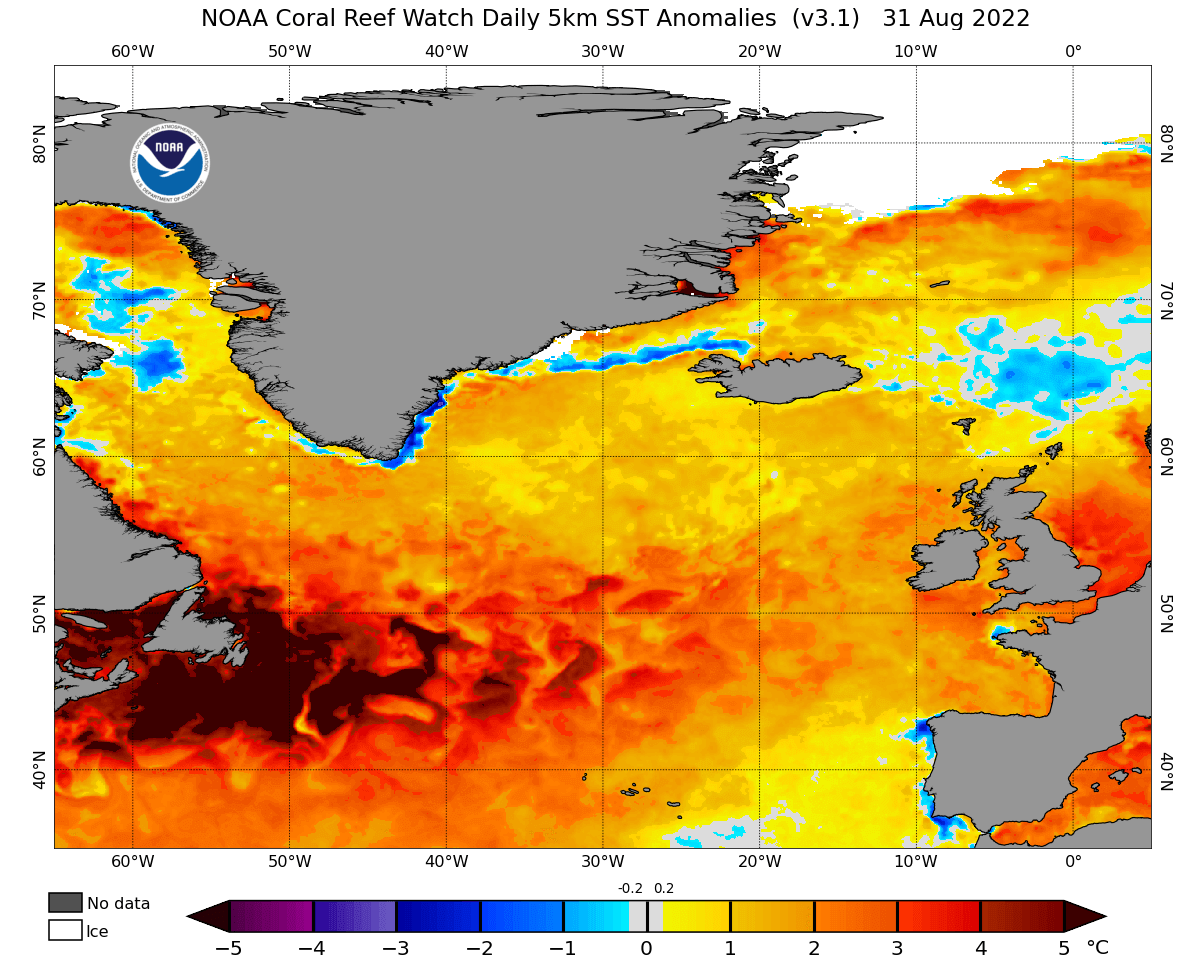
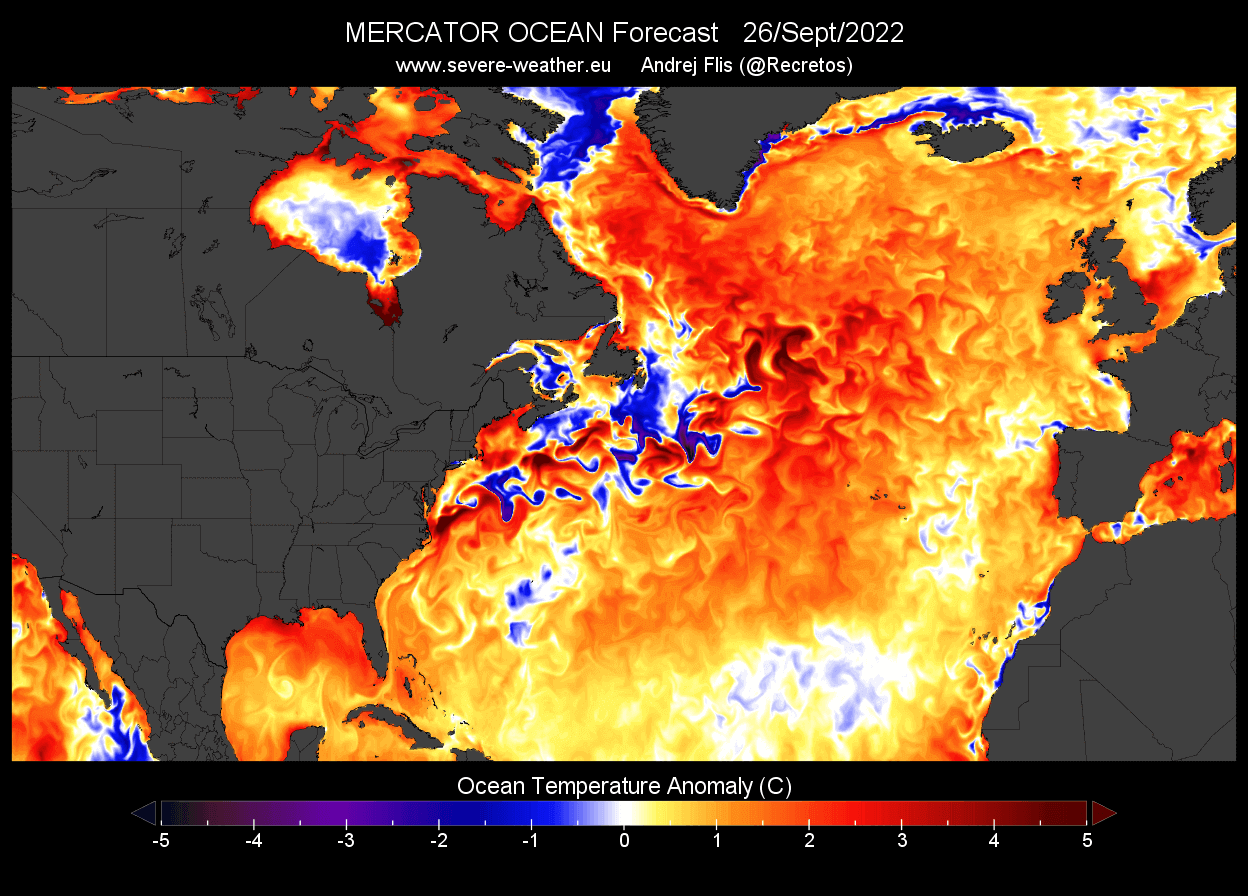
Looking specifically for late August, you can see substantial ocean anomalies in the image below. Locally, temperatures on the ocean surface were 6-8 degrees warmer than normal.
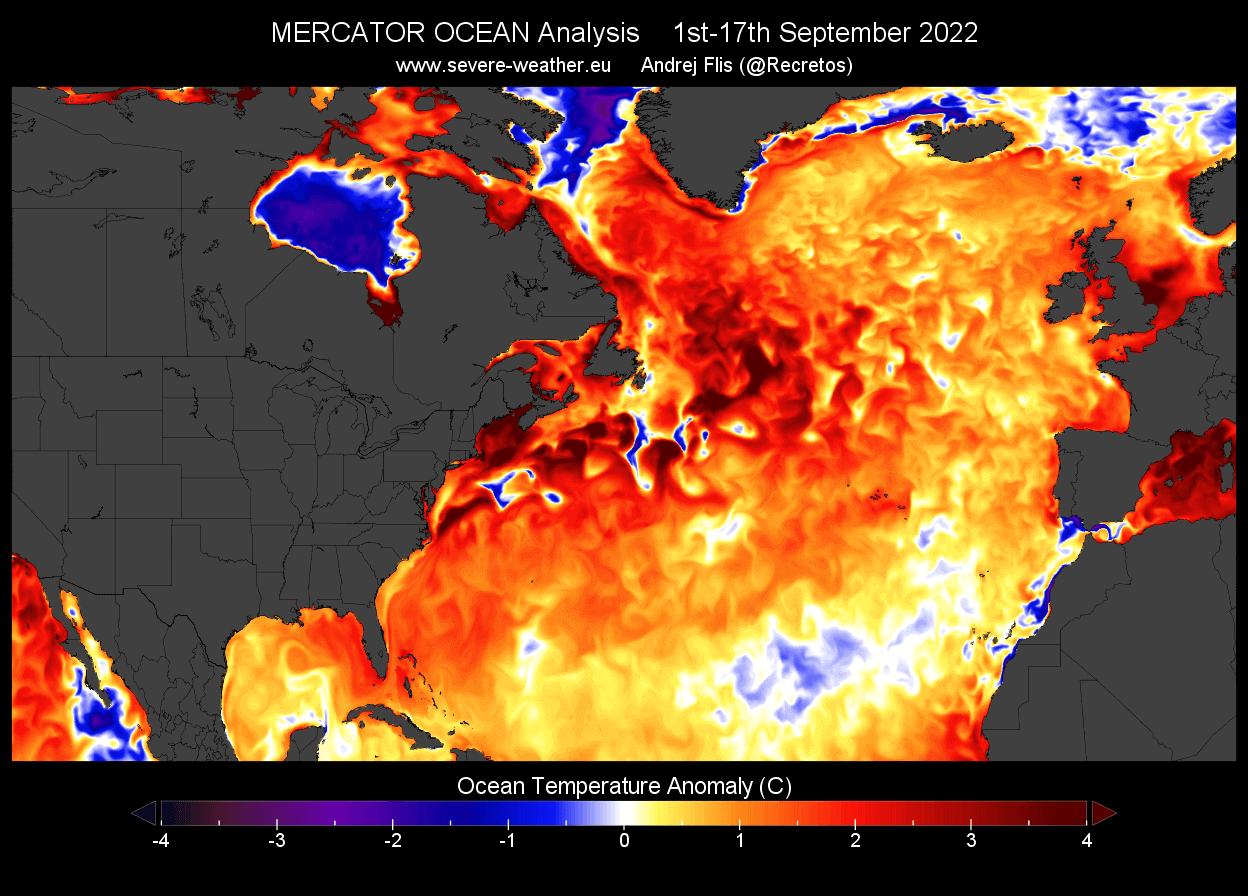
The warming has continued into September. Below we have the ocean analysis for September so far. Warm anomalies have strengthened slightly, closer to the eastern coast of the United States.
But the latest daily data shows a patch of colder anomalies now emerging in the Gulf Stream. That is actually the effect of the tropical system Earl, passing over this area.
In the image below, you can see the track of Earl, taking it directly over the warm waters of the Gulf Stream. The warm ocean has helped to keep it stronger for a longer period.

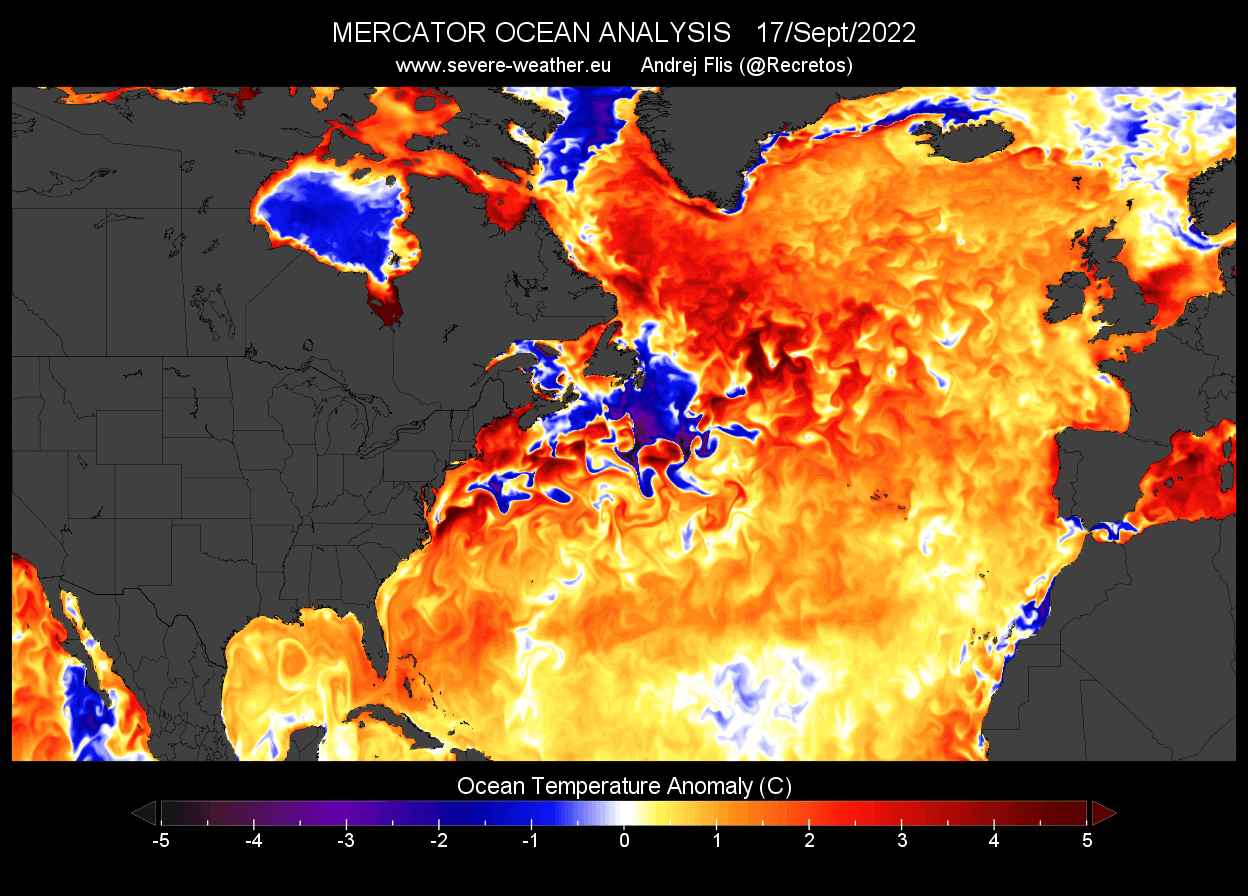
Despite the activity, the ocean anomalies continued to increase in the far North Atlantic, as seen in the image below. Ocean anomalies on this scale do not go away easily and usually need larger-scale pressure changes to really erode the warming.
Looking at the forecast a week ahead, you can see the cold patch diminishing. But more tropical activity in the region can temporarily cool the surface waters due to mixing. The rest of the North Atlantic remains much warmer than normal.
The pressure anomaly forecast from ECMWF does show a persistent high-pressure system in the far North Atlantic. Over the northeastern United States and eastern Canada, we have a low-pressure zone. This should promote warmer temperatures return to the gulf stream area as westerly and southerly winds return.

The ECMWF surface temperature forecast for the same period shows the warm anomalies prevailing over the Gulf Stream area. You can also see much warmer than normal temperatures over the southern United States.

So, can ocean anomalies affect the long-term weather and perhaps even the Winter 2022/2023?
ATLANTIC OCEAN ANOMALY WINTER HINTS
To understand or find potential winter connections, we have to understand how these ocean anomalies form in the first place. There is usually a global circulation behind these changes.
Sometimes, a strong ocean anomaly can indicate the overall global configuration. So rather than being an actual cause of changes to come, it is just a result of large-scale changes that later also bring new weather patterns.
We produced an analysis of the gulf stream warm pool for late summer and autumn. Then we compared the data for the gulf stream area with global ocean temperatures in the past 42 years. The result is the image below.

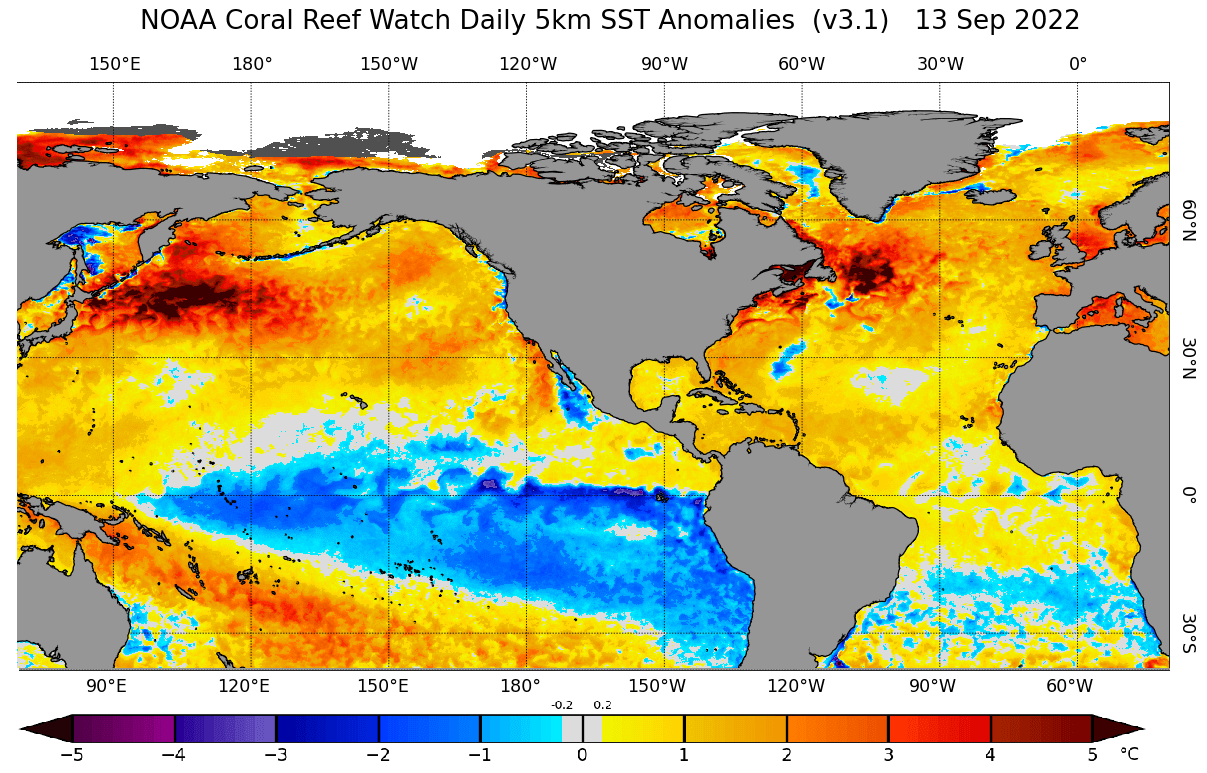
You can see that strong warm pools in the North Atlantic are more common in a La Nina (blue box). Another warm area in such a configuration is in the northwest Pacific Ocean.
Looking at the latest data, we can see a surprisingly similar configuration. A warm pool in the North Atlantic and in the northwestern Pacific Ocean. And, of course, a cold La Nina in the tropical Pacific.
This can tell us that there must be a larger overall global circulation pattern behind this to produce a similar outcome. The effect of the persistent (third year) La Nina is the most likely background signal in this case. So, what signals can we get for the upcoming Winter 2022/2023?
First, we have to look at the ocean temperature forecast to see if the North Atlantic warm pool will be stable, going towards Winter 2022/2023. As you can see on the forecast, the warm anomalies are forecast to persist at least until early Winter.

So if we now look at the connection between the September-November warm pool, we get an interesting picture. We compared the pressure anomalies following the Fall with a warm Gulf Stream area (detrended).
As you can see in the image below, this is a very La Nina-like pattern. We have a high-pressure area in the North Pacific and a strong low-pressure zone over western Canada and the northern United States. The pattern in the Atlantic is unclear.
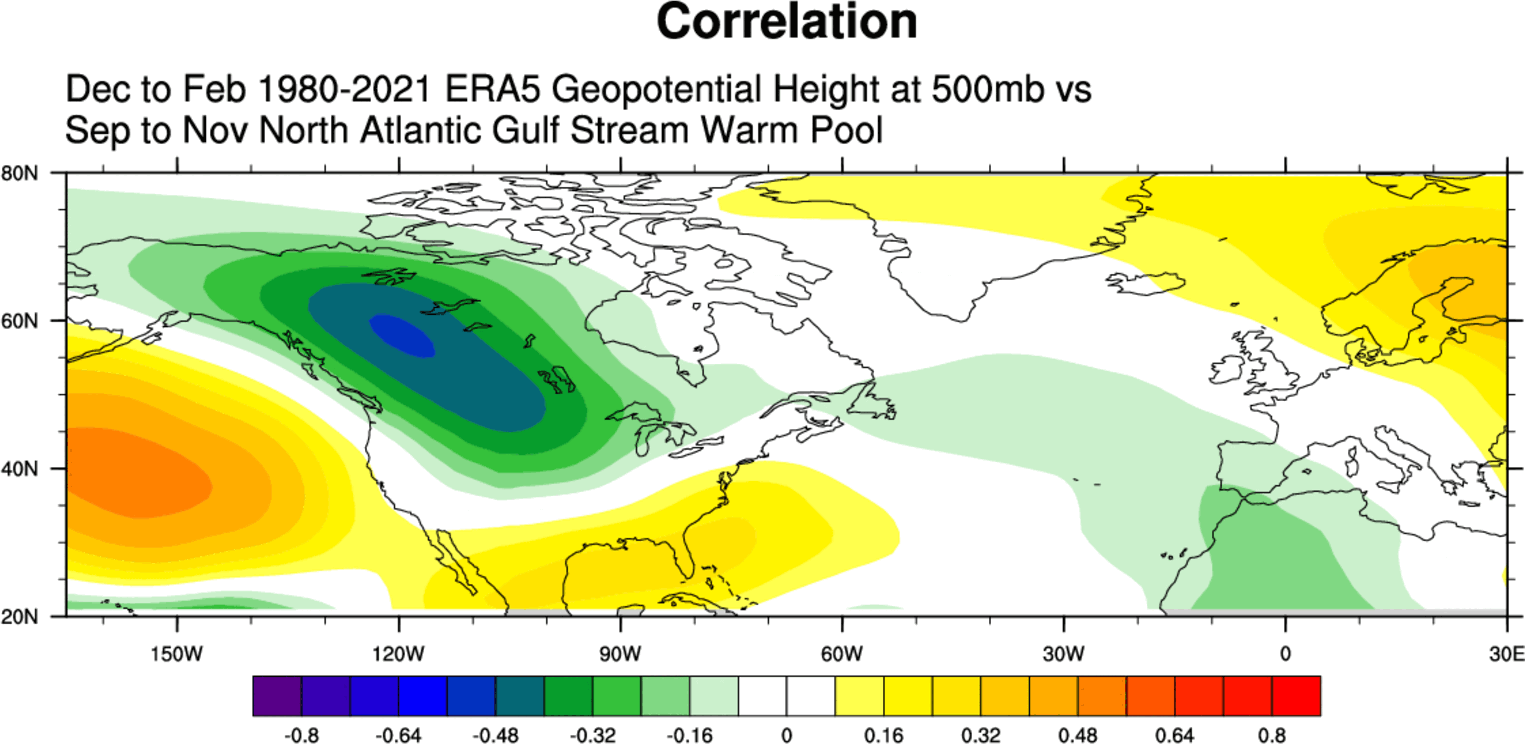
In simple terms, this image shows the winter pressure pattern following a Fall with warm ocean anomalies in the Gulf Stream area. This is tho just a simple data comparison and not an actual result of the warm waters alone.
Looking now at the actual forecast, we get a very similar picture. The forecast below is combined from many different long-range models. It also shows a low-pressure area over Canada and the northern United States and a high-pressure system in the North Pacific from La Nina.

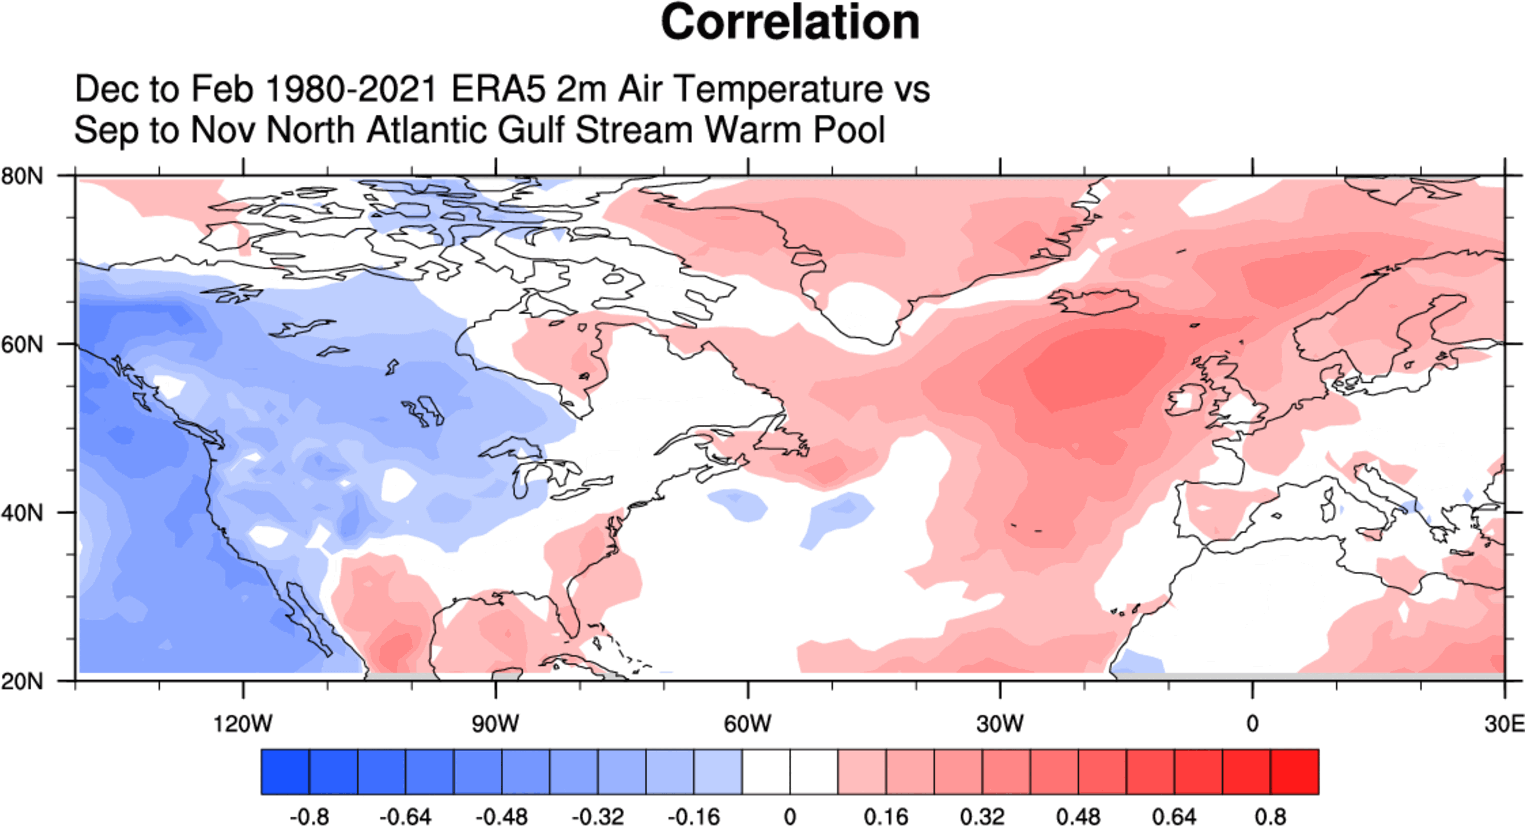
We can use the same comparison/correlation data for the Winter and Fall ocean anomalies to produce a temperature signal. It shows colder than usual Winter over much of Canada and the western and northern United States. Europe is also seen mostly warmer than normal.
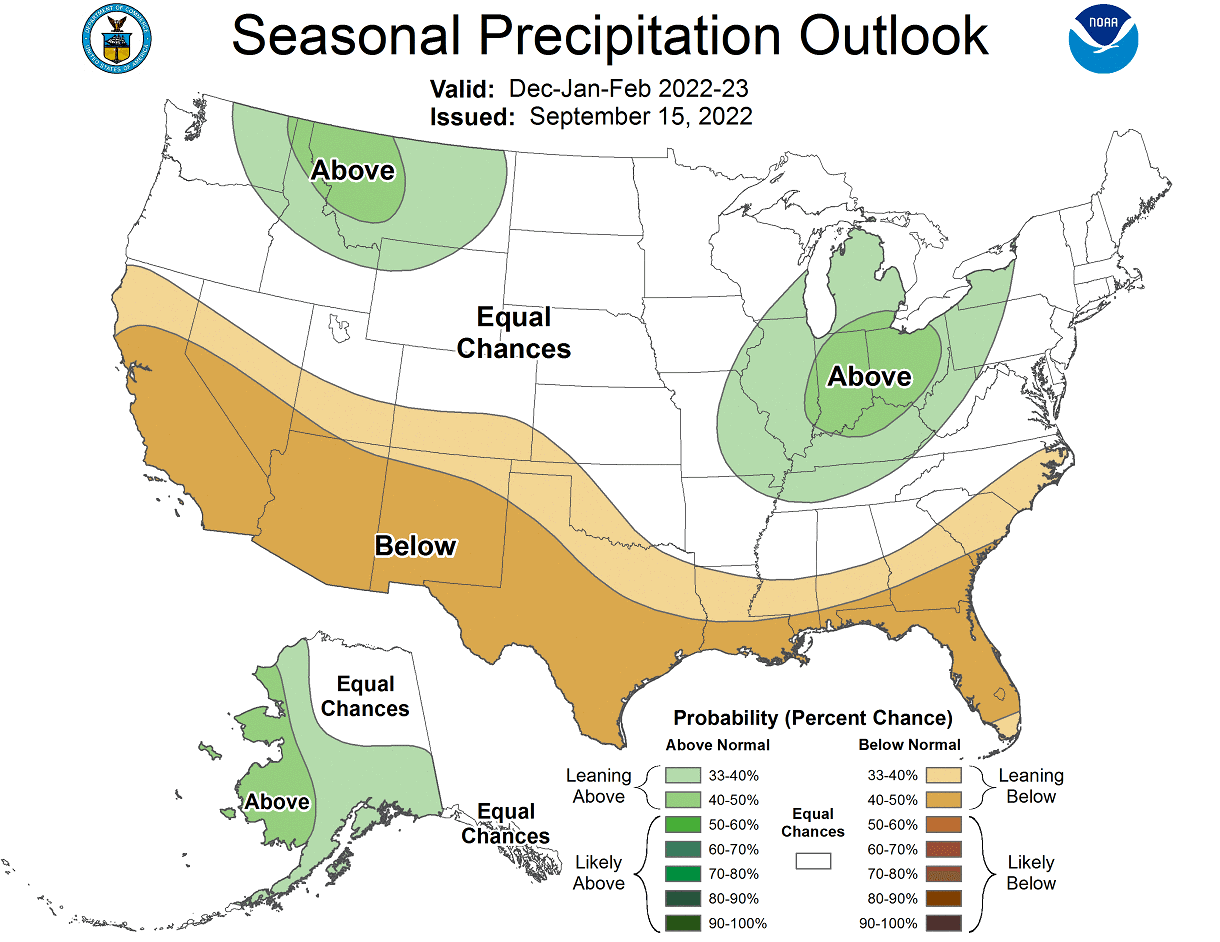
The latest official NOAA outlook for Winter 2022/2023 shows a similar pattern. The Northwestern United States and Midwest are forecast to have a colder than normal Winter. This is in line with the colder signal seen over the northern/western United States in the previous graphic. Warmer than normal Winter is currently forecast for the southwestern United States and the east coast, also like in the signal graphic above.

Going to precipitation, we see Winters following strong Atlantic Gulf Stream warm pools to be mostly dry across central Europe and the southern United States. More precipitation is seen over the Pacific Northwest, the Great Lakes, and the Ohio River valley.

The latest official NOAA precipitation outlook for Winter 2022/2023 shows almost the exact same pattern for the United States. We see more precipitation over the northwestern United States, the Great Lake, and the Ohio River valley. However, most of the southern United States is forecast to be drier than normal.
Now how do we interpret this? Well, there is a strong similarity between the historical data and the latest Winter forecast. This, however, does not mean that the warm ocean anomalies are the sole reason for this, just because the data gives a similar outcome.
It is much more likely that a stronger larger-scale factor is behind the warm ocean anomalies and the forecast winter pattern. In this case, we can see this as the result of a persistent La Nina.
So the strong warm anomalies in the North Atlantic shouldn’t be seen as the main factor or influence for the upcoming Winter. But rather as an indicator of the overall global atmospheric and oceanic circulation, most likely influenced by the dominant cold La Nina.
But there is a specific way in which the warm Gulf Stream anomalies influence the weather in the United States much more directly. And usually not in a good way.
UNITED STATES WEATHER FROM THE GULF STREAM
The water in the far North Atlantic is not sinking as fast anymore, as it is getting fresher. That is slowing down the ocean transport system. Because the ocean current is slowing down, the warmer water from the Gulf Stream has nowhere to go and stalls, like in a traffic jam.
This means less warm water is actively transported to the North Atlantic. Instead, it is now piling up just off the east coast of the United States. You can see that in the image below, showing the sea surface height change as the Gulf Stream slows down.

This situation provides a very potent energy source for powering Nor’easter storms and tropical systems. As the warmer water piles up, sea surface height is also increased, which means a higher potential for severe storm surges.
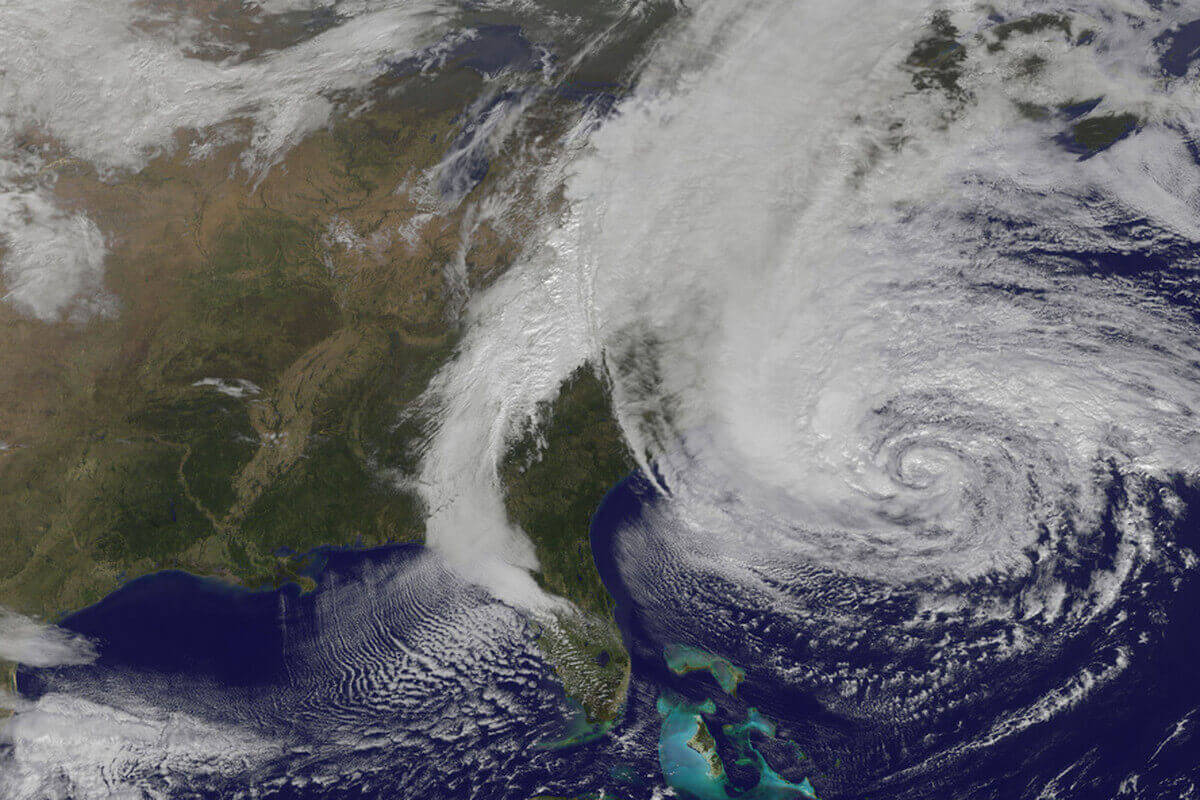
A good example of this process was the infamous Hurricane Sandy in 2012. Below is an NOAA-GOES satellite image of Hurricane Sandy as it was sitting over the warm Gulf Stream, using it to power up before landfall in the United States.
In the image below, you can see the sea surface temperature anomaly before the arrival of Hurricane Sandy. Much of the tropical Atlantic and Gulf Stream area was warmer than normal. The warmer the ocean, the more energy it can provide for storm systems along the east coast of the United States.

The sea surface temperature anomaly in the image below is after the passing of Hurricane Sandy. We can see a huge ocean temperature drop behind Sandy, from the western Caribbean all the way up the east coast of the United States.

Sandy has used the warmth of the ocean and the Gulf Stream, converting it into energy to power up. It dropped ocean temperatures, now being 4 to 6 degrees cooler. Cooling is, of course, also due to the ocean layers mixing as a storm passes.
Deeper, cooler waters rise to the surface as the seas get very rough under a low-pressure system, overturning and mixing with the warmer surface waters.
Warmer than normal Gulf Stream area can amplify the storms approaching the eastern United States or the east coast. Especially problematic is the increased sea surface height, which also enables higher tides and potentially stronger storm surges.
We will keep you updated on various global anomalies and weather pattern development, so make sure to bookmark our page. Also, if you have seen this article in the Google App (Discover) feed, click the like button (♥) there to see more of our forecasts and our latest articles on weather and nature in general.
SEE ALSO: