Arctic sea ice has reached the largest extent in the past few years this March. Sea ice melt season is now well underway with a rapid pace, tho still not as strong as in some recent years. But unusually strong melt projections are showing a possible record low extent in September.
The Arctic sea ice extent was running largest in the past few years during winter and into early spring. But pressure changes in the Arctic have now created a faster melt phase, with ominous signs for late summer when Arctic ice is at its weakest.
ARCTIC SEA ICE 2021
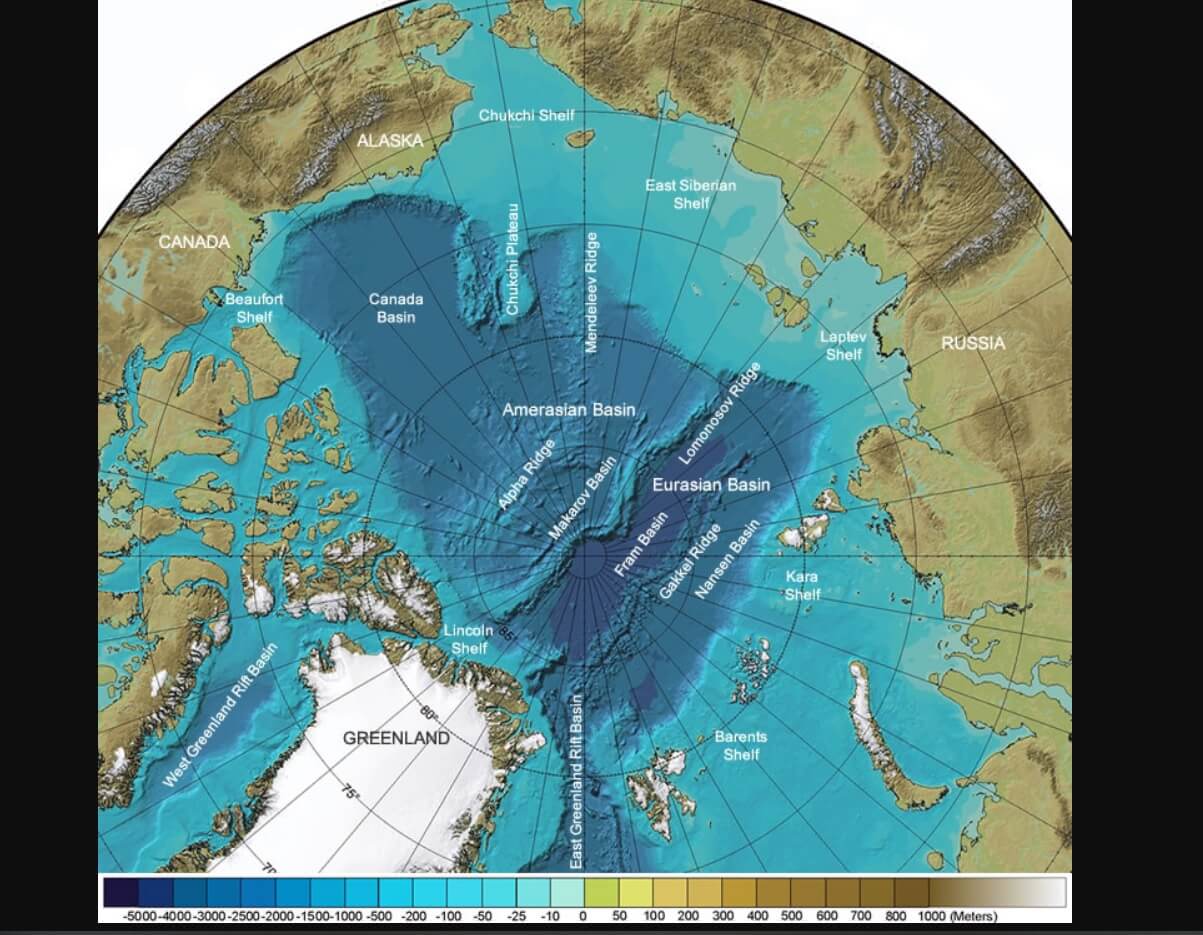
The Arctic region is actually just one large ocean and has no true large-scale landmass. It is the smallest and shallowest of the world’s five major oceans, and it is also the coldest. This is also the only ocean, which is smaller than the largest country in the world by area (Russia).
The image below shows the Arctic ocean, as it would look without water, revealing a very complex underwater terrain. You can see the main regions of the Arctic ocean, each with its own set of unique weather and oceanic properties. The graphic is from one of the more recent Arctic ocean studies.
The Arctic sea ice has its own seasonal cycle. It can be seen in the image below from the Arctic-ROOS system. It shows the sea ice extent change over a one-year period. The melt season usually starts in late March, lasting well into September where a minimum is reached.
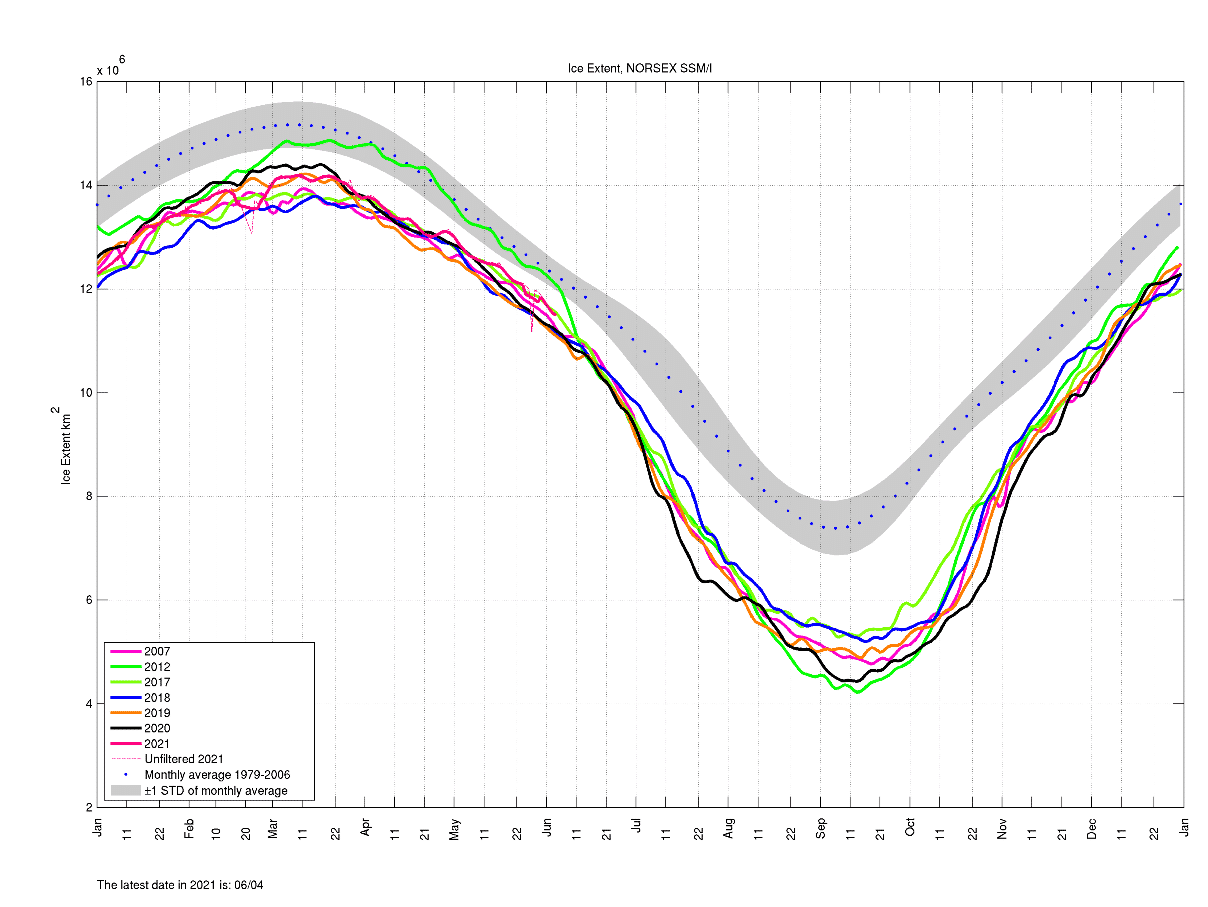
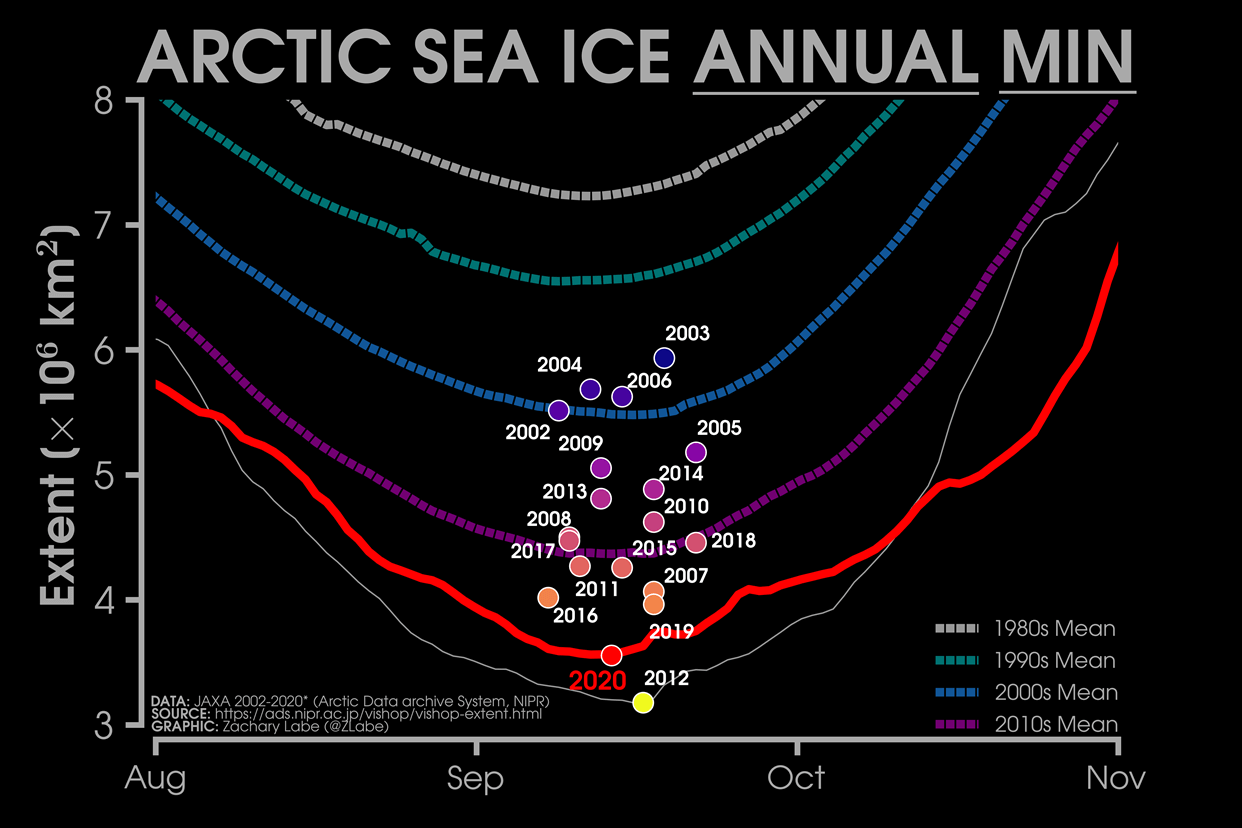
The graph above shows the last few years of data, where we can see the 2020 Arctic ice extent was second-lowest, only behind 2012, which still holds the record for the lowest ice extent since satellite measurements began.
We produced a high-resolution video, which shows the 2021 sea ice maximum that was reached in March, and the melting since then. Take notice of the constant strong movement of the icecap, influenced by the ocean currents and also weather/wind dynamics.
Below you can see the sea ice maximum over the last 17 years, and where 2021 ended up. It was actually higher than some of the recent years, and around the average for the 2010-2019 period. Note that this is from the JAXA dataset, which can be slightly different than the NSIDC data in the previous graphic. This graphic is by Zachary Labe.

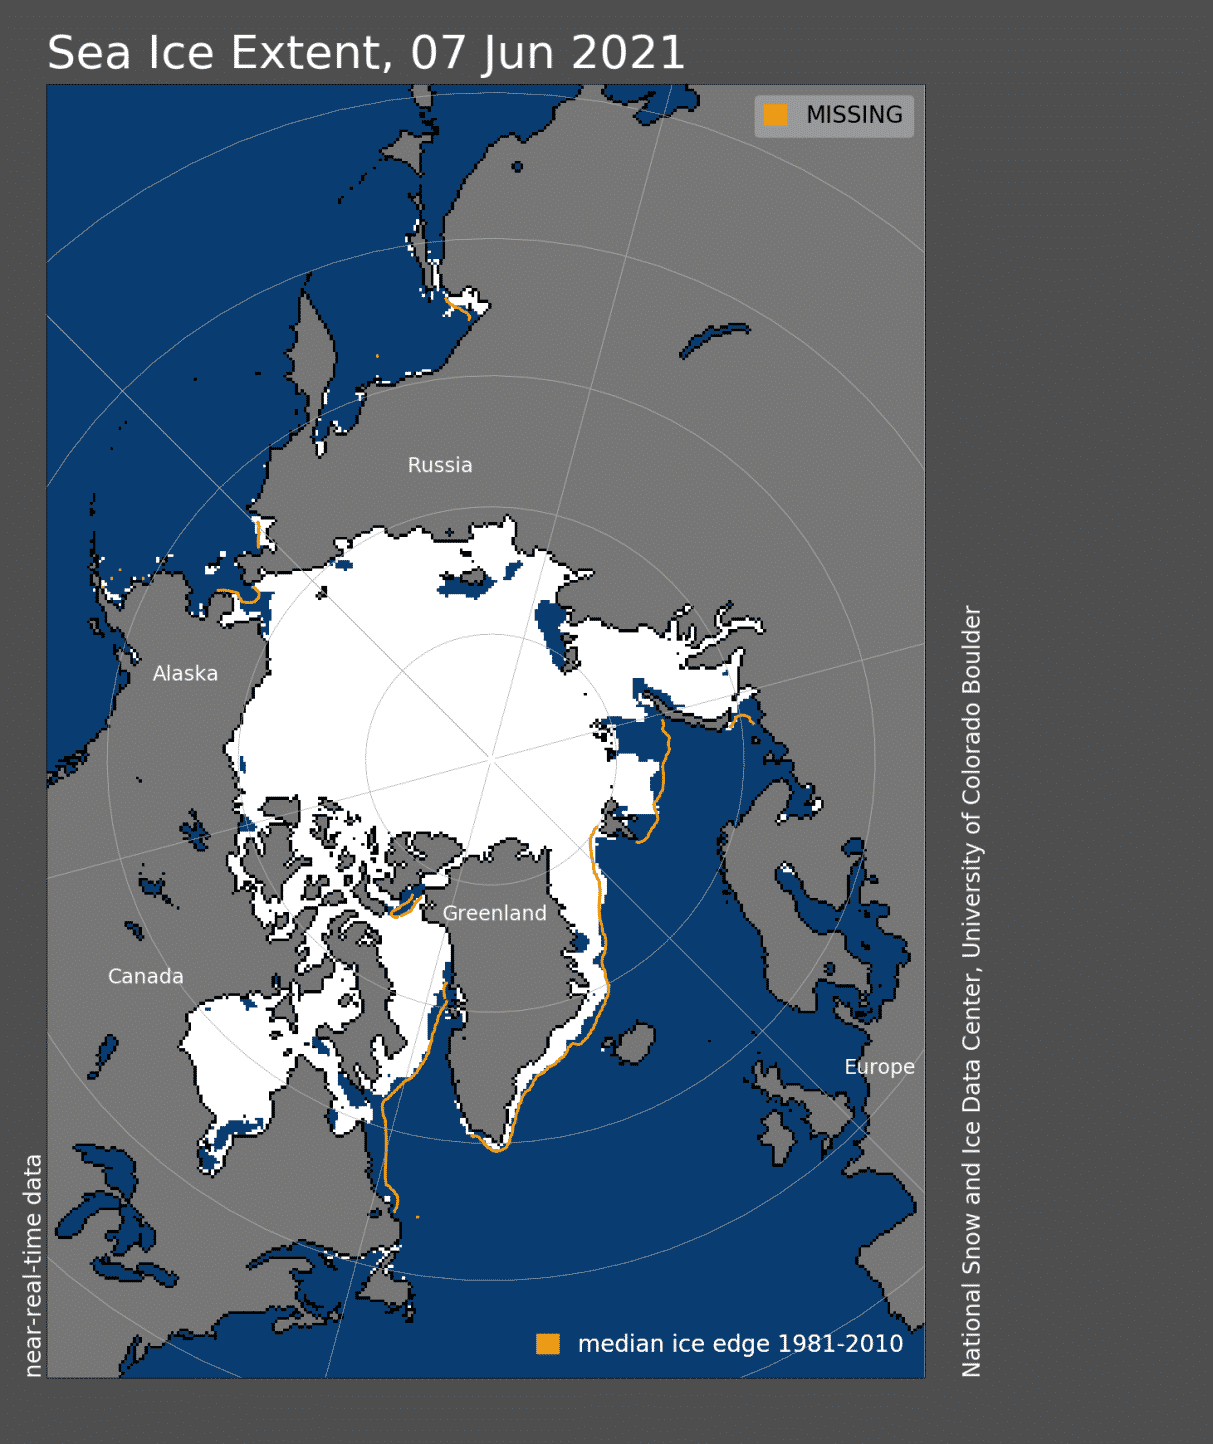
Looking at current conditions from NSIDC, we can see the extent of the sea ice, compared to the long-term average (orange lines). The largest deficits can be found in the Laptev Sea, in the Kara Sea, Barents Sea, and the Labrador Sea.
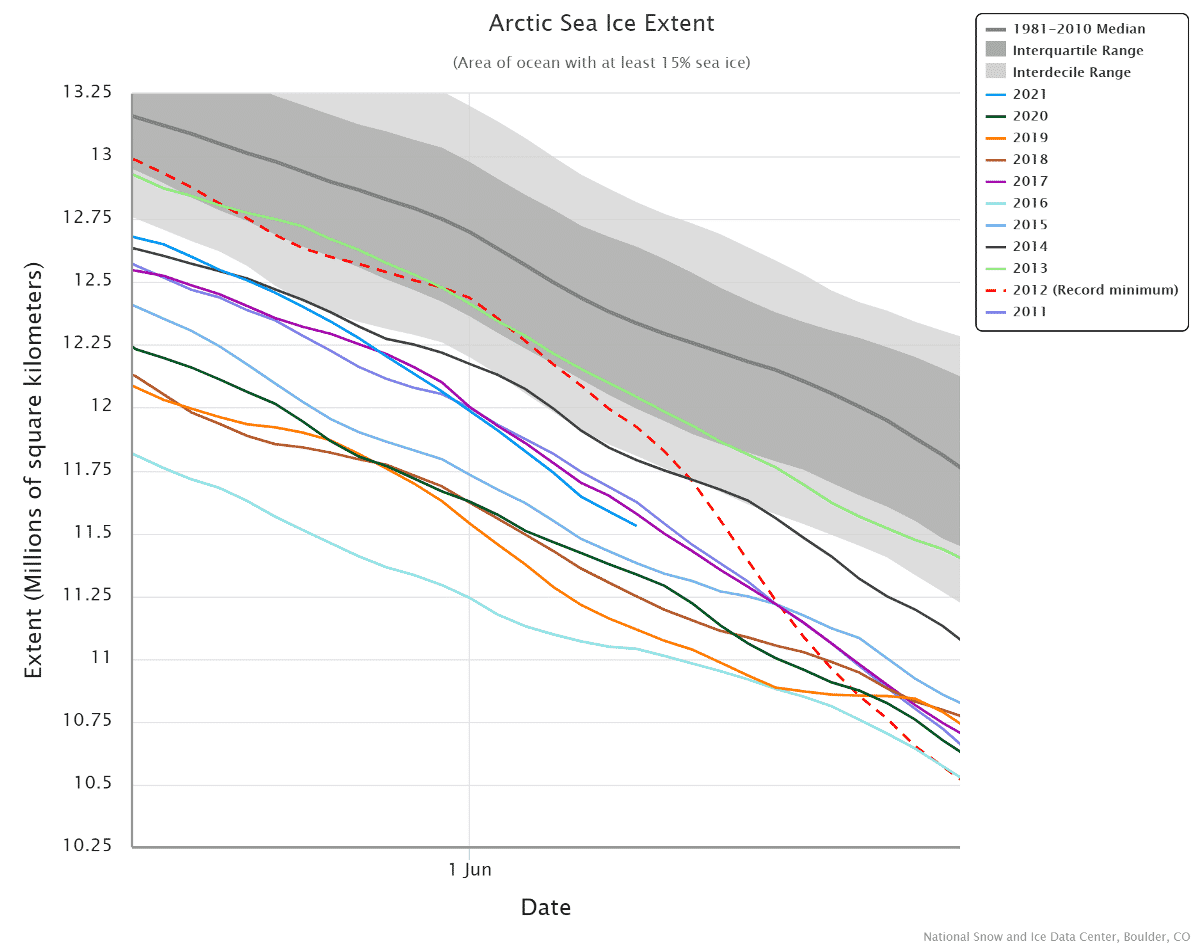
The line graph below shows the latest Arctic sea ice extent, which is running below the long-term average. The dashed line is the 2012 melt season, which in September ended up with the record lowest sea ice extent.
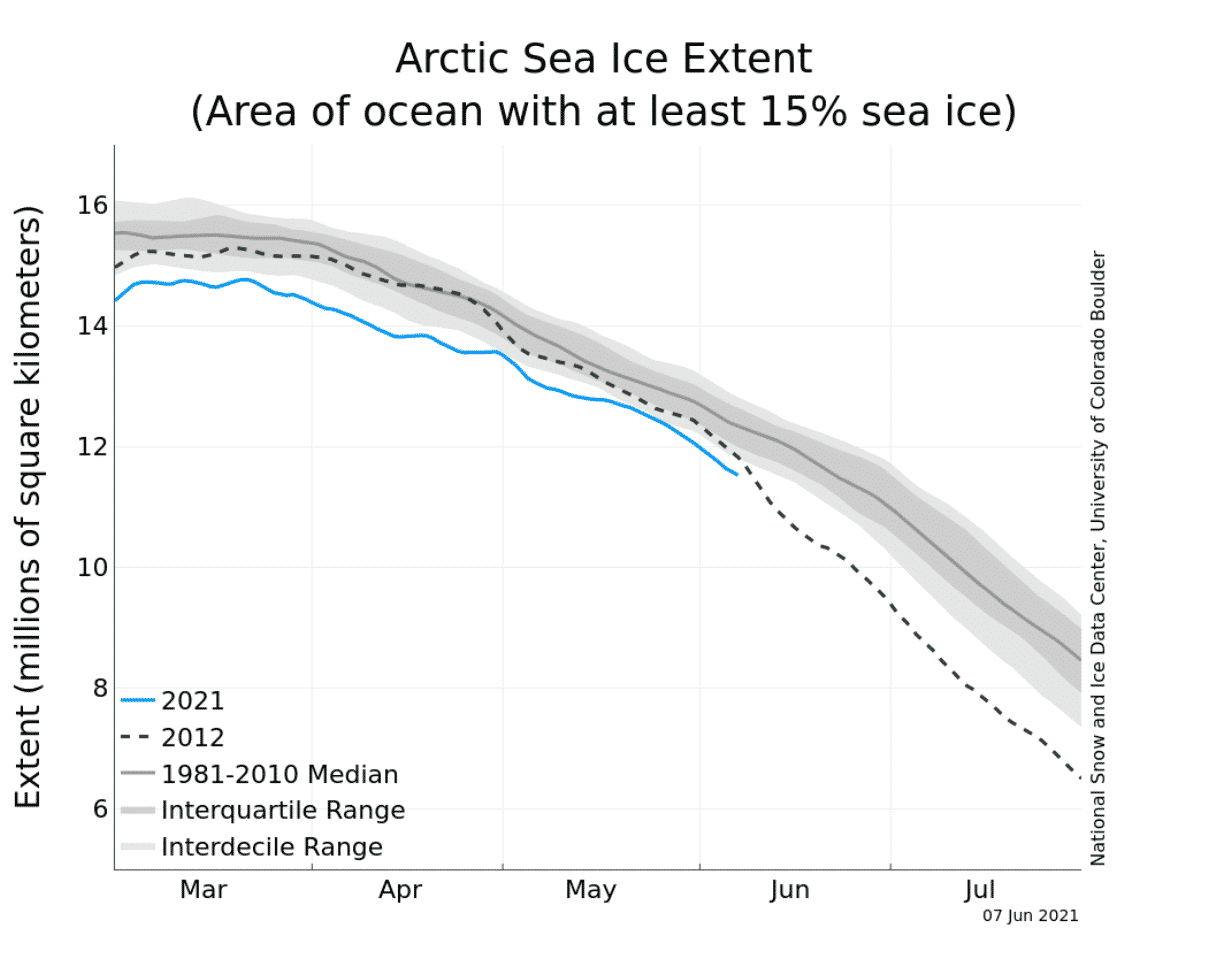
The current sea ice extent is slightly over 11.4 million square kilometers in area. It is not the lowest for this time of the year, but it is still running over 1 million square kilometers below the average.
Currently, 2021 is ranked as the 6th lowest extent in modern times. You can see on the graph below, the lowest 5 years in red and 2021 in yellow. These are rankings for early June, so a lot can change over the summer. 2012 was ranked quite high at this point but reached the record lowest sea ice area in September.

Looking at the Arctic basin sea ice, where the main seas are included, the melt is progressing at a decent pace, but not too rapid. You can see on the graph how the older years (violet) started the melt much later and melted way less than recent (white-blue) years.

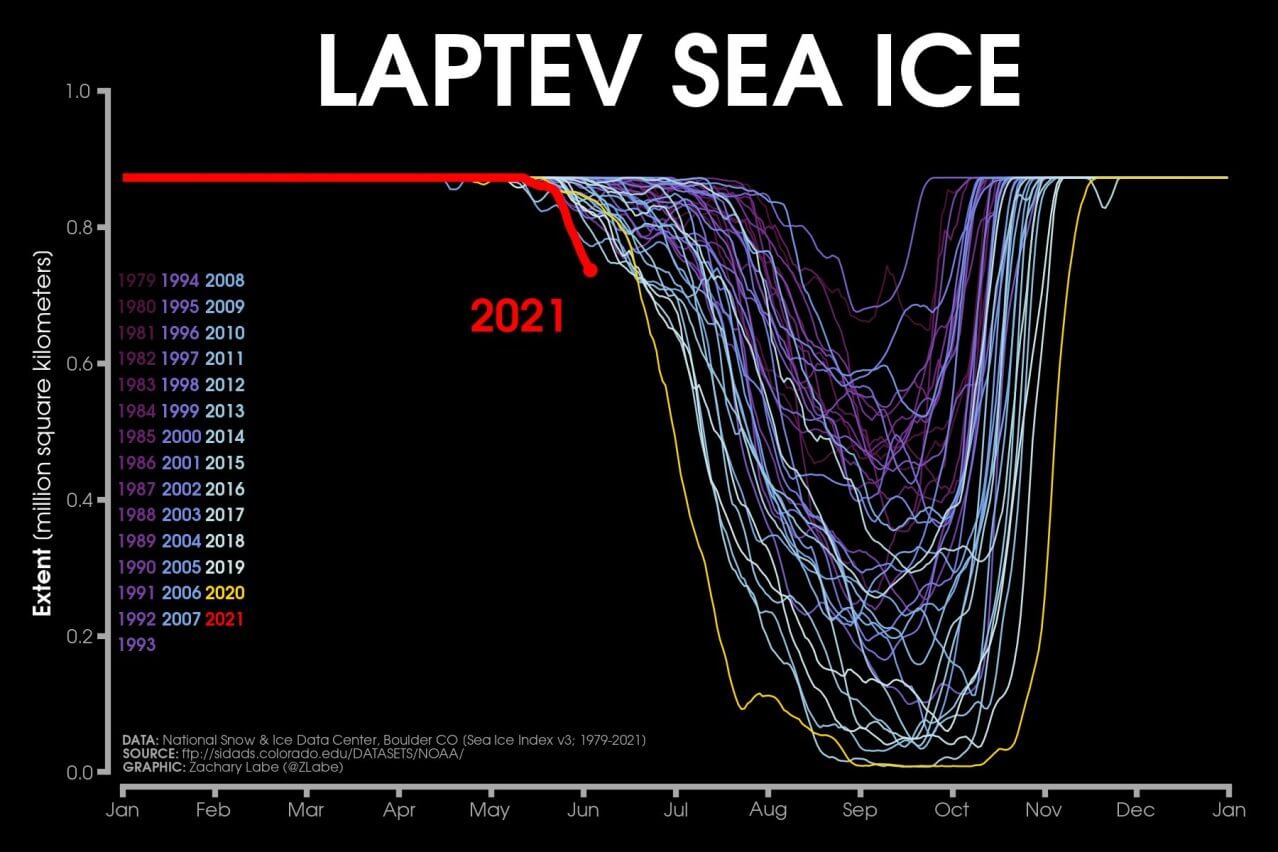
The one exception is of course the Laptev Sea, which is melting at a record pace this season. Last year (yellow line) it melted entirely for only the second time in known records. This year the Laptev sea ice melt began early and is currently at the lowest extent for this time of year.
Overall, you can see the daily sea ice extent change on the graph below. This is useful to see if on average the Arctic icecap is melting or also gaining some ice area. Strong overall melt is ongoing since April, with a few days in between where the ice extent has still increased, due to weather conditions and ice movement, rather than actual new ice being formed.

We will now look at some actual sea ice conditions and forecasts for the coming days.
SEA ICE CONDITIONS AND FORECAST
Arctic sea ice is much more than just extent and area. Below you can see our graphic, which shows the sea ice concentration. It tells us what is the fraction of the sea ice in the ocean. We mostly have 90-100% concentration, but it nicely shows just how diverse and dynamic the polar icecap really is across its vast size.

In the past 7 days, there were quite major differences across the icecap. The image below shows the 7-day sea ice concentration change. The Siberian side has seen the largest reduction in concentrations, as well as other edges of the icecap.

Another important parameter of the Arctic sea ice is of course its thickness. It reveals where the icecap is thicker, and where it is thinner and thus much more prone to melting.

Obviously, the thinner ice can be found on the outer edges, which are always the first to melt. One important thing to take away from this image is how thin the icecap really is, compared to its large size.
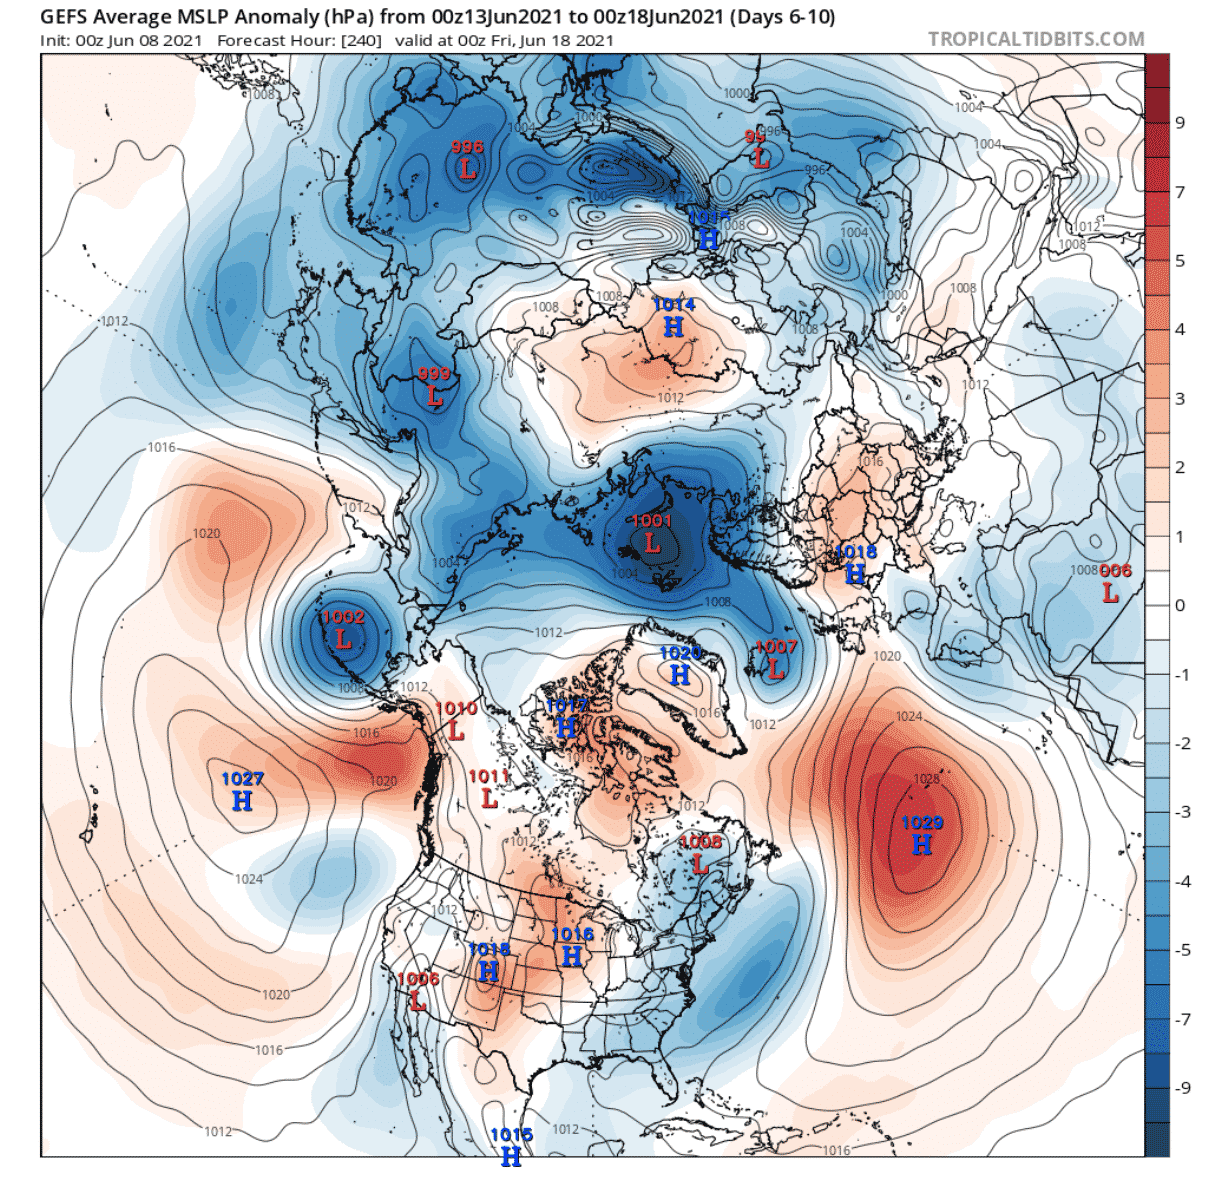
So, looking ahead, we have the pressure anomaly forecast below, for next week. You can see lower pressure over the Siberian side of the Arctic Ocean. This will be the dominant feature, which will change the wind patterns, and will play a major role in the first half of June.
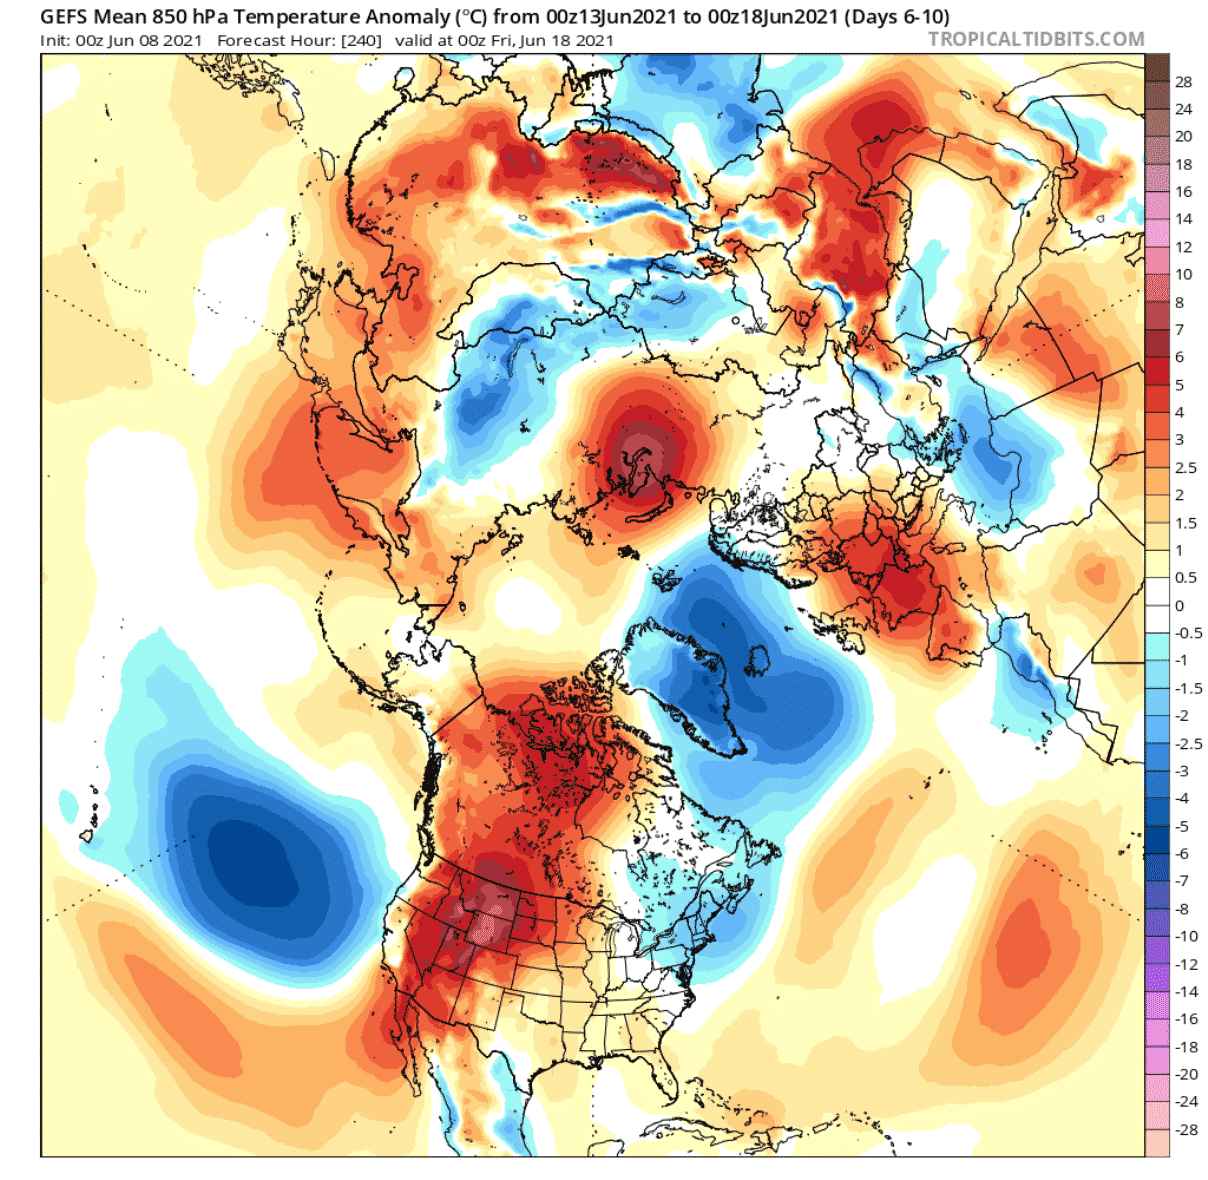
Looking at the temperature anomaly forecast below for the same period, we can see much warmer than normal temperatures over central Siberia and along the eastern edge of the Arctic Ocean. These are the areas that will see a continued rapid reduction in sea ice concentration.
A cold area will develop over Greenland and the Barents Sea. This is because of the low-pressure area that is transporting cold air out of the Arctic region.
Not only air temperatures, but ocean temperatures are also warmer than normal, especially in the Labrador Sea and around Greenland, and in the Beaufort Sea and the Barents Sea. Warmer ocean temperatures can contribute to faster and earlier sea ice melt.

The Arctic sea ice concentration change forecast does show the reduction in concentrations around most of the icecap. Overall, not every reduction in concentration over the central regions is melt, as the icecap is constantly moving, changing its concentrations. We can see the blue area of increased concentrations northeast of Greenland due to wind changes.

Looking at the Arctic sea ice thickness forecast below, you can see most of the icecap is reducing in thickness. You can see the “stripes” across the icecap, which are due to the movement of the sea ice, where it can compact together or move away, increasing/decreasing thickness and concentrations across the icecap.

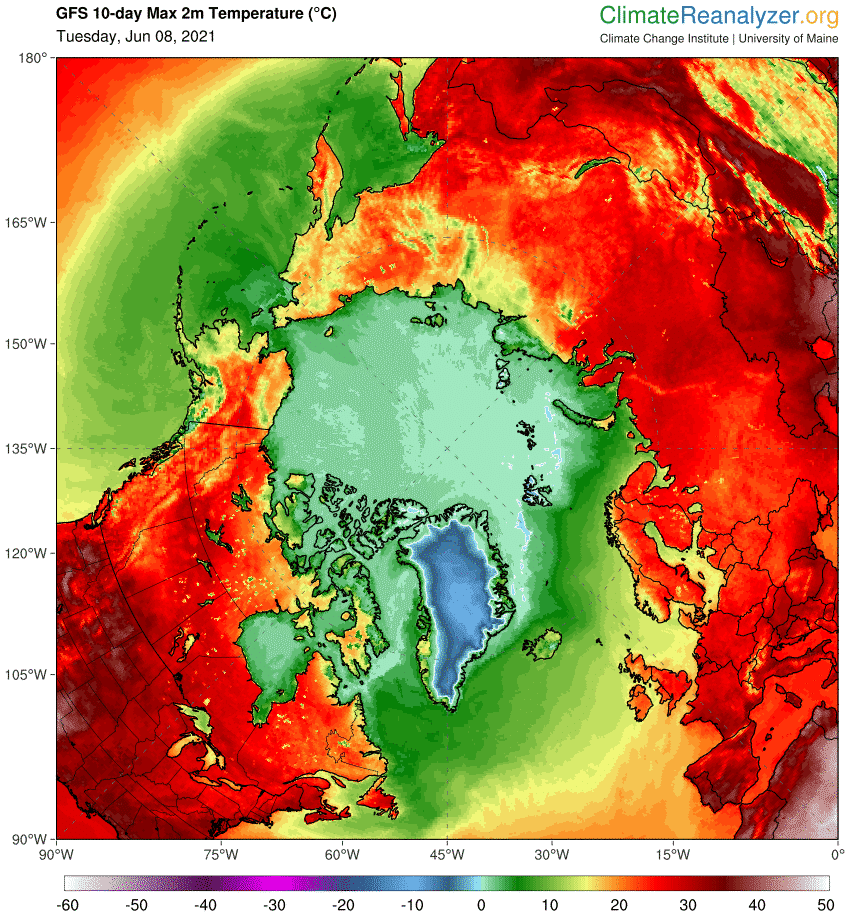
Below we have a rather interesting image, which shows the maximum temperature forecast for the next 10 days. You can see that most of the Arctic region, with the exception of Greenland, will see positive maximum daily temperatures. The Sun is now up all day over most of the Polar Circle, which usually kickstarts the fastest sea ice melt period in late June.
Looking further ahead into late June, we can see the forecast showing lower pressure over the Arctic basin. High-pressure areas are dominant in the North Atlantic and Northeastern Pacific.
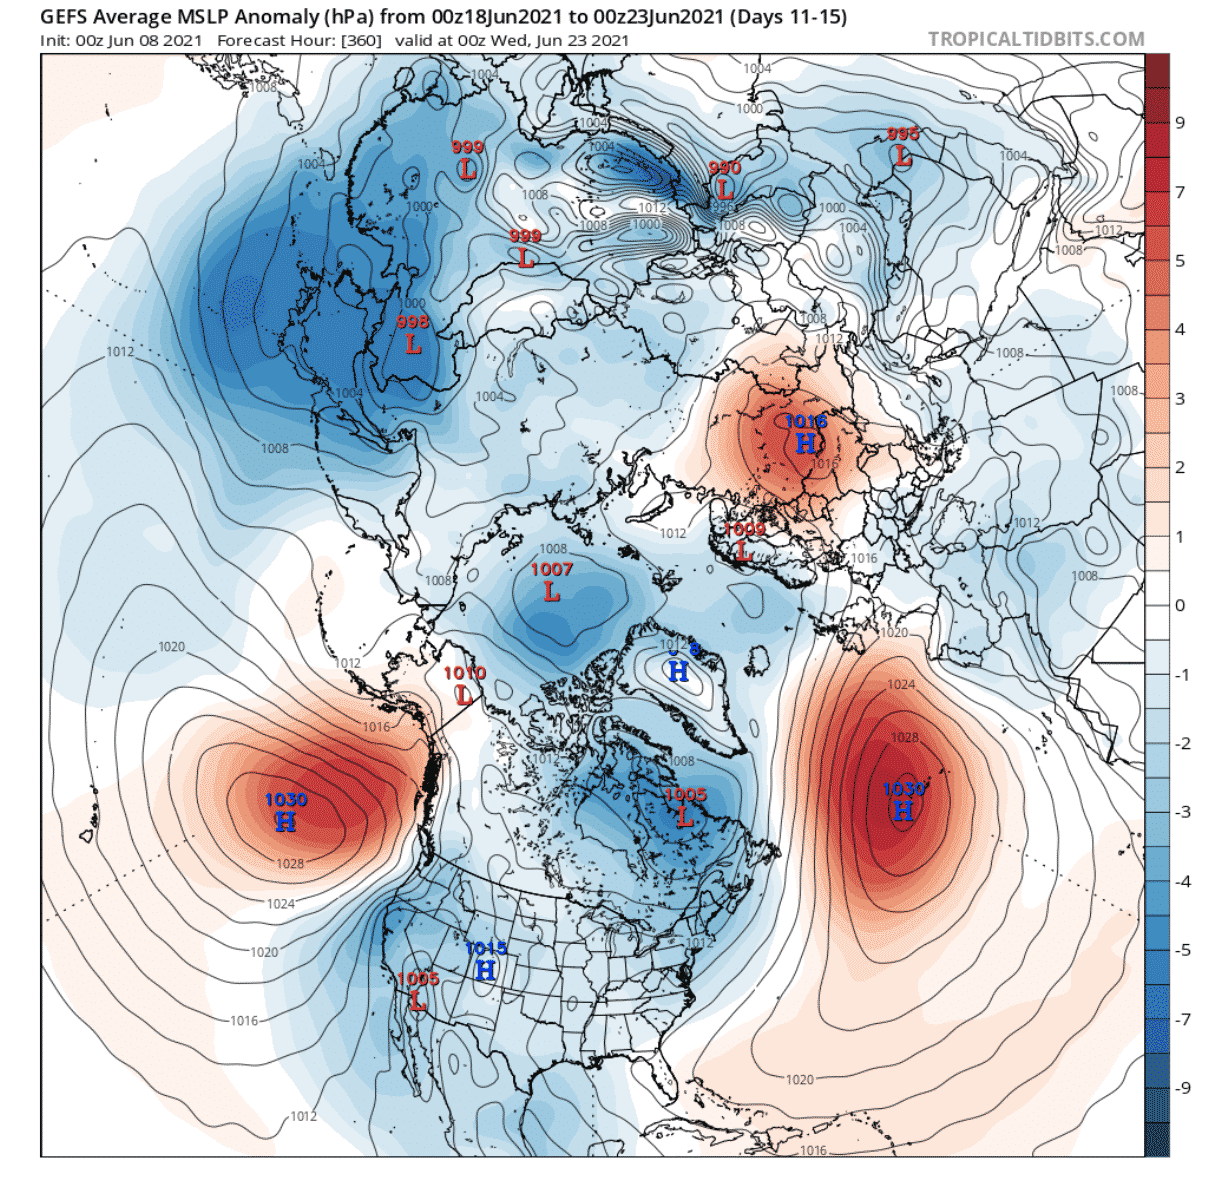
This will enable the warmer than normal air to surround the western Arctic regions and the colder than normal air to move out of the Arctic into the North Atlantic and western Europe.

WINTER AND SPRING ARCTIC WEATHER
The current Arctic Sea Ice conditions, despite running lower than average, are still better than in recent years. That is even more impressive when we look at the global temperature anomalies during the winter/spring season 2020/2021.
You can see on the image below, that the Arctic regions were much warmer than average. Only the Antarctic region was actually colder than normal in this period. Of course, 6 degrees above the normal is still deep freeze in the arctic (-10 instead of -16 degrees, for example).
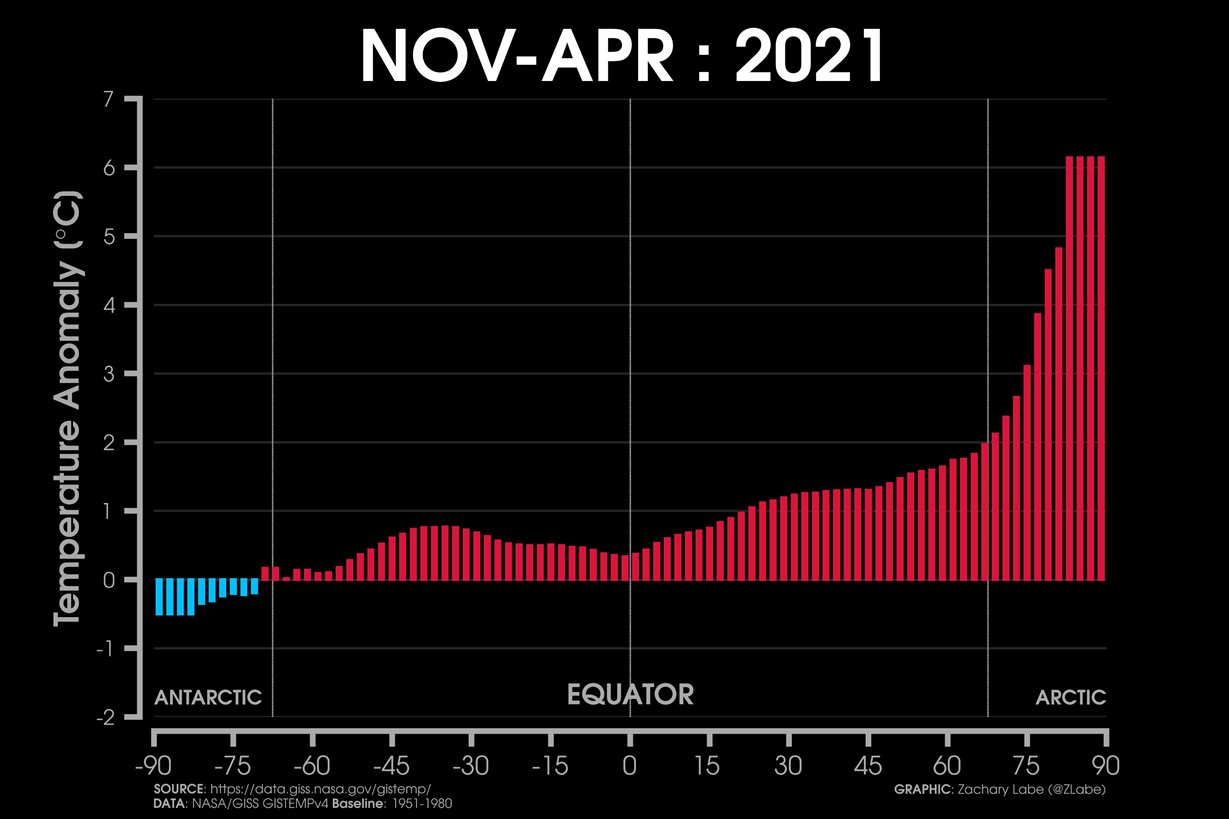
But the most sensitive areas are those further south, where normal temperatures around 0 are now +4 or +6, above the melting point, especially in Spring, when sea ice melting starts. This way the sea ice melt season can start earlier and/or stronger.
April 2021 temperature anomalies were quite astonishing, with much warmer than normal across much of the Arctic Ocean. Warmer than normal temperatures also extended into Scandinavia and western Siberia.

But despite these strong anomalies, we can see that the April monthly sea ice extent was not the lowest, but was actually higher than the last 5 years.

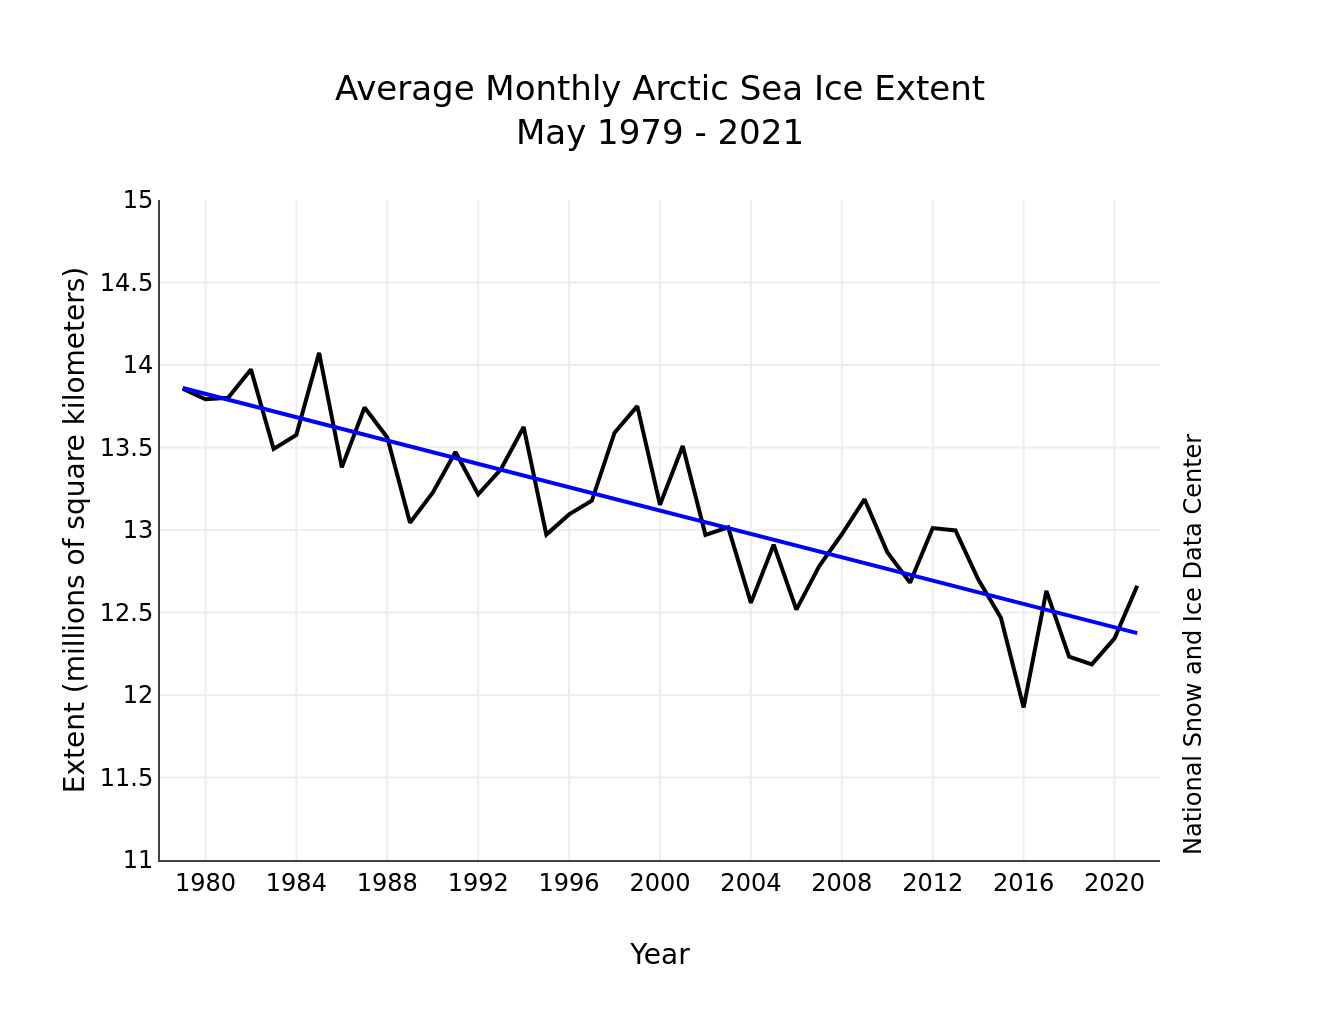
May 2021 has featured a similar pattern, with more positive temperature anomalies also in eastern Siberia.
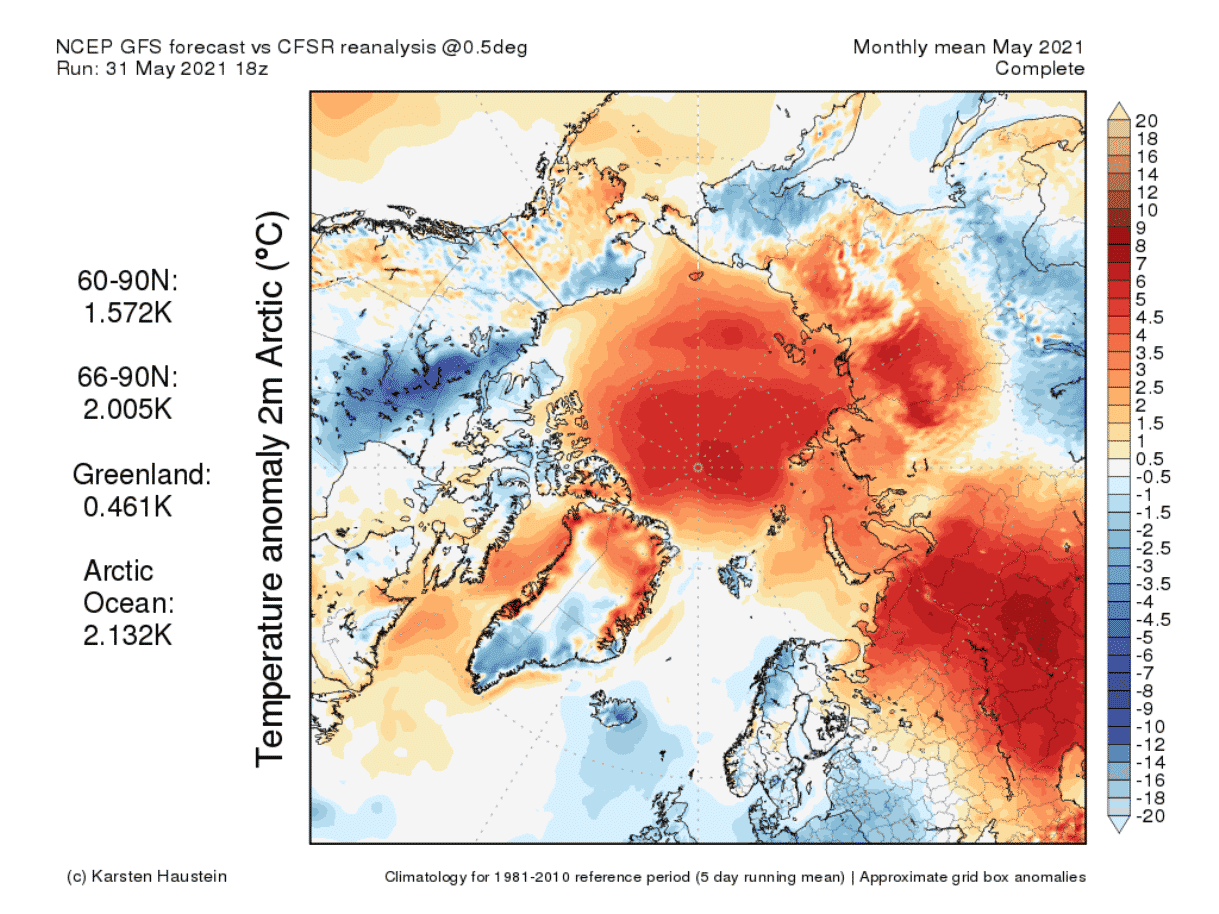
The monthly sea ice extent for May was also running higher than some recent years, and also larger than some older years of 2004 and 2006.
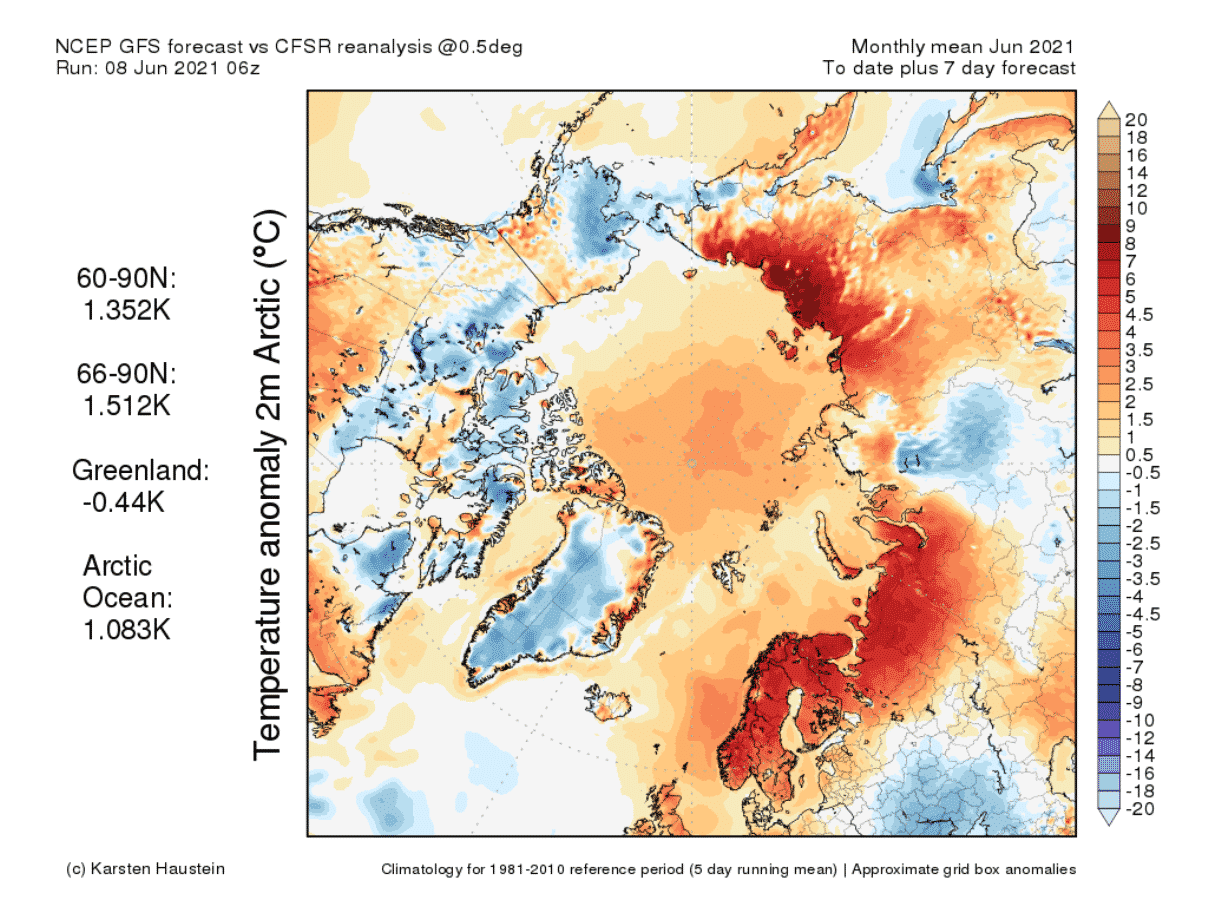
June 2021 so far, and including the forecast, shows strong warm anomalies from Scandinavia all along the polar circle into eastern Siberia. The Arctic Ocean is for now showing weaker anomalies than in the past two months that we have seen above.
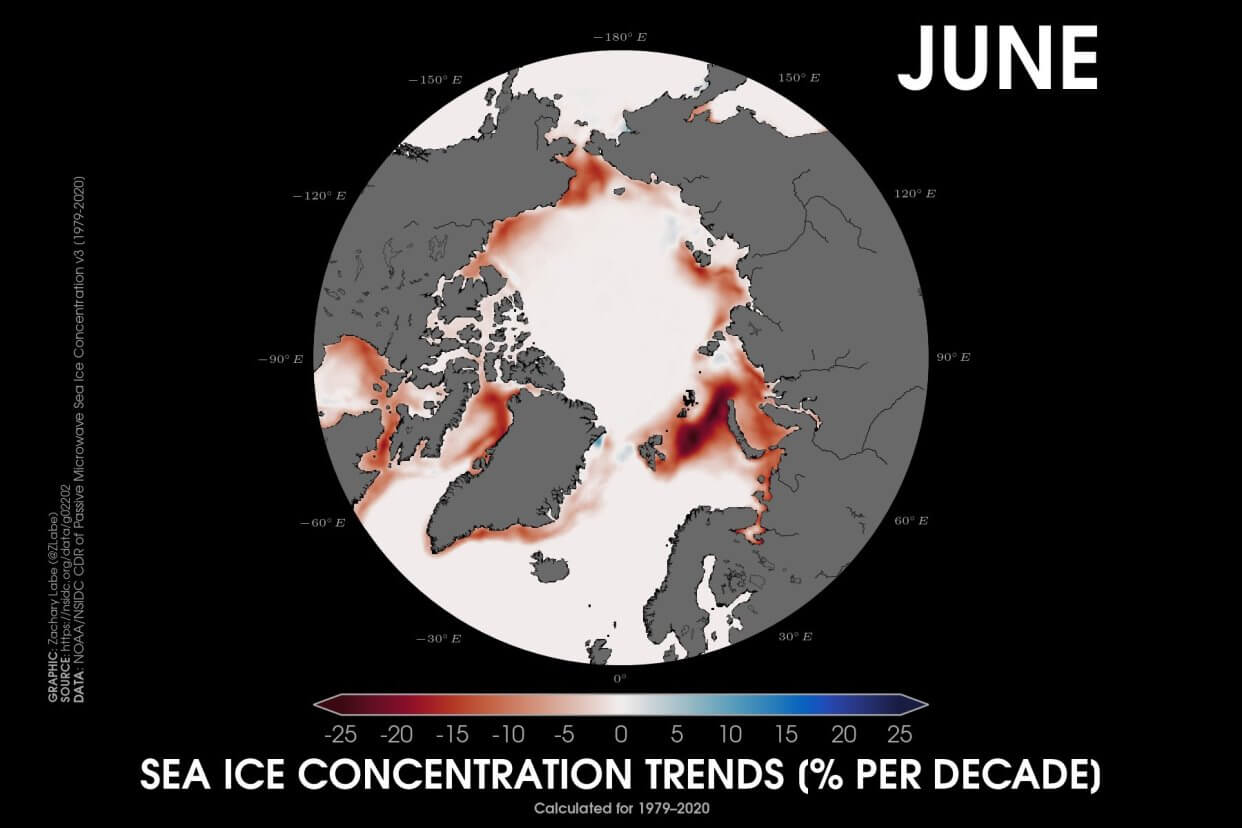
Overall, the June trends for sea ice concentration are not very promising, with major reductions all around the icecap edges. The strongest sea ice reduction trend is seen in the Kara Sea, followed by most of the other icecap edges.
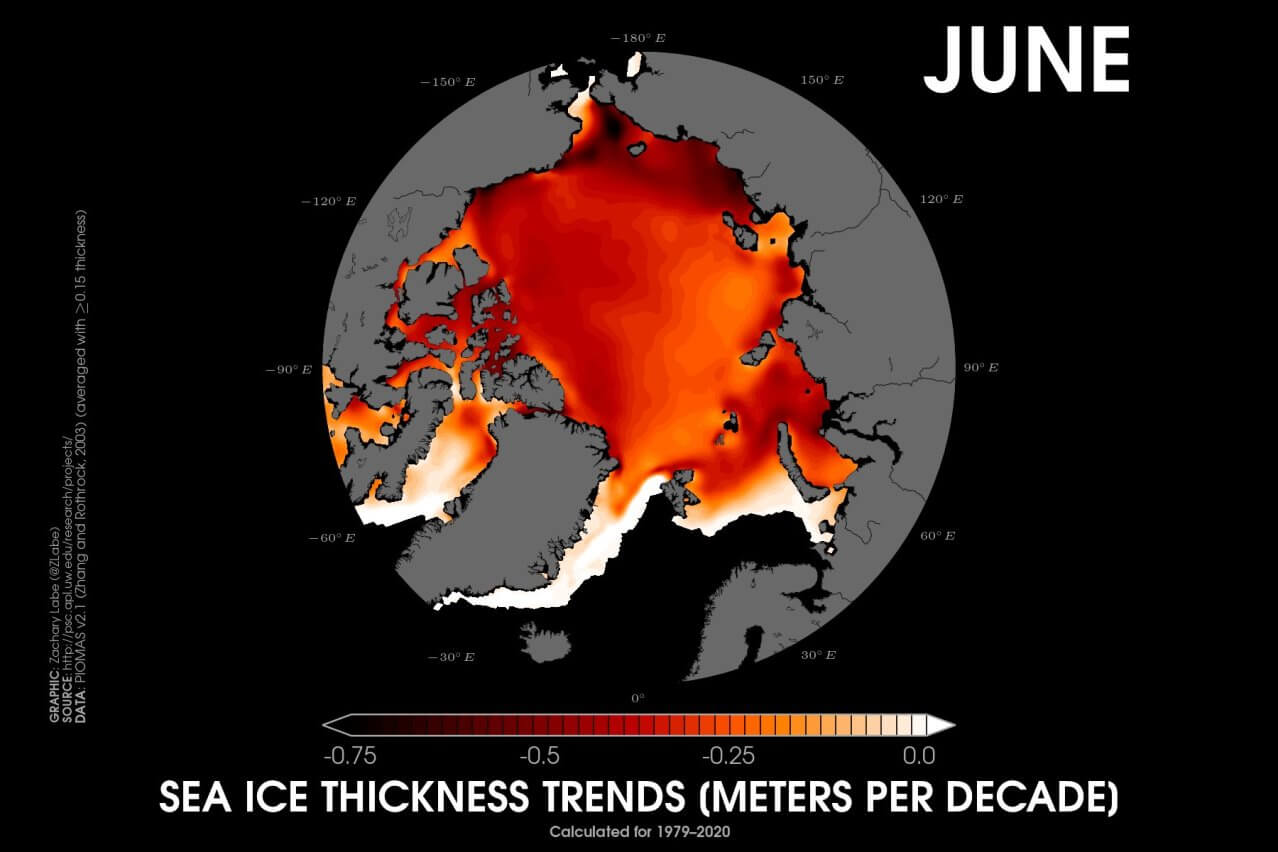
The June thickness trend is also showing a major reduction over the entire icecap. Unlike the concentrations, the strongest thickness reduction in June is found around eastern Siberia and the Chukchi sea.
SEA ICE VOLUME
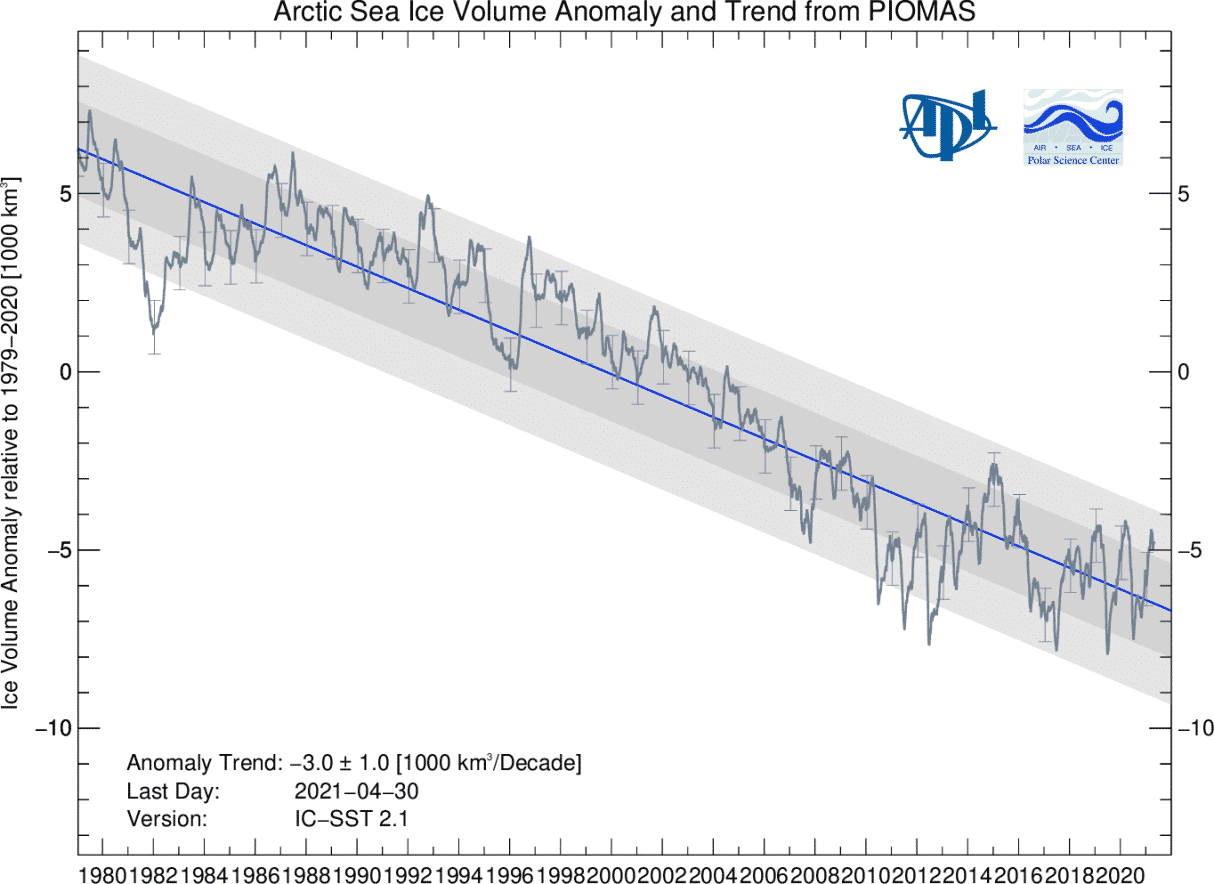
During winter 2020/2021, the Arctic sea ice volume was running below normal, continuing from the low volume in autumn. It reached a peak in April but is currently starting a rather rapid decline since late May.

Looking at the past 40 years, we can see an obvious negative trend in the Arctic sea ice volume. The sea ice volume is decreasing quite rapidly, but if we look at the last 10 years, there is perhaps a slower decline than in the early 2000s. In the end, it is perhaps the long-term trend that matters, and it is on a stable decline, corresponding to the rise in temperatures, especially over the polar regions.
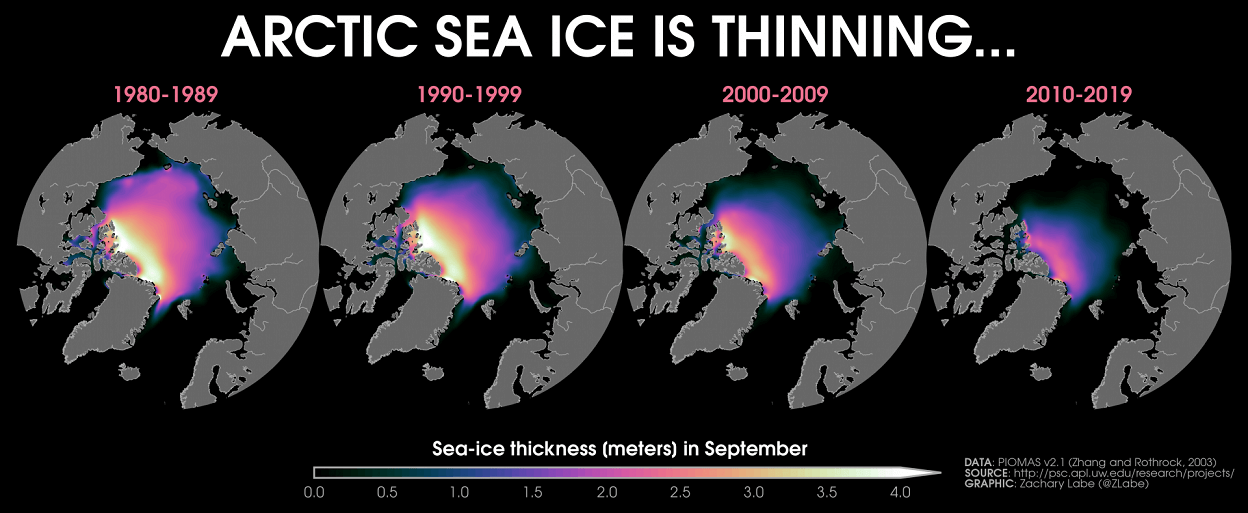
Sea ice volume reduction of course means that there is less sea ice, not just by area, but also by thickness. Below we have an image, which shows the average sea ice thickness in September. September is the peak of the melt season, so we tend to focus on this month. You can see a very obvious reduction in sea ice thickness, especially in the last decade, where the icecap no longer touches the Asian side.
2021 ARCTIC SEA ICE FORECAST
We all want to know how low will the sea ice extent drop during the 2021 Arctic ice melt season. Below you can see the late summer/early autumn temperature anomaly forecast from the CFSv2 model. Most of the Arctic regions are well above normal temperatures. Such temperature distributions can strongly boost the Arctic Sea Ice melt season.
Looking at the actual Arctic sea ice extent forecast, it is quite shocking to see. The model predicts the peak of the melt season with well below 4 million square kilometers total extent, nearing 2 million square kilometers. This would be an ultimate record, not far away from the “Blue Ocean event“.
 A blue ocean event would be declared if the Arctic sea ice extent ever reached just 1 million km² or less. It practically means an almost ice-free Arctic ocean, hence the name “blue ocean event”.
But the CFSv2 model is not known for its accuracy. It tends to show a lower sea ice extent than it actually ends up being. Despite its reputation, this is one of the lowest sea ice extents ever forecasted in June.
And below is the actual forecast of the Arctic sea ice concentration in September. We tend to focus on September, as it is the month when the sea ice area is at its lowest point. This forecast shows a very small sea ice area, which would be a certain record.
The lowest value so far was reached in September 2012, at just 3.4 million square kilometers. The second lowest Arctic sea ice extent was reached last year, at around 3.8 million square kilometers.
Below we have a map which shows the lowest sea ice extent in the modern records, reached in mid-September 2012. This is still larger than the current September 2021 extent forecast above from CFSv2.

ANTARCTIC SEA ICE MELT SEASON
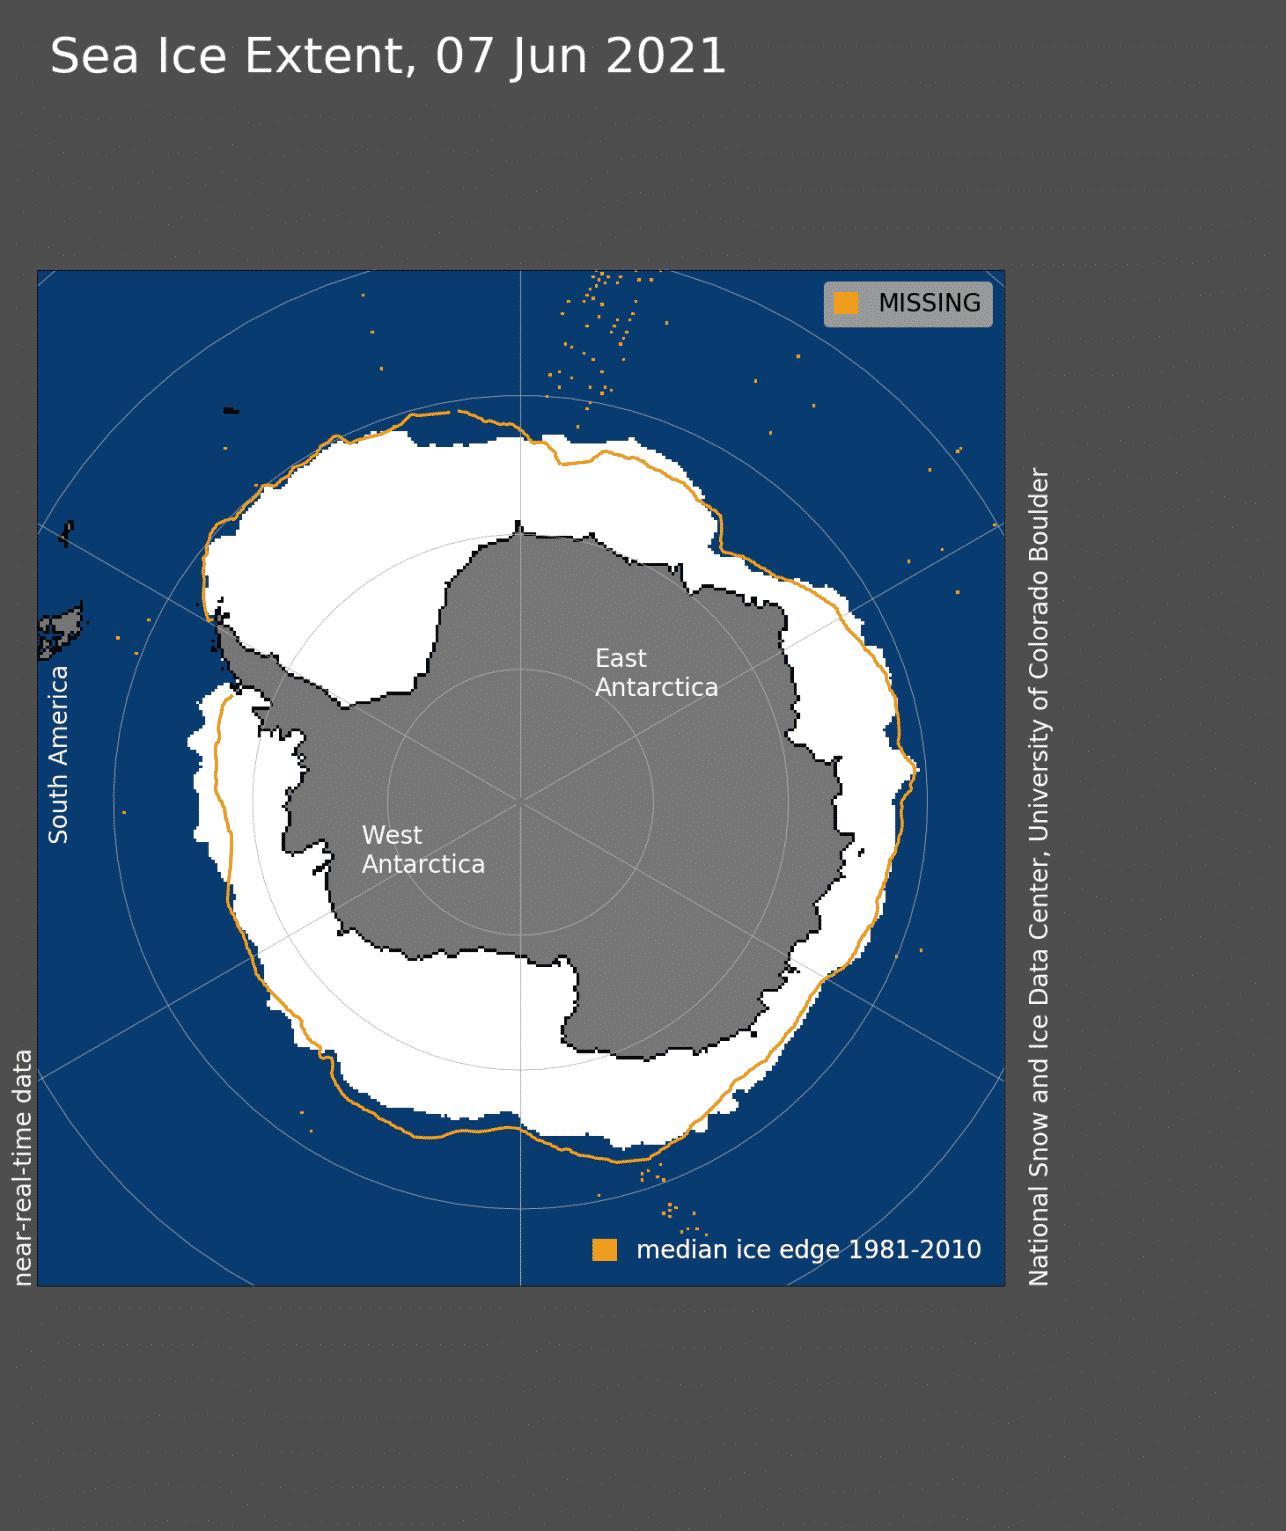
Looking at the actual extent analysis, we can see that most areas show a larger sea ice extent than the long-term average (orange line), except for some western regions.
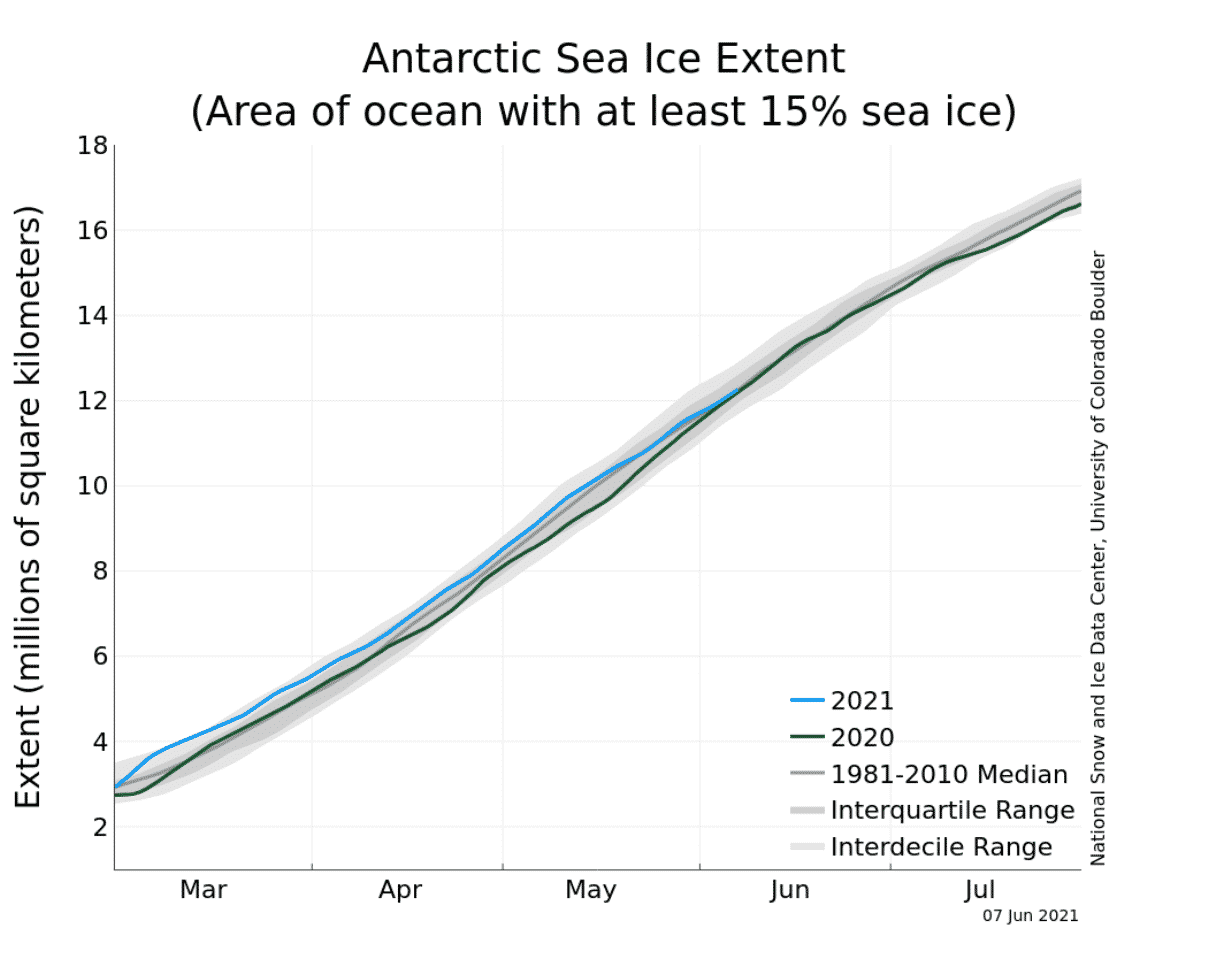
The line graph extent analysis reveals the rapid ocean freezing in early March. At that time, it lifted the sea ice extent to above normal values, which remained steady into May. In the past days, the sea ice extent around the Antarctic has come down to near-normal levels and similar to those last year.
Looking at the May 2021 conditions around the Antarctic, you can see that most of the outer edges were running above normal sea ice extent (blue anomaly) with some regions being below normal (red anomaly).

We will keep you updated on the global ice and ocean conditions, so make sure to bookmark our page. Also, if you have seen this article in the Google App (Discover) feed, click the like (♥) button to see more of our forecasts and our latest articles on weather and nature in general.
SEE ALSO: